DEPARTMENT OF ECONOMICS Working Paper The Calorie Consumption Puzzle in India: An Empirical Investigation By Deepanker Basu Amit Basole Working Paper 2012‐07 UNIVERSITY OF MASSACHUSETTS AMHERST
The Calorie Consumption Puzzle in India: An EmpiricalInvestigation
Deepankar Basu∗ Amit Basole†
July 12, 2012
Abstract
Over the past four decades, India has witnessed a paradoxical trend: average per capita calorieintake has declined even as real per capita monthly expenditure has increased over time. Sincecross sectional evidence suggests a robust positive relationship between the two variables, thetrend emerges as a major puzzle. The main explanations that have been offered in the literatureto address the puzzle are: rural impoverishment, relative price changes, decline in calorieneeds, diversification of diets, a squeeze on the food budget due to rising expenditures on non-food essentials, and decline in subsistence consumption (due to commercialization). Usinga panel data set of 28 Indian states and the national capital territory of Delhi over four timeperiods (1993–94, 1999–00, 2004–05 and 2009–10), we test for these alternative explanations.Our results suggest that the puzzle can be explained by a combination of the following threefactors: a food budget squeeze, declining subsistence consumption and diversification of diets.We do not find evidence of a strong effect of declining calorie needs.JEL Classification: O1; I130.Keywords: calorie consumption puzzle, India, panel data.
1 Introduction
One of the most enduring puzzles related to economic development in India over the past few
decades is what Chandrasekhar and Ghosh (2003) have called the calorie consumption puzzle.∗Department of Economics, University of Massachusetts, 1012 Thompson Hall, Amherst, MA 01003, email:
Many of the issues dealt with in this paper have arisen from discussions with Debarshi Das, Ashok Prasad, T.V.H.Prathamesh, and Shiv Sethi. During the writing of the paper, we have also benefited from comments by Jim Boyceand Vamsi Vakulabharanam. The usual disclaimers apply.
1
Average calorie intake has declined over time in India even as real consumption expenditures (and
by most measures real per capita incomes) have increased. Since cross sectional evidence shows
a robust positive relationship between per capita income and calorie intake, the time series pattern
in India clearly presents a puzzle. Moreover, the puzzle has been around for a long time. Data
collected from the large scale, nationally representative consumption expenditure surveys (CES)
conducted roughly every five years by the National Sample Survey Organization (NSSO), the so-
called “thick rounds”, show that this trend starts in 1972–73 (NSSO, 1996c).
Deaton and Dreze (2009) provide a comprehensive analysis of the facts pertaining to and pos-
sible interpretations of this puzzle with data running from 1983 (the 38th round of the NSS) to
2004-05 (the 61st round of the NSS). They find that estimated average calorie intake in rural areas
declined by about 10 percent over the two decade period between 1983 and 2004, the decline being
higher at the upper end of the expenditure distribution. Urban areas witnessed a milder decline in
estimated average calorie intake. Real average monthly per capita expenditure (MPCE) increased
substantially (about 22 percent in rural areas in India) over the same period.
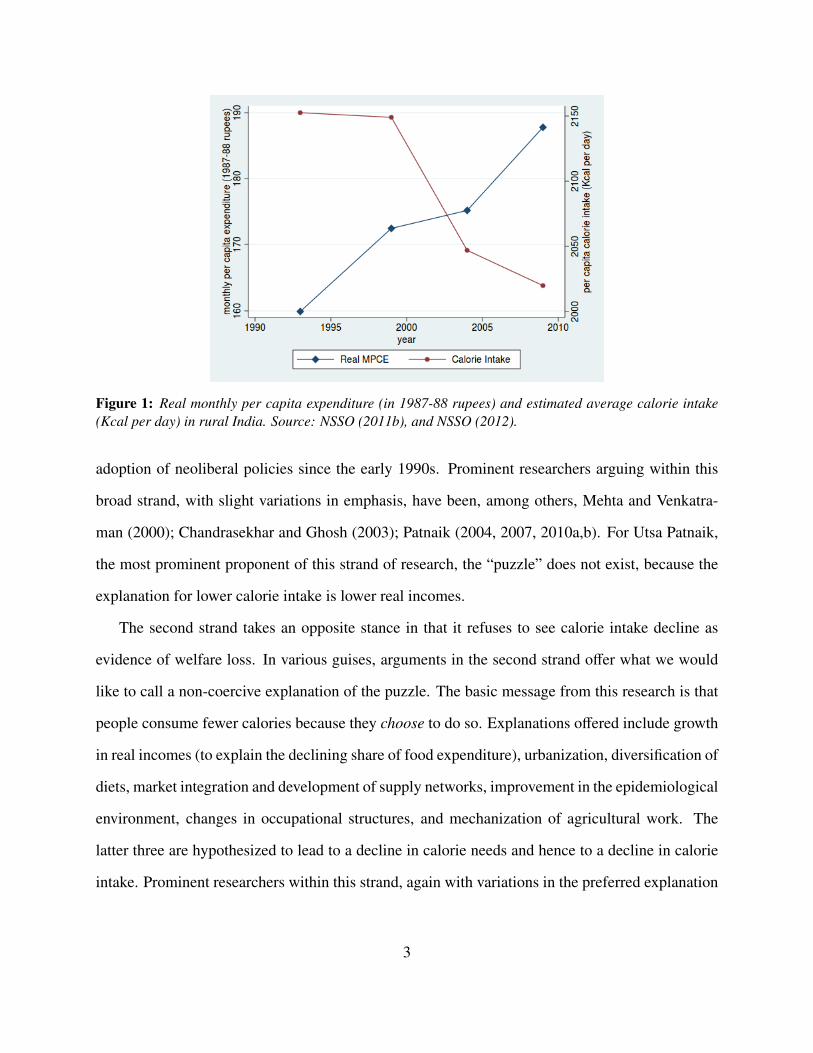
When we extend the analysis to the 2009–10 (the 66th round of the NSS), we see that the same
trend continues. For instance, for the decade and a half period between 1993–94 and 2009–10,
estimated average calorie intake in rural India declined by about 6 percent. During this period,
on the other hand, real average MPCE increased by 17 percent in rural areas. Thus, this opposite
trend movement in calorie intake and real MPCE highlighted in Figure 1 indicates that the calorie
consumption puzzle endures: as people become richer, they consume less calories.
How should we approach this puzzle? The large and growing body of literature that has
emerged around this puzzle can be divided into two broad strands. The first strand views the
phenomenon of declining calorie intake as the result of the operation of some coercive factors,
which do not allow households to consume the preferred number of calories. The coercive factor
that comes up most often as a possible candidate, and which leads to welfare loss of the pop-
ulation, is the absolute impoverishment of vast sections of the rural population caused by the
2
Figure 1: Real monthly per capita expenditure (in 1987-88 rupees) and estimated average calorie intake(Kcal per day) in rural India. Source: NSSO (2011b), and NSSO (2012).
adoption of neoliberal policies since the early 1990s. Prominent researchers arguing within this
broad strand, with slight variations in emphasis, have been, among others, Mehta and Venkatra-
man (2000); Chandrasekhar and Ghosh (2003); Patnaik (2004, 2007, 2010a,b). For Utsa Patnaik,
the most prominent proponent of this strand of research, the “puzzle” does not exist, because the
explanation for lower calorie intake is lower real incomes.
The second strand takes an opposite stance in that it refuses to see calorie intake decline as
evidence of welfare loss. In various guises, arguments in the second strand offer what we would
like to call a non-coercive explanation of the puzzle. The basic message from this research is that
people consume fewer calories because they choose to do so. Explanations offered include growth
in real incomes (to explain the declining share of food expenditure), urbanization, diversification of
diets, market integration and development of supply networks, improvement in the epidemiological
environment, changes in occupational structures, and mechanization of agricultural work. The
latter three are hypothesized to lead to a decline in calorie needs and hence to a decline in calorie
intake. Prominent researchers within this strand, again with variations in the preferred explanation
3
adopted, have been, among others, Rao (2000); Mittal (2007); Deaton and Dreze (2009); Li and
Eli (2010).1
In this paper, we offer a third line of explanation of the calorie consumption puzzle that signif-
icantly extends and amends the argument in Mehta and Venkatraman (2000) and Sen (2005). Our
explanation can be seen as a member of the class of coercive explanations of the puzzle, in that we
believe important coercive factors to be in operation behind the observed phenomenon of calorie
intake decline. However, we differ from the dominant view of the coercive explanation because
we do not believe that stagnant or declining incomes lie behind reduced calorie intake. Instead,
the coercive mechanism that we offer as an explanation of the calorie consumption puzzle operates
primarily through a combination of a food budget squeeze and declining home-grown consumption
(with diversification of diets contributing weakly). The food budget squeeze arises due to gallop-
ing expenses on non-food essentials like health care, education, transportation and other essential
services. This absorbs all the increases in household incomes and keeps real expenditures on food
from rising, which, in combination with a decline in home-grown food and diversification of diets,
leads to a fall in calorie intake. The food budget squeeze has, in our opinion, an important coercive
component driven by the neoliberal retreat of the State. Hence, without ruling out the role of vol-
untary factors, we see the calorie intake decline primarily as evidence of large scale welfare loss
arising from the operation of coercive factors.
In this paper we use a panel dataset to empirically investigate the relationship between ex-
penditures on non-food essentials (a proxy for the operation of food budget squeeze), share of
home-grown production and calorie intake over time taking advantage of inter-State variation in
these (and other relevant) variables. Our panel consists of data on rural areas of 28 Indian states
and the National Capital Territory (NCT) of Delhi with data from the recent four “thick” rounds of
the NSS: 1993–1994 (50th round), 1999–2000 (55th round), 2004–2005 (61st round) and 2009–1Some researchers like Gaiha et al. (2010) emphasize the importance of price changes in driving the puzzle, which
is a coercive explanation, but also find evidence in support of the declining calorie needs thesis, which is a noncoerciveexplanation. Hence, they offer an explanation that combines both coercive and non-coercive factors.
4
2010 (66th round). The choice of rural India is motivated by several facts. First, according to the
provisional population data from the 2011 Census, about 69 percent of Indians lived in rural areas
in 2011. Thus, the majority of the Indian population lives in rural areas even today. Second, there
is widespread consensus that poverty and deprivation is more acute in rural areas. Lastly, a key
non-coercive explanation for the puzzle is the reduction in share of rural population engaged in
hard agricultural labour. Hence, focusing on rural India for investigating the calorie consumption
puzzle seems natural. We choose the latest 4 thick rounds of the NSS because this decade and a
half period provides us with a long enough time span to investigate the calorie intake puzzle while
restricting ourselves to data that can be extracted from published reports available in the public
domain (on the website of the Ministry of Statistics and Programme Implementation, Government
of India).2
Using both fixed effects and random effects estimation, we find a robust significant negative
effect of the share of non-food expenditures on calorie intake; we interpret this as evidence in
favour of the food budget squeeze hypothesis. In quantitative terms, we find that a 1% increase
in the share of monthly expenditure on non-food essentials is associated with a 1% decline in
calorie intake after controlling for changes in real expenditures, calorie needs, and diversification
of diets. We also find: (a) a statistically significant positive relationship between the quantity of
home-produced cereal (rice and wheat) consumption and calorie intake, and (b) a negative but
statistically weak effect of diversification on calorie intake. We do not find any evidence in favour
of the “declining calorie need” hypothesis. Bringing together these results, we conclude that a
combination of food budget squeeze, declining home-grown consumption and diversification of
diets can explain the calorie consumption puzzle.
The rest of the paper is organized as follows. Section 2 presents a brief summary of the two
main strands of explanations, coercive and non-coercive, that have so far been offered in the lit-
erature about the calorie consumption puzzle. Section 3 investigates the possible determinants of
2See http://mospi.nic.in/Mospi New/site/home.aspx
5
calorie consumption; this leads to the empirical model of the paper. The empirical model and data
is discussed in section 4. Section 5 contains the main results of the paper. Section 6 concludes the
discussion with some ideas for future research.
2 Alternative Explanations
2.1 Coercive Explanation via Rural Impoverishment
An extremely influential explanation for the calorie consumption puzzle has been put forward by
Patnaik (2004, 2007, 2010a,b). This explanation rests on the claim that the observed fall in calorie
intake is driven by impoverishment, i.e., decline in real income and expenditure, of a majority
of the population. Adoption of neoliberal policies, the argument goes, has led to declining real
incomes of the vast majority of the masses, especially in rural India. The decline in average calorie
intake is a direct outcome of such impoverishment. Thus,
. . . there is no puzzle of declining per capita calorie intake with consistently rising
per capita “real spending” since such behaviour does not exist in reality: applying
reasonable alternative deflators shows decline in real spending, which turns out to be
particularly large in the economic reforms decade.” (Patnaik, 2010a).
In an earlier contribution on neoliberalism and rural poverty in India Patnaik (2007) had made
the same argument while discussing the decline in foodgrain absorption (and by implication calorie
intake) in India:
This steep fall in foodgrains availability per head ... is a highly abnormal trend which is
not expected when per capita income is rising . . . The steep fall in per capita absorption
in India is consistent only with worsening income distribution of a particular type, an
absolute decline in incomes and purchasing power for a major part of the population,
6
outweighing rise for the minority with fast rising incomes.(Patnaik, 2007, emphasis
added)
In the backdrop of widespread agrarian distress during the neoliberal period, as seen by the
alarming numbers of farm suicides and high levels of indebtedness, this explanation seems fairly
intuitive. But all existing evidence that has a bearing on rural impoverishment points in the opposite
direction.
The first piece of evidence we look at is the trend movement of real MPCE in rural areas of
the country. As we have already noted, average real MPCE (measured in 1987-88 prices) in rural
India increased by 17.45 percent between 1993–94 and 2009–10, which is exactly opposite of what
one would observe in the case of massive rural impoverishment. Since increases in average real
MPCE might mask declines at the bottom of the expenditure spectrum, we need to look at more
disaggregated figures. When we look at the bottom decile of the expenditure distribution in rural
India, we find an increase in real MPCE by about 12.36 percent over the same period: for the
bottom decile, real MPCE (measured in 1987-88 prices) increased from 67.93 to 76.33 between
1993–94 and 2009–10.3 Thus, even while the level of real MPCE remains abysmally low, there
does seem to be modest growth in real expenditures at the very bottom of the rural income scale,
militating against the claim of absolute impoverishment, understood as a fall in real incomes and
expenditures, in rural India.
Supporters of the immiserization hypothesis sometimes point to the inability of price indexes
such as the CPI-AL to adequately account for change in food prices. The claim is thus that even
though real expenditures appear to rise, in fact the same number of rupees are able to purchase less
food due to an increase in food prices faster than the general rate of inflation. Two arguments can
be made against this view. First, Deaton and Dreze (2009) and Balakrishnan (2010) show that the
3Nominal MPCE for the bottom decile in 2009–10 is from NSSO (2011b, page A-720). Nominal MPCE for thebottom decile in 1993–94 has been computed as the weighted average of the MPCE for the bottom two MPCE classes(less than Rs. 120, and Rs. 120–140) in NSSO (1996b, page A-231) because Table 10 in NSSO (1996a) reports thelowest decile of the MPCE distribution in 1993–94 as Rs. 140. Real MPCE is obtained by deflating nominal MPCEby the CPIAL from Table T6 in NSSO (2011b).
7
relative price of food shows no clear trend in this period despite wide fluctuations. Second, NSS
data on average calorie intake disaggregated by expenditure classes in rural India show that while
calorie intake has declined for the top quartile between 1983 and 2009-10, it has increased for the
bottom decile in the same period (Figure 2, top panel). This evidence is difficult to square with the
thesis of widespread rural impoverishment.
The third piece of evidence that we can bring to bear against the impoverishment thesis is the
trends in real wages for agricultural and non-agricultural workers in rural India. Himanshu (2005)
and Eswaran et al. (2009) present data on real agricultural wages disaggregated by Indian states
for the period 1983 to 2004-05, which highlight significant spatial and temporal variation in the
level and growth of real agricultural wages. While Haryana, Orissa and Tamil Nadu witnessed
the fastest growth in weekly earnings, Assam, Gujarat, Punjab and West Bengal saw the slowest
growth between 1983 and 2004–05 (Eswaran et al., 2009). Over the whole period, average weekly
real agricultural wages in India increased by about 68 percent; average weekly wages increased
by about 74 percent. Using data from various Employment-Unemployment Surveys of the NSSO,
the bottom left panel of Figure 2 plots the average daily wage of agricultural labourers for the
country as a whole deflated by the CPIAL. The plot indicates that there is a steady increase in
real agricultural wages between 1993–94 and 2009–10. In terms of temporal variation, real wage
growth was substantially faster in the decade of the 1980s than in the later periods, as can be seen
from the bottom left panel in Figure 2; the same point is also emphasized by Himanshu (2005).
The bottom right panel in Figure 2 shows that wages of non-agricultural workers in rural areas have
also increased in real terms (i.e., expressed in 1987–88 prices) from 1999–00 to 2009–10. In sum,
the weight of the evidence suggests slow growth in real agricultural (and non-agricultural) wages
over the past three decades for all major states in India; no state shows decline in real agricultural
wages, and aggregate non-agricultural wages also increase over time in real terms.
To summarize the evidence regarding impoverishment in rural India: real MPCE (average for
all expenditure classes, and for the bottom decile in rural India) has increased slowly over time;
8
Figure 2: Top panel: Estimated average calorie intake (Kcal per day) of the bottom decile and the topquartile of expenditure classes in rural India. Source: Deaton and Dreze (2009), and NSSO (2012). BottomPanel: Average daily real wage of agricultural labourers and nonagricultural workers in 1987-88 prices.Source: NSSO (2011a).
average calorie intake has increased for the bottom decile and declined for the top quartile; there
is no systematic trend in food prices over the relevant period (1983 to 2010) and real wages of
agricultural (and non-agricultural) workers in rural India have increased slowly over time. Thus,
without disputing the reality of agrarian distress during the neoliberal period, as highlighted by the
continuing spate of farmer suicides, we believe that absolute immiserization of the vast majority
of the rural population cannot be an explanation for the calorie consumption puzzle.
2.2 Non-coercive Explanations
The two main lines of research within the strand of non-coercive explanations emphasize, in turn,
a decline in calorie needs (Deaton and Dreze, 2009) and diversification of diets (Rao, 2000; Mittal,
2007). Researchers emphasize one or the other, or even offer explanations drawing on both. The
recent study by Deaton and Dreze (2009) is especially useful because it provides a comprehensive
account of the whole debate. After a careful analysis of the empirical evidence related to all the
9
major factors that have been offered in the literature, Deaton and Dreze (2009) tentatively accept
declines in required calories as the most plausible explanation. They note that decline in the need
for calories can arise due to changes in occupational structure (the main factor being the movement
of substantial parts of the the workforce away from agricultural work), mechanization of agricul-
tural work, improvement in the epidemiological environment (e.g., access to better drinking water
and health care), decline in fertility, and labour saving technical change within the households
(e.g., increasing use of consumer durables).
The fact that declines in calorie needs could be driving the declines in estimated calorie intakes
is plausible but the evidence presented in support of this explanation by Deaton and Dreze (2009)
is merely suggestive. It is true that there has been a shift of the workforce away from agricul-
ture, increasing mechanization of agricultural work, adoption of labour saving technologies within
households, improvements in the epidemiological environment, and changes in transportation pat-
terns. All these can lead to a decline in calorie needs. But it is not clear that the decline in calorie
needs will also lead to decline in average calorie intakes, especially for the lower expenditure
deciles where calorie intakes are still very low. What prevents people from consuming calories in
excess of their “needs”?
Three other factors mentioned by Deaton and Dreze (2009) appear to us to be potentially sig-
nificant in explaining the puzzle. First, the rising importance of non-food expenditures in rural
and urban budgets is likely to squeeze the food budget (Sen, 2005). Almost the entire increase in
real MPCE in the past two decades has taken the form of increased spending on education, health,
transportation etc., while food budgets have remained stagnant in real terms (Deaton and Dreze,
2009).4
4As Sen (2005) notes: “What is much more likely is that the cost of meeting the minimum non-food requirementshas increased to such an extent that the earlier proportion of expenditures no longer suffices and a larger proportionhas to be applied to meet the requirements, thereby leading to a decrease in the income left available for food. In otherwords, non-food items have become more “essential” than food in a particular sense... The observed behaviour seemsto suggest that people are treating food as the residual item of consumption. There are at least two items of non-foodexpenditure- rent and health care- which may take precedence over food as claims on income, and it has been observedthat these are the fastest growing components of household expenditure in urban and rural areas respectively.”
10
Second, increasing penetration of the market in rural areas is likely to reduce the proportion
of food consumed out of home production. The reduced home-produced calories may not be sub-
stituted by market-purchased calories if changing tastes and the food budget squeeze result in in-
creased preference for non-food expenditures. Additionally, declining average size of owned land
and an increasingly footloose labour force would also put downward pressures on home production
of foodgrains. Deaton and Dreze (2009) do mention the possibility of declines in consumption out
of home production but fear that lack of data makes this issue difficult to address.
Third, a slow but steady diversification of diets, in both rural and urban India, has been noted
by several scholars (Rao, 2000; Mittal, 2007). In the face of stagnant real food expenditures, di-
versification can be potentially important in accounting for calorie intake declines. This is because
diversification of diets imply the substitution of cheaper with more expensive sources of calories,
e.g., rice and wheat with vegetables, nuts and fruits.
Drawing on this discussion, in the next section, we investigate the determinants of calorie
intake for the average rural household. In the subsequent section, we use our investigation of the
determinants of calorie intake to construct an empirical model and use a panel data set to estimate
its key parameters. The estimated parameters, both their magnitudes and signs, offer us some clue
about a possible solution to the calorie consumption puzzle.
3 Determinants of Calorie Consumption
In a developing country context like India, there are two sources of calorie intake: (a) food pur-
chased in the market, and (b) non-market access to food (home grown, accessed from common
property resources, etc.). The calorie intake from purchased food depends on the total real expen-
diture on food and how it is divided between various food items. In the context of a poor country
facing calorie deficits, it is useful to distinguish between two types of food items, cereals and non-
cereals, because the former are a cheaper source of calories and have traditionally been the largest
11
part of the food basket of poor households. Thus, denoting by C the total calorie consumption, we
have
C = f (E f
p f,wc,NM f ) (1)
where E f refers to the total expenditure on food, p f refers to an index of food prices, wc denotes the
share of food expenditure devoted to cereals, and NM f refers to non-market food that is available
to the household.
The total expenditure on food depends on the share of expenditure devoted to non-food items
and the total expenditure of the household. The share of expenditure devoted to non-food items,
in turn, depends crucially on what we might term expenditure on non-food essentials and calo-
rie needs of the household. Non-food essentials include expenditure on education of children,
expenses involved in health care, transportation and other essential services that are necessary to
sustain a decent modern life. Calorie needs of a household, on the other hand, depends on the
occupational pattern, i.e., whether the family is involved in agricultural work, the epidemiological
environment, induction of labour-saving technologies within the household, and other such factors.
Thus
E f = h(wn f e, E,CN) (2)
where wn f e refers to the share of total expenditure devoted to non-food essentials, E refers to the
total expenditure of the household, and CN refers to the calorie needs of the household.
Incorporating (2) into (1), we get
C = f (wn f e,Ep f,CN,wc,NM f ) (3)
implying that five sets of factors are the proximate determinants of calorie consumption by house-
12
holds in rural India: the share of total expenditure devoted to non-food essentials (wn f e), the level
of calorie needs (CN), the total expenditure deflated by the food price index (E/p f ), the share of
food expenditure devoted to cereals (wc), and the access to non-market sources of food (NM f ).
The first factor on the RHS of (3), the share of expenditure devoted to non-food essentials
relates to the phenomenon of “food budget squeeze”. We feel that this is an especially important
variable that has so far not received much attention in analyses of the calorie consumption puzzle.
It should be noted, as we have already indicated, that the expenditure incurred on education, health
care and transportation, can be categorized as non-food essential expenses in the sense that they
are necessary for a decent modern life. Thus, when the share of total expenditure devoted to such
non-food essentials increase, it leaves less purchasing power for food consumption.
The food budget squeeze is likely to be a function of several factors such as relative price
movements, changes in real incomes, changes in tastes and preferences, and public provisioning
of social services. Pressures squeezing the food budget from the demand side would include the
increasing importance given to education by the poor who know full well that this is the most
important route for upward social mobility. Additionally, demand for better and/or more formal-
institutional health care like childbirth in hospitals or allopathic medicines would also increase the
pressure on household budgets. Moreover, with the inability of the agricultural sector to generate
stable incomes, peasants are forced to join the huge circuit of internal migration of labour in India.
This increases transportation expenditures and puts additional pressure on household budgets. On
the supply side, the most important factor seems to be the gradual retreat of the State from the
public provisioning of education, health care, subsidized housing and transportation, and other
social services. With the State provisioning of these non-food essentials declining at the same time
as the demand for these same services increase from households, an increasingly larger share of
the household budget is claimed by them. If this effect is big enough, it might lead to a food budget
squeeze and lead to lower calorie intake by households.
Figure 3 juxtaposes time series plots of the share of total expenditure devoted to education,
13
Figure 3: Share of Monthly expenditure devoted to nonfood essentials (percentage) like education, health-care, transportation, and estimated average calorie intake (Kcal per day) in rural India. Source: NSSO(2006), and NSSO (2011b).
health care (both institutional and noninstitutional), conveyance and other consumer services, and
per capita calorie consumption between 1993–94 and 2009–10. It is obvious from Figure 3 that
at the aggregate level, per capita calorie intake and the share of expenditure devoted to non-food
essentials display exactly opposite movements over time: as the share of MPCE devoted to such
non-food essentials has increased over time, per capita calorie intake has declined.
It seems that all the income increases have been absorbed by expenditure on non-food essen-
tials, so that food expenditures have not increased in real terms over the last two decades. This
can be seen from data available in NSSO (2011b). The value of food expenditure deflated by the
CPIAL (with 1987–88 as base year) was 101.18 and 101.05 in 1986–87 and 1993–94 respectively.
In 2009–10, the corresponding figure was 100.66 (again, in 1987–88 rupees). Thus, it is striking
that real food expenditure did not increase over the past two decades, and in fact declined slightly
over the last 15 years, for the average rural Indian household.
These two pieces of evidence make, to our mind, a prima facie case for the hypothesis that
perverse developments in the economy and polity are creating a squeeze of the food budget, which
14
might be forcing families into lower calorie intakes. One of the main aims of this paper is to test
for the presence of this effect in Indian data after controlling for other relevant effects.
The next variable on the RHS of (3) is CN, the calorie needs of the population. This is poten-
tially an important variable, as argued by Deaton and Dreze (2009), and could be driven by several
factors. First, it is a well known fact that, on average, agricultural work is far more physically de-
manding than non-agricultural work. Thus, as a larger share of the Indian workforce moves from
agriculture to industry and services, the average calorie needs of the population might decline. Sec-
ond, as the epidemiological environment of the country improves, the calorie absorption capacity
of the population would increase. This might reduce the average calorie consumption needs of the
population because a larger share of whatever is consumed can now be retained. Third, mechaniza-
tion of key parts of agricultural work (like threshing), adoption of labour-saving durables within
households, mechanization of transportation (i.e., switch from walking to using bicycles, from
bicycles to motorcycles, and so on), and decline in the total fertility rates might also reduce the
average calorie intake needs of the population. In our empirical analysis, we will use two variables
to capture the calorie needs of the population at the state level: the share of the workforce that is
in the agricultural sector, and the percentage of households that have access to safe drinking water,
i.e., water coming from a tap, a tube well or a hand pump.
The next variable on the RHS of (3) is the food price-deflated total nominal expenditure (E/p f ).
Instead of using the food price-deflated total nominal expenditure, we will use the price-deflated
total nominal expenditure, i.e., the real total expenditure. This is motivated by the fact that aggre-
gate level data on the relative price of food, i.e., the ratio of a food price index to a general price
index, does not display any long term trend. The ratio of the wholesale price index for food to
index for all commodities remains trendless, though with large fluctuations, between 1993-94 and
2008-09 (Balakrishnan, 2010, pp. 180). Similarly, the ratio of the food to the nonfood component
of the consumer price index for agricultural labourers (CPIAL) does not display any trend between
1983 and 2004-05 (Deaton and Dreze, 2009). The ratio of the food to the general price index for
15
industrial workers, a proxy for the analogous quantity for agricultural workers, starts moving up-
wards only from 2008–09 (GOI, 2012, Table 5.3, Statistical Appendix). Thus, even if the relative
price of food might have increased after 2008 due to the spike in food prices in recent years, it
seems unlikely that changes in relative prices would be important in explaining the calorie con-
sumption puzzle, which is clearly a long term phenomenon. Since E/p f = (E/p) ∗ (p/p f ), where
p refers to a price index, and the ratio p/p f has not displayed any long term trend, we feel we are
justified in using (E/p) as a proxy for (E/p f ).
The penultimate variable on the RHS of (3) is the share of the food budget that is devoted to
cereals, wc. We use this as a measure of the diversification of food consumption of households. It
depends on both price and nonprice factors, the former being the relative price of cereals to non-
cereals, and the latter the preferences of households for a diversified diet at all relative price levels.
For the purposes of the analysis in this paper, we do not need to distinguish between the different
determinants of diversification; we will treat it as a variable in itself.
Figure 4 presents a picture of diversification seen in the food budget of the average rural house-
hold in India over the past four decades. Even though the analysis in this paper is restricted to
the period since 1993–94, Figure 4 drives home the point that rural India has indeed witnessed
substantial diversification of the food budget over the last few decades. Thus it is important to
control for this trend towards increasing consumption of more expensive calories in the forms of
milk products, fruits, vegetables, and meat.
The last variables on the RHS of (3) is the total amount of food that a household can access
outside the market, most of which would come from home production. This variable is an ex-
tremely important one for a developing country like India where even today a large portion of the
consumption of poor households, especially in rural areas, is met from non-market sources. More
than 60 percent of milk, about 40 percent of wheat, 30 percent of rice, 11 to 18 percent of seven
common pulses, and 14 percent of eggs, and a large portion of common vegetables consumed in
rural India in 2004-05 came from home produce (NSSO, 2007). If structural transformation of
16
Figure 4: Expenditure on Various Categories of Food Items, Rural India. Source: NSSO (2011b).
the economy and commercialization forces households to seek a larger share of their consumption
needs through market transactions, perverse price and income dynamics might kick in to reduce
food/calorie intake. Since India has been undergoing a slow capitalist transformation over the last
few decades with increasing penetration of the market into rural areas, this factor is an important
one for throwing light on the calorie consumption puzzle.
Deaton and Dreze (2009) note the importance of decline in non-market sources of food but feel
that it is difficult to get an empirical handle on the effect.
... as the role of home-grown consumption has lessened, the effective price of food is
likely to have risen in a way that is not captured in the usual indexes and which may
help explain some of the decline in cereal consumption among the poor; the size of
this effect is hard to document with available data. (Deaton and Dreze, 2009).
In fact the NSSO does collect data on quantity of food consumed out of home production. Hence
the latter part of their assertion is only partly true. However, the published reports do not always
report this data in comparable terms; hence, some effort is need to come up with a measure that
can be compared across time. In this paper, we construct such a measure to capture the decline
17
of home-grown consumption. Data availability allow us to compute this measure for only two
time periods, 1993–94 and 2004–05, and only for 25 Indian states. We use this measure in the
regressions to capture the effect of changes in access to non-market sources of food on calorie
intake.
4 Empirical Analysis
4.1 Regression Model
The discussion in the previous section gives us the empirical model of this paper:
where i = 1, 2, 3, . . . , n indexes the states of India, t = 1, 2, . . . ,T indexes time periods, C denotes
estimated average calorie consumption, NFE refers to the share of total expenditure devoted to
non-food essentials, AG refers to the share of the workforce involved in agriculture, S W stands
for the proportion of households with access to safe drinking water, DV denotes the diversification
of the average diet, E refers to real (total) expenditure, NM measures the access to non-market
sources of food, and αi stands for a state-level time-invariant (or slowly changing) unobserved
heterogeneity, and γt is a time-period fixed effect. For the analysis in this paper, our sample consists
of 28 Indian states and the NCT of Delhi with observation on variables for each state recorded for
four time periods, 1993–94, 1999–00, 2004–05 and 2009–10 (except for Chhattisgarh, Jharkhand
and Uttarakhand which were created in 2000). Note that the measure of access to non-market
sources of food, NM, is available only for two time periods, 1993–94, and 2004–05; hence, results
with this variable in the regression will be presented for this restricted sample.
There is significant variation in average calorie consumption and its possible determinants
across states and over time, as we highlight in the next subsection. Therefore, our empirical
18
strategy exploits this variation by using a panel data set to test for the statistical significance of
the co-variation of average calorie intake with the proximate determinants discussed above. Our
main interest lies is testing whether there is support for the food budget squeeze effect even af-
ter we have controlled for the effects of other possible determinants like changing calorie needs,
changing dietary preferences, and changes in real expenditure.
The advantage of using a panel data set is that we will be able to control for unobserved state-
level and time-period fixed effects. These seem particularly important in this analysis because
slowly changing cultural, religious and geographical factors must certainly have an impact on
dietary habits across the states of India. Failure to control for such unobserved state-level effects
would give rise to biased and inconsistent empirical results.
4.2 Data
Data for the analysis in this paper has been collected from two main sources: (1) various reports
related to the CES of the NSSO, and (2) Census of India data available on the website of the
Registrar General of India.5
Data on estimated average calorie intake per capita per day was taken from Reports 405, 471,
513, and 540 of the NSSO. Each of these reports are entitled “Nutritional Intake in India” and
summarize information on the nutritional status of households using data from the 50th, 55th, 61st
and 66th rounds of the CES, respectively, of the NSSO.
Data on nominal monthly per capita expenditure, the share of total expenditure devoted to
non-food essentials (a measure of the food budget squeeze), and the share of food expenditure
devoted to cereals (a measure of diversification of diets) are from Reports 402, 457, 508, 538 of
the NSSO. Each of these reports are entitled “Level and Pattern of Consumption Expenditure in
India” and summarize information about various aspects of the consumption expenditure of Indian
households using data from the 50th, 55th, 61st and 66th NSS rounds. Data on the share of the
5See http://censusindia.gov.in/
19
workforce engaged in agriculture were taken from published NSSO reports on “Employment and
Unemployment Situation in India” for the relevant years.
Access to non-market sources of food was measured with the quantity of rice and wheat con-
sumed from home production. This data was compiled from NSS Reports 424 and 510. These re-
ports refer to the 1993–94 and 2004–05 consumption expenditure surveys, respectively. We could
not find comparable data in the published reports of the 1999–00 and 2009–10 surveys. Hence, the
measure of non-market access to food could only be constructed for two time periods and for 25
states.
Data on the access to safe drinking water for the years 1991, 2001 and 2011 were taken from
the three corresponding Census. Using the annual growth rates implied by this data for the Census
years, values for 1993–94, 1999–2000, 2004–05 and 2009–10 were imputed for each state using
simple exponential interpolation.
To recapitulate, the dependent variable in the model in (4) is defined as follows:
• calorie intake: estimated average per capita calorie intake (Kcal) per day;
and, the independent variables are defined as follows:
• real MPCE: monthly per capita expenditure deflated by the consumer price index for agri-
cultural labourers (CPIAL) with base 1987–88;6
• non-food essentials: share of total monthly expenditure devoted to education, health care,
transportation and other essential consumer services;
• agriculture’s share: share of workforce engaged in agriculture;
• safe drinking water: proportion of households with access to drinking water from tap, tube
well or hand pump;6Data for the CPIAL is taken from NSSO (2011b). The value of CPIAL in NSSO (2011b) uses 1987–88 as the
base year and does not provide figures for 1999–00. So, the value of the CPIAL for 1999–00 is constructed by inflatingthe CPIAL for 1993–94 by the growth rate of CPIAL from NSSO (2006), which uses 1972–73 as base year, between1993–94 and 1999-00.
20
• diversification of diets: share of food expenditure devoted to non-cereals;
• access to non-market sources of food (home-grown food): quantity of rice and wheat con-
sumption that comes from home production (this is available only for the years 1993–94 and
2004–05).
Table 1 presents summary statistics for these six variables for the rural areas of the 28 Indian
states and the NCT of Delhi in 1993–94, 1999–00, 2004–05 and 2009–10. Estimated average per
capita calorie intake declines from 2150 Kcal in 1993–94 to 2028 Kcal in 2009–10, a decline of
about 6 percent. Over the same period, real MPCE (in 1987–88 prices) increased from Rs. 186
to Rs. 221, an increase of about 19 percent. The share of total expenditure claimed by non-food
essentials increases secularly from 17.4 percent in 1993–94 to 24.5 percent in 2009–10. That is a
whopping 40 percent increase over a decade and half period.
The share of the workforce engaged in agriculture has declined from about 69 percent to 60
percent, not a very sharp fall given that we are looking at a rapidly growing economy over a 15
year period. The proportion of households with access to safe drinking water has increased from
55 percent to 72 percent, with lot of room for further improvement. Thus, both variables meant to
capture the calorie needs of the population indicate a movement in the direction of lower calorie
requirements.
The measure of diversification, the share of the food budget devoted to non-cereals, shows a
steady increase over this period from 63 percent in 1993-94 to 71 percent in 2009-10. Therefore,
the data do suggest a slow but steady diversification of the food budget of households in rural India.
The measure of access to non-market food (home grown consumption of rice and wheat) de-
creases slightly between 1993–94 and 2004–05. The median value declines from 2.65 kgs. to
2.32 kgs.7 Thus, in the median Indian state average consumption of home-grown rice and wheat
declines by about 0.3 kgs. over a decade long period since the early 1990s. This decline could be
7Details of the construction of this measure given in the Appendix.
21
Table 1: Summary Statistics for the Main Variables: Rural Indiaa
per capita per day); RMPCE: real monthly per capita expenditure (1987–88 rupees); NFE:non-food essential expenditure (% of MPCE); AGRISH: share of the workforce workingin agriculture (%); SW: access to safe drinking water (% of households); DIV:diversification of diets (% of food budget devoted to cereals); NM: access to non-marketsources of food (quantity of rice & wheat consumed from home production, kgs.)
22
the result of both loss of land for cultivation and shifting preference for cereals purchased in the
market. Without further investigation, we will not be able to distinguish between these two effects.
5 Main Results
Table 3 gives results from estimating the model in (4) with a panel data set for 28 Indian states
and the NCT of Delhi (rural areas) and 4 time periods, 1993-94, 1999-00, 2004-05 and 2009-
10. We carried out the regression analysis using different estimation strategies: pooled regression
estimated with OLS, fixed effects (FE) and random effects (RE) estimation for several different
specifications of the basic model in (4). In Tables 2 and 3, we report results from the FE and RE
State Fixed Effects Y Y Y Y YTime Fixed Effects N N N N YObservations 107 105 105 50 50Dependent variable is log calorie intake; t statistics in parentheses.∗ p < 0.1, ∗∗ p < 0.05, ∗∗∗ p < 0.01
23
Specification tests suggest that the fixed effect estimation strategy is superior to the pooled
regression (the F-test of the null hypothesis that all the state fixed effects are zero is strongly
rejected). This implies that controlling for the unobserved state-level heterogeneity is important.
Similarly, the Breusch-Pagan test of the random effects estimator against the pooled regression
presents evidence in favour of the former (not reported in Table 3). Both of these tests suggest
that the FE and RE estimations are preferable to the pooled regression estimation strategy. The
Hausman test (p = 0.195) supports the RE strategy over FE. But since the size of our sample,
especially when we include the variable for home-grown food, is relatively small and since our
intuitive understanding suggests that allowing the regressors to be correlated with the unobservable
heterogeneity might be a superior estimation strategy, we have chosen to report results from both
strategies. As we show later, except for minor changes in magnitude and level of significance, the
main results remain unaltered across estimation methods.
Turning to the results in Table 2 we see that across specifications, the value of the coefficient on
the share of expenditure on non-food essentials is close to -0.01, giving us the following interpreta-
tion: a 1 percentage point increase in the share of total expenditures devoted to non-food essentials
is associated with a 1 percent decline in average calorie intake. Moreover, this coefficient is sta-
tistically significant at the 1 percent level across specifications (other than the last specification in
which it is significant at the 5 percent level). In our opinion, this provides strong evidence in favour
of the food budget squeeze thesis.
Note that there is no a priori reason for the coefficient on the share of expenditure devoted to
non-food essentials to be negative in a regression like (4). In fact, for most countries in the world,
it can be expected to be positive. This is because, even thought growth in real per capita incomes is
accompanied by an increase in the share devoted to essential services like education, health care,
etc., this is seldom accompanied by a decline in calorie intake. Income growth and a fall in the
real price of food ensures that even a lower share of household expenditure devoted to food is
enough to secure an increasing (or at least constant) calorie intake. Therefore, when an increase
24
in the share of non-food essential expenditure leads to a decline in calorie intake, it is a perverse
outcome, one that we wish to denote as a “food budget squeeze”, with an emphasis on the term
“squeeze”. Since our results consistently show a negative and statistically significant coefficient
on non-food essentials, we can conclude that the “food budget squeeze” effect is indeed strong and
remains in operation even after we have controlled for real expenditure growth, diversification and
possible changes in calorie needs.
Our results show that it is not necessary to assume a decline in real rural expenditures (or
incomes) to explain the calorie intake decline. Even though rural expenditures have increased
during this period, they have not increased enough to accommodate both, the increased need for
spending on non-food essentials, as well as sustained nutritional intake. That is the essence of the
“food budget squeeze” argument that we have developed in this paper.
The coefficient on log real MPCE varies from 0.37 in the pooled regression to 0.44 in the FE
estimation indicating that the expenditure (or income) elasticity of calorie consumption is about
0.3-0.4. Thus, every 1 percent increase in real MPCE is associated with a 0.3-0.4 percent increase
in calorie intake, holding other relevant factors constant. This value is in accord with existing
results on this subject (Deaton and Dreze, 2009; Gaiha et al., 2010).
The coefficient on the measure of diversification of diets in all specifications is negative but
the statistical significance is weak. This suggests that diversification, measured by the share of
food expenditure devoted to non-cereals, does have a negative effect on average calorie intake
when other relevant factors (including total expenditure) are controlled for. This is exactly as one
would expect: if the total expenditure on food is more or less constant, then a switch towards more
expensive sources of calorie (non cereals) would lead to a decline in calorie intake. But, the effect
of diversification on calorie intake does not seem to be very strong in rural India over the past
decade and a half.
Moving to the variables that capture the effect of changes in calorie needs, we see that the
variables are either economically or statistically insignificant. The proportion of households with
25
access to safe drinking water is meant to capture the epidemiological environment across states.
Access to safe drinking water dramatically reduces the prevalence of gastrointestinal diseases.
The argument in Deaton and Dreze (2009) suggested that as the epidemiological environment
improves and the capacity of people to retain calories increase, this would reduce the calorie intake.
Our results suggest that it is in fact the opposite (the coefficient on this variable in 0.001 in all
specifications): as the epidemiological environment improves, it increases calorie intake. This
should not be very surprising. Deaton and Dreze (2009), in effect, argue that safe drinking water
and calorie intake (or food consumption) are substitutes. But if, for example, state provisioning
of safe drinking water and food security support go together, then safe drinking water and food
intake could be complements. Thus, there could be both positive and negative effects of drinking
water on calorie intake. What we find suggests that the positive effect is stronger than the negative
one. While the effect is statistically significant, it is economically very small: a 1 percentage point
increase in the share of households with access to safe drinking water increases average calorie
intake by only 0.1 percent.
The share of the workforce engaged in agriculture was meant to capture the effect of activity
levels on calorie needs and hence calorie intake. It is well known that agricultural work is, on
average, far more physically demanding that industrial or service sector work. The argument in
Deaton and Dreze (2009) suggested that as people moved out of agriculture, calorie needs would
go down, driving down average calorie intake. Our results (the coefficient on this variable is 0.003
in columns 4 and 5 in Table 2) suggest that effect is both statistically and economically extremely
weak. While the sign, being positive, is along expected lines the statistical significance is very
weak. The interpretation of the coefficient suggests that the effect is economically insignificant
too: a 1 percentage point decrease in the share of workforce engaged in agriculture would reduce
average calorie intake by 0.9 percent.
The last two columns in Table 2 reports results from the regression with the measure of home-
grown consumption (of rice and wheat) included as a regressor. The sample size for this regression
26
reduces by half since we could construct the measure of home-grown consumption only for two
time periods, 1993–94 and 2004–05. Hence, some of the statistical significance of coefficients
might be adversely impacted by the reduction in sample size. With such caveats in mind, it is in-
teresting to note that the results indicate a positive and strong effect for home-grown consumption.
The coefficient on home-grown consumption is of the order of 0.03 and is statistically signif-
icant at the 1 percent level. This suggests that a decline in the home-grown consumption for rice
and wheat of 1 kilogram is associated with a 3 percent decline in average calorie intake. This
seems to be a relatively large and important effect that has so far not received much attention in the
State Fixed Effects Y Y Y Y YTime Fixed Effects N N N N YObservations 107 105 105 50 50Dependent variable is log calorie intake; t statistics in parentheses.∗ p < 0.1, ∗∗ p < 0.05, ∗∗∗ p < 0.01
Since it can be difficult to statistically choose between the FE and RE estimators in small
samples, we also report the results from RE estimation of the same specifications in Table 3. The
27
results are similar to what we obtain from FE estimation, with some changes in the statistical
significance levels of some estimates. The estimate of the coefficient on the main variable of
interest, share of expenditure on nonfood essentials, remains close to -0.01 for all the specifications.
The coefficient remains statistically significant at the 10 percent even when we include home grown
consumption and time fixed effects. Thus, even with a relatively small sample size and controlling
for time fixed effects, the food budget squeeze remains in operation.
Two other changes from the results of the FE estimation needs to be noted. First, the estimate
of the coefficient on access to safe drinking water, the variable capturing the effect of the epidemi-
ological environment, becomes statistically significant at the 5 percent level in the RE estimations,
with the sign remaining positive, as in the FE estimations (where it was not statistically significant).
Second, while the coefficient on home grown consumption was significant at the 1 percent level in
the FE estimations, it remains statistically significant at the 10 percent level in the RE estimations.
Thus, even after taking account of these three differences between the FE and RE estimation
results together, we can see that the main results reported in this paper are robust to estimation
strategies: share of nonfood essentials and home grown consumption impact calorie intake nega-
tively and positively, respectively, providing evidence of a food budget squeeze. Moreover, results
of the empirical analysis does not support the declining calorie needs hypothesis.
At the end, one more observation on “coercive” and “non-coercive” explanations is appropriate.
While we have interpreted the negative impact of the share of nonfood expenditure on calorie intake
as evidence for a squeeze on the food budget which prevents people from consuming the desired
number of calories, it could also be argued that stagnant spending on food and increased spending
on nonfood items is voluntary. The factors that we have controlled for in our empirical analysis
account for structural factors such occupational structure (as a proxy for prevalence of hard labor)
or access to safe drinking water (as a proxy for the epidemiological environment) and not for a
change in preferences for nonfood essential services like education and health care. On the basis
of our analysis we cannot rule out such an explanation. However, given the low absolute level of
28
real expenditure on food as well as number of calories consumed by the majority of the rural Indian
population, we do not think the non-coercive or voluntary explanation can be the whole story.
We would also like to point out that disentangling coercive from non-coercive factors is dif-
ficult. For example, consider the following scenarios. It is reasonable to suppose that people are
voluntarily spending more on education because they believe this is the way to ensure economic
security for their children and social respect for their families. But the increasing unviabilty of agri-
culture as a source of income and the precariousness of informal employment, which are structural
factors, also play a role in increasing the allure of formal sector jobs for which school education is
a must. Second, people may spend more on health care not only because preference for allopathic
care is on the rise but also because the public health care system is in decline. This is again a
mixture of involuntary (structural) and voluntary changes. Third, people could be spending more
on transportation because of a decline in rural livelihood options (a structural factor) and increased
pull of urban jobs and lifestyles (a taste based factor). Thus in most realistic situations a combina-
tion of the two would be in operation. Separating out the coercive from non-coercive factors and
testing their relative strengths would be an instructive exercise for future research.
6 Conclusion
A puzzling feature of Indian economic development over the past few decades has been the trend
movement of per capita real income (measured by real MPCE or per capita real GDP) and average
per capita calorie intake in opposite directions. While per capita real incomes have increased,
average per capita calorie intake has declined over time. Several explanations have been offered
for this puzzling phenomenon, including movements in relative prices, impoverishment of a large
section of rural India, diversification of food consumption, decline in calorie needs and a squeeze
of the food budget.
Using a panel data set for 28 Indian states and the NCT of Delhi (rural areas only) and four
29
time periods (1993–94, 1999–00, 2004–05 and 2009–10) constructed from published reports of
the recent most four “thick” rounds of the consumption expenditure survey of the NSSO and the
Census of India (1991, 2001, and 2011), we test these alternative hypotheses. Since there is no
direct evidence of declining rural incomes or expenditures, we keep that hypothesis aside and test
other explanations advanced in the literature. Our results indicate that declining calorie needs is
not a statistically or economically strong candidate for explaining the puzzle. Instead, we find
strong support for the hypothesis of food budget squeeze, decline of home-grown consumption
and diversification.
Bringing the various strands of our findings together would suggest the following explanation
for the calorie consumption puzzle in India: over the past few decades, despite rising incomes,
a steady increase in non-food essential expenditures has “squeezed” the food budget keeping it
from increasing in real terms; operating alongside a food budget squeeze has been the decline of
home-grown consumption and diversification of food habits, the latter substituting expensive for
cheaper sources of calorie. The combined effect of a stagnant food budget, declining home-grown
consumption and diversification has led to a steady reduction in average calorie intake overtime.
The food budget squeeze could be driven by both demand and supply side factors. Increased
demand for formal schooling and institutional health care on the demand side, and a retreat of State
provisioning of education, health, nutrition and transportation on the supply side, could interact to
effect a squeeze on the food budget. Diversification of the food basket could be caused by growing
real income, and aspirational or other such effects. Investigating the relative strengths of the various
effects driving both diversification and the food budget squeeze are future research questions that
arise from this paper.
30
Appendix
This appendix describes the construction of the measure of access to non-market sources of food.
While it is obvious that the consumption of many food items occurs outside the domain of market
transactions, we restrict our attention to the two most important cereals that enter into the food
basket of poor households: rice and wheat.
For 1993-94, we use data from Table 1R of Report 424 on the consumption of rice and wheat
by rice growing and other households, noting down separately data on total consumption and
consumption out of own-stock. Using data from Table T1 of Report 424 on the share of rice
growing households in each state, we compute state-wise average figures for total consumption
and consumption out of own-stock (for both rice and wheat). Next we calculate the weighted
average of the share of own-stock consumption of rice and wheat using the ratio of rice and wheat
to total cereal consumption in each state as weights (data on the weights come from Table 1R,
Report 424).
For 2004-05, we adopt a slightly different route (because tabulated data is different). From
Table 6R of Report 510 (Volume II), we take data on the percentage of consumption of non-PDS
rice and wheat, i.e., rice and wheat that comes from sources other than the public distribution
system (PDS), coming from home grown stock. From Table 1R of Report 510 (Volume I), we
take data on the quantity of monthly consumption of non-PDS rice and wheat for every household.
Multiplying the two numbers, for rice and wheat separately, gives us the quantity of own-stock
consumption of rice and wheat. Finally, we calculate the weighted average of the quantity of own-
stock consumption of rice and wheat using the ratio of rice and wheat to total cereal consumption
in each state as weights (data on the weights come from Table 3R, Report 508).
References
P. Balakrishnan. Economic Growth in India: History and Prospect. Oxford University Press, 2010.
31
C. P. Chandrasekhar and J. Ghosh. The calorie consumption puzzle. The
Hindu Business Line, 11 February 2003. Available for download at: