42
1

1
2
DEPARTMENT OF THE TREASURY
WASHINGTON, D.C. 20220
September 25, 2013
Dear Colleagues:
On September 27, 2010, President Obama signed into law the Small Business Jobs Act of 2010,
creating the State Small Business Credit Initiative or “SSBCI.” Through SSBCI, the U.S. Treasury
provides up to $1.5 billion to state programs that support lending and investing in small businesses
and small manufacturers. This report, “State Small Business Credit Initiative: A Summary of States’
2012 Annual Reports,” analyzes the Annual Reports of the 47 states, the District of Columbia,
five territories and municipalities in three states that received allocations through December 31,
2012, the first full year that every SSBCI program operated.
Small businesses are the engines of job creation and essential to strengthening our national
economy, creating two out of three new jobs and employing half of all private sector employees
nationwide. Despite this crucial role in our economy, some small businesses and entrepreneurs
continue to face challenges accessing capital. The SSBCI program provides critical funding for
many small businesses, as this report documents.
We hope that this report, as well as the other materials available at www.treasury.gov/ssbci, will
contribute to making the nation’s credit and capital markets as efficient and accessible as possible.
Best regards,
Don Graves, Jr. Clifton G. Kellogg
Deputy Assistant Secretary Director
Small Business, Community Development State Small Business Credit Initiative
and Affordable Housing Policy

3
State Small Business Credit Initiative A SUMMARY OF STATES’ 2012 ANNUAL REPORTS
Table of Contents
SSBCI BY THE FIGURES ........................................................................................................................... 4
ACKNOWLEDGEMENTS .......................................................................................................................... 5
PROGRAM OVERVIEW ............................................................................................................................ 6
SSBCI PROGRAM TYPE ........................................................................................................................... 9
Loan Participation Programs ............................................................................................................ 9
Venture Capital Programs ............................................................................................................... 10
Loan Guarantee Programs .............................................................................................................. 11
Collateral Support Programs ......................................................................................................... 12
Capital Access Programs ................................................................................................................. 13
SSBCI ALLOCATIONS ............................................................................................................................. 14
SSBCI PROGRAM PERFORMANCE .................................................................................................... 16
SSBCI USE BY STATES ............................................................................................................................ 33
CONCLUSION........................................................................................................................................... 36
APPENDIX A .............................................................................................................................................. 37
APPENDIX B .............................................................................................................................................. 38
APPENDIX C .............................................................................................................................................. 41
4
SSBCI BY THE FIGURES
Figure 1
Figure 2
Figure 3
SSBCI Allocations (Cumulative through 2012)
SSBCI Disbursements to States (Through 2012)
Number of SSBCI Loans or Investments, Total Funds Expended, and Amount Loaned or Invested
(2011, 2012 and Cumulative)
Figure 4 Total SSBCI Funds Allocated by Program Type (Cumulative through 2012)
Figure 5 Amount of Private Financing Leveraged Per Dollar of SSBCI Funds Expended, by Program Type
(Cumulative through 2012)
Figure 6 Jobs Created and Retained (2011, 2012, and Cumulative)
Figure 7 Jobs Created and Retained by Program Type (Cumulative through 2012)
Figure 8 Number of SSBCI Loans or Investments and Total Amount Loaned or Invested, by Program Type
(Cumulative through 2012)
Figure 9 Average Total Financing Caused by SSBCI Funding, by Program Type (Cumulative through 2012)
Figure 10 Distribution of SSBCI Loans or Investments by Size (Cumulative through 2012)
Figure 11 Percent of SSBCI Loans or Investments (by Number) in Low- and Moderate- Income Communities,
by Program Type (Cumulative through 2012)
Figure 12
Percent of SSBCI Loans or Investment (by Number) in Metropolitan and Non-Metropolitan
Communities, by Program Type (Cumulative through 2012)
Figure 13 SSBCI Loans or Investments, by Industry (Cumulative though 2012)
Figure 14 SSBCI Loans or Investments, by Business Size (Cumulative through 2012)
Figure 15 SSBCI Loans or Investments, by Business Revenues (Cumulative through 2012)
Figure 16 SSBCI Loans or Investments, by Age of Business (Cumulative through 2012)
Figure 17 Number of Lenders and Average Number of Loans, by Size of Lender (Cumulative through 2012)
Figure 18 CDFI Participation in SSBCI Programs (Cumulative through 2012)
Figure 19 Amount Loaned or Invested by CDFIs (Top 8 States, Cumulative through 2012)
Figure 20
Figure 21
Amount of Financing Caused by SSBCI Program by State, Ranked by Amount (Cumulative through 2012)
SSBCI Funds Expended by State, Ranked by Amount (Cumulative through 2012)
Figure 22
SSBCI Funds Expended by State, Ranked by Percent (Cumulative through 2012)
5
ACKNOWLEDGEMENTS
In the last three years, the U.S. Treasury has stood up the State Small Business Credit
Initiative in partnership with state agencies and their contractors. SSBCI translated the
new statute into program rules, educated state officials about the program, and
organized webinars and conferences. The program benefitted from the work of many
talented and dedicated individuals.
I would like to thank my colleagues at the State Small Business Credit Initiative: Deputy
Director Jeff Stout and the Relationship Managers Phyllis Love, David Rixter and James
Clark; Compliance Manager Danielle Christensen and her team of Rick Oettinger, Sarah
Reed and Karin Peabody; Senior Advisor Jamie Lipsey; and Linda Clark and Glen
Johnson. I would also like to thank colleagues at the U.S. Treasury who work directly
with SSBCI including Matthew Bevens, Eric Dash, Ernie Tedeschi, Katherine Brandes,
Peter Bieger, Drew Colbert, Megan Moore, Christopher Stever, Paula Jones, Ellen
Neubauer, Robin Meigel (from Department of Agriculture), Jean Whaley and Nevelyn
Jones. I would also like to thank our former SSBCI colleagues Mark L. Stevens, Maureen
Klovers, Roberto Rodriguez and Ruthanne Murray.
SSBCI received valuable technical support from Terry Valladares of Federal Management
Systems, as well as his colleagues Bret Quackenbush, Kay Williams and John Alex.
During the application phase, SSBCI received significant help from Paul Pryde and
Vincent Dabney. Marty Romitti, Sarah Gutschow, and Ron Kelly of the Center for
Regional Economic Competitiveness offered timely and accurate data analysis and
prepared many of the graphics in this report. Ken Poole, George Surgeon, David
McGrady, and Donna Nails proofread versions of the report.
I would also like to thank our colleagues at the bank regulatory agencies who
disseminated information about SSBCI. The Federal Reserve Banks in San Francisco,
Chicago and Dallas hosted national conferences for state officials to exchange ideas and
enable states to learn from each other’s success. The Office of the Comptroller of the
Currency and the Federal Deposit Insurance Corporation clarified regulatory issues and
posted useful information on their websites.
Finally, thank you to Don Graves, Jr. for his leadership and support of SSBCI.
Clifton G. Kellogg
Director, State Small Business Credit Initiative

6
State Small Business Credit Initiative A SUMMARY OF STATES’ 2012 ANNUAL REPORTS
PROGRAM OVERVIEW
On September 27, 2010, President Obama signed into law the Small Business Jobs Act of
2010, creating the State Small Business Credit Initiative (SSBCI). Through SSBCI, the U.S.
Department of the Treasury awarded almost $1.5 billion to 47 states, the District of
Columbia, five territories and municipalities in three states (for simplicity each
participating entity will be referred to as a “State”) to fund programs that support small
businesses and small manufacturers. The program is expected to help spur up to $15
billion in new private sector lending or investment in small companies by leveraging $10
in private capital for every dollar of federal support by the program’s end.
SSBCI is an innovative program that awards funds to State agencies for lending and
investing programs. SSBCI programs fall into five categories: Capital Access Programs,
Loan Participation Programs, Collateral Support Programs, Loan Guarantee Programs,
and Venture Capital Programs. Treasury awarded allocations based on a formula in the
Act that considered population and unemployment levels in 2008 and 2009. The
program allows each State to design its own small business support program in
response to local economic conditions.
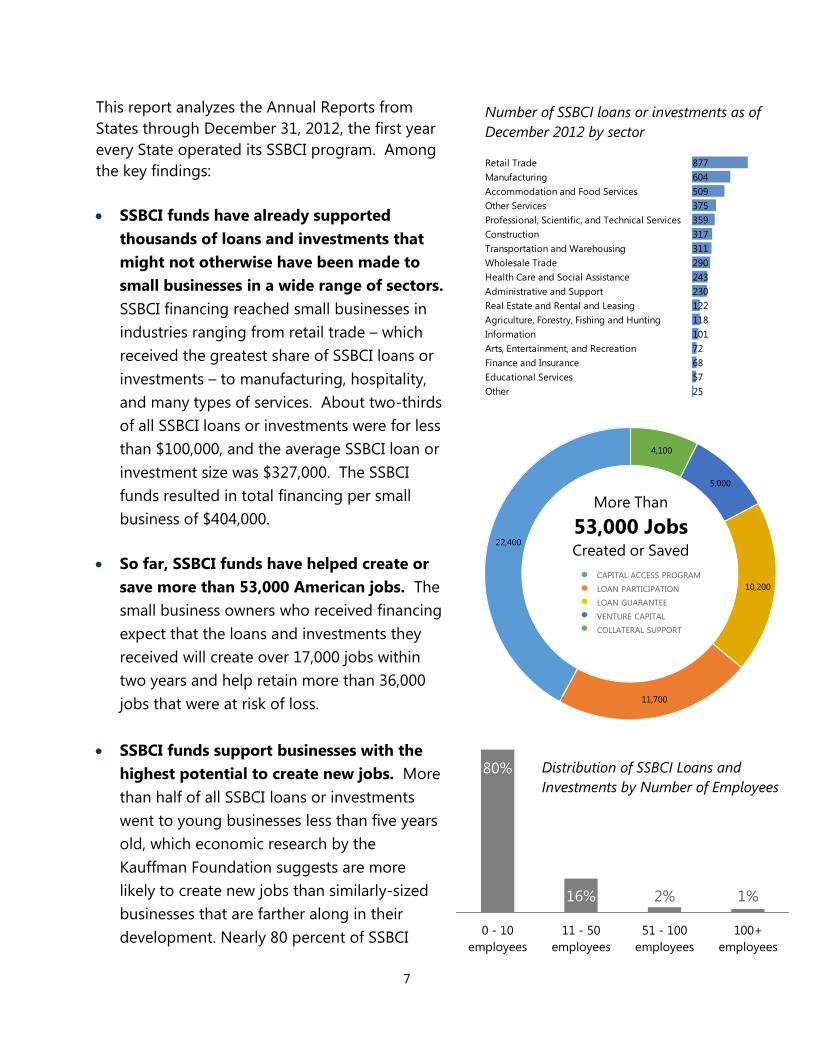
SSBCI has already supported more than 4,600 small businesses across
the country with total loans or investments of $1.9 billion. Location of SSBCI loans or investments as of December 31, 2012
7
Number of SSBCI loans or investments as of
December 2012 by sector
Retail Trade 877
Manufacturing 604
Accommodation and Food Services 509
Other Services 375
Professional, Scientific, and Technical Services 359
Construction 317
Transportation and Warehousing 311
Wholesale Trade 290
Health Care and Social Assistance 243
Administrative and Support 230
Real Estate and Rental and Leasing 122
Agriculture, Forestry, Fishing and Hunting 118
Information 101
Arts, Entertainment, and Recreation 72
Finance and Insurance 68
Educational Services 57
Other 25
4,100
5,000
10,200
11,700
22,400
More Than
53,000 JobsCreated or Saved
CAPITAL ACCESS PROGRAM
LOAN PARTICIPATION
LOAN GUARANTEE
VENTURE CAPITAL
COLLATERAL SUPPORT
Distribution of SSBCI Loans and
Investments by Number of Employees
80%
16% 2% 1%
0 - 10
employees
11 - 50
employees
51 - 100
employees
100+
employees
This report analyzes the Annual Reports from
States through December 31, 2012, the first year
every State operated its SSBCI program. Among
the key findings:
SSBCI funds have already supported
thousands of loans and investments that
might not otherwise have been made to
small businesses in a wide range of sectors.
SSBCI financing reached small businesses in
industries ranging from retail trade – which
received the greatest share of SSBCI loans or
investments – to manufacturing, hospitality,
and many types of services. About two-thirds
of all SSBCI loans or investments were for less
than $100,000, and the average SSBCI loan or
investment size was $327,000. The SSBCI
funds resulted in total financing per small
business of $404,000.
So far, SSBCI funds have helped create or
save more than 53,000 American jobs. The
small business owners who received financing
expect that the loans and investments they
received will create over 17,000 jobs within
two years and help retain more than 36,000
jobs that were at risk of loss.
SSBCI funds support businesses with the
highest potential to create new jobs. More
than half of all SSBCI loans or investments
went to young businesses less than five years
old, which economic research by the
Kauffman Foundation suggests are more
likely to create new jobs than similarly-sized
businesses that are farther along in their
development. Nearly 80 percent of SSBCI
8
loans and investments went to
businesses with 10 or fewer employees.
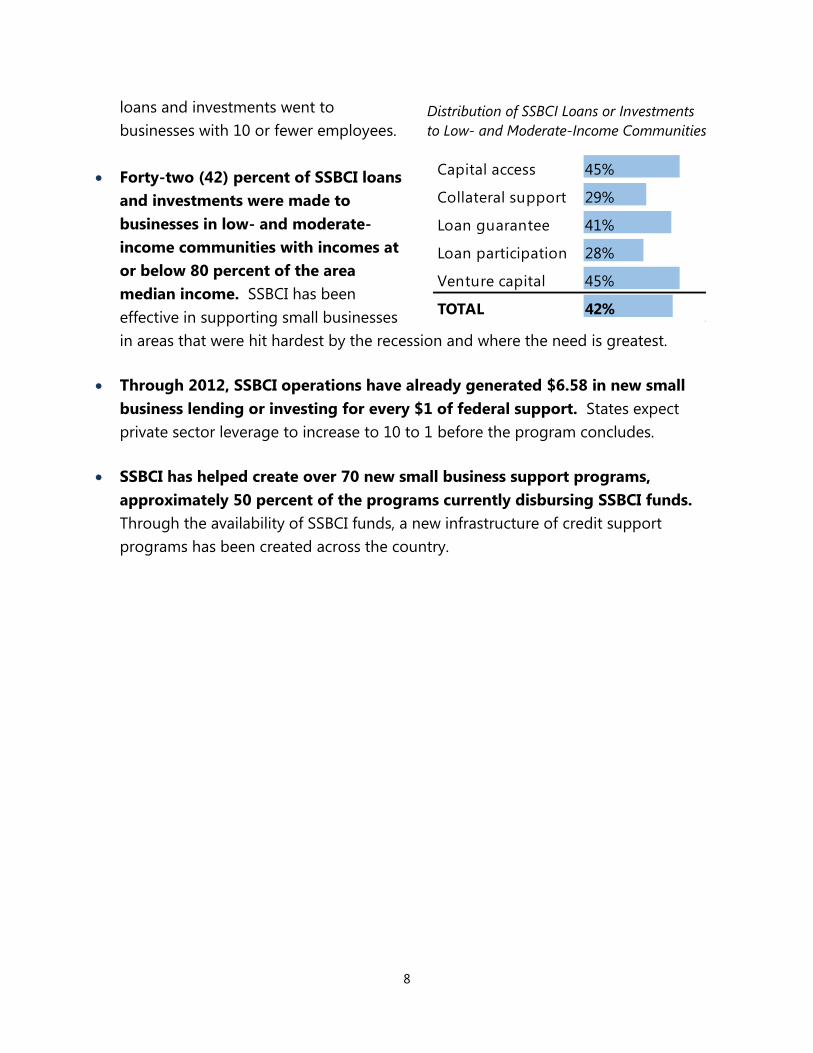
Forty-two (42) percent of SSBCI loans
and investments were made to
businesses in low- and moderate-
income communities with incomes at
or below 80 percent of the area
median income. SSBCI has been
effective in supporting small businesses
in areas that were hit hardest by the recession and where the need is greatest.
Through 2012, SSBCI operations have already generated $6.58 in new small
business lending or investing for every $1 of federal support. States expect
private sector leverage to increase to 10 to 1 before the program concludes.
SSBCI has helped create over 70 new small business support programs,
approximately 50 percent of the programs currently disbursing SSBCI funds.
Through the availability of SSBCI funds, a new infrastructure of credit support
programs has been created across the country.
Distribution of SSBCI Loans or Investments
to Low- and Moderate-Income Communities
Capital access 45%
Collateral support 29%
Loan guarantee 41%
Loan participation 28%
Venture capital 45%
TOTAL 42%
9
SSBCI PROGRAM TYPE
Loan Participation
Programs Creating and saving nearly 12,000 jobs
with innovative financing
Loan Participation Programs (LPPs) support
small business lending by providing a portion
of the capital for a financial institution’s small
business loan. SSBCI funds help in two
different ways. States can use SSBCI funds to
purchase a portion of a financial institution’s
loan. This is known as a purchase LPP.
Alternatively, States can use SSBCI funds to
make a direct loan, known as a companion
LPP. In both cases, the portion funded with
SSBCI funds is typically subordinate to the
financial institution’s interest, providing a
crucial boost for small business lending.
KEY FACTS
LPPs operate in 37 States and supported
over $807 million in loans in 2011 and
2012, creating over 5,000 jobs, the most of
any SSBCI program type.
The average total financing per small
business for LPPs is $1.6 million. LPPs
leverage $6.41 for every $1 in federal
support.
States have already deployed 26 percent of
the funding they received for LPPs, the
highest percentage of funds deployed by
any SSBCI program type.
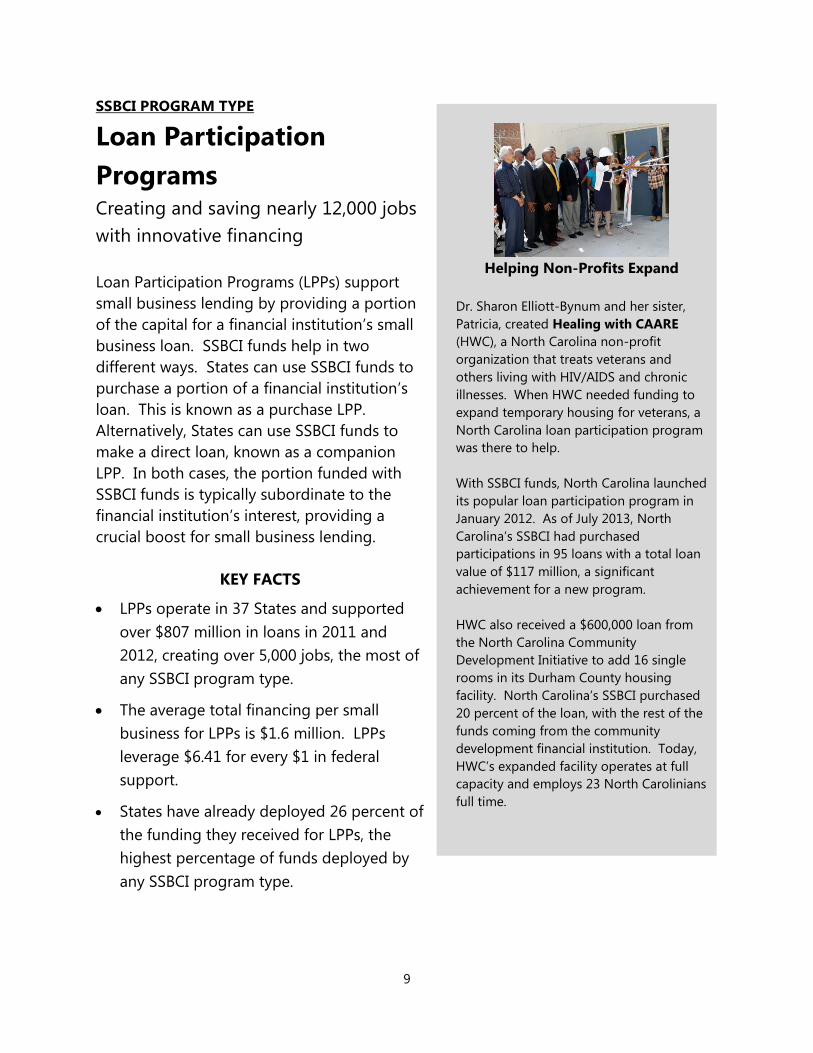
Helping Non-Profits Expand
Dr. Sharon Elliott-Bynum and her sister,
Patricia, created Healing with CAARE
(HWC), a North Carolina non-profit
organization that treats veterans and
others living with HIV/AIDS and chronic
illnesses. When HWC needed funding to
expand temporary housing for veterans, a
North Carolina loan participation program
was there to help.
With SSBCI funds, North Carolina launched
its popular loan participation program in
January 2012. As of July 2013, North
Carolina’s SSBCI had purchased
participations in 95 loans with a total loan
value of $117 million, a significant
achievement for a new program.
HWC also received a $600,000 loan from
the North Carolina Community
Development Initiative to add 16 single
rooms in its Durham County housing
facility. North Carolina’s SSBCI purchased
20 percent of the loan, with the rest of the
funds coming from the community
development financial institution. Today,
HWC’s expanded facility operates at full
capacity and employs 23 North Carolinians
full time.
10
SSBCI PROGRAM TYPE
Venture Capital Programs Financing innovative new businesses to
create new jobs
Venture Capital Programs (VCPs) support small
business investing by injecting equity in start-
ups and other emerging businesses that might
not otherwise obtain financing. Most VCPs
describe their programs as “early-stage
financing” for businesses that are not yet
established enough for traditional investors.
VCPs – as is true of all SSBCI programs – must
maintain at least $1 in private capital for each
$1 of federal funding. States can make direct
equity investments or, alternatively, a State may
invest in privately managed equity funds, which
must attract other investors before they invest
in small businesses.
VCPs facilitate private sector investments by
supplementing capital from private investors.
States expect to jumpstart capital markets in
States with little private equity investing activity.
KEY FACTS
SSBCI-funded VCPs operate in 31 States and
supported investments in 237 businesses in
2011 and 2012 totaling $472 million.
The average total financing per small
business for VCPs is $2 million. VCPs
leverage $5.36 for every $1 in federal
support.
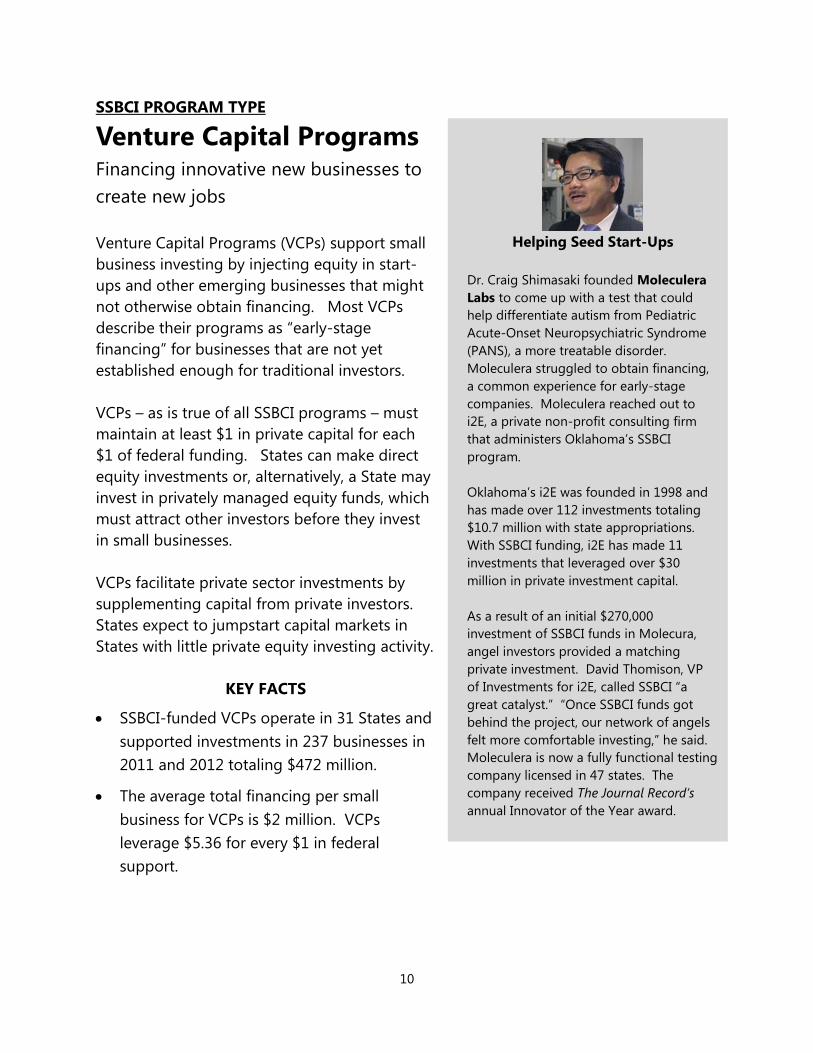
Helping Seed Start-Ups
Dr. Craig Shimasaki founded Moleculera
Labs to come up with a test that could
help differentiate autism from Pediatric
Acute-Onset Neuropsychiatric Syndrome
(PANS), a more treatable disorder.
Moleculera struggled to obtain financing,
a common experience for early-stage
companies. Moleculera reached out to
i2E, a private non-profit consulting firm
that administers Oklahoma’s SSBCI
program.
Oklahoma’s i2E was founded in 1998 and
has made over 112 investments totaling
$10.7 million with state appropriations.
With SSBCI funding, i2E has made 11
investments that leveraged over $30
million in private investment capital.
As a result of an initial $270,000
investment of SSBCI funds in Molecura,
angel investors provided a matching
private investment. David Thomison, VP
of Investments for i2E, called SSBCI “a
great catalyst.” “Once SSBCI funds got
behind the project, our network of angels
felt more comfortable investing,” he said.
Moleculera is now a fully functional testing
company licensed in 47 states. The
company received The Journal Record’s
annual Innovator of the Year award.

11
SSBCI PROGRAM TYPE
Loan Guarantee Programs Sharing in risk to increase small business
lending
Loan Guarantee Programs (LGPs) support small
business lending by sharing in the lender’s risk.
The guarantees provide credit to businesses
that do not fit traditional lending criteria. States
can use SSBCI funds to guarantee up to 80
percent of a loan, though most guarantees
occur at a lower level. The State shares the
lender’s loss in the event the borrower cannot
repay the loan.
Before the recession, state-funded LGPs
operated successfully in California, Maryland,
Oregon and elsewhere. SSBCI not only re-
started and ramped up these existing programs,
but also funded new LGPs like the one in
Alabama. Alabama’s program has guaranteed
or has pending applications for 75 loans
totaling over $20 million.
KEY FACTS
SSBCI-funded LGPs operate in 19 States and
supported 465 loans in 2011 and 2012
totaling $189 million.
The average total financing per small
business for LGPs is $406,000. LGPs leverage
$5.58 for every $1 in federal support
Some States offer SSBCI loan guarantees to
support the bridge financing necessary
before a project’s permanent loan is in place.
Helping Small Businesses Grow
M. Louis Construction was founded with
a wheelbarrow and a pickup truck in 1979
by Portuguese immigrants in Rockville,
Maryland. Today, the company generates
$60 million in revenue annually and
employs more than 200 people. But this
small business success story was not
always guaranteed.
M. Luis Construction needed a financial
lifeline in 2011 when their existing bank
declined their request for an additional
credit after a fire at their newly-acquired
asphalt manufacturing facility. Working
with the Maryland Industrial Development
Financing Authority and Eagle Bank of
Bethesda, Maryland, owners Cidalia Luis-
Akbar and Natalia Luis secured financing
with the help of a loan guarantee financed
with SSBCI funds.
That guarantee enabled the sisters to
continue to expand into new industries
and hire workers – something that
Secretary Lew recognized when he visited
the company’s plant during Small Business
Week in June 2013. “The U.S. Department
of the Treasury is allowing companies like
ours to get the help they need to grow
and benefit their communities,” said
Natalia Luis. “It makes a real difference for
the local, regional and national economy.”
12
SSBCI PROGRAM TYPE
Collateral Support
Programs Helping businesses in the hardest hit
communities
Collateral Support Programs (CSPs) support
small business lending by using SSBCI funds
to fill a collateral gap for otherwise strong
businesses. In evaluating a loan, lenders may
find the value of collateral is less than the
loan amount. This type of collateral shortfall
is a common occurrence in regions of the
country that suffered depressed real estate
values or a decline in manufacturing. Using
funds from a CSP, a State makes a cash
deposit at the financial institution lender to
cover the collateral gap for the loan.
KEY FACTS
Michigan created the first CSP in 2009
with State appropriations.
With SSBCI funding, CSPs now operate in
15 States and supported 175 loans in 2011
and 2012 totaling $222 million.
The average total financing per small
business for CSPs is $1.27 million. CSPs
leverage $6.35 for every $1 in federal
support.
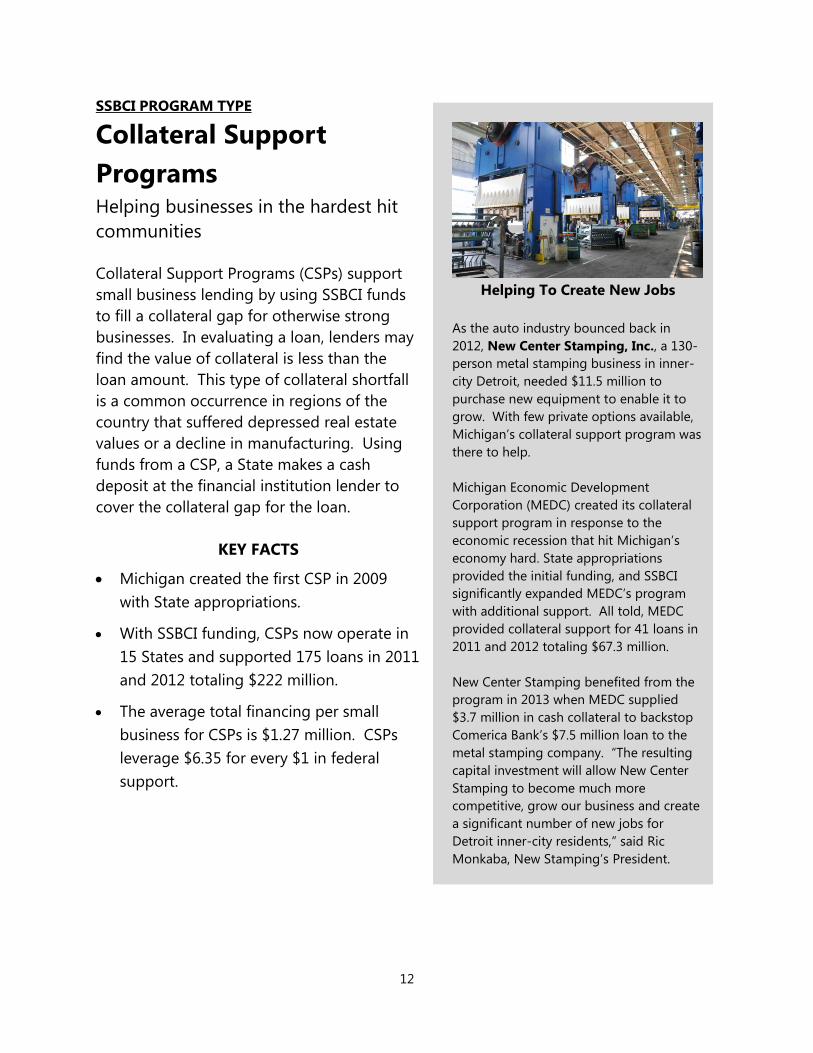
Helping To Create New Jobs
As the auto industry bounced back in
2012, New Center Stamping, Inc., a 130-
person metal stamping business in inner-
city Detroit, needed $11.5 million to
purchase new equipment to enable it to
grow. With few private options available,
Michigan’s collateral support program was
there to help.
Michigan Economic Development
Corporation (MEDC) created its collateral
support program in response to the
economic recession that hit Michigan’s
economy hard. State appropriations
provided the initial funding, and SSBCI
significantly expanded MEDC’s program
with additional support. All told, MEDC
provided collateral support for 41 loans in
2011 and 2012 totaling $67.3 million.
New Center Stamping benefited from the
program in 2013 when MEDC supplied
$3.7 million in cash collateral to backstop
Comerica Bank’s $7.5 million loan to the
metal stamping company. “The resulting
capital investment will allow New Center
Stamping to become much more
competitive, grow our business and create
a significant number of new jobs for
Detroit inner-city residents,” said Ric
Monkaba, New Stamping’s President.
13
SSBCI PROGRAM TYPE
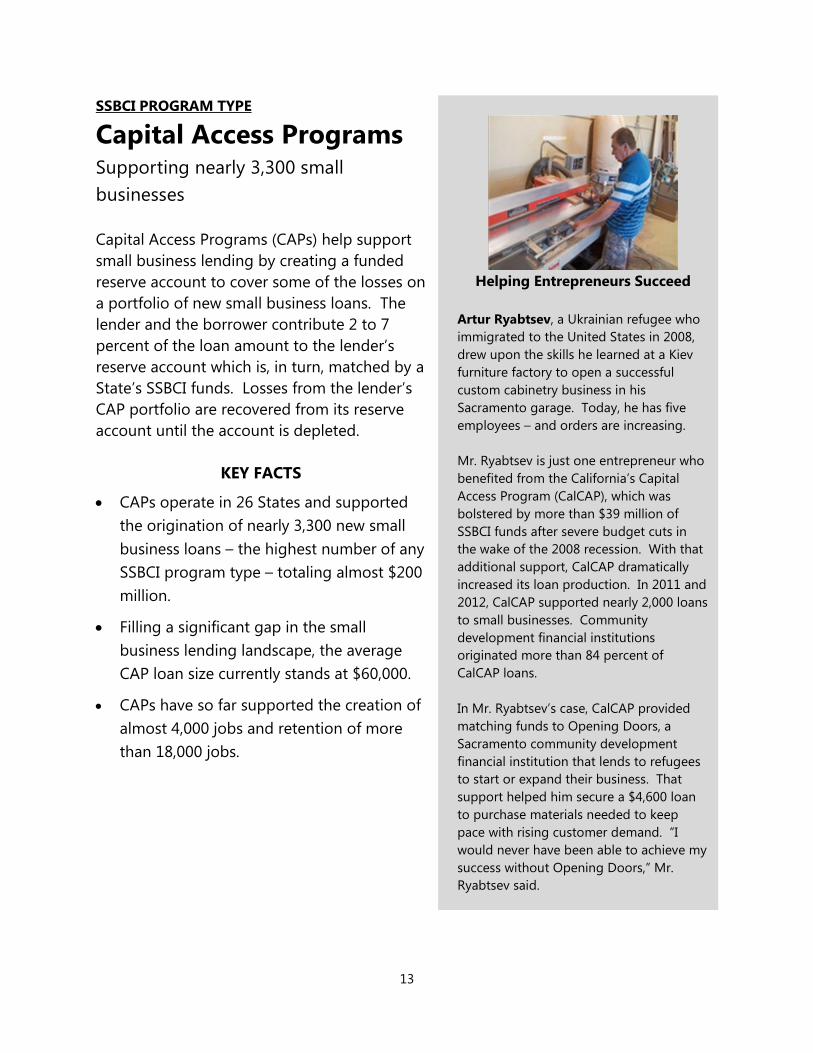
Capital Access Programs Supporting nearly 3,300 small
businesses
Capital Access Programs (CAPs) help support
small business lending by creating a funded
reserve account to cover some of the losses on
a portfolio of new small business loans. The
lender and the borrower contribute 2 to 7
percent of the loan amount to the lender’s
reserve account which is, in turn, matched by a
State’s SSBCI funds. Losses from the lender’s
CAP portfolio are recovered from its reserve
account until the account is depleted.
KEY FACTS
CAPs operate in 26 States and supported
the origination of nearly 3,300 new small
business loans – the highest number of any
SSBCI program type – totaling almost $200
million.
Filling a significant gap in the small
business lending landscape, the average
CAP loan size currently stands at $60,000.
CAPs have so far supported the creation of
almost 4,000 jobs and retention of more
than 18,000 jobs.
Helping Entrepreneurs Succeed
Artur Ryabtsev, a Ukrainian refugee who
immigrated to the United States in 2008,
drew upon the skills he learned at a Kiev
furniture factory to open a successful
custom cabinetry business in his
Sacramento garage. Today, he has five
employees – and orders are increasing.
Mr. Ryabtsev is just one entrepreneur who
benefited from the California’s Capital
Access Program (CalCAP), which was
bolstered by more than $39 million of
SSBCI funds after severe budget cuts in
the wake of the 2008 recession. With that
additional support, CalCAP dramatically
increased its loan production. In 2011 and
2012, CalCAP supported nearly 2,000 loans
to small businesses. Community
development financial institutions
originated more than 84 percent of
CalCAP loans.
In Mr. Ryabtsev’s case, CalCAP provided
matching funds to Opening Doors, a
Sacramento community development
financial institution that lends to refugees
to start or expand their business. That
support helped him secure a $4,600 loan
to purchase materials needed to keep
pace with rising customer demand. “I
would never have been able to achieve my
success without Opening Doors,” Mr.
Ryabtsev said.

14
SSBCI ALLOCATIONS
Size of Allocations
Under the Small Business Jobs Act of 2010 (Act), the governor of each State designated
an agency to apply for an SSBCI allocation. Municipalities could apply for an allocation
only if their state did not submit a notice of intent to apply for funds or complete an
application prior to June 27, 2011. Treasury awarded allocations to municipalities in
Alaska, North Dakota and Wyoming.
A formula in the Act determined the SSBCI allocation based on population and
unemployment. Each State received a minimum allocation of 0.9 percent of the total
funding, equal to $13.2 million (see Appendix A for specific allocation amounts).
Figure 1: SSBCI Allocations (Cumulative through 2012)
Note: AK, WY and ND did not apply for allocations. Treasury allocated funds to municipalities in those states.

15
Disbursements to States
States draw down their allocations in three disbursements. Once a State signs its
Allocation Agreement, the State receives its first disbursement. A State may draw its
second and third disbursement after it expends, obligates or transfers 80 percent of the
prior disbursement.
Figure 2: SSBCI Disbursements to States (Through 2012)

16
SSBCI PROGRAM PERFORMANCE
The past year, 2012, marked the first calendar year of operation for every State’s SSBCI
program. This section highlights various measures of performance assembled from the
States’ Annual Reports.
The data throughout this report are based on 2012 Annual Reports and have not been
independently verified or audited by Treasury.
Total Loans and Investments Made
Over 4,600 loans or investments were made using SSBCI funds through 2012, resulting
in newly available capital of nearly $1.9 billion for small businesses nationwide. This is
the total value of financing provided to the borrower as a result of the SSBCI funding, or
in the case of state venture capital programs, the total amount invested in the
transaction as a result of the SSBCI funding.
The cumulative amount of SSBCI funds expended reached $271 million through 2012.
Figure 3: Number of SSBCI Loans or Investments, Total Funds Expended, and Amount Loaned or Invested
(2011, 2012 and Cumulative)

17
Allocations1 by Program Type
LPPs and VCPs have the largest proportion of SSBCI funds allocated.
1 Treasury tracks data on the use of SSBCI funds at four stages: Funds Allocated to Participating States; Funds
Disbursed to Participating States; Funds Expended, Obligated or Transferred; and Funds Expended for Loans or Investments. As of December 31, 2012, the results were $1.46 billion, $586 million, $338 million, and $271 million, respectively.
Figure 4: Total SSBCI Funds Allocated by Program Type (Cumulative through 2012)

18
Private Financing Leveraged
Overall, SSBCI funds leveraged an average of $6.58 in private capital for each $1 of
federal funds.2 Leverage will increase by recycling SSBCI funds into new loans or
investments and through subsequent private financing.
Capital Access Programs (CAPs) had the highest leveraging ratio with an average of
$28.13 in private capital for every $1 of SSBCI funding. In CAPs, financial institution
lenders and small business borrowers contribute a small percentage of the loan amount
to reserve accounts, which is matched by States using SSBCI funds. Because the State
contribution per loan is small, the leverage ratio for CAPs is significantly higher than for
other loan programs.
Venture Capital Programs and Loan Guarantee Programs had the lowest private capital
leveraging ratios, generating on average $5.36 and $5.58, respectively, for every $1 of
SSBCI funding.
2 Private leverage calculations include SSBCI funds used for administrative expenses and exclude non-private
sources and any direct financing to the business from SSBCI funds.
Figure 5: Amount of Private Financing Leveraged Per Dollar of SSBCI Funds Expended, by Program Type (Cumulative through 2012)
19
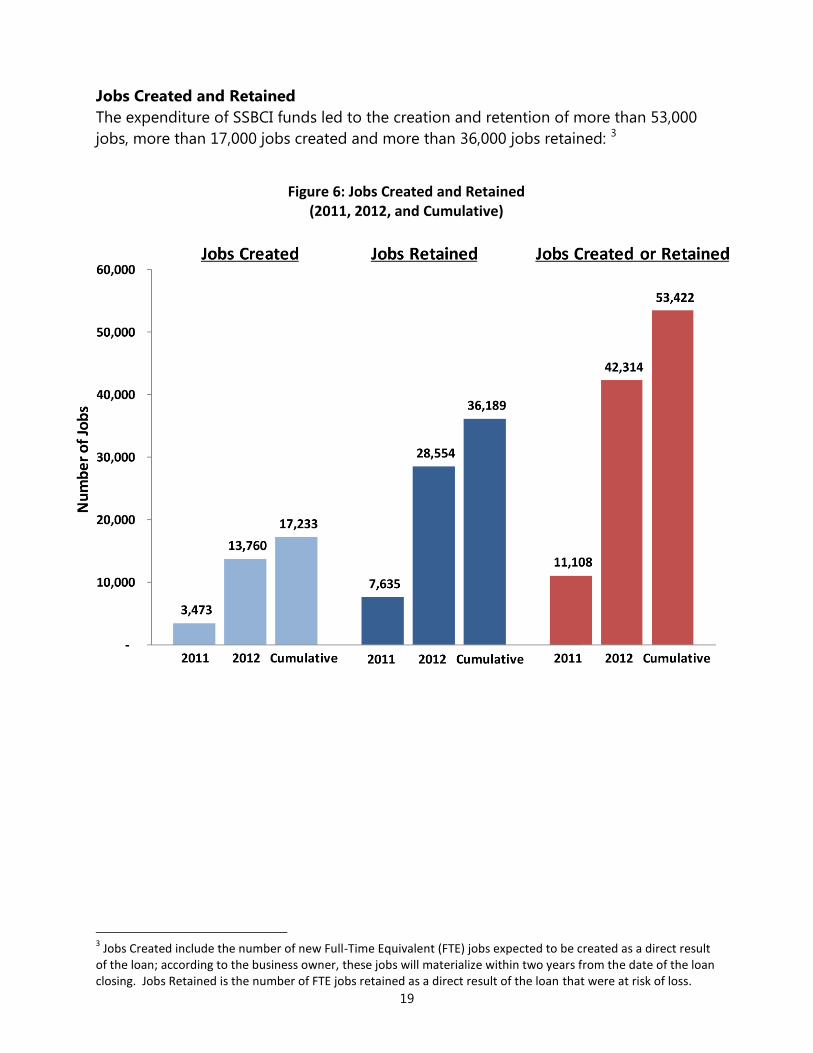
Jobs Created and Retained
The expenditure of SSBCI funds led to the creation and retention of more than 53,000
jobs, more than 17,000 jobs created and more than 36,000 jobs retained: 3
3 Jobs Created include the number of new Full-Time Equivalent (FTE) jobs expected to be created as a direct result
of the loan; according to the business owner, these jobs will materialize within two years from the date of the loan closing. Jobs Retained is the number of FTE jobs retained as a direct result of the loan that were at risk of loss.
Figure 6: Jobs Created and Retained (2011, 2012, and Cumulative)

20
Capital Access Programs had the highest total among SSBCI program types for jobs
created and retained, including being credited for having retained more than 18,000
jobs as of the end of 2012. Loan Participation Programs were credited with creating the
most new jobs, nearly 5,200, among program types.
Figure 7: Jobs Created and Retained by Program Type (Cumulative through 2012)
Program Type Jobs Created Jobs Retained
Capital Access 3,955 18,412
Collateral Support 2,633 1,440
Loan Guarantee 2,757 7,484
Loan Participation 5,195 6,553
Venture Capital 2,693 2,300
Totals 17,233 36,189
21
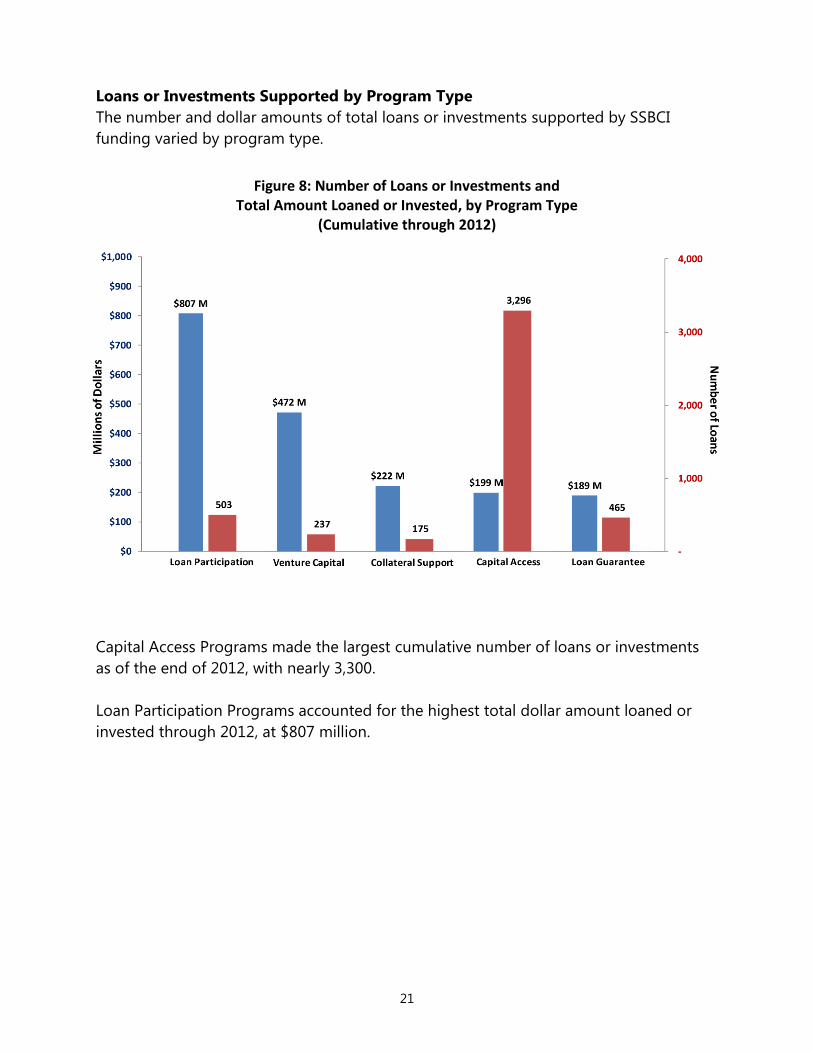
Loans or Investments Supported by Program Type
The number and dollar amounts of total loans or investments supported by SSBCI
funding varied by program type.
Capital Access Programs made the largest cumulative number of loans or investments
as of the end of 2012, with nearly 3,300.
Loan Participation Programs accounted for the highest total dollar amount loaned or
invested through 2012, at $807 million.
Figure 8: Number of Loans or Investments and Total Amount Loaned or Invested, by Program Type
(Cumulative through 2012)
22
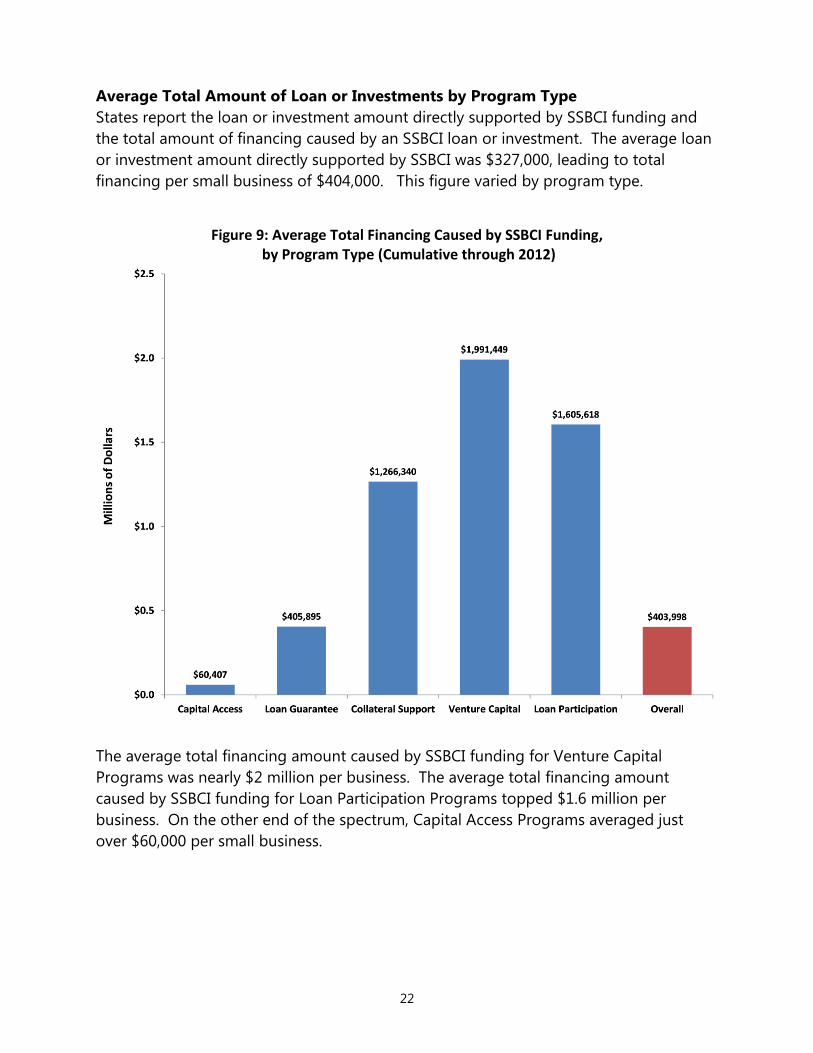
Average Total Amount of Loan or Investments by Program Type
States report the loan or investment amount directly supported by SSBCI funding and
the total amount of financing caused by an SSBCI loan or investment. The average loan
or investment amount directly supported by SSBCI was $327,000, leading to total
financing per small business of $404,000. This figure varied by program type.
The average total financing amount caused by SSBCI funding for Venture Capital
Programs was nearly $2 million per business. The average total financing amount
caused by SSBCI funding for Loan Participation Programs topped $1.6 million per
business. On the other end of the spectrum, Capital Access Programs averaged just
over $60,000 per small business.
Figure 9: Average Total Financing Caused by SSBCI Funding, by Program Type (Cumulative through 2012)

23
Distribution of Loans or Investments by Size
Two-thirds of the total financing caused by SSBCI funding are for amounts less than
$100,000.
This large number of smaller loan or investment amounts account for 4 percent of the
total dollar amount of SSBCI funds loaned or invested through 2012.
Total financings greater than half a million dollars represent 86 percent of the total
dollar amount loaned or invested but represent just 14 percent of the total number of
loans or investments made.
Figure 10: Distribution of SSBCI Loans or Investments by Size (Cumulative through 2012)

24
Loans or Investments Made in Low- and Moderate-Income Communities
Better than four out of every ten loans or investments were made in low- and moderate-
income communities.4
All five SSBCI program types have made loans or investments in low- and moderate-
income communities, with a high of 45 percent for both Venture Capital Programs and
Capital Access Programs.
4Calculated from total number of loans or investments made in low- and moderate-income census tracts.
The “Low and Moderate Income” categorizations are derived from income data from the Census Bureau. The SSBCI Annual Report transaction statistics are linked to 2010 data from the Census Bureau’s 5-year American Community Survey which is the successor to the decennial census for census tract level data for income and poverty data. “Low income” households earn less than 50% of area median income. “Moderate income” households earn between 50% and 80% of area median income.
Figure 11: Percent of SSBCI Loans or Investments (by Number) in Low- and Moderate-Income Communities, by Program Type (Cumulative through 2012)

25
Loans or Investments Made in Metropolitan and Non-Metropolitan Communities
A majority of SSBCI loans or investments, 88 percent, have been made to small
businesses located in metropolitan areas.
For Capital Access Programs and Venture Capital Programs, more than 90 percent of
loans or investments have been made to small businesses located in metropolitan areas.
Collateral Support Programs and Loan Participation Programs had the highest
proportions of loans or investments to small businesses in non-metro areas, at 39
percent and 32 percent, respectively.
Figure 12: Percent of SSBCI Loans or Investment (by Number) in Metropolitan and Non-Metropolitan Communities, by Program Type (Cumulative through 2012)

26
Distribution for Loans or Investments, by Industry
Across industry sectors, manufacturing accounted for the largest share of total loans or
investments caused by SSBCI funding by total dollar amount.5
Retail trade, Manufacturing, and Accomodation & Food Services account for the largest
number of SSBCI loans or investments made by specific industries (excluding a broad
collection of Other and Other Services).
Besides Manufacturing, Professional, Scientific & Technical Services, and Retail Trade
(excluding a broad collection of Other industries) accounted for large shares of SSBCI
loans or investments by total dollar amount.
5“Other” category includes: Agriculture, Forestry, Fishing, and Hunting; Mining; Utilities; Finance, Insurance, Real
Estate and Rental and Leasing; Management of Companies and Enterprises; Administrative, Support and Waste Management; Educational Services; Health Care and Social Assistance; Arts, Entertainment and Recreation; and Public Administration.
Figure 13: SSBCI Loans or Investments, by Industry (Cumulative though 2012)

27
Distribution for Loans or Investments, by Business Size
Nearly 80 percent of SSBCI loans or investments were made to businesses with 10 or
fewer employees.
This large number of loans or investments made to very small businesses (0 – 10 FTE)
accounts for 32 percent of the total dollar amount of loans or investments.
When adding in small businesses with 50 or fewer employees, the proportion of SSBCI-
backed loans or investments represents 96 percent of the total number awarded and 71
percent of the total dollar amounts.
Despite representing just 4 percent of the total number awarded, SSBCI loans or
investments to companies with more than 50 employees accounted for 29 percent (or
more than one of every four dollars disbursed) of the total dollar amount loaned or
invested.
Figure 14: SSBCI Loans or Investments, by Business Size (Cumulative through 2012)
FTE = Full time employee
28
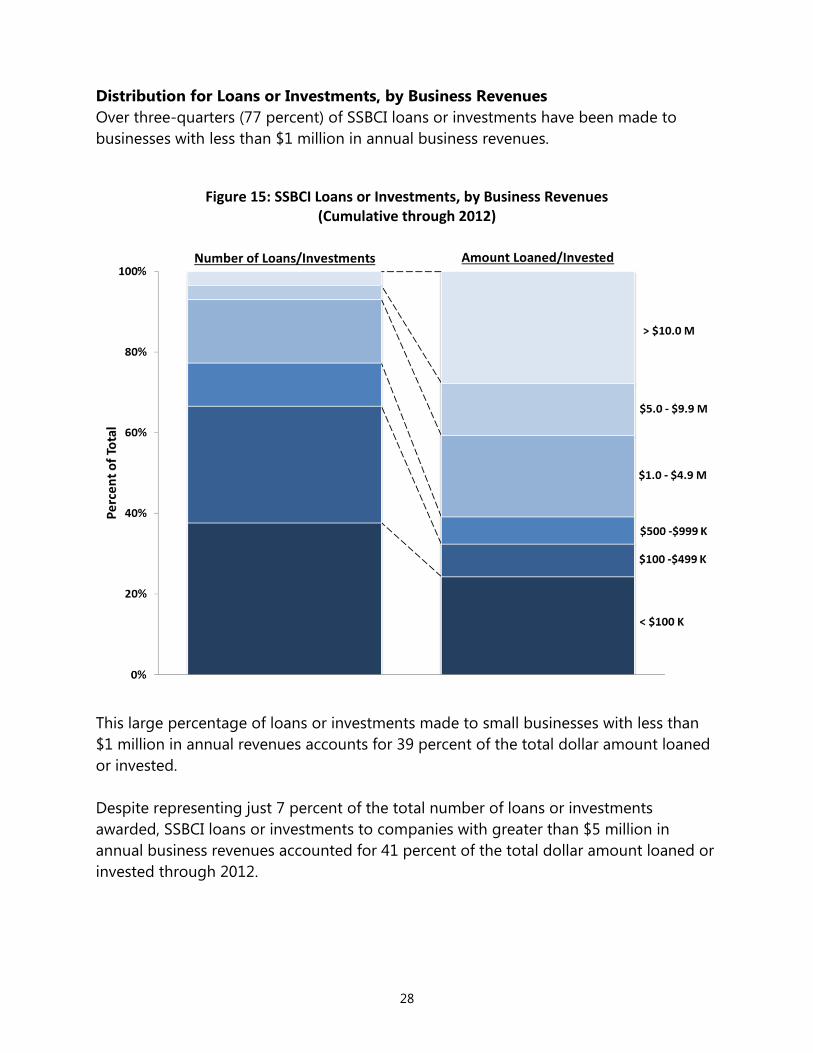
Distribution for Loans or Investments, by Business Revenues
Over three-quarters (77 percent) of SSBCI loans or investments have been made to
businesses with less than $1 million in annual business revenues.
This large percentage of loans or investments made to small businesses with less than
$1 million in annual revenues accounts for 39 percent of the total dollar amount loaned
or invested.
Despite representing just 7 percent of the total number of loans or investments
awarded, SSBCI loans or investments to companies with greater than $5 million in
annual business revenues accounted for 41 percent of the total dollar amount loaned or
invested through 2012.
Figure 15: SSBCI Loans or Investments, by Business Revenues (Cumulative through 2012)

29
Distribution for Loans or Investments, by Age of Business
Over half of all SSBCI loans or investments are to businesses less than five years old.
Likewise, a large portion of SSBCI funds, nearly 40 percent of the total dollar amount
loaned or invested, were directed to companies less than five years old.
Figure 16: SSBCI Loans or Investments, by Age of Business (Cumulative through 2012)
30
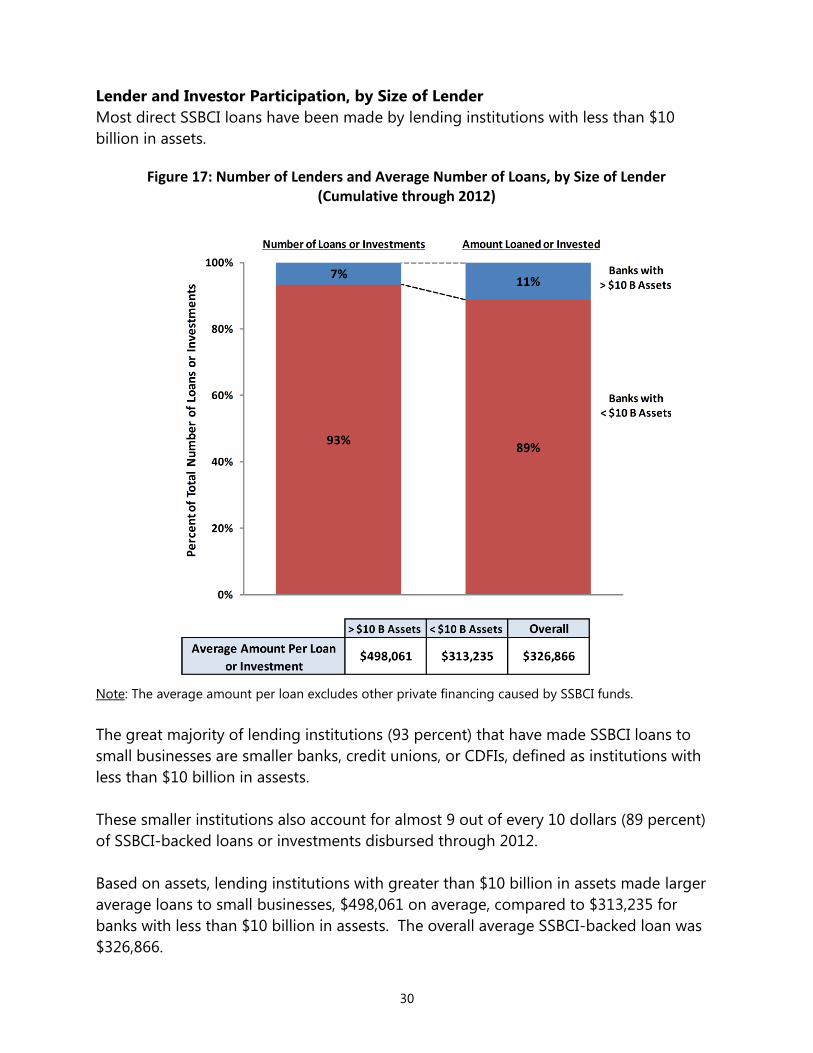
Lender and Investor Participation, by Size of Lender
Most direct SSBCI loans have been made by lending institutions with less than $10
billion in assets.
Note: The average amount per loan excludes other private financing caused by SSBCI funds.
The great majority of lending institutions (93 percent) that have made SSBCI loans to
small businesses are smaller banks, credit unions, or CDFIs, defined as institutions with
less than $10 billion in assests.
These smaller institutions also account for almost 9 out of every 10 dollars (89 percent)
of SSBCI-backed loans or investments disbursed through 2012.
Based on assets, lending institutions with greater than $10 billion in assets made larger
average loans to small businesses, $498,061 on average, compared to $313,235 for
banks with less than $10 billion in assests. The overall average SSBCI-backed loan was
$326,866.
Figure 17: Number of Lenders and Average Number of Loans, by Size of Lender (Cumulative through 2012)

31
CDFI Participation in SSBCI Programs
More than 40 percent of all direct SSBCI loans or investments have been made by
Community Development Financial Institutions (CDFIs).
CDFIs have made more than 2,000 SSBCI loans or investments, totaling $88 million,
through 2012. The total loan or investment amount excludes other financing caused by
SSBCI funding.
Figure 18: CDFI Participation in SSBCI Programs (Cumulative through 2012)

32
Washington and Minnesota made the largest dollar amounts of loans or investments
through CDFIs, followed by California, Pennsylvania and Georgia in the top five states.
As a percentage of all loans or investments caused by SSBCI funding made in a state,
CDFIs accounted for 97 percent of the total in Washington through 2012, followed by
Minnesota, Pennsylvania, New York and Georgia in the top five.
Figure 19: Amount Loaned or Invested by CDFIs
(Top 8 States, Cumulative through 2012)
33
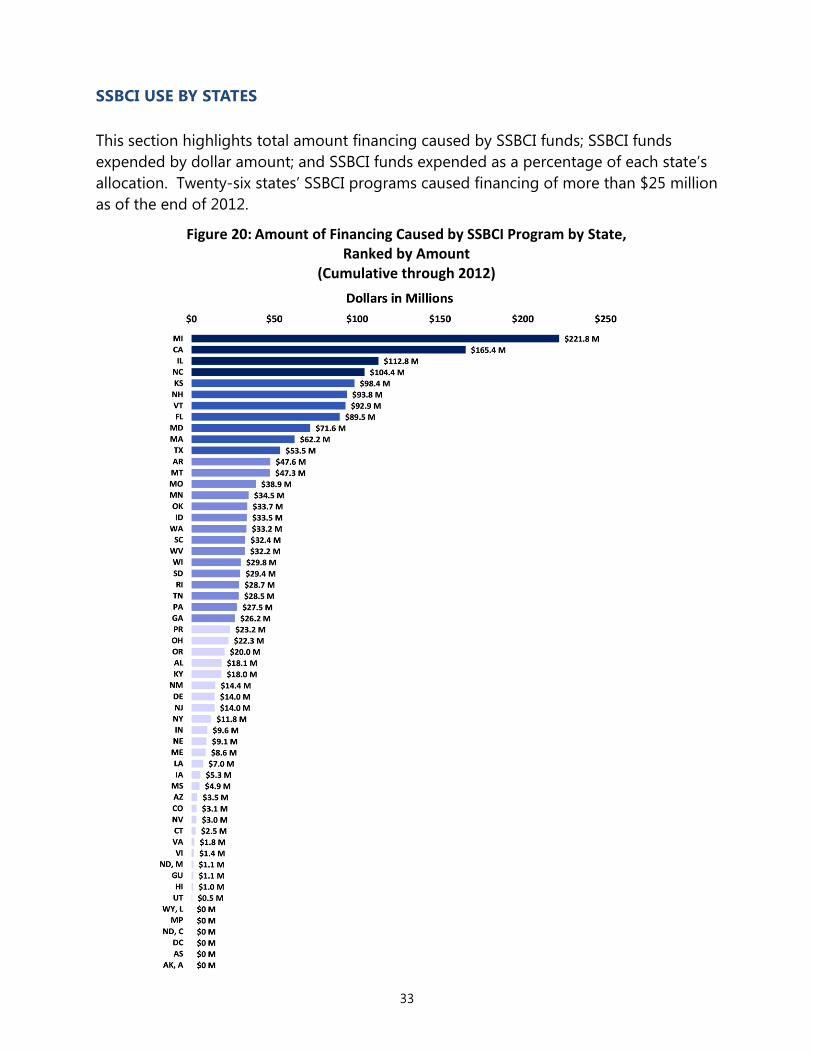
SSBCI USE BY STATES
This section highlights total amount financing caused by SSBCI funds; SSBCI funds
expended by dollar amount; and SSBCI funds expended as a percentage of each state’s
allocation. Twenty-six states’ SSBCI programs caused financing of more than $25 million
as of the end of 2012.
Figure 20: Amount of Financing Caused by SSBCI Program by State, Ranked by Amount
(Cumulative through 2012)

34
SSBCI Funds Expended by States
There is considerable variation in the dollar amount of SSBCI funds expended to support
loans or investments. Michigan expended $42 million, the largest dollar amount of any
State. Thirty states and Puerto Rico expended more than $3 million in SSBCI funds as of
the end of 2012.
Figure 21: SSBCI Funds Expended by State, Ranked by Amount (Cumulative through 2012)

35
There is considerable variation across the States in the percentage of SSBCI funds
expended to support loans or investments. Seventeen States expended more than 25
percent of their total SSBCI allocation as of the end of 2012.
.
Figure 22: SSBCI Funds Expended by State, Ranked by Percent (Cumulative through 2012)

36
CONCLUSION
SSBCI is a program designed to help business owners gain access to capital in order to
expand their operations and to create jobs. It is a vital program in the effort to foster
U.S. economic recovery. Through 2012, States expended $271 million in SSBCI funds to
support $1.9 billion in private loans and investments, or a ratio of $6.58 in private capital
for every $1 of federal contribution. Nearly 80 percent of these loans or investments
were made to small businesses with less than 10 employees.
The 4,676 loans that might not have occurred without SSBCI support helped to create or
retain 53,000 jobs as reported by the States. Additionally, 42 percent of the funds were
used in low- and moderate-income communities. This sizeable percentage indicates
that SSBCI is helping lenders and investors reach underserved communities. Two-thirds
of these loans were for less than $100,000, a very difficult loan size for most lenders to
serve.
While many measures of SSBCI program performance are encouraging, there is
considerable variation in the expenditure of SSBCI funds to support loans or investments
across the States. As the program continues to mature and even more States use a
higher proportion of their allocations, performance of the SSBCI program should
continue to progress.
37
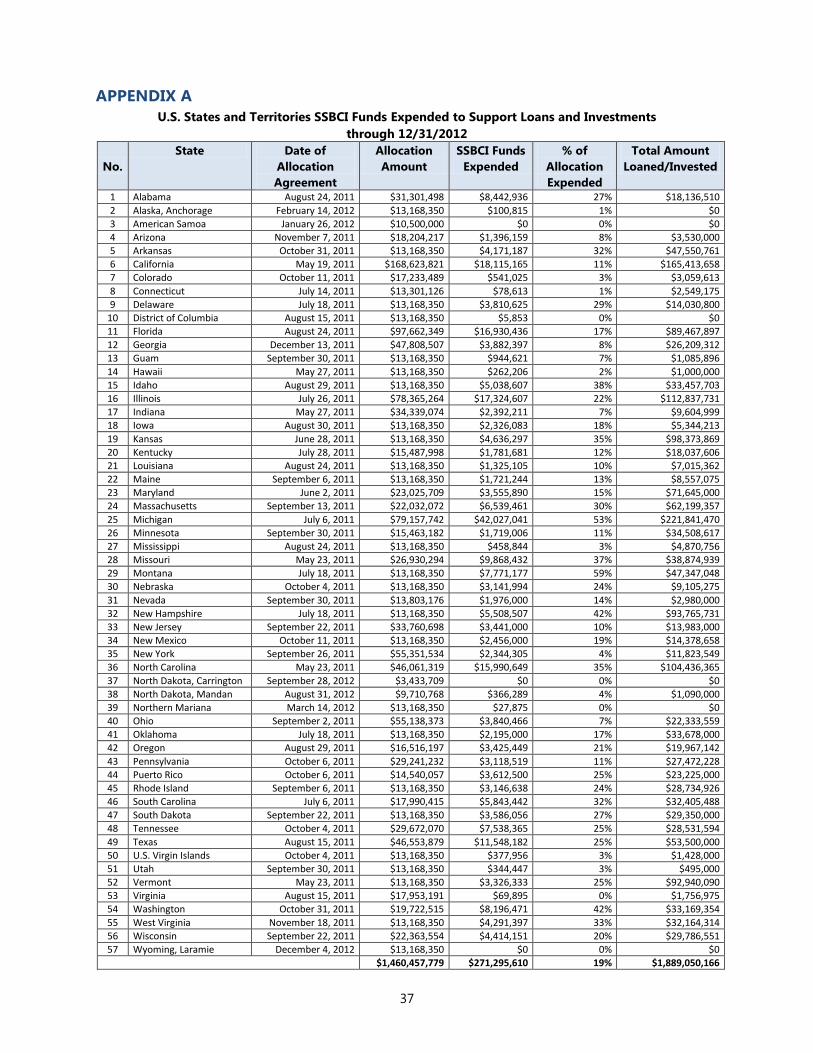
APPENDIX A
U.S. States and Territories SSBCI Funds Expended to Support Loans and Investments
through 12/31/2012
No.
State Date of
Allocation
Agreement
Allocation
Amount
SSBCI Funds
Expended
% of
Allocation
Expended
Total Amount
Loaned/Invested
1 Alabama August 24, 2011 $31,301,498 $8,442,936 27% $18,136,510
2 Alaska, Anchorage February 14, 2012 $13,168,350 $100,815 1% $0
3 American Samoa January 26, 2012 $10,500,000 $0 0% $0
4 Arizona November 7, 2011 $18,204,217 $1,396,159 8% $3,530,000
5 Arkansas October 31, 2011 $13,168,350 $4,171,187 32% $47,550,761
6 California May 19, 2011 $168,623,821 $18,115,165 11% $165,413,658
7 Colorado October 11, 2011 $17,233,489 $541,025 3% $3,059,613
8 Connecticut July 14, 2011 $13,301,126 $78,613 1% $2,549,175
9 Delaware July 18, 2011 $13,168,350 $3,810,625 29% $14,030,800
10 District of Columbia August 15, 2011 $13,168,350 $5,853 0% $0
11 Florida August 24, 2011 $97,662,349 $16,930,436 17% $89,467,897
12 Georgia December 13, 2011 $47,808,507 $3,882,397 8% $26,209,312
13 Guam September 30, 2011 $13,168,350 $944,621 7% $1,085,896
14 Hawaii May 27, 2011 $13,168,350 $262,206 2% $1,000,000
15 Idaho August 29, 2011 $13,168,350 $5,038,607 38% $33,457,703
16 Illinois July 26, 2011 $78,365,264 $17,324,607 22% $112,837,731
17 Indiana May 27, 2011 $34,339,074 $2,392,211 7% $9,604,999
18 Iowa August 30, 2011 $13,168,350 $2,326,083 18% $5,344,213
19 Kansas June 28, 2011 $13,168,350 $4,636,297 35% $98,373,869
20 Kentucky July 28, 2011 $15,487,998 $1,781,681 12% $18,037,606
21 Louisiana August 24, 2011 $13,168,350 $1,325,105 10% $7,015,362
22 Maine September 6, 2011 $13,168,350 $1,721,244 13% $8,557,075
23 Maryland June 2, 2011 $23,025,709 $3,555,890 15% $71,645,000
24 Massachusetts September 13, 2011 $22,032,072 $6,539,461 30% $62,199,357
25 Michigan July 6, 2011 $79,157,742 $42,027,041 53% $221,841,470
26 Minnesota September 30, 2011 $15,463,182 $1,719,006 11% $34,508,617
27 Mississippi August 24, 2011 $13,168,350 $458,844 3% $4,870,756
28 Missouri May 23, 2011 $26,930,294 $9,868,432 37% $38,874,939
29 Montana July 18, 2011 $13,168,350 $7,771,177 59% $47,347,048
30 Nebraska October 4, 2011 $13,168,350 $3,141,994 24% $9,105,275
31 Nevada September 30, 2011 $13,803,176 $1,976,000 14% $2,980,000
32 New Hampshire July 18, 2011 $13,168,350 $5,508,507 42% $93,765,731
33 New Jersey September 22, 2011 $33,760,698 $3,441,000 10% $13,983,000
34 New Mexico October 11, 2011 $13,168,350 $2,456,000 19% $14,378,658
35 New York September 26, 2011 $55,351,534 $2,344,305 4% $11,823,549
36 North Carolina May 23, 2011 $46,061,319 $15,990,649 35% $104,436,365
37 North Dakota, Carrington September 28, 2012 $3,433,709 $0 0% $0
38 North Dakota, Mandan August 31, 2012 $9,710,768 $366,289 4% $1,090,000
39 Northern Mariana March 14, 2012 $13,168,350 $27,875 0% $0
40 Ohio September 2, 2011 $55,138,373 $3,840,466 7% $22,333,559
41 Oklahoma July 18, 2011 $13,168,350 $2,195,000 17% $33,678,000
42 Oregon August 29, 2011 $16,516,197 $3,425,449 21% $19,967,142
43 Pennsylvania October 6, 2011 $29,241,232 $3,118,519 11% $27,472,228
44 Puerto Rico October 6, 2011 $14,540,057 $3,612,500 25% $23,225,000
45 Rhode Island September 6, 2011 $13,168,350 $3,146,638 24% $28,734,926
46 South Carolina July 6, 2011 $17,990,415 $5,843,442 32% $32,405,488
47 South Dakota September 22, 2011 $13,168,350 $3,586,056 27% $29,350,000
48 Tennessee October 4, 2011 $29,672,070 $7,538,365 25% $28,531,594
49 Texas August 15, 2011 $46,553,879 $11,548,182 25% $53,500,000
50 U.S. Virgin Islands October 4, 2011 $13,168,350 $377,956 3% $1,428,000
51 Utah September 30, 2011 $13,168,350 $344,447 3% $495,000
52 Vermont May 23, 2011 $13,168,350 $3,326,333 25% $92,940,090
53 Virginia August 15, 2011 $17,953,191 $69,895 0% $1,756,975
54 Washington October 31, 2011 $19,722,515 $8,196,471 42% $33,169,354
55 West Virginia November 18, 2011 $13,168,350 $4,291,397 33% $32,164,314
56 Wisconsin September 22, 2011 $22,363,554 $4,414,151 20% $29,786,551
57 Wyoming, Laramie December 4, 2012 $13,168,350 $0 0% $0
$1,460,457,779 $271,295,610 19% $1,889,050,166

38
APPENDIX B
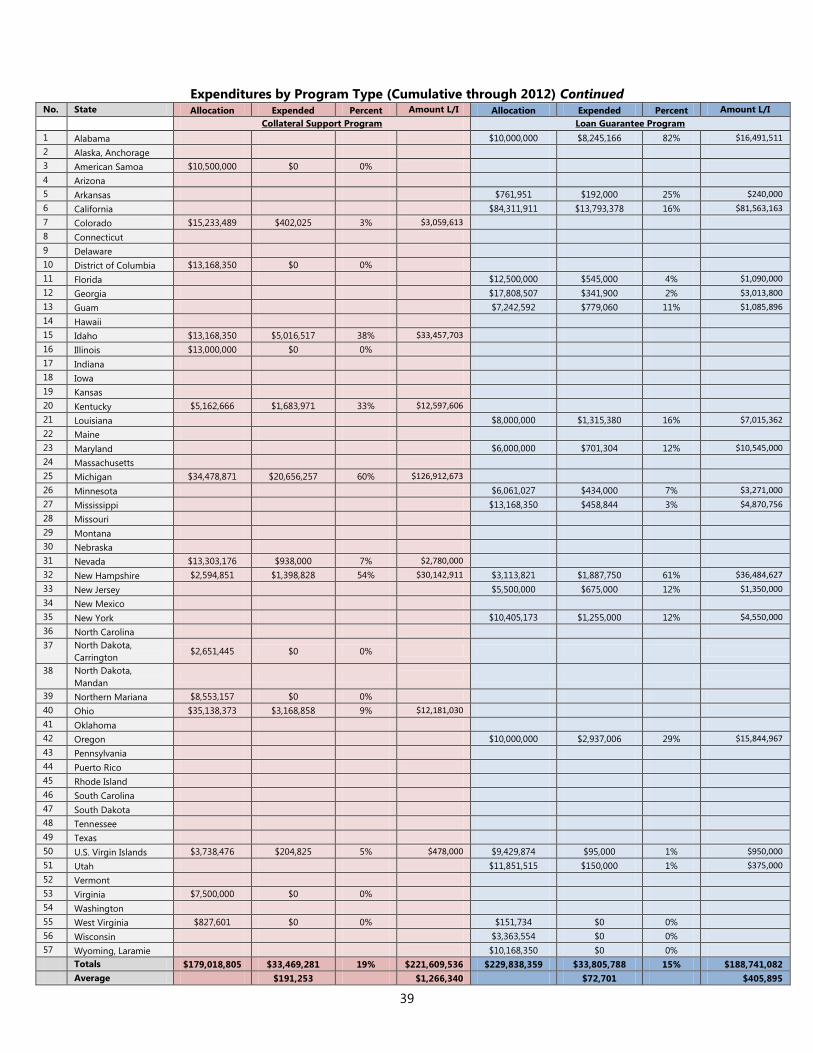
Expenditures by Program Type (Cumulative through 2012)
No. State Allocation Expended Percent Amount L/I Allocation Expended Percent Amount L/I
Loan Participation Program Capital Access Program
1 Alabama $10,000,000 $115,000 1% $1,560,000 $11,301,498 $4,250 <1% $84,999
2 Alaska, Anchorage
3 American Samoa
4 Arizona $18,204,217 $1,193,333 7% $3,530,000
5 Arkansas $5,190,312 $2,325,000 45% $31,475,000 $1,038,062 $6,076 1% $135,761
6 California $84,311,911 $3,111,445 4% $83,850,495
7 Colorado $2,000,000 $0 0%
8 Connecticut $13,301,126 $77,425 1% $2,549,175
9 Delaware $12,168,350 $3,738,925 31% $11,397,300 $1,000,000 $71,700 7% $2,633,500
10 District of Columbia
11 Florida $30,766,233 $6,127,857 20% $14,751,938 $10,896,116 $780 <1% $26,000
12 Georgia $20,000,000 $3,187,169 16% $23,195,512 $10,000,000 $0 0%
13 Guam $4,608,923 $0 0% $1,316,835 $0 0%
14 Hawaii
15 Idaho
16 Illinois $39,000,000 $11,735,203 30% $87,417,713 $6,365,264 $15,402 0% $501,000
17 Indiana $1,500,000 $90,400 6% $2,201,460
18 Iowa $3,168,350 $0 0% $5,000,000 $11,788 <1% $178,213
19 Kansas $10,534,680 $2,745,689 26% $60,167,803
20 Kentucky $5,162,666 $80,000 2% $5,400,000 $5,162,666 $1,200 <1% $40,000
21 Louisiana
22 Maine $10,168,350 $685,000 7% $4,447,050
23 Maryland $1,500,000 $495,000 33% $2,100,000
24 Massachusetts $20,532,072 $6,037,000 29% $50,778,000 $1,500,000 $355,157 24% $11,421,357
25 Michigan $34,478,871 $19,932,506 58% $74,037,992 $4,200,000 $466,340 11% $20,015,805
26 Minnesota $5,250,766 $1,004,800 19% $13,496,973 $3,113,541 $199,359 6% $17,740,644
27 Mississippi
28 Missouri $10,000,000 $0 0%
29 Montana $13,168,350 $7,698,370 58% $47,347,048
30 Nebraska $9,240,980 $3,050,000 33% $9,105,275
31 Nevada $500,000 $100,000 20% $200,000
32 New Hampshire $3,930,680 $1,850,000 47% $21,282,765 $1,453,117 $181,139 12% $5,855,428
33 New Jersey $23,260,698 $2,766,000 12% $12,633,000
34 New Mexico $13,168,350 $2,456,000 19% $14,378,658
35 New York $18,994,204 $339,797 2% $5,239,739
36 North Carolina $27,800,000 $13,652,420 49% $68,780,112 $8,261,319 $579,168 7% $28,337,801
37 North Dakota,
Carrington
38 North Dakota,
Mandan $9,710,768 $346,150 4% $1,090,000
39 Northern Mariana $4,615,193 $0 0%
40 Ohio $5,000,000 $304,576 6% $10,152,529
41 Oklahoma
42 Oregon $2,500,000 $300,000 12% $2,022,485 $4,016,197 $64,639 2% $2,099,690
43 Pennsylvania $24,241,232 $1,831,473 8% $15,783,575
44 Puerto Rico $12,540,057 $3,612,500 29% $23,225,000
45 Rhode Island $2,168,350 $300,000 14% $5,810,000
46 South Carolina $14,990,415 $5,718,620 38% $29,100,851 $3,000,000 $51,666 2% $3,304,637
47 South Dakota $13,168,350 $3,530,000 27% $29,350,000
48 Tennessee
49 Texas
50 U.S. Virgin Islands
51 Utah $1,316,835 $30,000 2% $120,000
52 Vermont $12,746,337 $3,299,476 26% $92,940,090 $422,013 $26,857 6%
53 Virginia $10,000,000 $0 0% $453,191 $55,009 12% $1,756,975
54 Washington $8,722,515 $8,016,400 92% $32,194,354 $6,000,000 $47,750 1% $975,000
55 West Virginia $5,388,998 $2,080,000 39% $18,507,500
56 Wisconsin $3,000,000 $0 0%
57 Wyoming, Laramie
Totals $453,911,898 $120,039,891 26% $807,625,994 $212,607,060 $6,061,923 3% $199,100,208
Average $238,648 $1,605,618 $1,839 $60,407
39
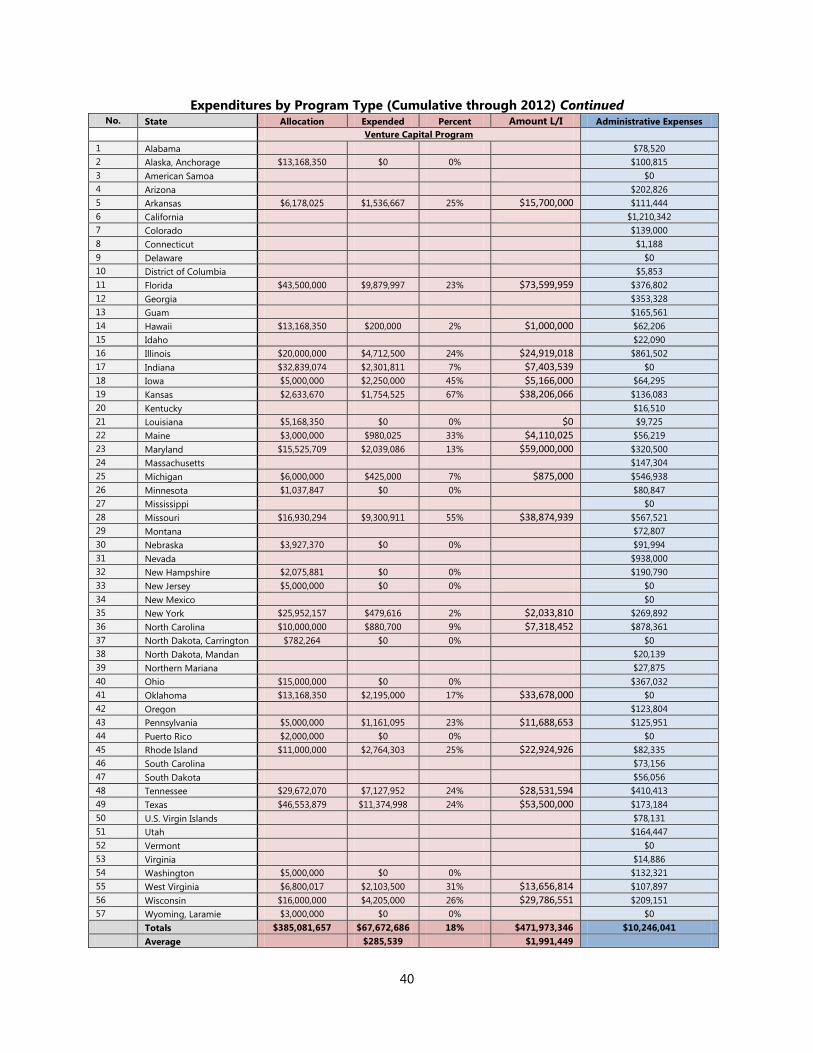
Expenditures by Program Type (Cumulative through 2012) Continued No. State Allocation Expended Percent Amount L/I Allocation Expended Percent Amount L/I
Collateral Support Program Loan Guarantee Program
1 Alabama $10,000,000 $8,245,166 82% $16,491,511
2 Alaska, Anchorage
3 American Samoa $10,500,000 $0 0%
4 Arizona
5 Arkansas $761,951 $192,000 25% $240,000
6 California $84,311,911 $13,793,378 16% $81,563,163
7 Colorado $15,233,489 $402,025 3% $3,059,613
8 Connecticut
9 Delaware
10 District of Columbia $13,168,350 $0 0%
11 Florida $12,500,000 $545,000 4% $1,090,000
12 Georgia $17,808,507 $341,900 2% $3,013,800
13 Guam $7,242,592 $779,060 11% $1,085,896
14 Hawaii
15 Idaho $13,168,350 $5,016,517 38% $33,457,703
16 Illinois $13,000,000 $0 0%
17 Indiana
18 Iowa
19 Kansas
20 Kentucky $5,162,666 $1,683,971 33% $12,597,606
21 Louisiana $8,000,000 $1,315,380 16% $7,015,362
22 Maine
23 Maryland $6,000,000 $701,304 12% $10,545,000
24 Massachusetts
25 Michigan $34,478,871 $20,656,257 60% $126,912,673
26 Minnesota $6,061,027 $434,000 7% $3,271,000
27 Mississippi $13,168,350 $458,844 3% $4,870,756
28 Missouri
29 Montana
30 Nebraska
31 Nevada $13,303,176 $938,000 7% $2,780,000
32 New Hampshire $2,594,851 $1,398,828 54% $30,142,911 $3,113,821 $1,887,750 61% $36,484,627
33 New Jersey $5,500,000 $675,000 12% $1,350,000
34 New Mexico
35 New York $10,405,173 $1,255,000 12% $4,550,000
36 North Carolina
37 North Dakota,
Carrington $2,651,445 $0 0%
38 North Dakota,
Mandan
39 Northern Mariana $8,553,157 $0 0%
40 Ohio $35,138,373 $3,168,858 9% $12,181,030
41 Oklahoma
42 Oregon $10,000,000 $2,937,006 29% $15,844,967
43 Pennsylvania
44 Puerto Rico
45 Rhode Island
46 South Carolina
47 South Dakota
48 Tennessee
49 Texas
50 U.S. Virgin Islands $3,738,476 $204,825 5% $478,000 $9,429,874 $95,000 1% $950,000
51 Utah $11,851,515 $150,000 1% $375,000
52 Vermont
53 Virginia $7,500,000 $0 0%
54 Washington
55 West Virginia $827,601 $0 0% $151,734 $0 0%
56 Wisconsin $3,363,554 $0 0%
57 Wyoming, Laramie $10,168,350 $0 0%
Totals $179,018,805 $33,469,281 19% $221,609,536 $229,838,359 $33,805,788 15% $188,741,082
Average $191,253 $1,266,340 $72,701 $405,895
40
Expenditures by Program Type (Cumulative through 2012) Continued No. State Allocation Expended Percent Amount L/I Administrative Expenses
Venture Capital Program
1 Alabama $78,520
2 Alaska, Anchorage $13,168,350 $0 0% $100,815
3 American Samoa $0
4 Arizona $202,826
5 Arkansas $6,178,025 $1,536,667 25% $15,700,000 $111,444
6 California $1,210,342
7 Colorado $139,000
8 Connecticut $1,188
9 Delaware $0
10 District of Columbia $5,853
11 Florida $43,500,000 $9,879,997 23% $73,599,959 $376,802
12 Georgia $353,328
13 Guam $165,561
14 Hawaii $13,168,350 $200,000 2% $1,000,000 $62,206
15 Idaho $22,090
16 Illinois $20,000,000 $4,712,500 24% $24,919,018 $861,502
17 Indiana $32,839,074 $2,301,811 7% $7,403,539 $0
18 Iowa $5,000,000 $2,250,000 45% $5,166,000 $64,295
19 Kansas $2,633,670 $1,754,525 67% $38,206,066 $136,083
20 Kentucky $16,510
21 Louisiana $5,168,350 $0 0% $0 $9,725
22 Maine $3,000,000 $980,025 33% $4,110,025 $56,219
23 Maryland $15,525,709 $2,039,086 13% $59,000,000 $320,500
24 Massachusetts $147,304
25 Michigan $6,000,000 $425,000 7% $875,000 $546,938
26 Minnesota $1,037,847 $0 0% $80,847
27 Mississippi $0
28 Missouri $16,930,294 $9,300,911 55% $38,874,939 $567,521
29 Montana $72,807
30 Nebraska $3,927,370 $0 0% $91,994
31 Nevada $938,000
32 New Hampshire $2,075,881 $0 0% $190,790
33 New Jersey $5,000,000 $0 0% $0
34 New Mexico $0
35 New York $25,952,157 $479,616 2% $2,033,810 $269,892
36 North Carolina $10,000,000 $880,700 9% $7,318,452 $878,361
37 North Dakota, Carrington $782,264 $0 0% $0
38 North Dakota, Mandan $20,139
39 Northern Mariana $27,875
40 Ohio $15,000,000 $0 0% $367,032
41 Oklahoma $13,168,350 $2,195,000 17% $33,678,000 $0
42 Oregon $123,804
43 Pennsylvania $5,000,000 $1,161,095 23% $11,688,653 $125,951
44 Puerto Rico $2,000,000 $0 0% $0
45 Rhode Island $11,000,000 $2,764,303 25% $22,924,926 $82,335
46 South Carolina $73,156
47 South Dakota $56,056
48 Tennessee $29,672,070 $7,127,952 24% $28,531,594 $410,413
49 Texas $46,553,879 $11,374,998 24% $53,500,000 $173,184
50 U.S. Virgin Islands $78,131
51 Utah $164,447
52 Vermont $0
53 Virginia $14,886
54 Washington $5,000,000 $0 0% $132,321
55 West Virginia $6,800,017 $2,103,500 31% $13,656,814 $107,897
56 Wisconsin $16,000,000 $4,205,000 26% $29,786,551 $209,151
57 Wyoming, Laramie $3,000,000 $0 0% $0
Totals $385,081,657 $67,672,686 18% $471,973,346 $10,246,041
Average $285,539 $1,991,449

41
APPENDIX C
Top 15 Largest SSBCI Lenders, by Dollar Amount Loaned
(Cumulative through 2012)
Rank Lender
Number
of
Loans
Amount
Loaned
Average
Amount
Loaned
1 Huntington National Bank
(OH, IN, & MI) 196 $46,445,920 $236,969
2 Pacific Enterprise Bank (CA) 102 $33,359,061 $327,050
3 Amarillo National Bank (KS) 3 $30,685,569 $10,228,523
4 NewBridge Bank (NC) 44 $29,008,154 $659,276
5 Citizens Bank (MI) 4 $21,293,000 $5,323,250
6 NBT Bank, N.A. (VT) 3 $21,083,720 $7,027,907
7 M B Financial Bank N A (IL) 3 $20,500,000 $6,833,333
8 Fifth Third Bank (MI) 19 $18,594,250 $978,645
9 mBank (MI) 4 $16,476,237 $4,119,059
10 Wells Fargo Bank, NA (NM,
SD) 3 $16,328,658 $5,442,886
11 Village Bank and Trust (IL) 4 $12,855,713 $3,213,928
12 The Palmetto Bank (SC) 19 $12,100,117 $636,848
13 People’s United Bank (VT,
NH) 20 $11,594,133 $579,707
14 Plaza Bank (CA) 26 $11,165,590 $429,446
15 Opportunity Fund (CA) 1316 $10,960,236 $8,328
TOTAL 1,766 $312,450,358 $176,925
Note: This chart includes all private lenders that are not contractors for the state.

42
Top 15 Largest SSBCI Lenders, by Number of Loans
(Cumulative through 2012)
Rank Lender
Number
of
Loans
Amount
Loaned
Average
Amount
Loaned
1 Opportunity Fund (CA) 1,316 $10,960,236 $8,328
2 Huntington National Bank
(OH, IN, & MI) 196 $46,445,920 $236,969
3 Renaissance Economic
Development Corporation
(NY)
186 $4,379,500 $23,546
4 Murphy Bank(CA) 172 $4,732,372 $27,514
5 Accion San Diego (CA) 133 $2,101,425 $15,800
6 Pacific Enterprise Bank (CA) 102 $33,359,061 $327,050
7 Branch Banking and Trust
Company (FL, VA, & NC) 60 $6,499,343 $108,322
8 First Citizens Bank & Trust
Company (NC) 55 $3,143,800 $57,160
9 Chemical Bank (MI) 53 $2,467,254 $46,552
10 TMC Development Working
Solutions (CA) 50 $627,621 $12,552
11 Mutual Federal Savings
(MA) 49 $1,870,200 $38,167
12 Oakland BDC (CA) 47 $905,000 $19,255
13 NewBridge Bank (NC) 44 $29,008,154 $659,276
14 Select Bank and Trust
Company (NC) 39 $3,572,509 $91,603
15 Independent Bank (MI) 36 $1,209,134 $33,587
TOTAL 2,538 $151,281,528 $59,607
Note: This chart includes all private lenders that are not contractors for the state.


