DEPARTMENT OF TRANSPORTATION STATE OF GEORGIA PROJECT CONCEPT REPORT Project Number: HPP00‐0005‐00(448) County: Fulton P. I. Number: 0005448 Federal Route Number: N/A State Route Number: 372 The project consists of realigning the intersection of SR 372/Birmingham Hwy @ CR 27/Providence Rd/New Providence approximately 300’ to the north such that intersecting skew angle with SR 372 is 80 degrees, and improving the vertical sight distance along SR 372. The existing non‐signalized 4‐way intersection will be replaced with a roundabout. Submitted for approval: DATE __________________ ________________________________________________ Design Consultant Name and Firm Name DATE __________________ ________________________________________________ Local Government DATE __________________ ________________________________________________ District Engineer DATE __________________ ________________________________________________ Project Manager Recommendation for approval: DATE __________________ ________________________________________________ Program Control Administrator DATE __________________ ________________________________________________ State Environmental Administrator DATE___________________ ________________________________________________ State Traffic Engineer DATE___________________ ________________________________________________ Project Review Engineer DATE___________________ ________________________________________________ State Transportation Financial Management Administrator The concept as presented herein and submitted for approval is consistent with that which is included in the Regional Transportation Plan (RTP) and/or the State Transportation Improvement Program (STIP). DATE___________________ ________________________________________________ State Transportation Planning Administrator
The project consists of realigning the intersection of SR 372/Birmingham Hwy @ CR 27/Providence Rd/New Providence approximately 300’ to the north such that intersecting skew angle with SR 372 is 80 degrees, and improving the vertical sight distance along SR 372. The existing non‐signalized 4‐way intersection will be replaced with a roundabout.
Submitted for approval: DATE __________________ ________________________________________________ Design Consultant Name and Firm Name
DATE __________________ ________________________________________________ Local Government
DATE __________________ ________________________________________________ District Engineer
DATE __________________ ________________________________________________ Project Manager
Recommendation for approval: DATE __________________ ________________________________________________ Program Control Administrator
DATE __________________ ________________________________________________ State Environmental Administrator
DATE___________________ ________________________________________________ State Traffic Engineer
DATE___________________ ________________________________________________ State Transportation Financial Management Administrator The concept as presented herein and submitted for approval is consistent with that which is included in the Regional Transportation Plan (RTP) and/or the State Transportation Improvement Program (STIP). DATE___________________ ________________________________________________ State Transportation Planning Administrator
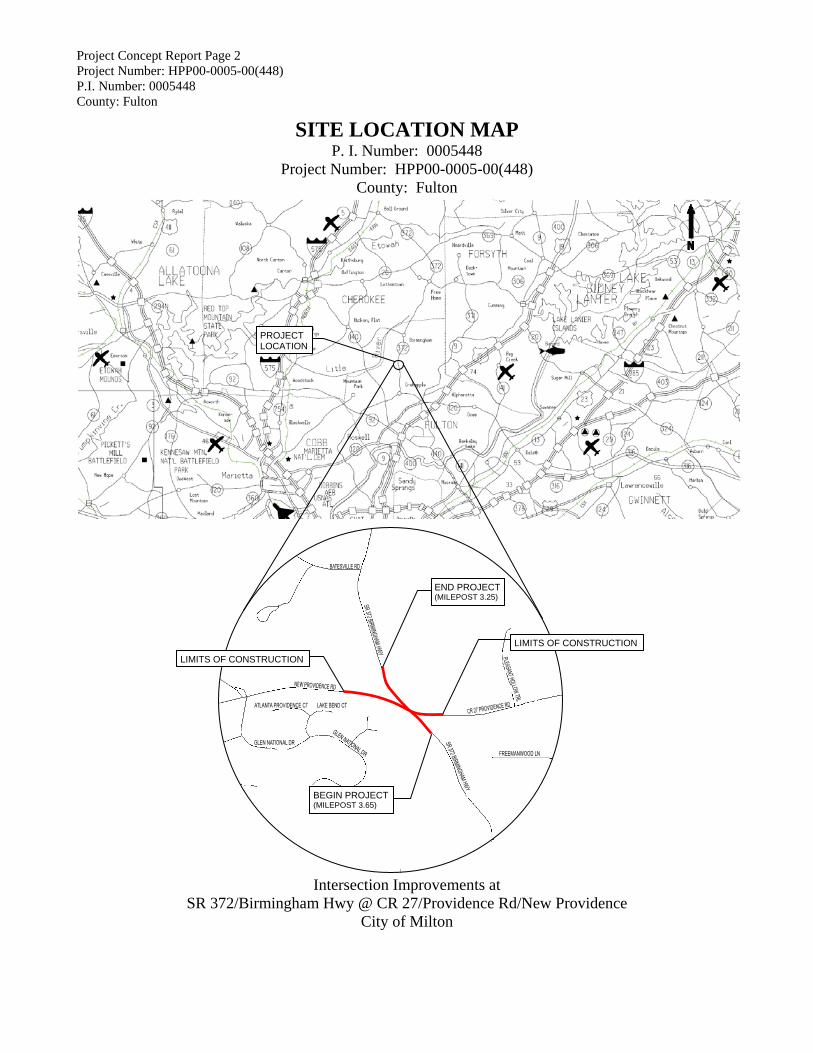
Intersection Improvements at SR 372/Birmingham Hwy @ CR 27/Providence Rd/New Providence
City of Milton
PROJECT LOCATION
LIMITS OF CONSTRUCTION
BEGIN PROJECT(MILEPOST 3.65)
END PROJECT(MILEPOST 3.25)
LIMITS OF CONSTRUCTION
Project Concept Report Page 3 Project Number: HPP00-0005-00(448) P.I. Number: 0005448 County: Fulton Need and Purpose: The purpose of the intersection improvements at SR 372/Birmingham Hwy and CR 27/Providence Rd/New Providence Rd is to alleviate traffic congestion and to improve the capacity of the intersection for current and future travel demands.
Currently the existing intersection is non-signalized with intersecting skew angles of approximately 25 degrees. The intersecting skew angle is not acceptable. According to GDOT Policy Design Manual, a 70-degree angle shall be the minimum angle for intersection in Georgia. The existing intersection does not have separate left or right turn lanes. The lack of controlled turning movements and increasing traffic volumes contribute to congestion along the SR 372 corridor.
The project is anticipated to be open for traffic use in the year 2013. Therefore, the project will be designed to accommodate traffic growth thru 2033. The tables below show the Annual Average Daily Traffic (AADT), the level of service (LOS) and accident data for the intersection. The LOS on the northbound and westbound approach to a single lane roundabout with bypasses in the PM peak hour changes from a LOS C for 2013 to a LOS F for 2033 — Using the US (NCHRP-572 model). Annual Average Daily Traffic (AADT)
Existing & No Build Levels of Service
Existing & No Build LOS Movement Existing
2009 LOS Opening
2013 LOS Design 2033
LOS AM PM AM PM AM PM
Birmingham Hwy/SR 372 at Providence Rd/CR 27
NB Thru+Lt A A A A A A SB Thru+Rt A A A A A A EB Thru+Rt F D F F F F WB Thru+Rt F F F F F F
Providence Rd SE connector at Birmingham Hwy/SR 372
NB Thru+Rt A A A A A A SB Thru A A A A A A SW Left C C D D F F
Birmingham Hwy/SR 372 SE connector at Providence Rd
NE Right B A B A C B EB Thru A A A A A A
WB Thru+Lt A A A A A A
Birmingham Hwy/ SR372 NW connector at Providence Rd
SB Right A A A A A A EB Thru+Lt A A A A A A
WB Thru A A A A A A
Providence Rd NW connector at Birmingham Hwy/SR 372
Description of the proposed project: The existing intersection of SR 372/Birmingham Hwy and CR 27/Providence Rd/New Providence Rd is a non-signalized 4-way intersection with an approximate skew angle of 25 degrees. Both SR 372 and CR 27 are two-lane roads. In the southeast quadrant of the intersection there is a minor residential development. The intersection is located in North Fulton County in the City of Milton just north of the community of Crabapple.
The project consists of realigning the intersection of SR 372 and CR 27 approximately 300’ to the north of the existing intersection. The realignment is such that the intersecting skew angle with SR 372 is 80 degrees, which will improve the vertical sight distance along SR 372. The existing non-signalized 4-way intersection will be replaced with a roundabout with right turn bypass lanes on SR 372. The safety of this intersection will improve with the realignment and by replacing the intersection with a roundabout.
The project length is 0.40 miles along SR 372 and 0.45 miles along CR 27. To maintain traffic on site this project will be stage construction. Lighting will be added to the intersection and will be maintained by the City of Milton.
Is the project located in a PM 2.5 Non-attainment area? X Yes No This project is included in the Atlanta Regional Commission’s Envision6 Regional Transportation Plan (RTP). It is listed on the Fiscal Year 2008-2013 Transportation Improvement Program (TIP) project list by the number FN-209.
Is this project located in an Ozone Non-attainment area? X Yes No This project is included in the Atlanta Regional Commission’s Envision6 Regional Transportation Plan (RTP). It is listed on the Fiscal Year 2008-2013 Transportation Improvement Program (TIP) project list by the number FN-209.
PDP Classification: Minor Project
Federal Oversight: Exempt
Functional Classification: SR 372: Urban Minor Arterial CR 27: Urban Collector Street
U. S. Route Number(s): N/A State Route Number(s): 372
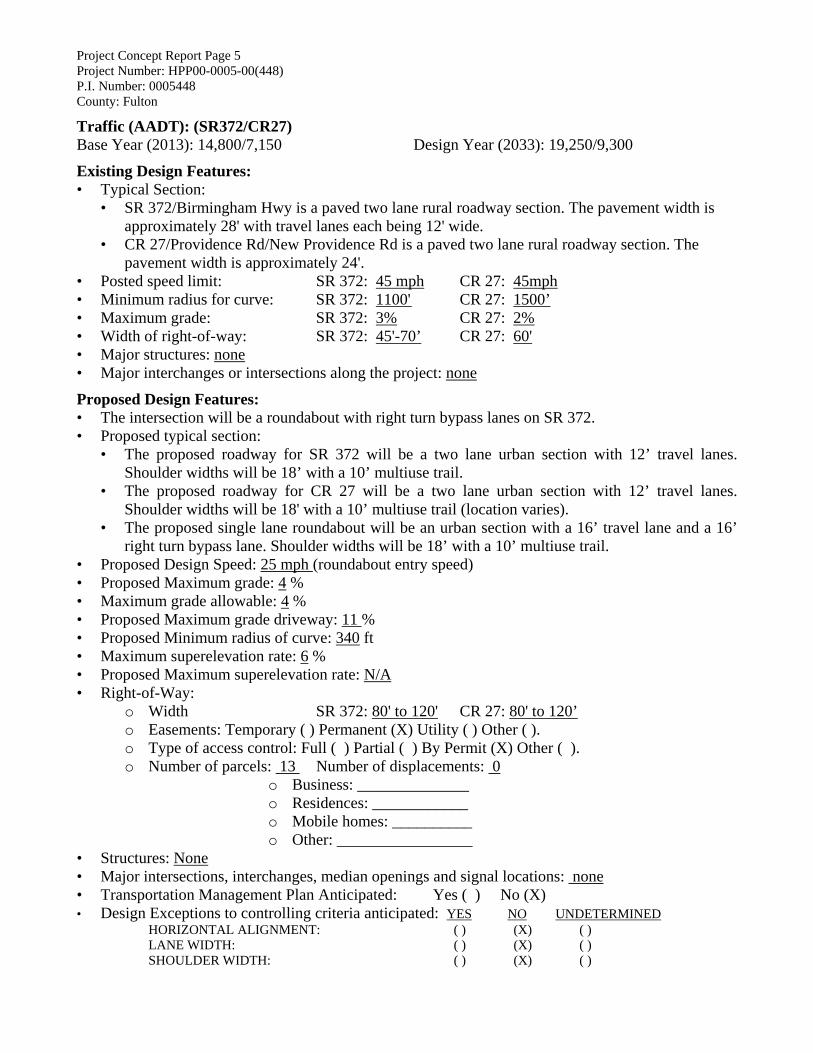
Project Concept Report Page 5 Project Number: HPP00-0005-00(448) P.I. Number: 0005448 County: Fulton Traffic (AADT): (SR372/CR27) Base Year (2013): 14,800/7,150 Design Year (2033): 19,250/9,300
Existing Design Features: • Typical Section:
• SR 372/Birmingham Hwy is a paved two lane rural roadway section. The pavement width is approximately 28' with travel lanes each being 12' wide.
• CR 27/Providence Rd/New Providence Rd is a paved two lane rural roadway section. The pavement width is approximately 24'.
• Posted speed limit: SR 372: 45 mph CR 27: 45mph • Minimum radius for curve: SR 372: 1100' CR 27: 1500’ • Maximum grade: SR 372: 3% CR 27: 2% • Width of right-of-way: SR 372: 45'-70’ CR 27: 60' • Major structures: none • Major interchanges or intersections along the project: none
Proposed Design Features: • The intersection will be a roundabout with right turn bypass lanes on SR 372. • Proposed typical section:
• The proposed roadway for SR 372 will be a two lane urban section with 12’ travel lanes. Shoulder widths will be 18’ with a 10’ multiuse trail.
• The proposed roadway for CR 27 will be a two lane urban section with 12’ travel lanes. Shoulder widths will be 18' with a 10’ multiuse trail (location varies).
• The proposed single lane roundabout will be an urban section with a 16’ travel lane and a 16’ right turn bypass lane. Shoulder widths will be 18’ with a 10’ multiuse trail.
• Proposed Design Speed: 25 mph (roundabout entry speed) • Proposed Maximum grade: 4 % • Maximum grade allowable: 4 % • Proposed Maximum grade driveway: 11 % • Proposed Minimum radius of curve: 340 ft • Maximum superelevation rate: 6 % • Proposed Maximum superelevation rate: N/A • Right-of-Way:
o Width SR 372: 80' to 120' CR 27: 80' to 120’ o Easements: Temporary ( ) Permanent (X) Utility ( ) Other ( ). o Type of access control: Full ( ) Partial ( ) By Permit (X) Other ( ). o Number of parcels: 13 Number of displacements: 0
o Business: ______________ o Residences: ____________ o Mobile homes: __________ o Other: _________________
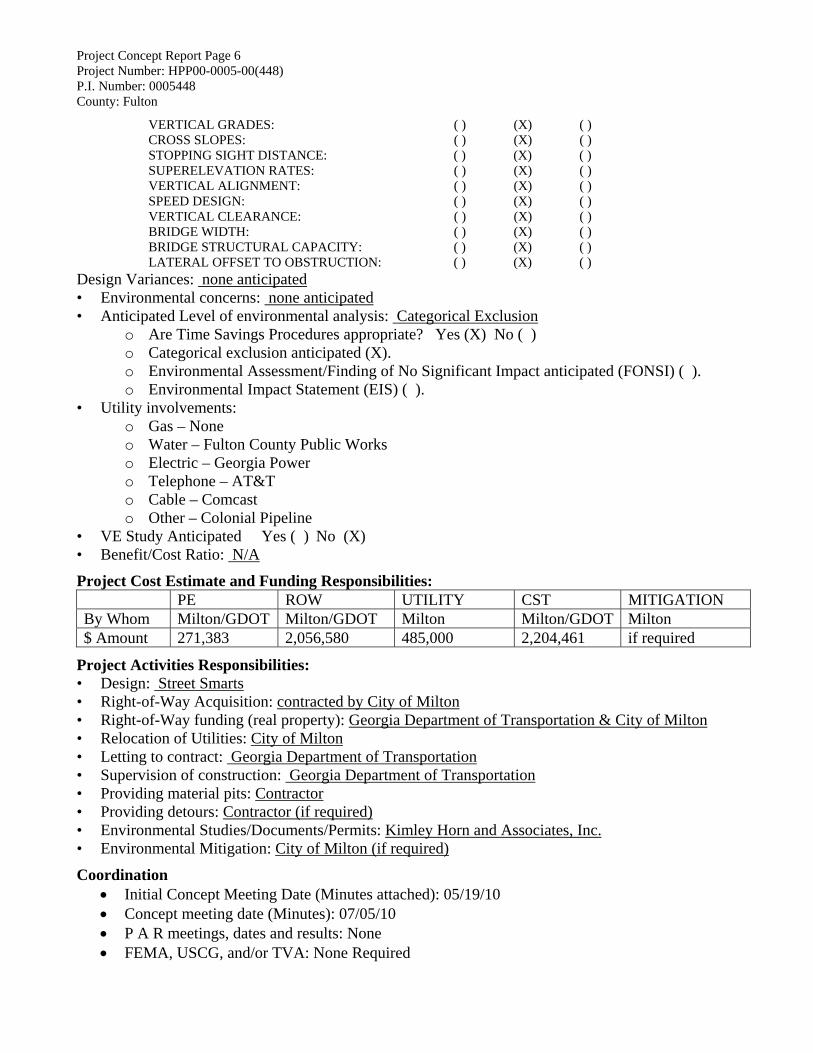
• Structures: None • Major intersections, interchanges, median openings and signal locations: none • Transportation Management Plan Anticipated: Yes ( ) No (X) • Design Exceptions to controlling criteria anticipated: YES NO UNDETERMINED
o Are Time Savings Procedures appropriate? Yes (X) No ( ) o Categorical exclusion anticipated (X). o Environmental Assessment/Finding of No Significant Impact anticipated (FONSI) ( ). o Environmental Impact Statement (EIS) ( ).
• Utility involvements: o Gas – None o Water – Fulton County Public Works o Electric – Georgia Power o Telephone – AT&T o Cable – Comcast o Other – Colonial Pipeline
• VE Study Anticipated Yes ( ) No (X) • Benefit/Cost Ratio: N/A
Project Cost Estimate and Funding Responsibilities: PE ROW UTILITY CST MITIGATION By Whom Milton/GDOT Milton/GDOT Milton Milton/GDOT Milton $ Amount 271,383 2,056,580 485,000 2,204,461 if required
Project Activities Responsibilities: • Design: Street Smarts • Right-of-Way Acquisition: contracted by City of Milton • Right-of-Way funding (real property): Georgia Department of Transportation & City of Milton • Relocation of Utilities: City of Milton • Letting to contract: Georgia Department of Transportation • Supervision of construction: Georgia Department of Transportation • Providing material pits: Contractor • Providing detours: Contractor (if required) • Environmental Studies/Documents/Permits: Kimley Horn and Associates, Inc. • Environmental Mitigation: City of Milton (if required)
Coordination • Initial Concept Meeting Date (Minutes attached): 05/19/10 • Concept meeting date (Minutes): 07/05/10 • P A R meetings, dates and results: None • FEMA, USCG, and/or TVA: None Required
• Public Involvement: Public Information Open House: 04/20/10 • Local Government Comments: • Other Projects in the area: None • Railroads: None • Other Coordination to date:
o Citizen Advisory Committee meeting(s): 01/14/10, 02/18/10, 03/23/10, 05/10/10 o GDOT Traffic Review Conference Call: 06/04/10
Scheduling – Responsible Parties’ Estimate Time to complete environmental process: 9 Months Time to complete preliminary construction plans: 11 Months Time to complete right-of-way plans: 4 Months Time to complete the Section 404 permit: N/A Time to complete final construction plans: 6 Months Time to complete the purchase of right-of-way: 18 Months List other major items that will affect the project schedule: None
Other alternates considered: Alternative 1: Realign the intersection of SR 372 and CR 27 approximately 500' to the north and
construct a 4-leg signalized intersection with dedicated turning lanes for each leg. Alternative 2: Realign the intersection of SR 372 and CR 27 approximately 300' to the north and
construct a single lane roundabout. Alternative 3: Realign CR 27 as in alternate 1 and at a 35 speed design. Alternative 4: No-Build.
Comments: Alternative 1: Traffic volumes do not warrant a signal. This alternative is eliminated. Alternative 2: This is the preferred alternative. Alternative 3: This alternate would require a design variance. This alternative is eliminated. Alternative 4: This alternative is eliminated due to the need to improve the intersection.
Attachments: 1. Detailed Cost Estimates 2. Typical Sections 3. Traffic Studies 4. Minutes of Initial Concept and Concept Team Meetings,
a. Initial Concept Meeting Date (Minutes attached): 05/19/10 b. Concept Meeting Date (Minutes attached): 07/06/10
5. Coordination Minutes: a. Citizen Advisory Committee meeting(s): 01/14/10, 02/18/10, 03/23/10, 05/10/10 b. GDOT Traffic Review Conference Call: 06/04/10
6. QC/QA Certification Letter Concur: ______________________________________________ Director of Engineering Approve: _____________________________________________ Date: _______________
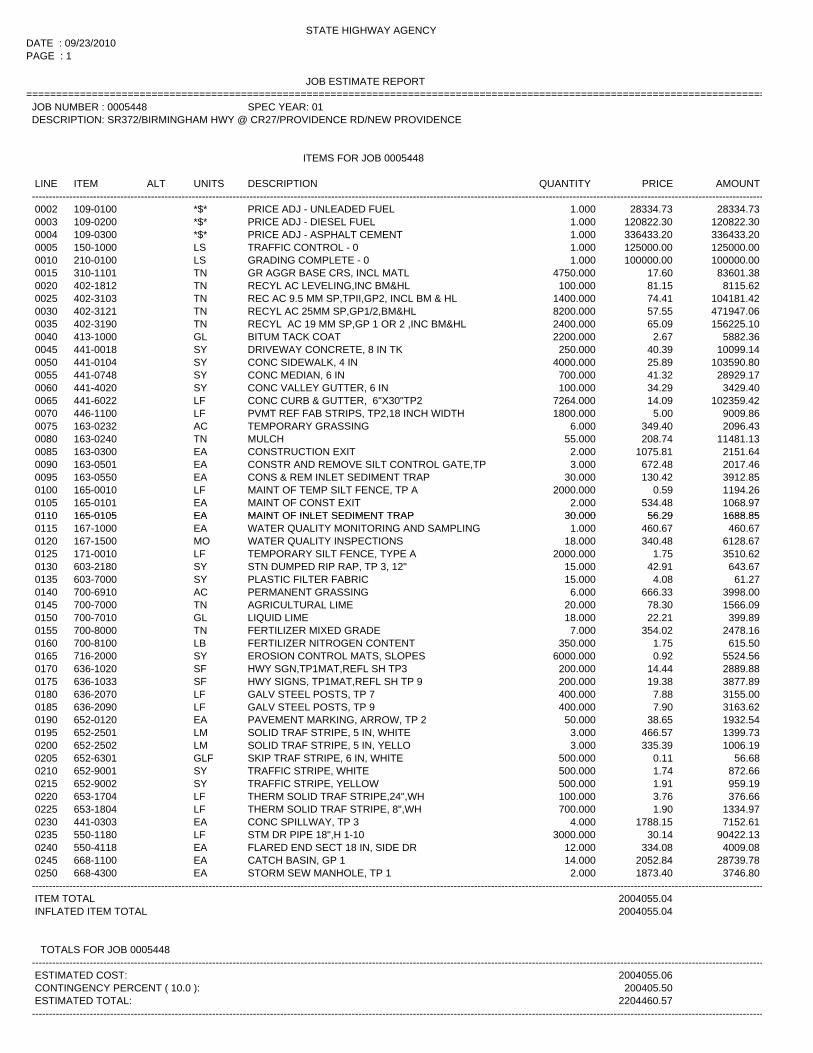
LINE ITEM ALT UNITS DESCRIPTION QUANTITY PRICE AMOUNT -----------------------------------------------------------------------------------------------------------------------------------------------------------------------------------------------------------------------
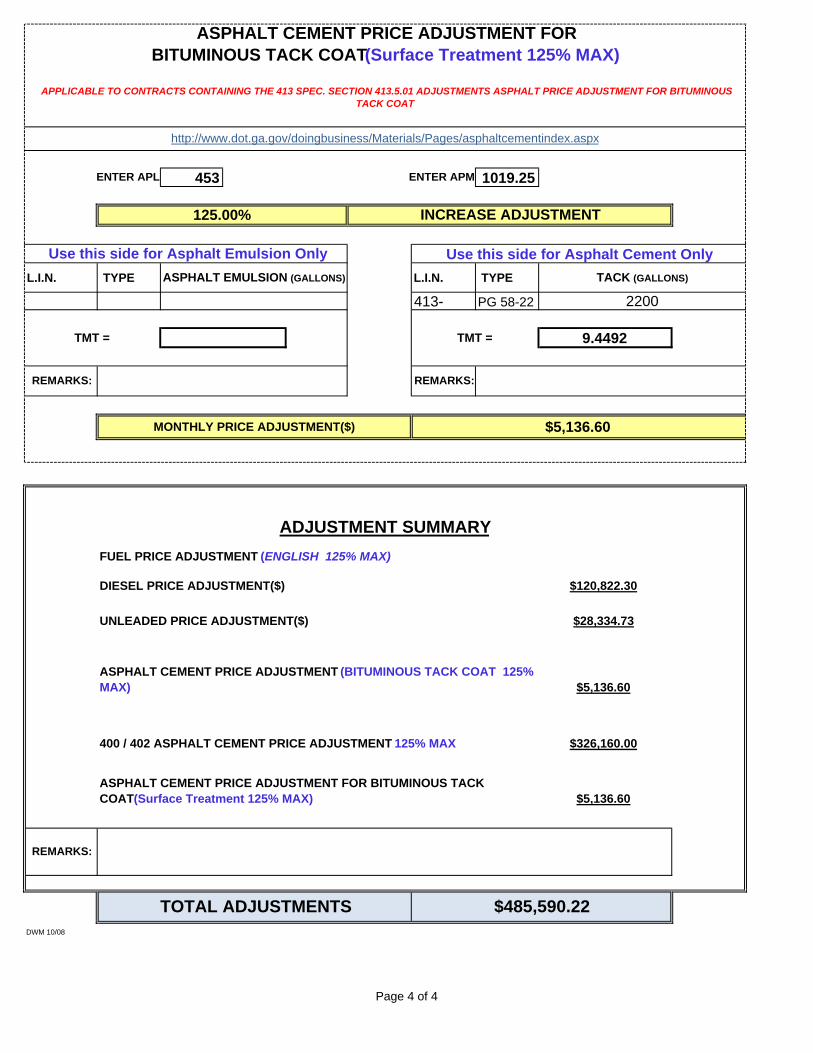
0002 109-0100 *$* PRICE ADJ - UNLEADED FUEL 1.000 28334.73 28334.730003 109-0200 *$* PRICE ADJ - DIESEL FUEL 1.000 120822.30 120822.300004 109-0300 *$* PRICE ADJ - ASPHALT CEMENT 1.000 336433.20 336433.200005 150-1000 LS TRAFFIC CONTROL - 0 1.000 125000.00 125000.000010 210-0100 LS GRADING COMPLETE - 0 1.000 100000.00 100000.000015 310-1101 TN GR AGGR BASE CRS, INCL MATL 4750.000 17.60 83601.380020 402-1812 TN RECYL AC LEVELING,INC BM&HL 100.000 81.15 8115.620025 402-3103 TN REC AC 9.5 MM SP,TPII,GP2, INCL BM & HL 1400.000 74.41 104181.420030 402-3121 TN RECYL AC 25MM SP,GP1/2,BM&HL 8200.000 57.55 471947.060035 402-3190 TN RECYL AC 19 MM SP,GP 1 OR 2 ,INC BM&HL 2400.000 65.09 156225.100040 413-1000 GL BITUM TACK COAT 2200.000 2.67 5882.360045 441-0018 SY DRIVEWAY CONCRETE, 8 IN TK 250.000 40.39 10099.140050 441-0104 SY CONC SIDEWALK, 4 IN 4000.000 25.89 103590.800055 441-0748 SY CONC MEDIAN, 6 IN 700.000 41.32 28929.170060 441-4020 SY CONC VALLEY GUTTER, 6 IN 100.000 34.29 3429.400065 441-6022 LF CONC CURB & GUTTER, 6"X30"TP2 7264.000 14.09 102359.420070 446-1100 LF PVMT REF FAB STRIPS, TP2,18 INCH WIDTH 1800.000 5.00 9009.860075 163-0232 AC TEMPORARY GRASSING 6.000 349.40 2096.430080 163-0240 TN MULCH 55.000 208.74 11481.130085 163-0300 EA CONSTRUCTION EXIT 2.000 1075.81 2151.640090 163-0501 EA CONSTR AND REMOVE SILT CONTROL GATE,TP 3.000 672.48 2017.460095 163-0550 EA CONS & REM INLET SEDIMENT TRAP 30.000 130.42 3912.850100 165-0010 LF MAINT OF TEMP SILT FENCE, TP A 2000.000 0.59 1194.260105 165-0101 EA MAINT OF CONST EXIT 2.000 534.48 1068.970110 165-0105 EA MAINT OF INLET SEDIMENT TRAP 30 000 56 29 1688 850110 165-0105 EA MAINT OF INLET SEDIMENT TRAP 30.000 56.29 1688.850115 167-1000 EA WATER QUALITY MONITORING AND SAMPLING 1.000 460.67 460.670120 167-1500 MO WATER QUALITY INSPECTIONS 18.000 340.48 6128.670125 171-0010 LF TEMPORARY SILT FENCE, TYPE A 2000.000 1.75 3510.620130 603-2180 SY STN DUMPED RIP RAP, TP 3, 12" 15.000 42.91 643.670135 603-7000 SY PLASTIC FILTER FABRIC 15.000 4.08 61.270140 700-6910 AC PERMANENT GRASSING 6.000 666.33 3998.000145 700-7000 TN AGRICULTURAL LIME 20.000 78.30 1566.090150 700-7010 GL LIQUID LIME 18.000 22.21 399.890155 700-8000 TN FERTILIZER MIXED GRADE 7.000 354.02 2478.160160 700-8100 LB FERTILIZER NITROGEN CONTENT 350.000 1.75 615.500165 716-2000 SY EROSION CONTROL MATS, SLOPES 6000.000 0.92 5524.560170 636-1020 SF HWY SGN,TP1MAT,REFL SH TP3 200.000 14.44 2889.880175 636-1033 SF HWY SIGNS, TP1MAT,REFL SH TP 9 200.000 19.38 3877.890180 636-2070 LF GALV STEEL POSTS, TP 7 400.000 7.88 3155.000185 636-2090 LF GALV STEEL POSTS, TP 9 400.000 7.90 3163.620190 652-0120 EA PAVEMENT MARKING, ARROW, TP 2 50.000 38.65 1932.540195 652-2501 LM SOLID TRAF STRIPE, 5 IN, WHITE 3.000 466.57 1399.730200 652-2502 LM SOLID TRAF STRIPE, 5 IN, YELLO 3.000 335.39 1006.190205 652-6301 GLF SKIP TRAF STRIPE, 6 IN, WHITE 500.000 0.11 56.680210 652-9001 SY TRAFFIC STRIPE, WHITE 500.000 1.74 872.660215 652-9002 SY TRAFFIC STRIPE, YELLOW 500.000 1.91 959.190220 653-1704 LF THERM SOLID TRAF STRIPE,24",WH 100.000 3.76 376.660225 653-1804 LF THERM SOLID TRAF STRIPE, 8",WH 700.000 1.90 1334.970230 441-0303 EA CONC SPILLWAY, TP 3 4.000 1788.15 7152.610235 550-1180 LF STM DR PIPE 18",H 1-10 3000.000 30.14 90422.130240 550-4118 EA FLARED END SECT 18 IN, SIDE DR 12.000 334.08 4009.080245 668-1100 EA CATCH BASIN, GP 1 14.000 2052.84 28739.780250 668-4300 EA STORM SEW MANHOLE, TP 1 2.000 1873.40 3746.80
-----------------------------------------------------------------------------------------------------------------------------------------------------------------------------------------------------------------------ITEM TOTAL 2004055.04INFLATED ITEM TOTAL 2004055.04
TOTALS FOR JOB 0005448 -----------------------------------------------------------------------------------------------------------------------------------------------------------------------------------------------------------------------
Preliminary Right of Way Cost Estimate _____________________ Phil Copeland
Right of Way Administrator By: LaShone Alexander Date: June 8, 2010 Project: SR 372/Birmingham Hwy @ CR 27/Providence Rd/New Providence P.I. Number: 0005448 Existing/Required R/W: SR 372: 45'-70’/80’-120’ CR 27: 60'/80’-120’ No. Parcels: 13 Project Termini: The project begins at SR 372 milepost 3.65 ends at milepost 3.25. Project Description: The project consists of realigning the intersection of SR 372/Birmingham Hwy @ CR 27/Providence Rd/New Providence approximately 300’ to the north such that intersecting skew angle with SR 372 is 80 degrees, and improving the vertical sight distance along SR 372. The existing non-signalized 4-way intersection will be replaced with a roundabout. Land: Commercial 1,839 s. f @ $4.00/s.f. = $7,356.00 Industrial 0 s. f @ $ /s.f. = $0.00 Residential 273,970 s. f @ $3.00/s.f. = $821,910.00 Agricultural 0 s. f @ $ /s.f. = $ 0.00 TOTAL $ 829,266.00 Improvements: Relocation:
Cost to Cure $ 0.00 $0.00 TOTAL $0.00 SUB-TOTAL: $ 829,266.00
Net Cost $829,266.00 Scheduling Contingency 55 % $456,096.30 (Net Cost + SC 55%) total $1,285,362.30
Adm/Court Cost 60 % $771,217.38 TOTAL $ 2,056,579.68 Total Cost $2,056,579.68 Note: The Market Appreciation (40%) is not included is this Preliminary Cost Estimate.
REVISED: 2-8-08
Date 9/23/2010County
2.881 2.532
6.482 5.697
DIESEL FACTOR
GALLONS DIESEL
UNLEADED FACTOR
GALLONS UNLEADED
0.29 0.15
0.29 0.15
0.29 1377.50 0.24 1140.00
2.90 0.71
2.90 35090.00 0.71 8591.00
0.25 0.20
Quantity Unit Price QF/1000 Diesel Factor Gallons DieselUnleaded
FactorGallons Unleaded
8.00 1.50
8.00 1.50
8.00 1.50
8.00 1.50
8.00 1.50
8.00 1.50
8.00 1.50
8.00 1.50
8.00 1.50
Quantity Unit Price QF/1000 Diesel Factor Gallons DieselUnleaded
FactorGallons UnleadedBRIDGE ITEMS REMARKS
HPP00-0005-00(448) SR372/CR27
BRIDGE ITEMS
Bridge Excavation (CY) Section 211
Class __Concrete (CY) Section 500
Superstru Con Class__(CY) Section 500
Concrete Handrail (LF) Section 500
Concrete Barrier (LF) Section 500
Superstru Con Class__(CY) Section 500
REMARKSQUANTITY
0005448 FULTONProject Number
Special Provision, Section 109-Measurement and Payment
FUEL PRICE ADJUSTMENT (ENGLISH 125% MAX)
P.I. Number
REMARKS
PCC Pavement paid as specified by the square yard under Section 430 (SY)
LEVEL OF SERVICE CONCEPT DESCRIPTION APPENDIX A: TRAFFIC COUNTS APPENDIX B: CAPACITY ANALYSES APPENDIX C: ROUNDABOUT ANALYSES APPENDIX D: SIGNAL WARRANT ANALYSES
DRAFT
ii City of Milton
Birmingham Hwy at Providence Rd
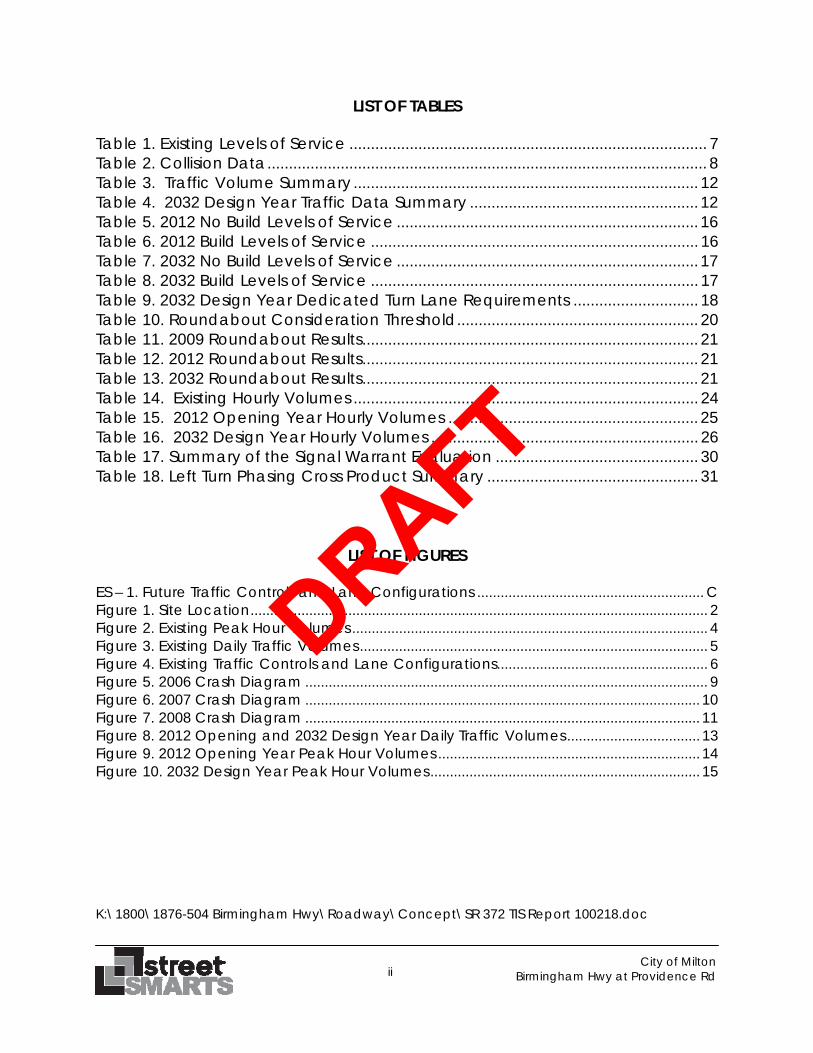
LIST OF TABLES Table 1. Existing Levels of Service ................................................................................... 7 Table 2. Collision Data ...................................................................................................... 8 Table 3. Traffic Volume Summary ................................................................................ 12 Table 4. 2032 Design Year Traffic Data Summary ..................................................... 12 Table 5. 2012 No Build Levels of Service ...................................................................... 16 Table 6. 2012 Build Levels of Service ............................................................................ 16 Table 7. 2032 No Build Levels of Service ...................................................................... 17 Table 8. 2032 Build Levels of Service ............................................................................ 17 Table 9. 2032 Design Year Dedicated Turn Lane Requirements ............................. 18 Table 10. Roundabout Consideration Threshold ........................................................ 20 Table 11. 2009 Roundabout Results .............................................................................. 21 Table 12. 2012 Roundabout Results .............................................................................. 21 Table 13. 2032 Roundabout Results .............................................................................. 21 Table 14. Existing Hourly Volumes ................................................................................ 24 Table 15. 2012 Opening Year Hourly Volumes .......................................................... 25 Table 16. 2032 Design Year Hourly Volumes .............................................................. 26 Table 17. Summary of the Signal Warrant Evaluation ............................................... 30 Table 18. Left Turn Phasing Cross Product Summary ................................................. 31
LIST OF FIGURES ES – 1. Future Traffic Controls and Lane Configurations .......................................................... C Figure 1. Site Location ..................................................................................................................... 2 Figure 2. Existing Peak Hour Volumes ........................................................................................... 4 Figure 3. Existing Daily Traffic Volumes ......................................................................................... 5 Figure 4. Existing Traffic Controls and Lane Configurations ...................................................... 6 Figure 5. 2006 Crash Diagram ....................................................................................................... 9 Figure 6. 2007 Crash Diagram ..................................................................................................... 10 Figure 7. 2008 Crash Diagram ..................................................................................................... 11 Figure 8. 2012 Opening and 2032 Design Year Daily Traffic Volumes .................................. 13 Figure 9. 2012 Opening Year Peak Hour Volumes ................................................................... 14 Figure 10. 2032 Design Year Peak Hour Volumes ..................................................................... 15 K:\1800\1876-504 Birmingham Hwy\Roadway\Concept\SR 372 TIS Report 100218.doc
DRAFT
A
City of Milton Birmingham Hwy at Providence Rd
EXECUTIVE SUMMARY This study presents an analysis of the intersection of for Birmingham Highway (SR 372) at Providence Road (CR 27) in the City of Milton, Fulton County, Georgia for future traffic conditions realigned such that Providence Road intersects Birmingham Highway with a skew angle of 70°, a proposed traffic signal, and separate dedicated turn lanes. The design year traffic conditions (2032) were evaluated to determine the appropriate storage lengths for the exclusive left and right turn lanes. The existing, opening year (2012), and design year (2032) conditions were analyzed to determine the impact of the planned intersection improvements. Based on detailed analyses of the traffic conditions, the following conclusions are drawn. Figure ES-1 illustrates the future traffic controls and lane configuration.
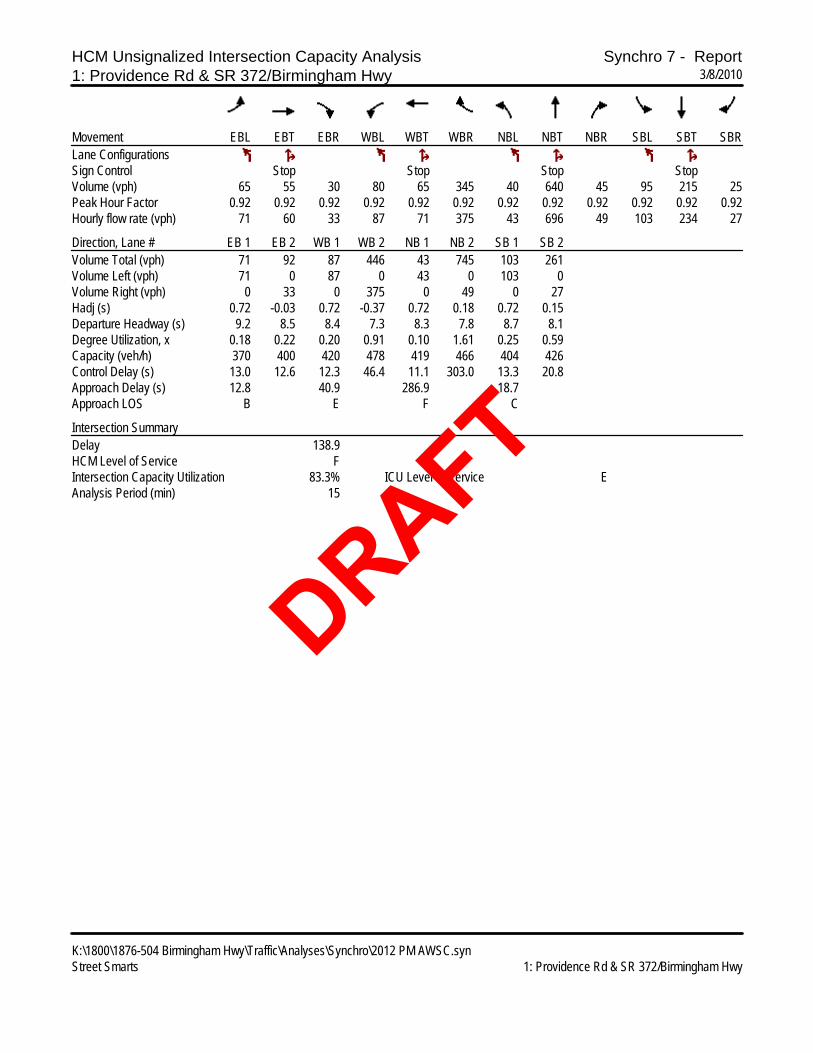
For existing, opening, and design year traffic volumes with existing lane configurations and side-street stop sign control, the study intersection operates (and is anticipated to continue operating) inadequately. The Providence Road approach operates at a Level of Service F during the morning and evening peak hours for all three no-build scenarios.
For opening and design year build-out traffic conditions the study intersection is expected to operate adequately with the planned intersection improvements. However, based on the future intersection volumes, the eight-hour minimum volume requirements to warrant consideration of permitting installation of a traffic signal are not likely to be met during the opening year.
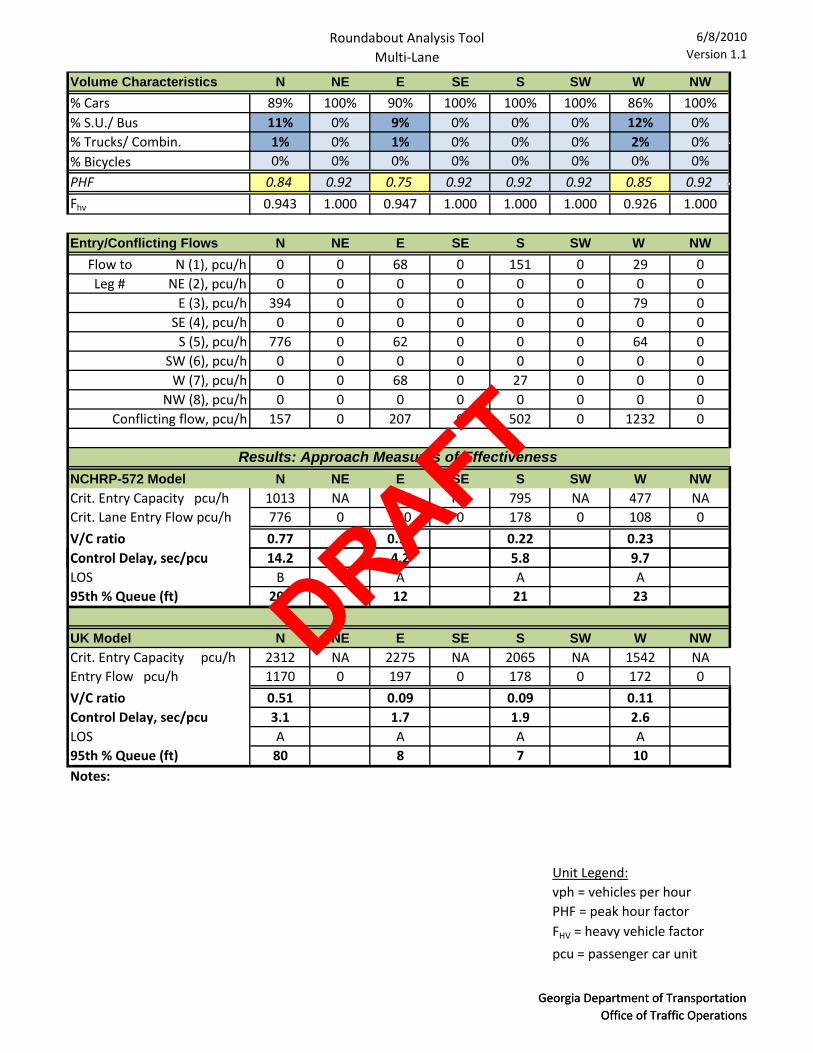
Georgia Department of Transportation Roundabout Analysis Tool version 1.1, updated September 1, 2009, was used to analyze the study intersection as a single- and multi-lane roundabout. The results are based on the NCHRP Report 572 formula as well as the UK formula referenced in the Federal Highway Administration’s (FHWA) publication entitled Roundabouts: An Informational Guide, June 2000 (Guide).
For existing, opening year and design year traffic volumes, the weekday peak hour dominant approaches to a single-lane roundabout are expected to operate inadequately according to both the NCHRP-572 and the UK models.
For existing, opening year and design year traffic volumes, the weekday peak hour dominant approaches to a multi-lane roundabout are expected to operate adequately according to both the NCHRP-572 and UK models.
DRAFT
B
City of Milton Birmingham Hwy at Providence Rd
The existing lane configurations of the study intersection has no dedicated turn lanes and a skew angle of 25° on the Providence Road approach. This approach proposed to be realigned with a skew angle of 70° to Birmingham Highway (SR 372) as well as new dedicated turning lanes installed on all approaches, and the existing side-street stop-sign control replaced with traffic signal. The intersection improvements include adding dedicated turn lanes for each movement as well as the installation of a signal at the intersection. The proposed improvements to the intersection will provide safer operations and better opportunities for turning vehicles during non-peak hours.
DRAFT
C
City of Milton Birmingham Hwy at Providence Rd
ES – 1. Future Traffic Controls and Lane Configurations
NORTH
1
SPEEDLIMITXXExisting Speed Limit
LEGEND
Existing Lane Configurations
Study Intersection #
Programmed Lane Configurations
Programmed Traffic Signal Control
372
SPEE
DLI
MIT
45
372
1
Roundabout Alternative
Traffic Signal Alternative
DRAFT
1
City of Milton Birmingham Hwy at Providence Rd
1. INTRODUCTION This study presents an analysis of the traffic impact expected to result from the planned improvement of the intersection of Birmingham Highway (SR 372) at Providence Road (CR 27). The project is located in the City of Milton, Fulton County, Georgia. The intersection redevelopment is expected to be completed by the Year 2012. Figure 1 shows the site location. The land uses surrounding the project are primarily residential. The existing 25° skewed approach of Providence Road to the intersection is proposed to be realigned with a skew angle 70° with Birmingham Highway (SR 372), new dedicated turning lanes installed on all approaches, and the existing side-street stop-sign control replaced with traffic signal. The intersection improvements include adding dedicated turn lanes for each movement as well as the installation of a signal at the intersection. In the following sections, the analysis of traffic operations is described for existing conditions, opening year conditions with and without the intersection improvements and design year conditions with and without the intersection improvements. Additionally, there is a roundabout analysis, signal warrant analysis and identification of minimum turn lane lengths. The scope of this evaluation includes the following elements:
Counting weekday hourly vehicle turning movement volumes on SR 372 and CR 27;
Projecting expected volumes in 2012 and 2032; Analyzing roundabout performance using the GDOT Roundabout Analysis
Tool; Performing signal warrant analysis of the study intersection to determine if
a traffic signal is warranted.
DRAFT
2
City of Milton Birmingham Hwy at Providence Rd
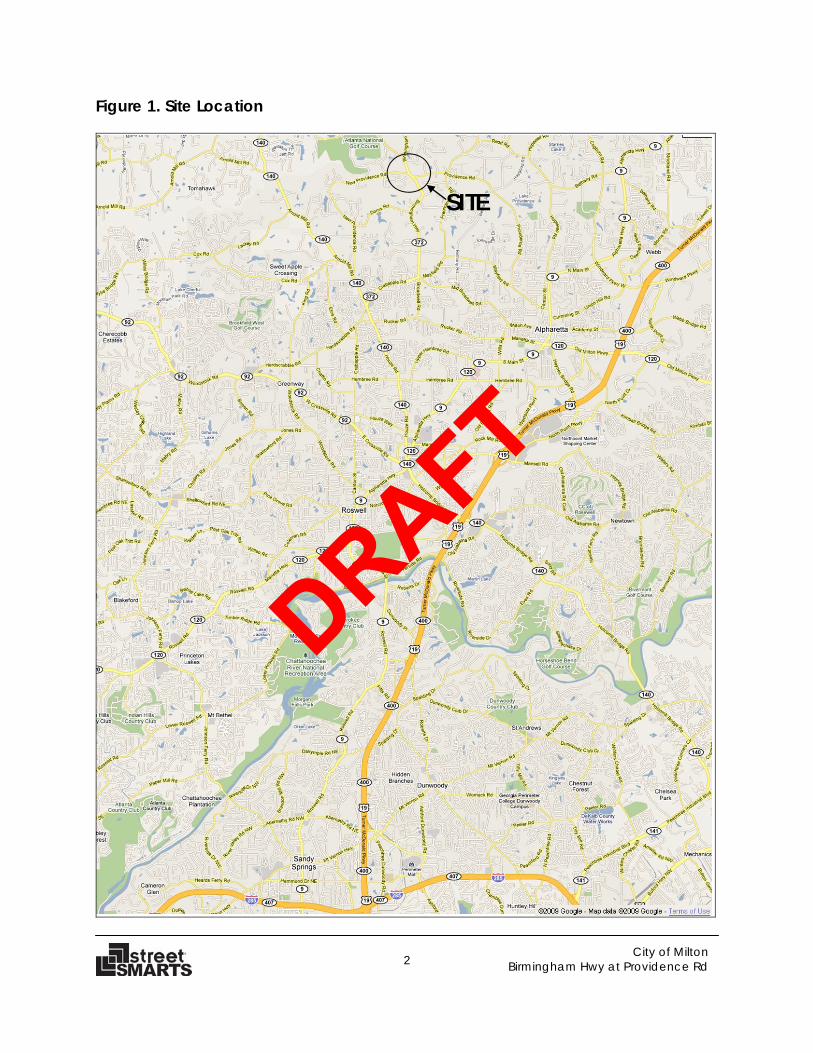
Figure 1. Site Location
SITE
DRAFT
3
City of Milton Birmingham Hwy at Providence Rd
2. EXISTING TRAFFIC CONDITIONS
Roadway Inventory To determine existing traffic conditions in the area, an inventory was made of the roads entering the intersection. The following paragraphs describe the primary road network around the studied intersection:
Birmingham Highway (SR 372) is a two-lane, Urban Minor Arterial
roadway with a posted speed of 45 mph. It runs generally north and south and intersects with SR 140 about 3.4 miles south of the site.
Providence Road (CR 27) is an Urban Collector roadway with a
posted speed of 45 mph that forms a 4-legged intersection with SR 372 and runs east and west.
Existing Traffic Volumes Weekday AM, Midday and PM peak hour turning movement traffic counts were collected on Wednesday November 11, 2009 at the intersection of SR 372 and CR 27. Weekday 24-hour directional volume counts were collected Wednesday November 11, 2009 on SR 372 north and south of CR 27, and on CR 27 east and west of SR 372. The existing traffic volumes at the intersection are shown in Table 1. Figure 2 shows the existing peak hour volumes and Figure 3 shows the daily volumes at the study intersection. The traffic count printouts are included in Appendix A. Figure 4 shows the existing traffic controls and lane configurations at the study intersections. DRAFT
4
City of Milton Birmingham Hwy at Providence Rd
Figure 2. Existing Peak Hour Volumes
DRAFT
5
City of Milton Birmingham Hwy at Providence Rd
Figure 3. Existing Daily Traffic Volumes
DRAFT
6
City of Milton Birmingham Hwy at Providence Rd
Figure 4. Existing Traffic Controls and Lane Configurations
SPEEDLIMITXXExisting Speed Limit
LEGEND
Existing Stop Sign ControlExisting Lane Configurations
Study Intersection #
NORTH
372
1
2
3
4
5
DRAFT
7
City of Milton Birmingham Hwy at Providence Rd
Capacity Analysis: Existing Conditions The results of the capacity analysis for existing conditions are presented in Table 1 and printouts are included in Appendix B.
Table 1. Existing Levels of Service
Intersection Control Approach
LOS
# Road AM Peak Hour
PM Peak Hour
1 Birmingham Hwy/SR 372 at Providence Road/CR 27
Side-Street STOP
NW A A SE A A EB F D WB F F
2 Birmingham Hwy/SR 372 at
Providence Rd southern connector
Side-Street STOP
NW A A SE A A SW C C
3 Providence Rd at
Providence Rd southern connector
Side-Street STOP
NE B A EB A A WB A A
4 Providence Rd at
Providence Rd southern connector
Side-Street STOP
SB A A EB A A WB A A
5 Birmingham Hwy/SR 372 at
Providence Rd northern connector
Side-Street STOP
NB D E NW A A SE A A
As can be seen from Table 1, the Providence Road approach operates at an inadequate Level of Service (LOS) F during both morning and evening peak hours. Installation of a traffic signal would provide the intersection with an adequate overall LOS. However, although a traffic signal would allow for safer left turns, the existing inadequate operation of Birmingham Highway (SR 372) would not be mitigated by these improvements.
DRAFT
8
City of Milton Birmingham Hwy at Providence Rd
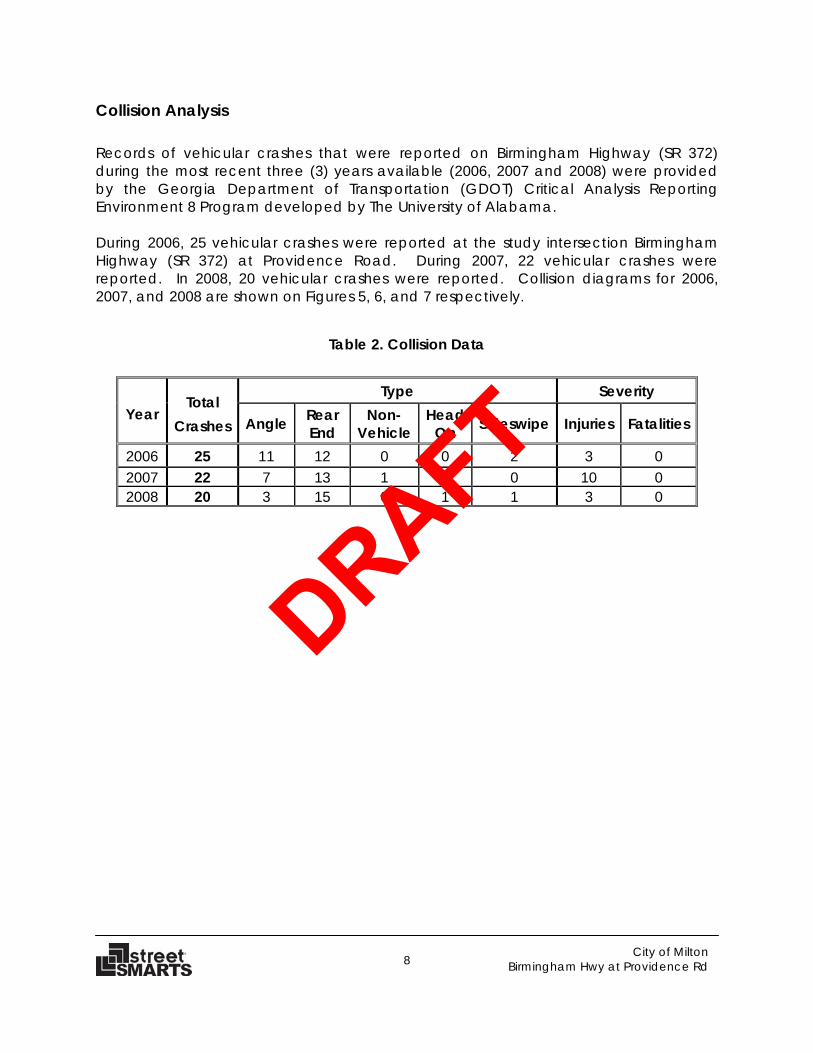
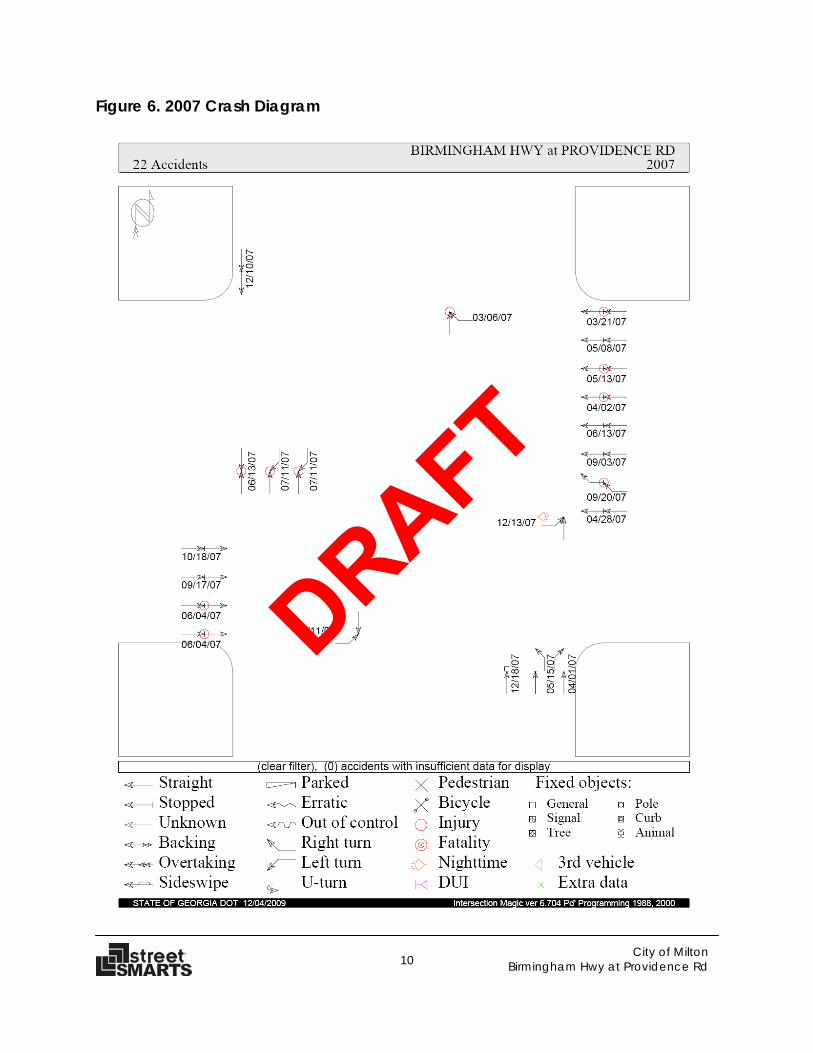
Collision Analysis Records of vehicular crashes that were reported on Birmingham Highway (SR 372) during the most recent three (3) years available (2006, 2007 and 2008) were provided by the Georgia Department of Transportation (GDOT) Critical Analysis Reporting Environment 8 Program developed by The University of Alabama. During 2006, 25 vehicular crashes were reported at the study intersection Birmingham Highway (SR 372) at Providence Road. During 2007, 22 vehicular crashes were reported. In 2008, 20 vehicular crashes were reported. Collision diagrams for 2006, 2007, and 2008 are shown on Figures 5, 6, and 7 respectively.
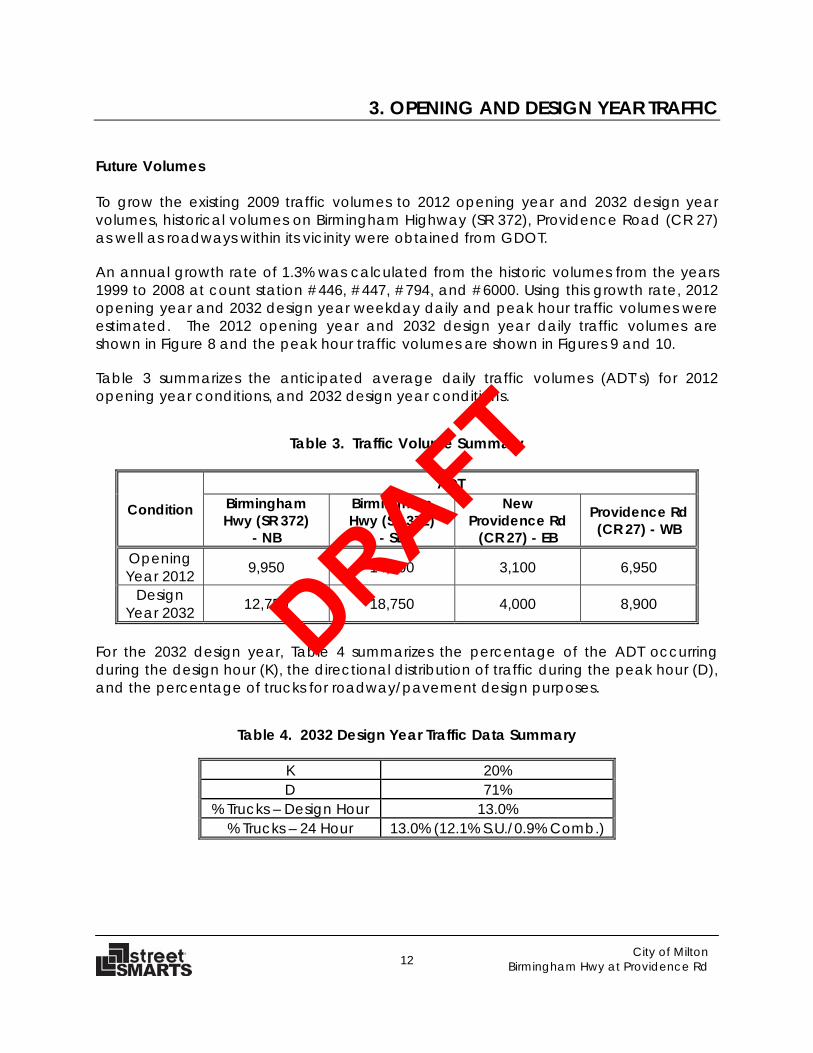
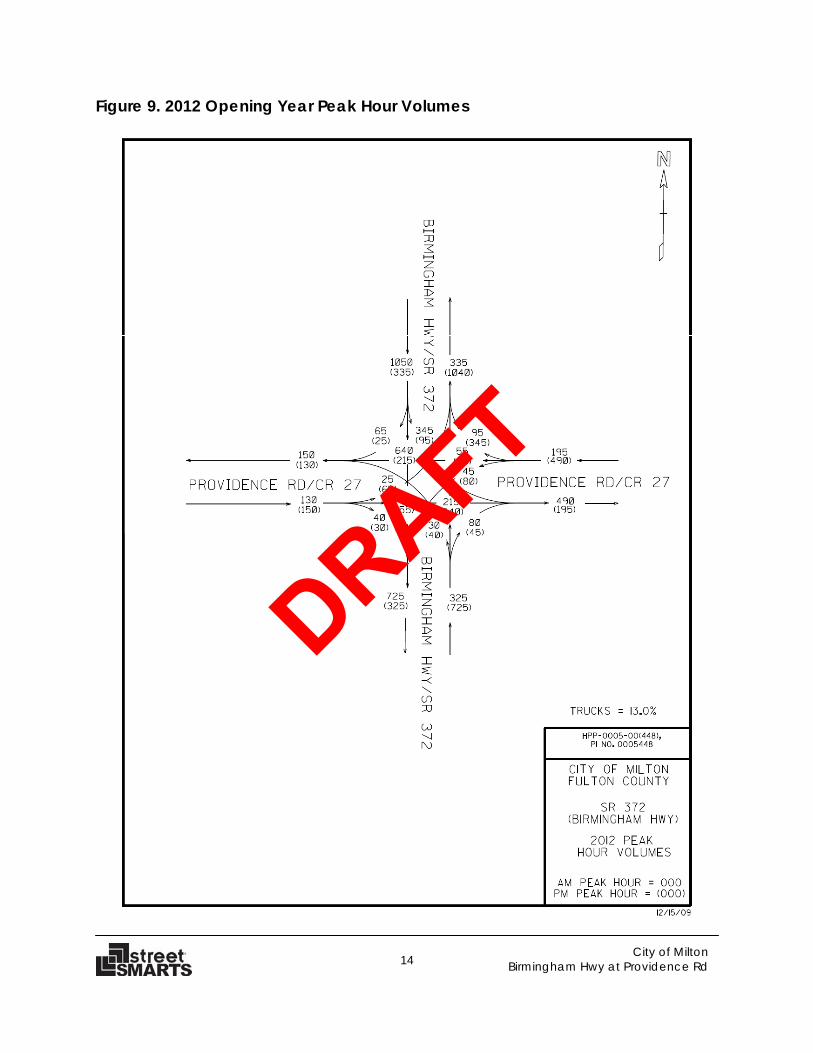
3. OPENING AND DESIGN YEAR TRAFFIC Future Volumes To grow the existing 2009 traffic volumes to 2012 opening year and 2032 design year volumes, historical volumes on Birmingham Highway (SR 372), Providence Road (CR 27) as well as roadways within its vicinity were obtained from GDOT. An annual growth rate of 1.3% was calculated from the historic volumes from the years 1999 to 2008 at count station #446, #447, #794, and #6000. Using this growth rate, 2012 opening year and 2032 design year weekday daily and peak hour traffic volumes were estimated. The 2012 opening year and 2032 design year daily traffic volumes are shown in Figure 8 and the peak hour traffic volumes are shown in Figures 9 and 10. Table 3 summarizes the anticipated average daily traffic volumes (ADT’s) for 2012 opening year conditions, and 2032 design year conditions.
Table 3. Traffic Volume Summary
Condition
ADT Birmingham Hwy (SR 372)
- NB
Birmingham Hwy (SR 372)
- SB
New Providence Rd
(CR 27) - EB
Providence Rd (CR 27) - WB
Opening Year 2012 9,950 14,600 3,100 6,950
Design Year 2032 12,750 18,750 4,000 8,900
For the 2032 design year, Table 4 summarizes the percentage of the ADT occurring during the design hour (K), the directional distribution of traffic during the peak hour (D), and the percentage of trucks for roadway/pavement design purposes.
Figure 8. 2012 Opening and 2032 Design Year Daily Traffic Volumes
DRAFT
14
City of Milton Birmingham Hwy at Providence Rd
Figure 9. 2012 Opening Year Peak Hour Volumes
DRAFT
15
City of Milton Birmingham Hwy at Providence Rd
Figure 10. 2032 Design Year Peak Hour Volumes
DRAFT
16
City of Milton Birmingham Hwy at Providence Rd
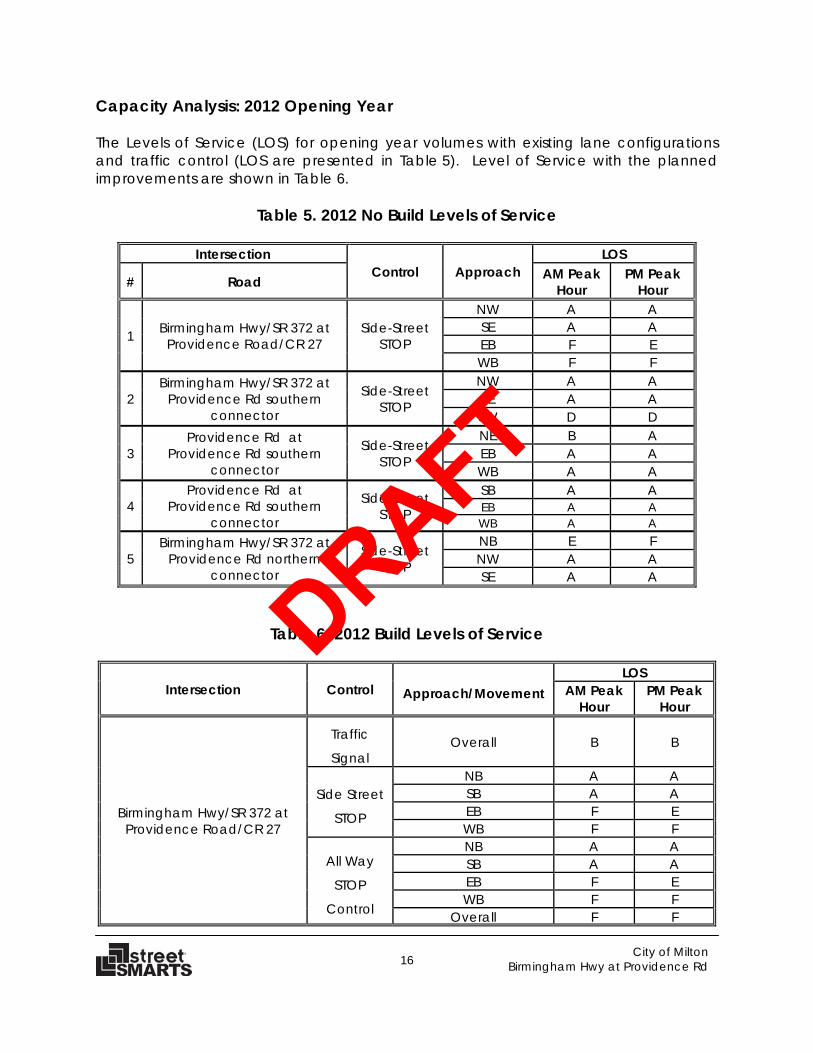
Capacity Analysis: 2012 Opening Year The Levels of Service (LOS) for opening year volumes with existing lane configurations and traffic control (LOS are presented in Table 5). Level of Service with the planned improvements are shown in Table 6.
Table 5. 2012 No Build Levels of Service
Intersection Control Approach
LOS
# Road AM Peak Hour
PM Peak Hour
1 Birmingham Hwy/SR 372 at Providence Road/CR 27
Side-Street STOP
NW A A SE A A EB F E WB F F
2 Birmingham Hwy/SR 372 at
Providence Rd southern connector
Side-Street STOP
NW A A SE A A SW D D
3 Providence Rd at
Providence Rd southern connector
Side-Street STOP
NE B A EB A A WB A A
4 Providence Rd at
Providence Rd southern connector
Side-Street STOP
SB A A EB A A WB A A
5 Birmingham Hwy/SR 372 at
Providence Rd northern connector
Side-Street STOP
NB E F NW A A SE A A
Table 6. 2012 Build Levels of Service
Intersection Control Approach/Movement LOS
AM Peak Hour
PM Peak Hour
Birmingham Hwy/SR 372 at Providence Road/CR 27
Traffic
Signal Overall B B
Side Street
STOP
NB A A SB A A EB F E WB F F
All Way
STOP
Control
NB A A SB A A EB F E WB F F
Overall F F
DRAFT
17
City of Milton Birmingham Hwy at Providence Rd
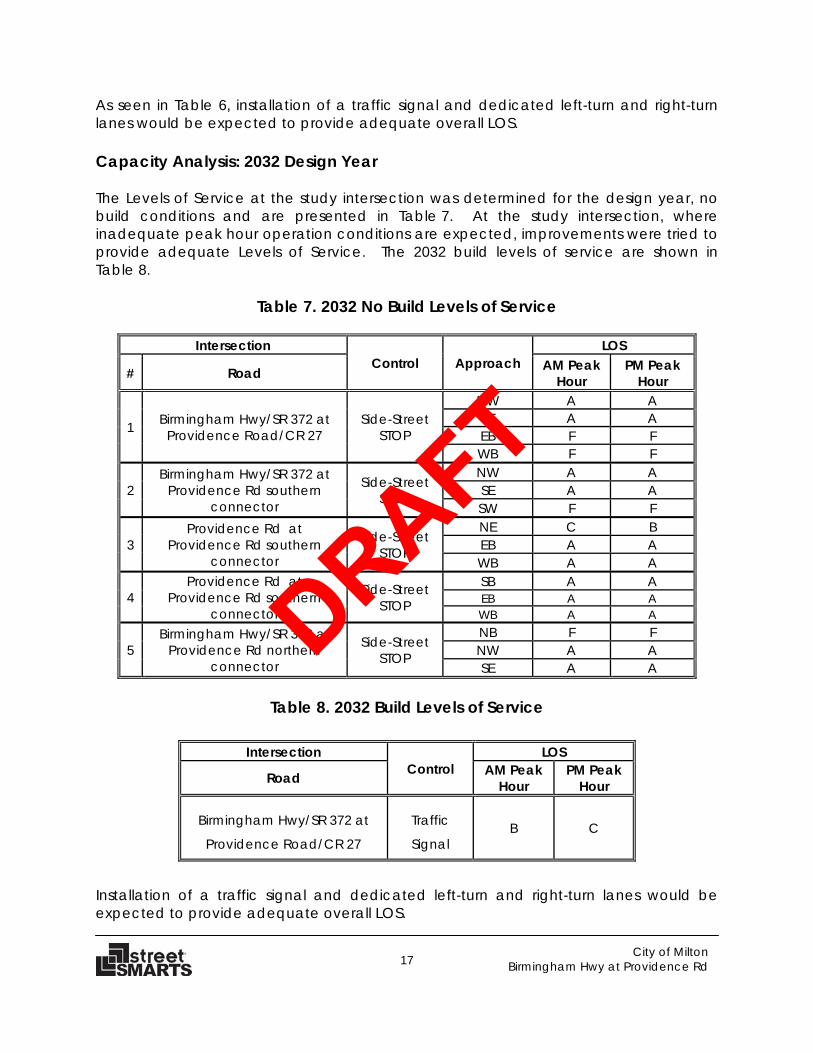
As seen in Table 6, installation of a traffic signal and dedicated left-turn and right-turn lanes would be expected to provide adequate overall LOS. Capacity Analysis: 2032 Design Year The Levels of Service at the study intersection was determined for the design year, no build conditions and are presented in Table 7. At the study intersection, where inadequate peak hour operation conditions are expected, improvements were tried to provide adequate Levels of Service. The 2032 build levels of service are shown in Table 8.
Table 7. 2032 No Build Levels of Service
Intersection Control Approach
LOS
# Road AM Peak Hour
PM Peak Hour
1 Birmingham Hwy/SR 372 at Providence Road/CR 27
Side-Street STOP
NW A A SE A A EB F F WB F F
2 Birmingham Hwy/SR 372 at
Providence Rd southern connector
Side-Street STOP
NW A A SE A A SW F F
3 Providence Rd at
Providence Rd southern connector
Side-Street STOP
NE C B EB A A WB A A
4 Providence Rd at
Providence Rd southern connector
Side-Street STOP
SB A A EB A A WB A A
5 Birmingham Hwy/SR 372 at
Providence Rd northern connector
Side-Street STOP
NB F F NW A A SE A A
Table 8. 2032 Build Levels of Service
Intersection
Control LOS
Road AM Peak Hour
PM Peak Hour
Birmingham Hwy/SR 372 at
Providence Road/CR 27
Traffic
Signal B C
Installation of a traffic signal and dedicated left-turn and right-turn lanes would be expected to provide adequate overall LOS.
DRAFT
18
City of Milton Birmingham Hwy at Providence Rd
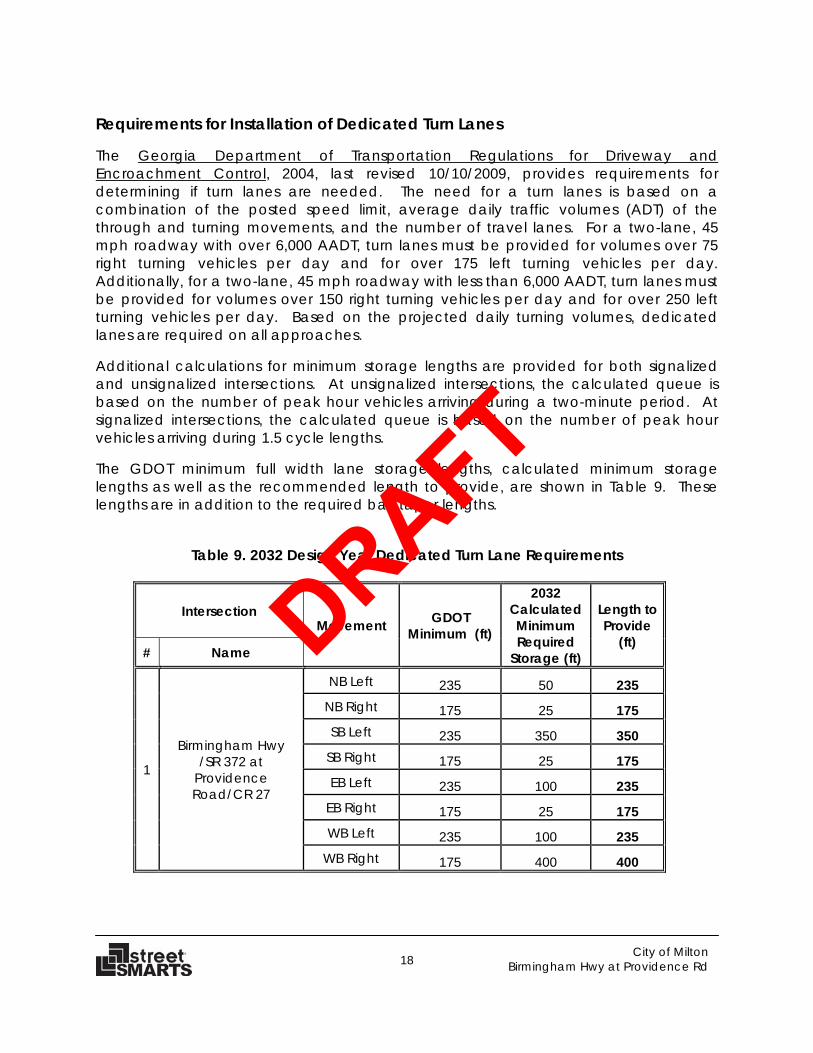
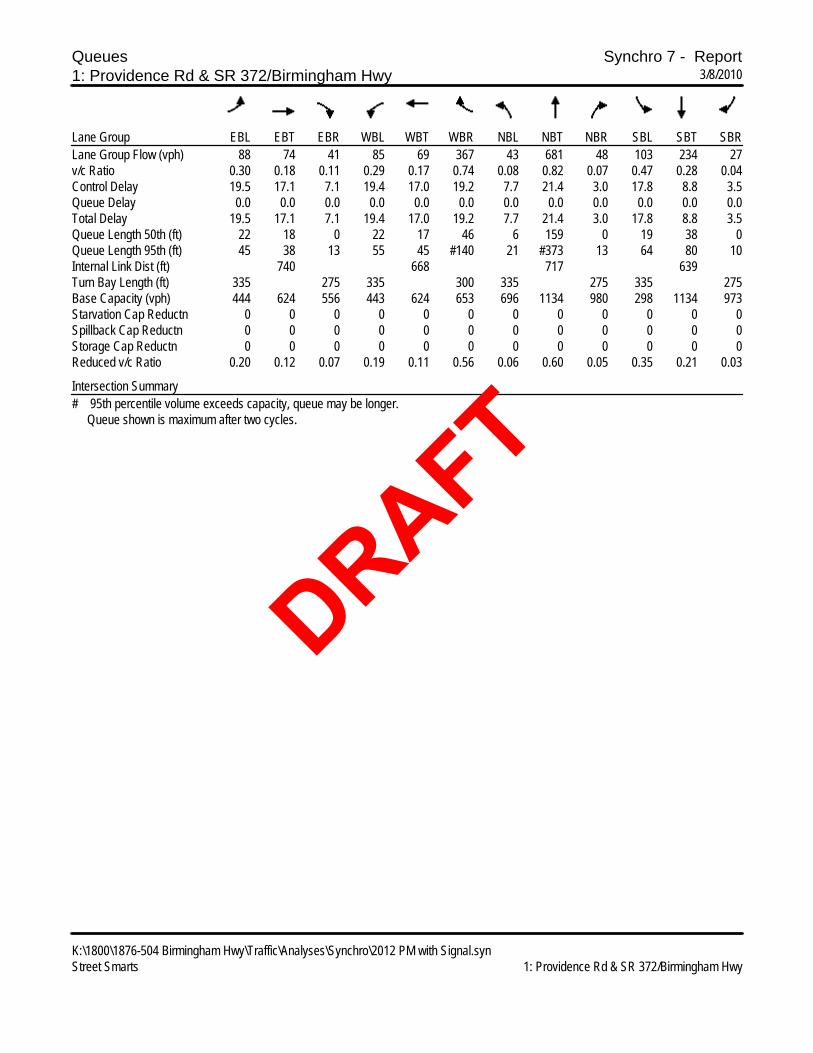
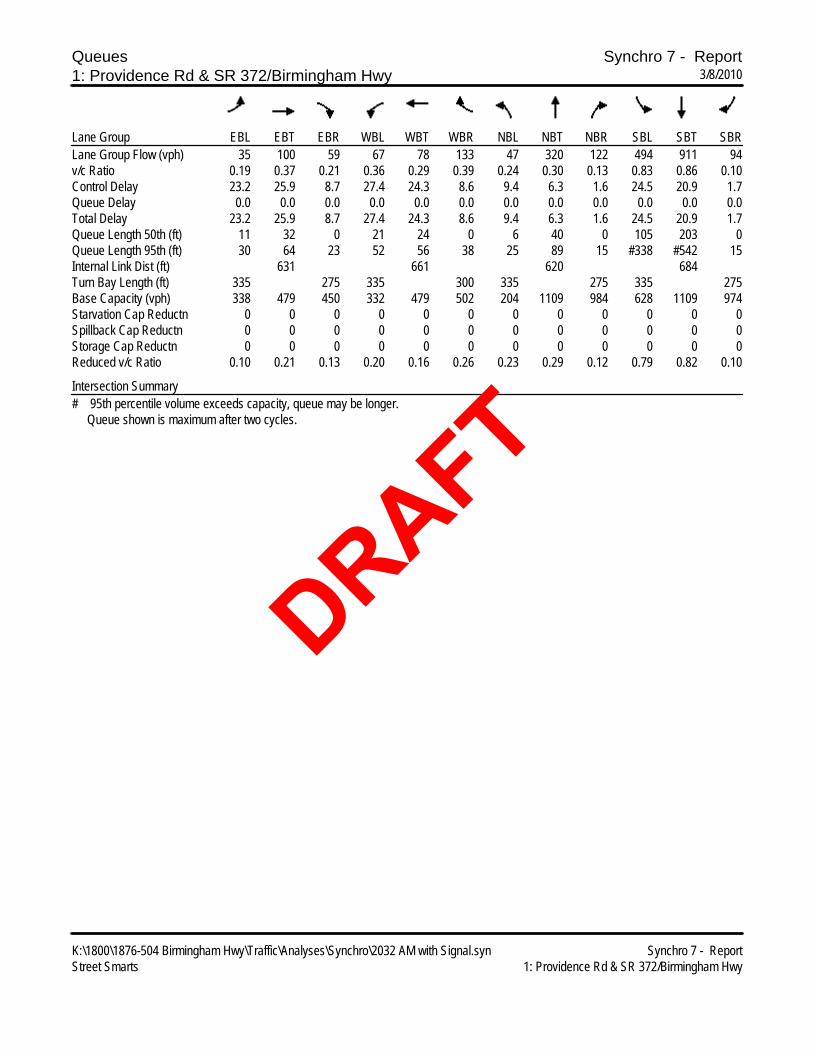
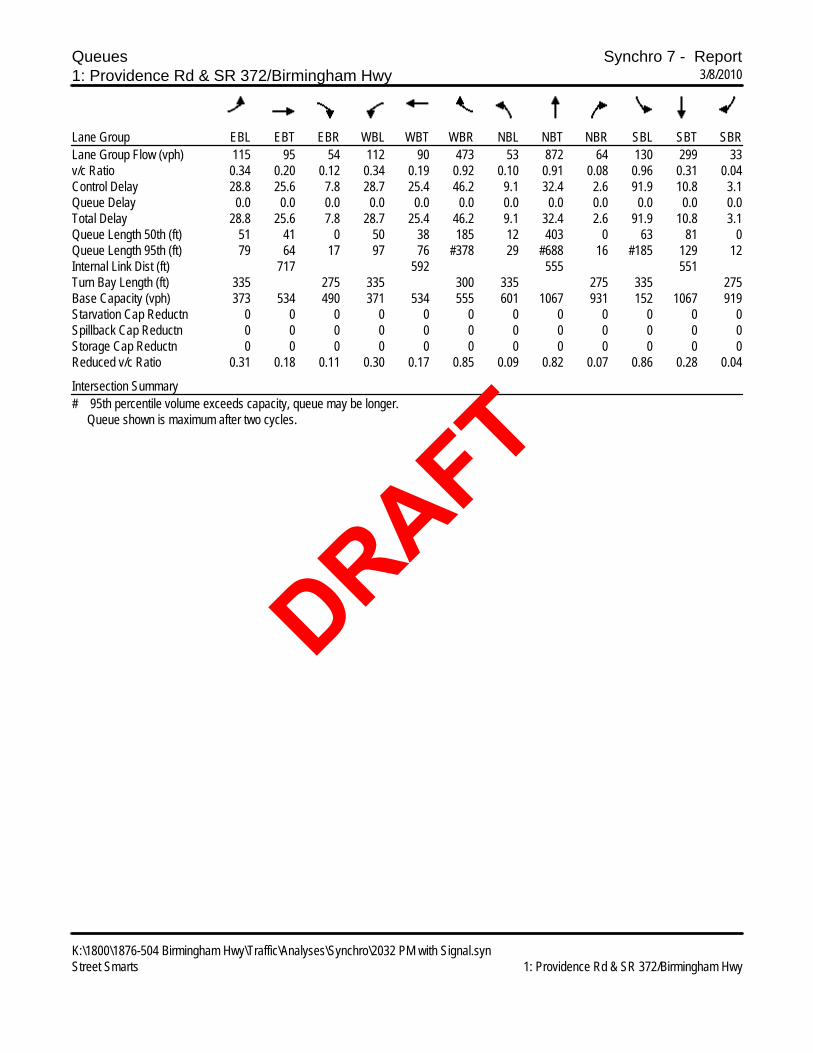
Requirements for Installation of Dedicated Turn Lanes The Georgia Department of Transportation Regulations for Driveway and Encroachment Control, 2004, last revised 10/10/2009, provides requirements for determining if turn lanes are needed. The need for a turn lanes is based on a combination of the posted speed limit, average daily traffic volumes (ADT) of the through and turning movements, and the number of travel lanes. For a two-lane, 45 mph roadway with over 6,000 AADT, turn lanes must be provided for volumes over 75 right turning vehicles per day and for over 175 left turning vehicles per day. Additionally, for a two-lane, 45 mph roadway with less than 6,000 AADT, turn lanes must be provided for volumes over 150 right turning vehicles per day and for over 250 left turning vehicles per day. Based on the projected daily turning volumes, dedicated lanes are required on all approaches. Additional calculations for minimum storage lengths are provided for both signalized and unsignalized intersections. At unsignalized intersections, the calculated queue is based on the number of peak hour vehicles arriving during a two-minute period. At signalized intersections, the calculated queue is based on the number of peak hour vehicles arriving during 1.5 cycle lengths. The GDOT minimum full width lane storage lengths, calculated minimum storage lengths as well as the recommended length to provide, are shown in Table 9. These lengths are in addition to the required bay taper lengths.
Table 9. 2032 Design Year Dedicated Turn Lane Requirements
Intersection Movement GDOT
Minimum (ft)
2032 Calculated Minimum Required
Storage (ft)
Length to Provide
(ft) # Name
1
Birmingham Hwy /SR 372 at
Providence Road/CR 27
NB Left 235 50 235 NB Right 175 25 175 SB Left 235 350 350
SB Right 175 25 175 EB Left 235 100 235
EB Right 175 25 175 WB Left 235 100 235
WB Right 175 400 400
DRAFT
19
City of Milton Birmingham Hwy at Providence Rd
The Georgia Department of Transportation (GDOT) Regulations for Driveway and Encroachment Control, last revised October 2009 provides minimum intersection sight distance criteria for driveways. The posted roadway speeds are 45 mph while the average 85th percentile speed is 53 mph on Birmingham Highway (SR 372) and 42 mph Providence Road. Given the roadway speed and lane configuration, the minimum sight distance at the study intersection 500 feet. The existing sight distance, will accommodate this requirement.
DRAFT
20
City of Milton Birmingham Hwy at Providence Rd
4. ROUNDABOUT ANALYSIS The effectiveness and operations analysis of a roundabout is measured differently than for a stop sign controlled intersection. The analysis methodology for roundabouts utilized for this project was based on information provided in the Georgia Department of Transportation Roundabout Analysis Tool version 1.1 updated September 1, 2009. The roundabout analysis methodology provides delays, volume-to-capacity (v/c) ratios, and queues for each approach to the roundabout dependent upon the geometric elements of the roundabout, the entry flow on each approach to the roundabout, and the circulating flow within the roundabout that conflicts with the entry flow from the subject approach. The results are based on the NCHRP Report 572 formula as well as the UK formula referenced in the Federal Highway Administration’s (FHWA) publication entitled Roundabouts: An Informational Guide, June 2000 (Guide). The analysis tool suggests that candidate intersections should first be analyzed to determine whether a roundabout will perform acceptably based on volume thresholds. Single lane roundabouts capacity analysis is required if the ADTs are less than 20,000 during the current/build year and/or if there is less than 80% of the intersection traffic on the main road. Additionally, capacity analysis is required for multi-lane roundabouts if the ADTs are less than 40,000 during the current/build year and/or if there is less than 80% of the intersection traffic on the main road. Table 10 shows a comparison of major and minor street volumes at the study intersection with respect to the GDOT Roundabout Analysis Tool roundabout consideration threshold.
Table 10. Roundabout Consideration Threshold
Street Type 2009 Existing Year 2012 Opening Year 2032 Design Year
ADT Split ADT Split ADT Split
Major Street (WB on SR 372) 13,053 67% 21,700 68% 26,100 68%
Minor Street (SB on CR 27) 6,389 33% 3,700 32% 4,500 32%
Further Analysis Required? Yes Yes Yes
DRAFT
21
City of Milton Birmingham Hwy at Providence Rd
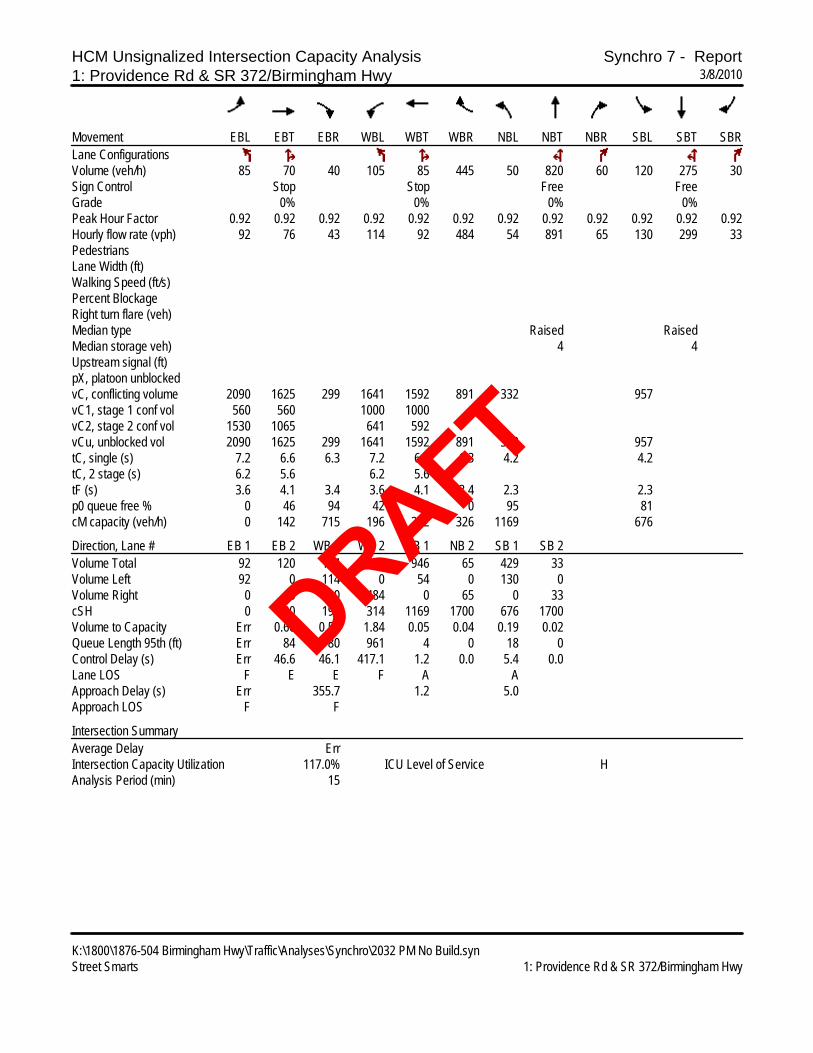
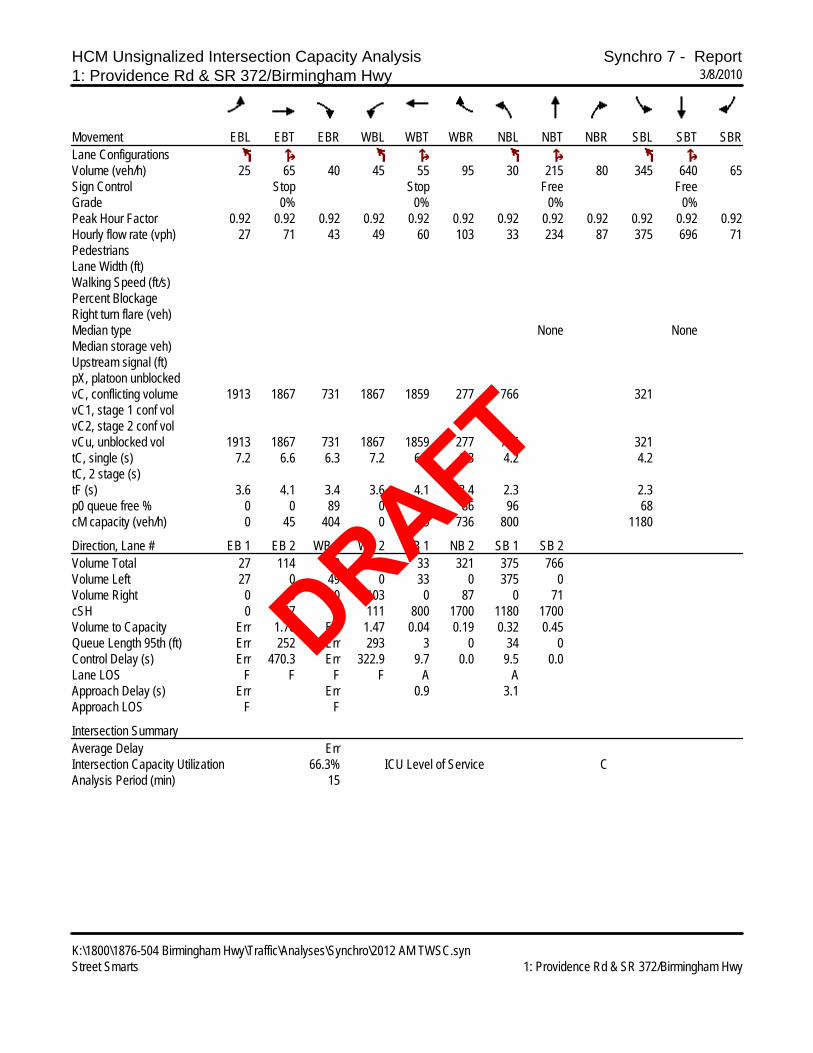
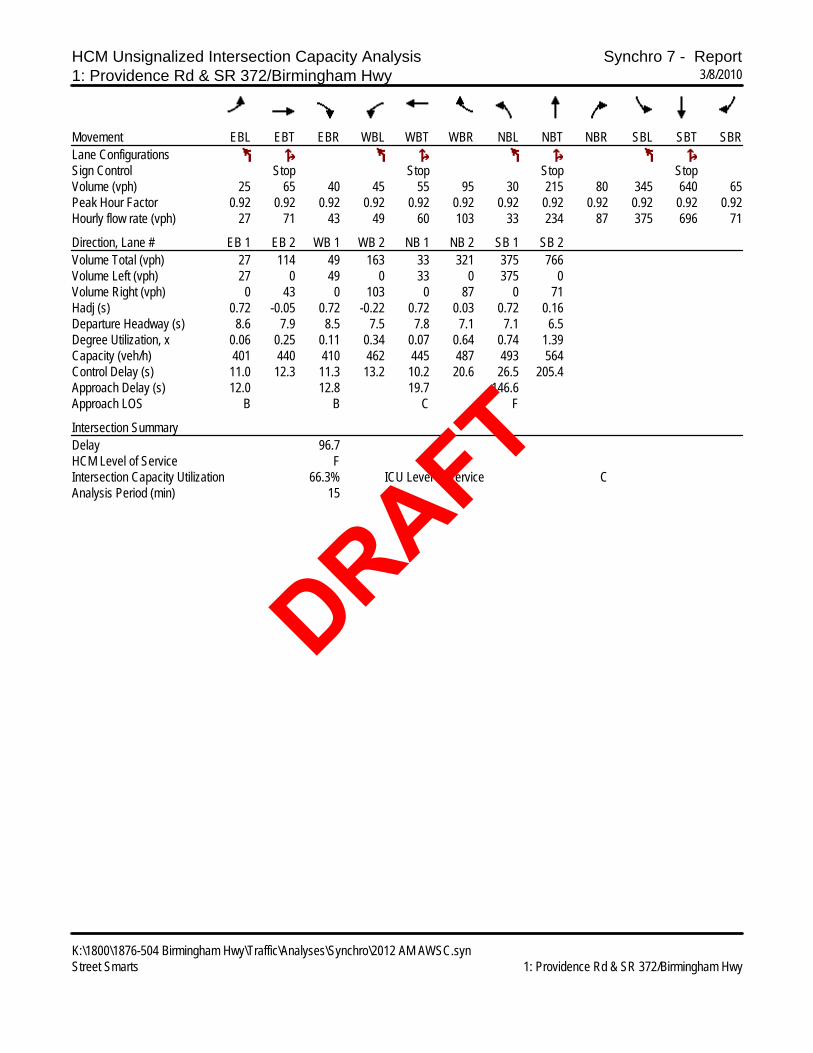
Roundabout Analyses The results of the roundabout capacity analyses for existing, opening and design year traffic conditions for the study intersection with a roundabout are presented in Tables 11 - 13 and printouts are included in Appendix C.
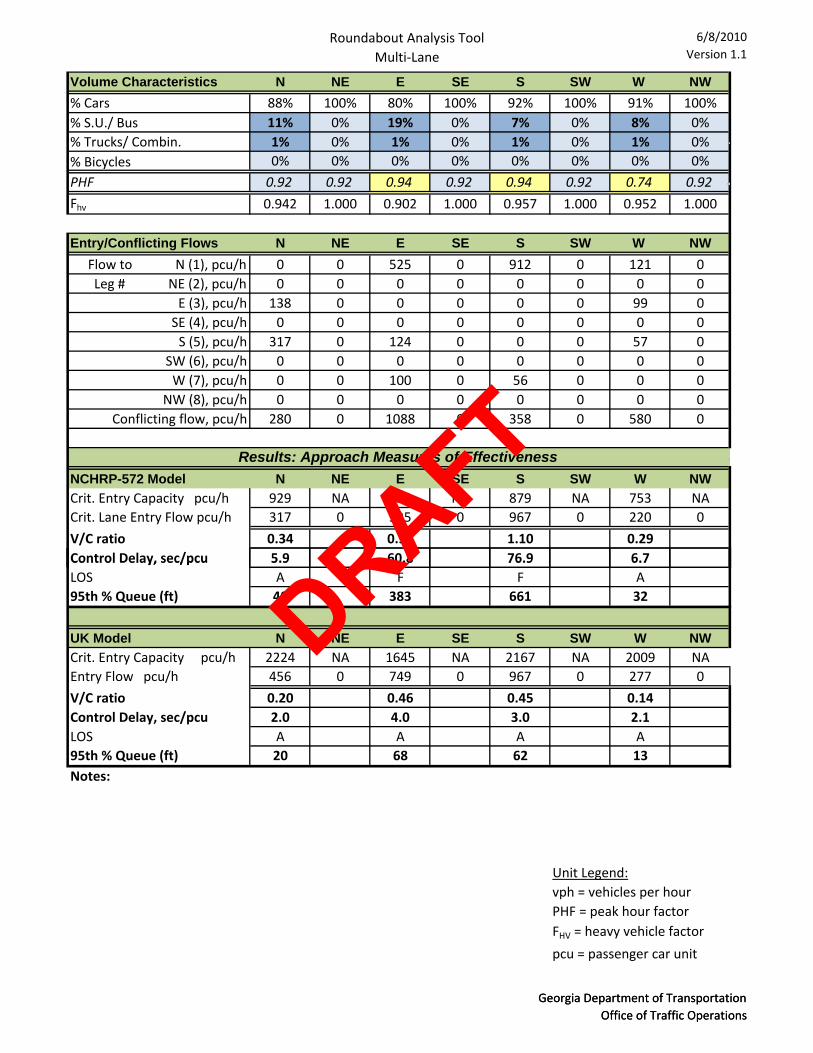
Table 11. 2009 Roundabout Results
Intersection Approach
NCHRP-572 Model Period LOS (V/C Ratio)
UK Model Period LOS (V/C Ratio)
Name AM PM AM PM
Birmingham Hwy /SR 372 at
Providence Road/CR 27
NB A (0.22) B (0.67) A (0.08) A (0.28) SB B (0.77) A (0.26) A (0.51) A (0.16) EB A (0.23) A (0.15) A (0.11) A (0.08) WB A (0.13) C (0.67) A (0.09) A (0.34)
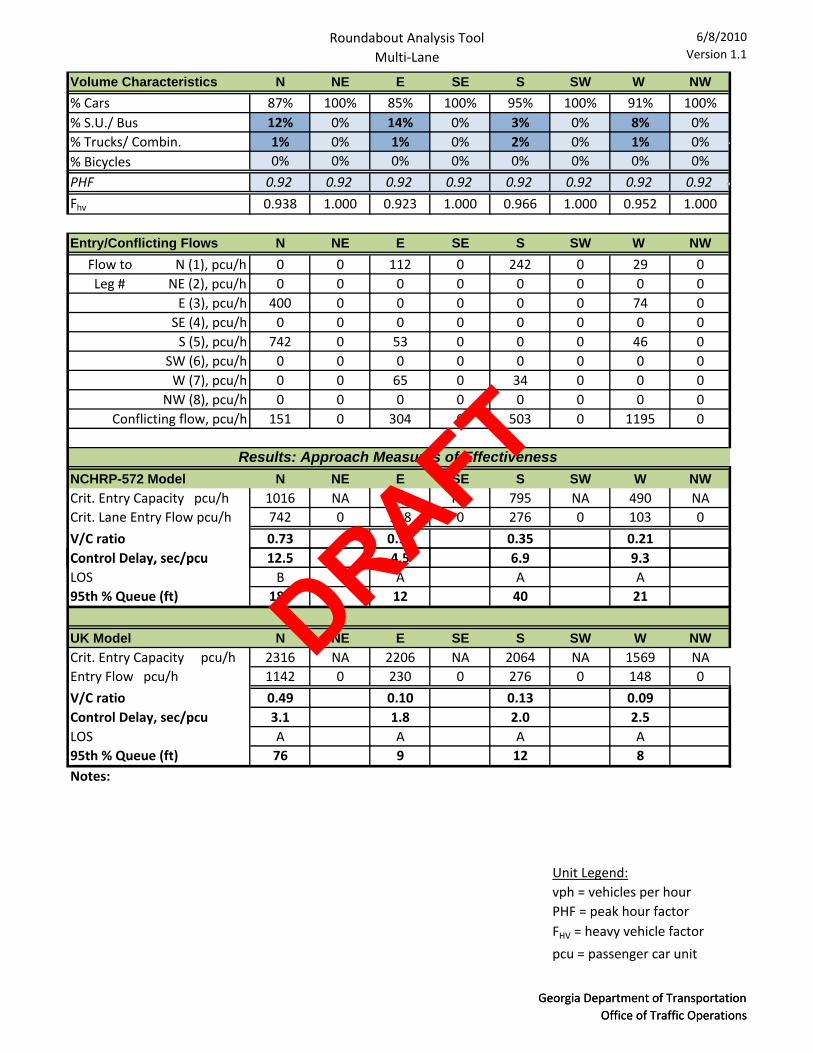
Table 12. 2012 Roundabout Results
Intersection Approach
NCHRP-572 Model Period LOS (V/C Ratio)
UK Model Period LOS (V/C Ratio)
Name AM PM AM PM
Birmingham Hwy /SR 372 at
Providence Road/CR 27
NB A (0.35) C (0.80) A (0.13) A (0.34) SB B (0.73) A (0.26) A (0.49) A (0.16) EB A (0.21) A (0.17) A (0.09) A (0.08) WB A (0.13) C (0.65) A (0.10) A (0.32)
Table 13. 2032 Roundabout Results
Intersection Approach
NCHRP-572 Model Period LOS (V/C Ratio)
UK Model Period LOS (V/C Ratio)
Name AM PM AM PM
Birmingham Hwy /SR 372 at
Providence Road/CR 27
NB A (0.49) F (1.10) A (0.18) A (0.45) SB E (0.97) A (0.34) A (0.64) A (0.20) EB B (0.34) A (0.29) A (0.14) A (0.14) WB A (0.18) F (0.99) A (0.14) A (0.46)
DRAFT
22
City of Milton Birmingham Hwy at Providence Rd
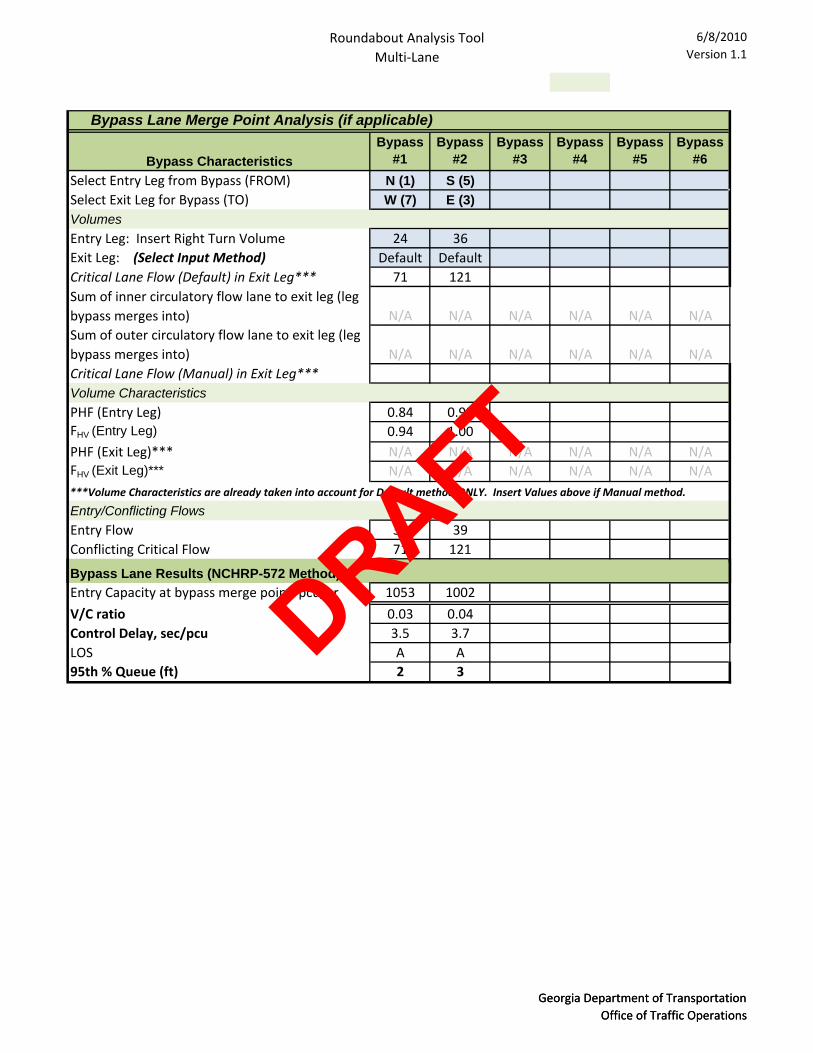
As shown in Tables 11 – 13, a roundabout will not operate adequately in the year 2032. A sensitivity analysis was completed to determine that the roundabout will operate adequately for the PM peak hour up to and including the year 2023, and will operate adequately for the AM peak hour up to and including the year 2031. It is recommended the roundabout be constructed with a southbound right-turn bypass lane to mitigate the close proximity of the north and west approaches to the roundabout. It is also recommended that a northbound right-turn bypass lane be constructed.
DRAFT
23
City of Milton Birmingham Hwy at Providence Rd
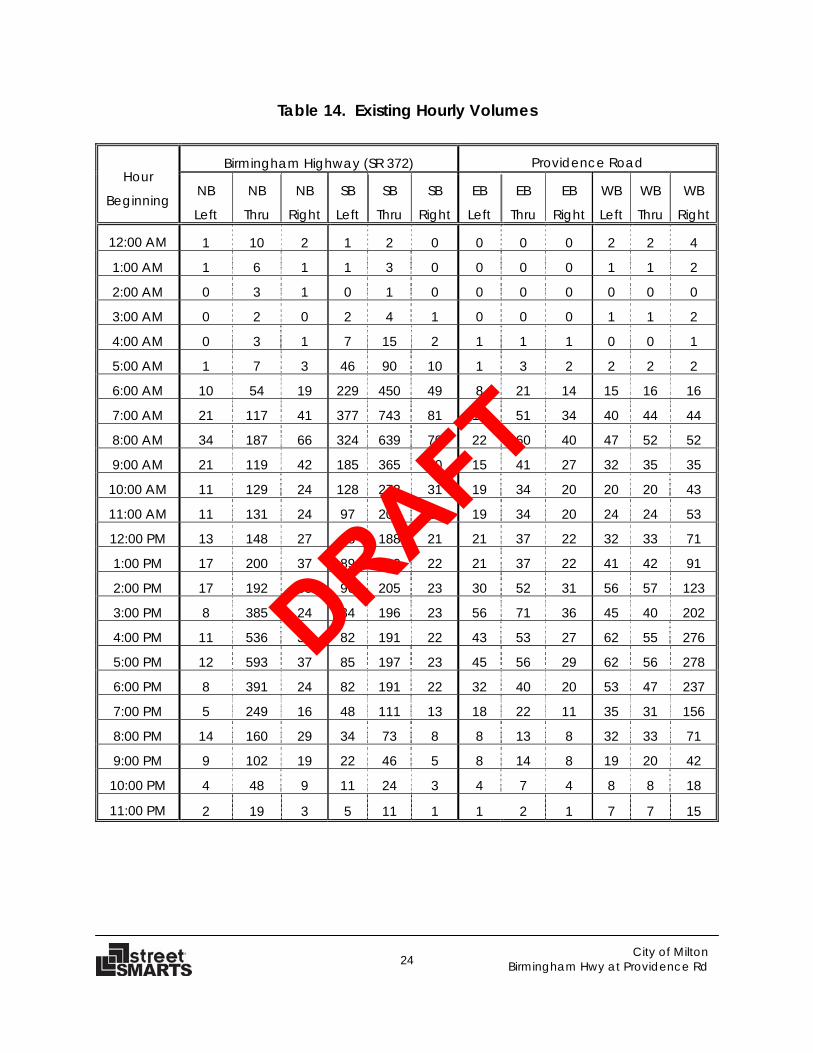
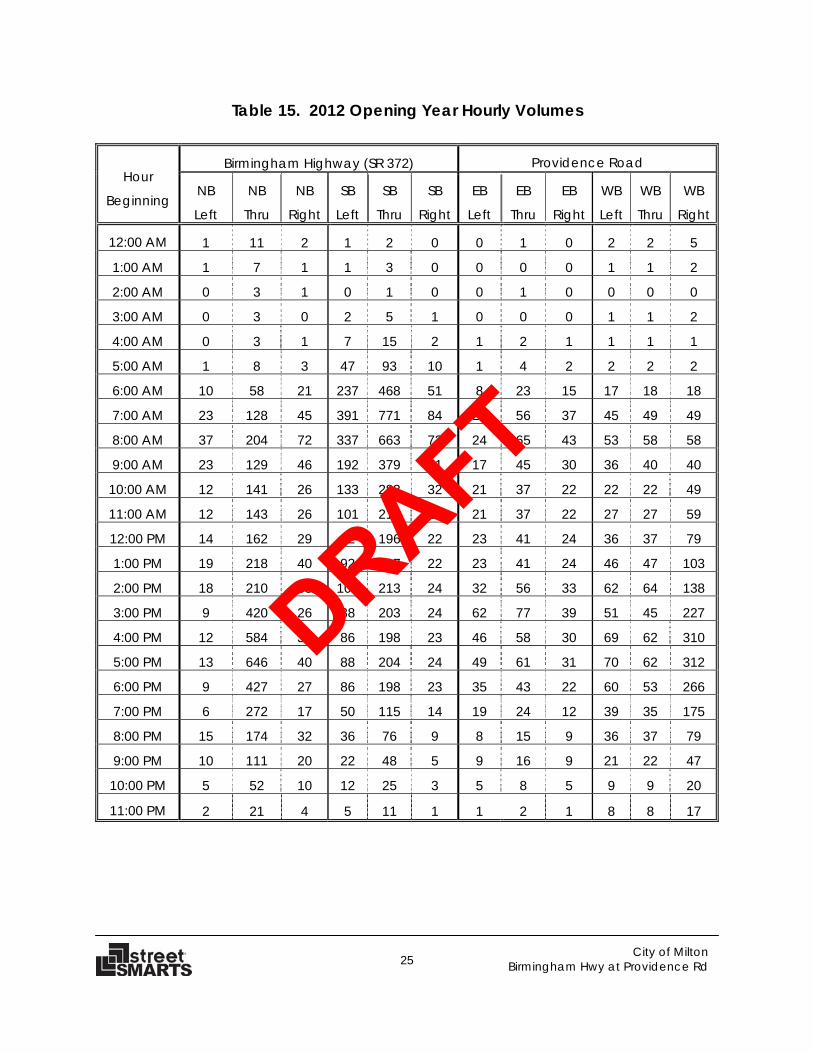
5. TRAFFIC SIGNAL WARRANT ANALYSIS As shown in Section 3 of this Report, from a peak hour operational standpoint, a traffic signal was identified to help mitigate deficient weekday peak hour operating conditions at the intersection of Birmingham Highway (SR 372) and Providence Road. Traffic signal warrant analysis of the study intersection was undertaken in accordance with the methodology set forth in the Federal Highway Administration’s Manual on Uniform Traffic Control Devices, 2003 Edition, (MUTCD). This is the usual methodology for traffic signal warrant studies. Right turning volumes were not included with the total. The 30% reduction in minimum volume for over 40 mph speed were not applied for the analysis. Weekday turning movement traffic volumes for the 2012 and 2032 years were developed utilizing a combination of projected ADT volumes, bi-directional hourly traffic counts collected in 2009 on Birmingham Highway (SR 372) and Providence Road. The existing (2009), opening year 2012 and design year 2032 weekday hourly turning movement traffic volumes at the study intersection are shown in Tables 14 through 16.
DRAFT
24
City of Milton Birmingham Hwy at Providence Rd
Table 14. Existing Hourly Volumes
Hour
Beginning
Birmingham Highway (SR 372) Providence Road
NB
Left
NB
Thru
NB
Right
SB
Left
SB
Thru
SB
Right
EB
Left
EB
Thru
EB
Right
WB
Left
WB
Thru
WB
Right
12:00 AM 1 10 2 1 2 0 0 0 0 2 2 4
1:00 AM 1 6 1 1 3 0 0 0 0 1 1 2
2:00 AM 0 3 1 0 1 0 0 0 0 0 0 0
3:00 AM 0 2 0 2 4 1 0 0 0 1 1 2
4:00 AM 0 3 1 7 15 2 1 1 1 0 0 1
5:00 AM 1 7 3 46 90 10 1 3 2 2 2 2
6:00 AM 10 54 19 229 450 49 8 21 14 15 16 16
7:00 AM 21 117 41 377 743 81 19 51 34 40 44 44
8:00 AM 34 187 66 324 639 70 22 60 40 47 52 52
9:00 AM 21 119 42 185 365 40 15 41 27 32 35 35
10:00 AM 11 129 24 128 272 31 19 34 20 20 20 43
11:00 AM 11 131 24 97 207 24 19 34 20 24 24 53
12:00 PM 13 148 27 88 188 21 21 37 22 32 33 71
1:00 PM 17 200 37 89 190 22 21 37 22 41 42 91
2:00 PM 17 192 35 96 205 23 30 52 31 56 57 123
3:00 PM 8 385 24 84 196 23 56 71 36 45 40 202
4:00 PM 11 536 33 82 191 22 43 53 27 62 55 276
5:00 PM 12 593 37 85 197 23 45 56 29 62 56 278
6:00 PM 8 391 24 82 191 22 32 40 20 53 47 237
7:00 PM 5 249 16 48 111 13 18 22 11 35 31 156
8:00 PM 14 160 29 34 73 8 8 13 8 32 33 71
9:00 PM 9 102 19 22 46 5 8 14 8 19 20 42
10:00 PM 4 48 9 11 24 3 4 7 4 8 8 18
11:00 PM 2 19 3 5 11 1 1 2 1 7 7 15
DRAFT
25
City of Milton Birmingham Hwy at Providence Rd
Table 15. 2012 Opening Year Hourly Volumes
Hour
Beginning
Birmingham Highway (SR 372) Providence Road
NB
Left
NB
Thru
NB
Right
SB
Left
SB
Thru
SB
Right
EB
Left
EB
Thru
EB
Right
WB
Left
WB
Thru
WB
Right
12:00 AM 1 11 2 1 2 0 0 1 0 2 2 5
1:00 AM 1 7 1 1 3 0 0 0 0 1 1 2
2:00 AM 0 3 1 0 1 0 0 1 0 0 0 0
3:00 AM 0 3 0 2 5 1 0 0 0 1 1 2
4:00 AM 0 3 1 7 15 2 1 2 1 1 1 1
5:00 AM 1 8 3 47 93 10 1 4 2 2 2 2
6:00 AM 10 58 21 237 468 51 8 23 15 17 18 18
7:00 AM 23 128 45 391 771 84 21 56 37 45 49 49
8:00 AM 37 204 72 337 663 72 24 65 43 53 58 58
9:00 AM 23 129 46 192 379 41 17 45 30 36 40 40
10:00 AM 12 141 26 133 283 32 21 37 22 22 22 49
11:00 AM 12 143 26 101 215 24 21 37 22 27 27 59
12:00 PM 14 162 29 92 196 22 23 41 24 36 37 79
1:00 PM 19 218 40 92 197 22 23 41 24 46 47 103
2:00 PM 18 210 38 100 213 24 32 56 33 62 64 138
3:00 PM 9 420 26 88 203 24 62 77 39 51 45 227
4:00 PM 12 584 36 86 198 23 46 58 30 69 62 310
5:00 PM 13 646 40 88 204 24 49 61 31 70 62 312
6:00 PM 9 427 27 86 198 23 35 43 22 60 53 266
7:00 PM 6 272 17 50 115 14 19 24 12 39 35 175
8:00 PM 15 174 32 36 76 9 8 15 9 36 37 79
9:00 PM 10 111 20 22 48 5 9 16 9 21 22 47
10:00 PM 5 52 10 12 25 3 5 8 5 9 9 20
11:00 PM 2 21 4 5 11 1 1 2 1 8 8 17
DRAFT
26
City of Milton Birmingham Hwy at Providence Rd
Table 16. 2032 Design Year Hourly Volumes
Hour
Beginning
Birmingham Highway (SR 372) Providence Road
NB
Left
NB
Thru
NB
Right
SB
Left
SB
Thru
SB
Right
EB
Left
EB
Thru
EB
Right
WB
Left
WB
Thru
WB
Right
12:00 AM 1 14 3 1 3 0 0 1 0 3 3 6
1:00 AM 1 9 2 2 3 0 0 0 0 1 1 2
2:00 AM 0 4 1 0 1 0 0 1 0 0 0 0
3:00 AM 0 3 1 3 6 1 0 0 0 1 1 2
4:00 AM 0 4 1 9 19 2 1 2 1 1 1 2
5:00 AM 2 10 4 61 120 13 2 5 3 3 3 3
6:00 AM 14 75 26 305 600 65 11 29 19 22 24 24
7:00 AM 30 165 58 503 991 108 27 72 48 58 63 63
8:00 AM 47 263 93 432 852 93 31 84 56 68 74 74
9:00 AM 30 167 59 247 487 53 22 58 38 46 51 51
10:00 AM 16 181 33 170 363 41 27 47 28 28 29 62
11:00 AM 16 184 34 129 276 31 27 47 28 34 35 76
12:00 PM 18 208 38 118 251 28 30 53 31 46 47 101
1:00 PM 24 281 51 118 253 29 30 53 31 59 61 131
2:00 PM 23 270 49 128 274 31 42 73 43 80 82 177
3:00 PM 11 541 34 112 261 31 79 99 51 65 58 290
4:00 PM 16 752 47 110 255 30 60 75 38 89 79 396
5:00 PM 17 832 52 113 262 31 63 79 40 90 80 399
6:00 PM 11 550 34 110 255 30 45 56 29 76 68 341
7:00 PM 7 350 22 64 148 17 25 31 16 50 45 224
8:00 PM 19 225 41 46 98 11 11 19 11 46 47 101
9:00 PM 12 143 26 29 62 7 12 20 12 27 28 61
10:00 PM 6 67 12 15 32 4 6 10 6 12 12 26
11:00 PM 2 27 5 7 14 2 1 3 2 10 10 22
DRAFT
27
City of Milton Birmingham Hwy at Providence Rd
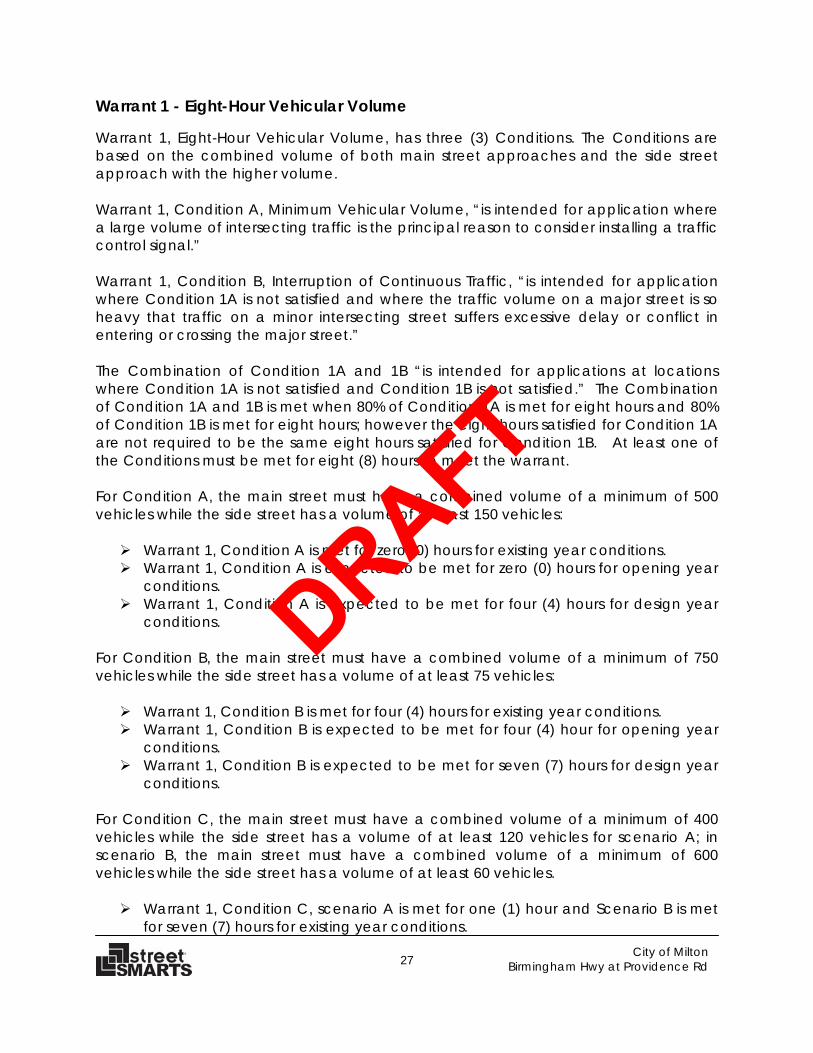
Warrant 1 - Eight-Hour Vehicular Volume Warrant 1, Eight-Hour Vehicular Volume, has three (3) Conditions. The Conditions are based on the combined volume of both main street approaches and the side street approach with the higher volume. Warrant 1, Condition A, Minimum Vehicular Volume, “is intended for application where a large volume of intersecting traffic is the principal reason to consider installing a traffic control signal.” Warrant 1, Condition B, Interruption of Continuous Traffic, “is intended for application where Condition 1A is not satisfied and where the traffic volume on a major street is so heavy that traffic on a minor intersecting street suffers excessive delay or conflict in entering or crossing the major street.” The Combination of Condition 1A and 1B “is intended for applications at locations where Condition 1A is not satisfied and Condition 1B is not satisfied.” The Combination of Condition 1A and 1B is met when 80% of Condition 1A is met for eight hours and 80% of Condition 1B is met for eight hours; however the eight hours satisfied for Condition 1A are not required to be the same eight hours satisfied for Condition 1B. At least one of the Conditions must be met for eight (8) hours to meet the warrant. For Condition A, the main street must have a combined volume of a minimum of 500 vehicles while the side street has a volume of at least 150 vehicles:
Warrant 1, Condition A is met for zero (0) hours for existing year conditions. Warrant 1, Condition A is expected to be met for zero (0) hours for opening year
conditions. Warrant 1, Condition A is expected to be met for four (4) hours for design year
conditions.
For Condition B, the main street must have a combined volume of a minimum of 750 vehicles while the side street has a volume of at least 75 vehicles:
Warrant 1, Condition B is met for four (4) hours for existing year conditions. Warrant 1, Condition B is expected to be met for four (4) hour for opening year
conditions. Warrant 1, Condition B is expected to be met for seven (7) hours for design year
conditions.
For Condition C, the main street must have a combined volume of a minimum of 400 vehicles while the side street has a volume of at least 120 vehicles for scenario A; in scenario B, the main street must have a combined volume of a minimum of 600 vehicles while the side street has a volume of at least 60 vehicles.
Warrant 1, Condition C, scenario A is met for one (1) hour and Scenario B is met for seven (7) hours for existing year conditions.
DRAFT
28
City of Milton Birmingham Hwy at Providence Rd
Warrant 1, Condition C, scenario A is met for four (4) hours and Scenario B is met for seven (7) hours for opening year conditions.
Warrant 1, Condition C, scenario A is met for eight (8) hours and Scenario B is met for eleven (11) hours for existing year conditions.
A sensitivity analysis was done to show that Warrant 1, Condition C, Scenario A is expected to be met for eight (8) hours and Scenario B is met for ten (10) for year 2031 conditions.
Warrant 1, Conditions A and B are not expected to be met under existing, opening, and design year conditions. Additionally, Warrant 1, Conditions C is not expected to be met under existing and opening year conditions. However, Warrant 1, Conditions C is expected to be met under design year conditions, therefore, Warrant 1 is met. Warrant 2 - Four-Hour Vehicular Volume Warrant 2, Four-Hour Vehicular Volume, is “intended to be applied where the volume of intersecting traffic is the principal reason to consider installing a traffic control signal.” Warrant 2 is based on the combined volume of both main street approaches and the side street approach with the higher volume. The volumes are compared to a curve based on the number of lanes on the approaches. Warrant 2 must be met for four hours to meet the warrant.
Warrant 2 is met for two (2) hours for existing year conditions. Warrant 2 is expected to be met for four (4) hour for opening year conditions. Warrant 2 is expected to be met for six (6) hours for design year conditions.
Warrant 2, is expected to be met under opening and design year conditions; therefore, Warrant 2 is met. Warrant 3 - Peak Hour Warrant 3, Peak Hour, is “intended for use at a location where traffic conditions are such that for a minimum of one hour of an average weekday, the minor street traffic suffers undue delay when entering or crossing the major street. This signal warrant shall be applied only in unusual cases. Such unusual cases include, but are not limited to, office complexes, manufacturing plants, industrial complexes, or high-occupancy vehicle facilities that attract or discharge large numbers of vehicles over a short time”. Warrant 3 has two Conditions, at least one of which must be met to meet the Warrant. Condition 3A is satisfied when the following three conditions exist for the same four consecutive 15-minute periods of an average weekday:
The total stopped time delay experienced by traffic on the minor street approach (one direction only) controlled by a stop sign equals or
DRAFT
29
City of Milton Birmingham Hwy at Providence Rd
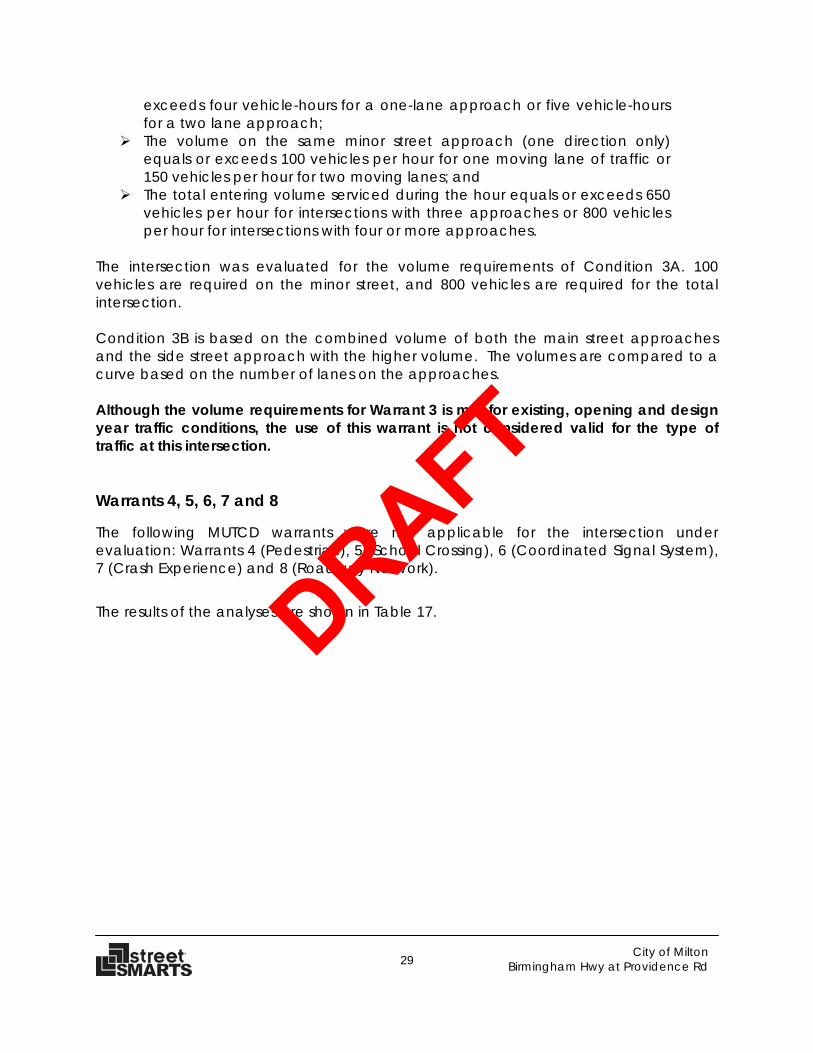
exceeds four vehicle-hours for a one-lane approach or five vehicle-hours for a two lane approach;
The volume on the same minor street approach (one direction only) equals or exceeds 100 vehicles per hour for one moving lane of traffic or 150 vehicles per hour for two moving lanes; and
The total entering volume serviced during the hour equals or exceeds 650 vehicles per hour for intersections with three approaches or 800 vehicles per hour for intersections with four or more approaches.
The intersection was evaluated for the volume requirements of Condition 3A. 100 vehicles are required on the minor street, and 800 vehicles are required for the total intersection. Condition 3B is based on the combined volume of both the main street approaches and the side street approach with the higher volume. The volumes are compared to a curve based on the number of lanes on the approaches. Although the volume requirements for Warrant 3 is met for existing, opening and design year traffic conditions, the use of this warrant is not considered valid for the type of traffic at this intersection. Warrants 4, 5, 6, 7 and 8 The following MUTCD warrants were not applicable for the intersection under evaluation: Warrants 4 (Pedestrian), 5 (School Crossing), 6 (Coordinated Signal System), 7 (Crash Experience) and 8 (Roadway Network). The results of the analyses are shown in Table 17.
DRAFT
30
City of Milton Birmingham Hwy at Providence Rd
Table 17. Summary of the Signal Warrant Evaluation
Birmingham Highway/SR 372 at Providence Road/CR 27
Warrant Number
Warrant Satisfied? (Hours Met/Hours
Required) Existing Volumes
Warrant Satisfied? (Hours Met/Hours
Required) Year 2012 Volumes
Warrant Satisfied? (Hours Met/Hours
Required) Year 2032 Volumes
1A No (0/8) No (0/8) No (4/8)
1B No (4/8) No (4/8) No (7/8)
1C A No (1/8) No (4/8) Yes (8/8)
B No (7/8) No (7/8) Yes (11/8)
2 No (2/4) Yes (4/4) Yes (6/4)
3A Yes (4/1 – volumes only)
Yes (5/1-volumes only)
Yes (8/1-volumes only)
3B No (0/1) No (0/1) Yes (4/1)
As shown in Table 17, a traffic signal should be considered at this location, since this intersection is expected to meet the MUTCD volume requirements for Warrants 2 and 3 during the 2012 opening year of the project. The intersection is expected to meet the MUTCD volume requirements for warrant 1 during design year of the project. A summary of the analysis is included in Appendix D. Additionally, consideration was give for left-turn phasing at the study intersection. The Georgia Department of Transportation (GDOT) Transportation Online Policy & Procedure System (TOPPS) 6785-2 Regulations for Driveway and Encroachment Control, last reviewed January 2008 provides requirements concerning the use of left turn phases. A couple of the highlighted left turn phase consideration rules include but are not limited to the following:
If the cross product (one hour left turn volume times the opposing one hour through movement volume divided by the number of lanes for the opposing through movement) is greater than 50,000; and
Correctable crashes equal or exceed 4 crashes in one year or 6 crashes in two years.
For the study intersection, the cross product was calculated for the existing, opening and design year traffic volumes. Table 18 shows the results.
DRAFT
31
City of Milton Birmingham Hwy at Providence Rd
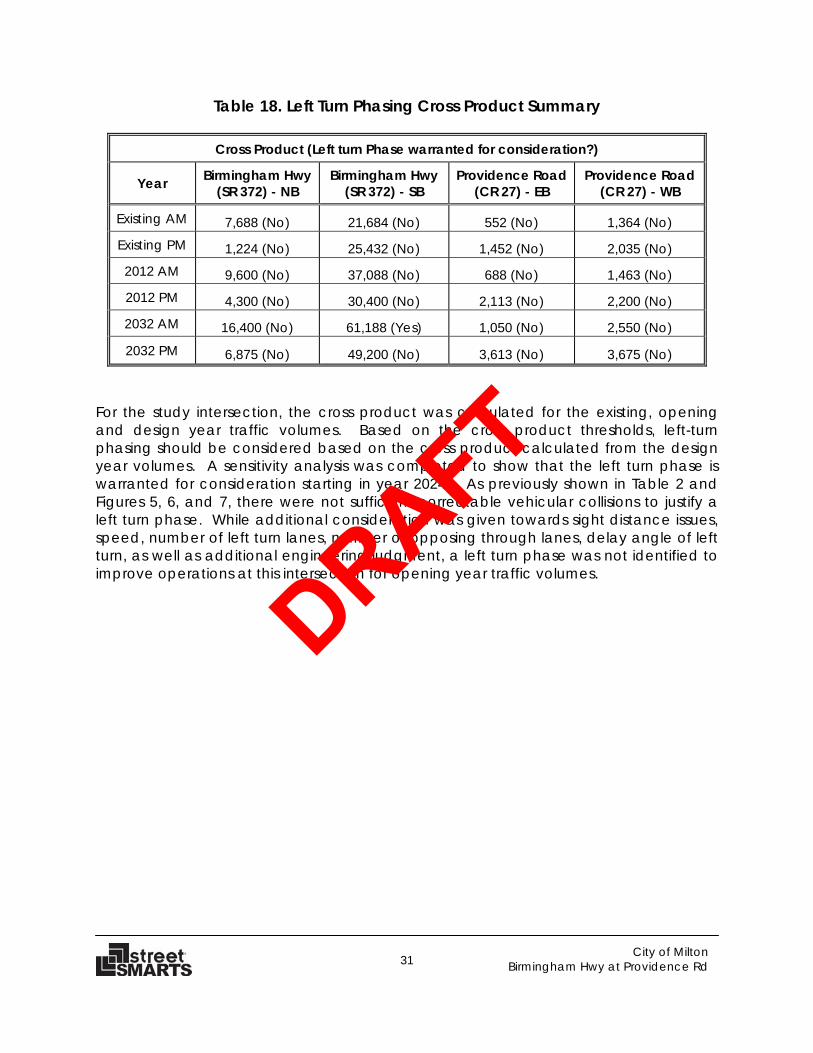
Table 18. Left Turn Phasing Cross Product Summary
Cross Product (Left turn Phase warranted for consideration?)
2032 PM 6,875 (No) 49,200 (No) 3,613 (No) 3,675 (No) For the study intersection, the cross product was calculated for the existing, opening and design year traffic volumes. Based on the cross product thresholds, left-turn phasing should be considered based on the cross product calculated from the design year volumes. A sensitivity analysis was completed to show that the left turn phase is warranted for consideration starting in year 2024. As previously shown in Table 2 and Figures 5, 6, and 7, there were not sufficient correctable vehicular collisions to justify a left turn phase. While additional consideration was given towards sight distance issues, speed, number of left turn lanes, number of opposing through lanes, delay angle of left turn, as well as additional engineering judgment, a left turn phase was not identified to improve operations at this intersection for opening year traffic volumes. DRAFT
1 City of Milton
Birmingham Hwy at Providence Rd
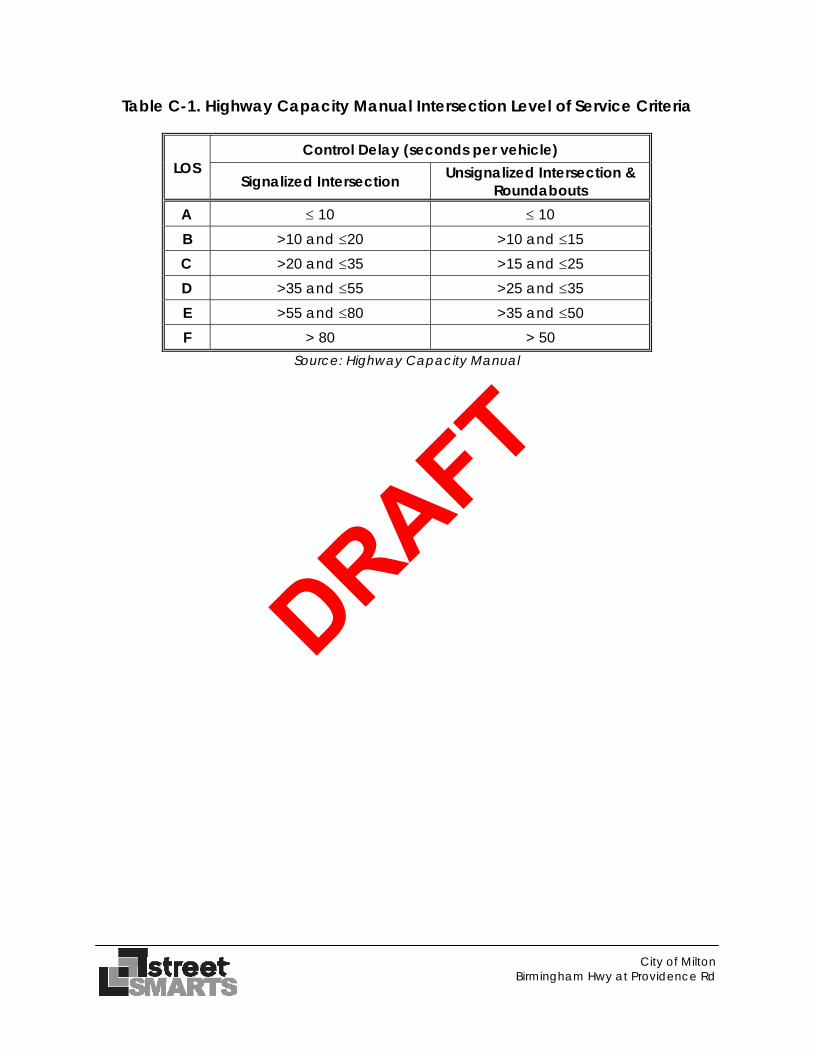
LEVEL OF SERVICE CONCEPT DESCRIPTION Capacity analyses of the study intersections were completed using procedures in the Transportation Research Board’s Highway Capacity Manual (HCM), 2003. This is the usual methodology for the analysis of traffic conditions. The software program Synchro 6 (a nationally recognized computer software package for analyzing capacities and Levels of Service) was used to perform the actual capacity analyses for the key intersections. Operating conditions at intersections are evaluated in terms of Levels of Service (LOS). LOS A through E are generally considered to be adequate peak hour operations. LOS F is generally considered an inadequate condition. Levels of Service for signalized intersections are reported in composite fashion, i.e., one LOS for the entire intersection, and are based on average control delay. Individual turning movements at a signalized intersection may experience inadequate LOS, particularly where those volumes are relatively low, while the intersection as a whole has an adequate LOS. This is because the major movements on the major roadway are given priority in assigning signal green time. Traffic conditions at unsignalized intersections, with STOP sign control on the minor street only, are evaluated for the minor street approach(es) and for the left turns from the major street. This is because the major street traffic is assumed to have no delay since there is no control (no STOP sign). Inadequate Levels of Service for minor street approaches to unsignalized intersections are not uncommon, as the continuous flow traffic will always get the priority. Levels of Service for all-way STOP controlled intersections are reported both for key intersection movements, and in composite fashion, i.e., one LOS for the entire intersection, and are based on average control delay. According to the HCM, LOS criteria for roundabout intersections are the same as the LOS criteria for stop controlled intersections. The LOS for a roundabout is determined by the computed or measured control delay for each lane. Defining the LOS for the intersection as a whole is not recommended because doing so may mask an entry that is operating with much higher delay than the others. Roundabout results are given from two models, the NCHRP-572 and the UK model. The NCHRP-572 model is based on analytical method based on gap acceptance behavior on roundabout in the United States while the UK model is based on an empirical method based on the geometric features of the source roundabout. It is important o note that the UK model typically yields a higher value for capacity because the source data is taken from roundabouts in the UK where familiarity is higher. The Highway Capacity Manual Level of Service criteria for signalized and unsignalized intersections are shown in Table C-1.
DRAFT
2 City of Milton
Birmingham Hwy at Providence Rd
Table C-1. Highway Capacity Manual Intersection Level of Service Criteria
Intersection SummaryHCM Average Control Delay 10.3 HCM Level of Service BHCM Volume to Capacity ratio 0.64Actuated Cycle Length (s) 45.6 Sum of lost time (s) 12.0Intersection Capacity Utilization 61.2% ICU Level of Service BAnalysis Period (min) 15c Critical Lane Group
Intersection SummaryHCM Average Control Delay 14.2 HCM Level of Service BHCM Volume to Capacity ratio 0.75Actuated Cycle Length (s) 48.2 Sum of lost time (s) 12.0Intersection Capacity Utilization 73.6% ICU Level of Service DAnalysis Period (min) 15c Critical Lane Group
Intersection SummaryHCM Average Control Delay 14.5 HCM Level of Service BHCM Volume to Capacity ratio 0.76Actuated Cycle Length (s) 56.5 Sum of lost time (s) 12.0Intersection Capacity Utilization 71.5% ICU Level of Service CAnalysis Period (min) 15c Critical Lane Group
Intersection SummaryHCM Average Control Delay 30.8 HCM Level of Service CHCM Volume to Capacity ratio 0.94Actuated Cycle Length (s) 83.7 Sum of lost time (s) 12.0Intersection Capacity Utilization 90.4% ICU Level of Service EAnalysis Period (min) 15c Critical Lane Group
DRAFT
5 City of Milton
Birmingham Hwy at Providence Rd
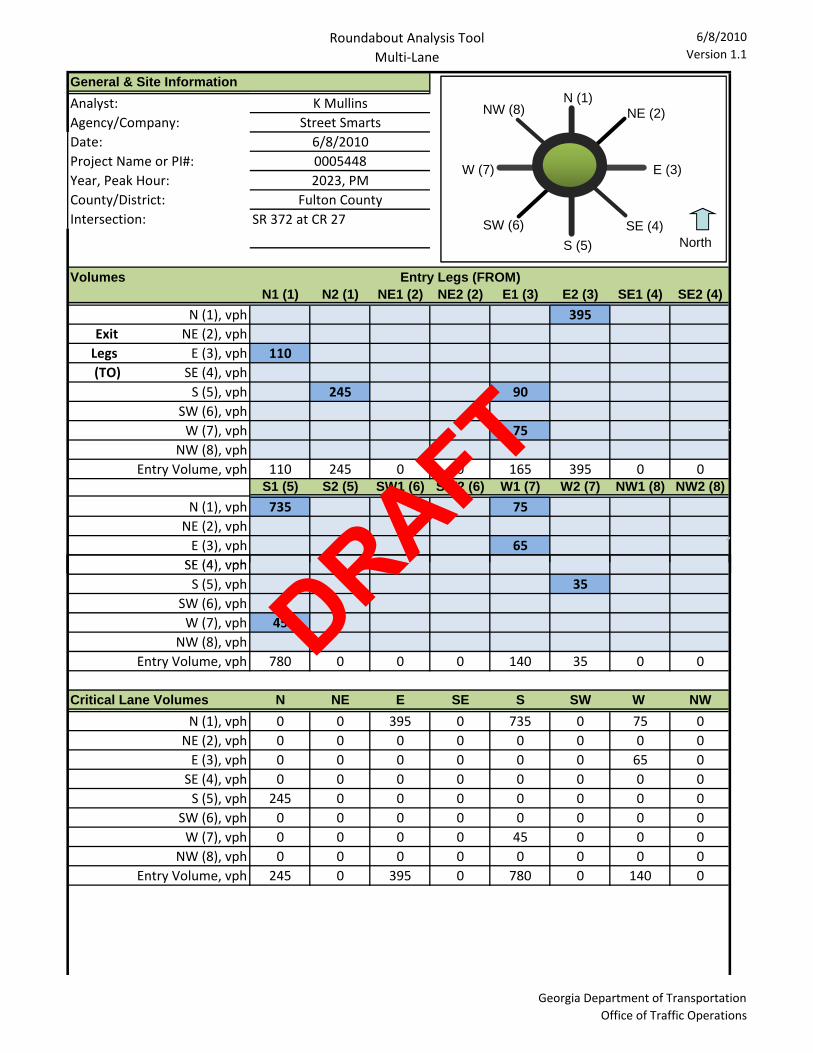
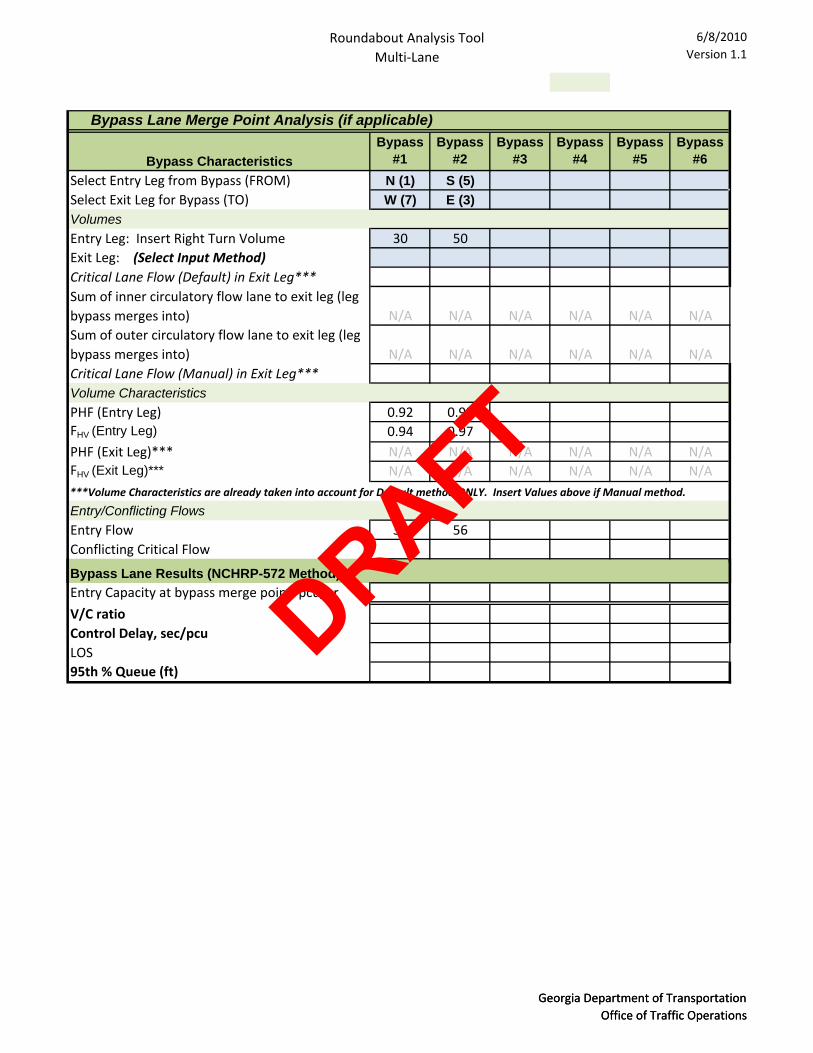
APPENDIX C: ROUNDABOUT ANALYSES
DRAFT
Roundabout Analysis ToolMulti‐Lane
6/8/2010Version 1.1
General & Site InformationAnalyst:Agency/Company:Date:Project Name or PI#:Year, Peak Hour:County/District:Intersection:
Georgia Department of TransportationOffice of Traffic Operations
DRAFT
6 City of Milton
Birmingham Hwy at Providence Rd
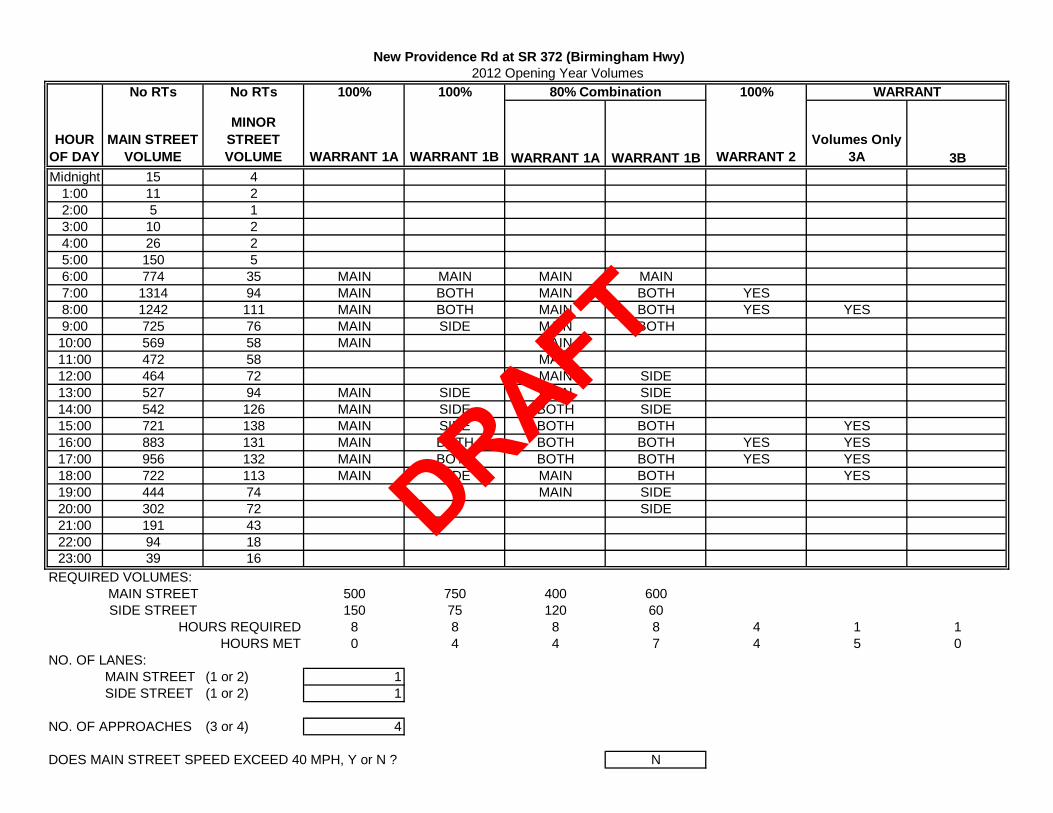
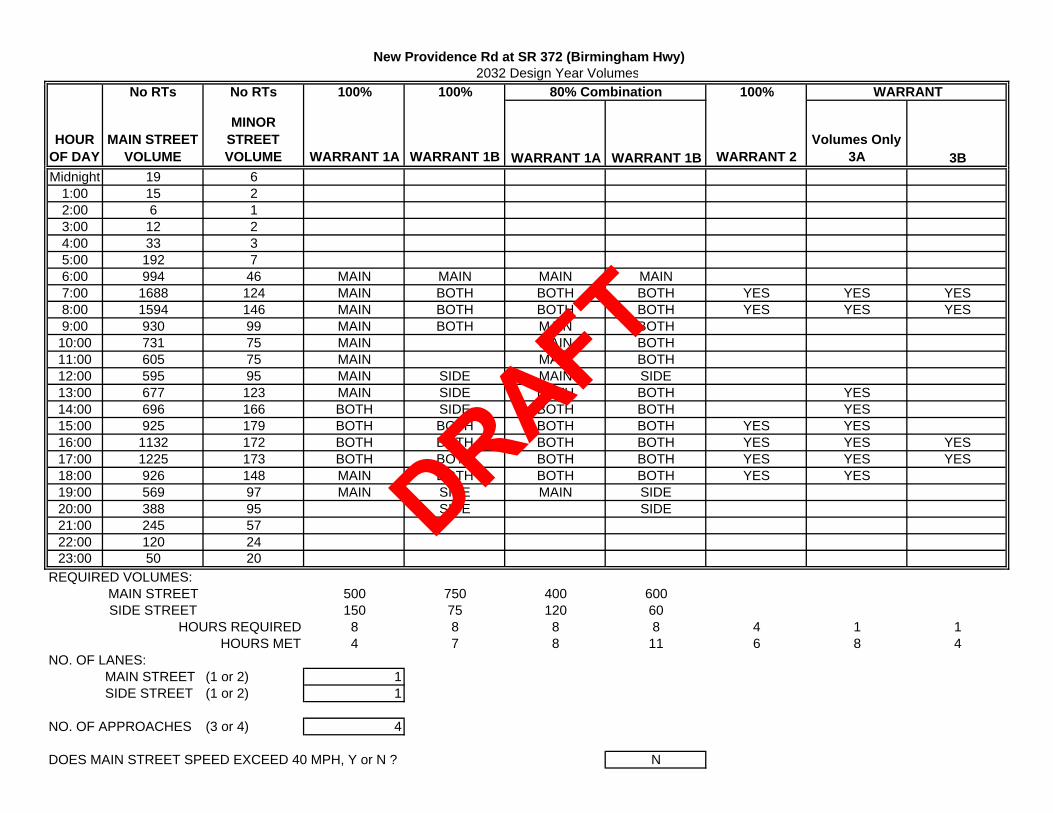
APPENDIX D: SIGNAL WARRANT ANALYSES
DRAFT
2009 Existing VolumesNo RTs No RTs 100% 100% 100%
HOUR OF DAY
MAIN STREET VOLUME
MINOR STREET VOLUME WARRANT 1A WARRANT 1B WARRANT 1A WARRANT 1B WARRANT 2
Volumes Only 3A 3B
Midnight 14 41:00 11 12:00 4 13:00 9 14:00 25 25:00 144 56:00 742 32 MAIN MAIN MAIN7:00 1259 84 MAIN BOTH MAIN BOTH YES8:00 1184 99 MAIN BOTH MAIN BOTH YES9:00 690 68 MAIN MAIN BOTH
10:00 541 53 MAIN MAIN11:00 447 53 MAIN12:00 438 64 MAIN SIDE13:00 496 84 SIDE MAIN SIDE14:00 511 113 MAIN SIDE MAIN SIDE15:00 673 127 MAIN SIDE BOTH BOTH YES16:00 820 117 MAIN BOTH MAIN BOTH YES17:00 887 118 MAIN BOTH MAIN BOTH YES18:00 673 101 MAIN SIDE MAIN BOTH YES19:00 413 66 MAIN SIDE20:00 281 64 SIDE21:00 178 3922:00 88 1623:00 36 14
REQUIRED VOLUMES:MAIN STREET 500 750 400 600SIDE STREET 150 75 120 60
NO. OF LANES:MAIN STREET (1 or 2) 1SIDE STREET (1 or 2) 1
NO. OF APPROACHES (3 or 4) 4
DOES MAIN STREET SPEED EXCEED 40 MPH, Y or N ? N
New Providence Rd at SR 372 (Birmingham Hwy)
80% Combination WARRANT
DRAFT
2012 Opening Year VolumesNo RTs No RTs 100% 100% 100%
HOUR OF DAY
MAIN STREET VOLUME
MINOR STREET VOLUME WARRANT 1A WARRANT 1B WARRANT 1A WARRANT 1B WARRANT 2
Volumes Only 3A 3B
Midnight 15 41:00 11 22:00 5 13:00 10 24:00 26 25:00 150 56:00 774 35 MAIN MAIN MAIN MAIN7:00 1314 94 MAIN BOTH MAIN BOTH YES8:00 1242 111 MAIN BOTH MAIN BOTH YES YES9:00 725 76 MAIN SIDE MAIN BOTH
10:00 569 58 MAIN MAIN11:00 472 58 MAIN12:00 464 72 MAIN SIDE13:00 527 94 MAIN SIDE MAIN SIDE14:00 542 126 MAIN SIDE BOTH SIDE15:00 721 138 MAIN SIDE BOTH BOTH YES16:00 883 131 MAIN BOTH BOTH BOTH YES YES17:00 956 132 MAIN BOTH BOTH BOTH YES YES18:00 722 113 MAIN SIDE MAIN BOTH YES19:00 444 74 MAIN SIDE20:00 302 72 SIDE21:00 191 4322:00 94 1823:00 39 16
REQUIRED VOLUMES:MAIN STREET 500 750 400 600SIDE STREET 150 75 120 60
NO. OF LANES:MAIN STREET (1 or 2) 1SIDE STREET (1 or 2) 1
NO. OF APPROACHES (3 or 4) 4
DOES MAIN STREET SPEED EXCEED 40 MPH, Y or N ? N
New Providence Rd at SR 372 (Birmingham Hwy)
WARRANT80% Combination
DRAFT
2032 Design Year VolumesNo RTs No RTs 100% 100% 100%
HOUR OF DAY
MAIN STREET VOLUME
MINOR STREET VOLUME WARRANT 1A WARRANT 1B WARRANT 1A WARRANT 1B WARRANT 2
Volumes Only 3A 3B
Midnight 19 61:00 15 22:00 6 13:00 12 24:00 33 35:00 192 76:00 994 46 MAIN MAIN MAIN MAIN7:00 1688 124 MAIN BOTH BOTH BOTH YES YES YES8:00 1594 146 MAIN BOTH BOTH BOTH YES YES YES9:00 930 99 MAIN BOTH MAIN BOTH
10:00 731 75 MAIN MAIN BOTH11:00 605 75 MAIN MAIN BOTH12:00 595 95 MAIN SIDE MAIN SIDE13:00 677 123 MAIN SIDE BOTH BOTH YES14:00 696 166 BOTH SIDE BOTH BOTH YES15:00 925 179 BOTH BOTH BOTH BOTH YES YES16:00 1132 172 BOTH BOTH BOTH BOTH YES YES YES17:00 1225 173 BOTH BOTH BOTH BOTH YES YES YES18:00 926 148 MAIN BOTH BOTH BOTH YES YES19:00 569 97 MAIN SIDE MAIN SIDE20:00 388 95 SIDE SIDE21:00 245 5722:00 120 2423:00 50 20
REQUIRED VOLUMES:MAIN STREET 500 750 400 600SIDE STREET 150 75 120 60
NO. OF LANES:MAIN STREET (1 or 2) 1SIDE STREET (1 or 2) 1
NO. OF APPROACHES (3 or 4) 4
DOES MAIN STREET SPEED EXCEED 40 MPH, Y or N ? N
New Providence Rd at SR 372 (Birmingham Hwy)
WARRANT80% Combination
DRAFT
MEETING SUMMARY
Date: May 19, 2010
Location: GDOT District 7 Conference Room
Taken By: Kari Ward, PE
Reviewed By: Andy Anderson, PE (Project Manager)
Subject: Initial Concept Team Meeting HPP00-0005-00(448), P.I. No. 0005448, Fulton County, City of Milton Birmingham Hwy/ SR 372 (09-SSI-03, 1876-504)
Attendees: Kelvin Wilson, GDOT D7 Andy Anderson, Street Smarts Scott Lee, GDOT D7 Kari Ward, Street Smarts Mike Lobdell, GDOT D7 Randal Parker, Street Smarts David M. Robbins, GDOT D7 Carter Lucas, City of Milton Mac Cranford, GDOT D7 Sara Leaders, City of Milton Pam Hooks, GDOT Local Government Keith Markland, Kimley-Horn Ken Werho, GDOT TOTMC Scott Zehngraff, GDOT Traffic
Meeting Summary: The purpose of this meeting was to discuss the concept of the proposed intersection improvements to New Providence Road at Birmingham Highway, environmental issues and coordination efforts within the project and review the overall project schedule. The meeting took place in the GDOT District 7 Conference Room on May 19, 2010 at 1:00 PM.
Introduction of Each Attendee Project Overview (Street Smarts – Kari Ward/Andy Anderson) Described preferred alternate developed considering the 2006 approved concept report, Community Advisory Committee meetings and PIOH comments. Traffic Projections (Street Smarts – Randy Parker) The existing volume did not satisfy 8 warrants, a signal will increase delays on Birmingham Highway. Right of Way Displacements and Relocations (Street Smarts – Kari Ward) There are approximately 14 parcel impacts, no displacements. Environmental Concerns/Level of Environmental Analysis (KHA – Keith Markland) There are no known issues at this time. We are moving forward with developing a CE for both City of Milton Intersection projects PI No. 0005448 Birmingham Hwy/ SR 372 and PI No. 0000533 Arnold Mill Rd /SR140.
ICTM Minutes 2 of 2 PI No. 0005448 Birmingham Hwy Fulton County, City of Milton Utilities (Street Smarts – Kari Ward) Read list of area utilities from draft Concept Report.
Ken Werho, GDOT TOTMC Review existing electrical easement along SR372.
Project Development Schedule (GDOT - Mike Lobdell) Right-of-way is scheduled for July, 2012. Construction is scheduled for November, 2012. Schedule Concept Team Meeting in a month (mid-June) to meet current schedule approval date of July 20, 2010. Comments from Attendees Local Government Representatives
Carter Lucas, City of Milton We would like to keep R/W impacts to a minimum. Since this project was approved in 2006, our residents feel the improvements should be in place by now, so let us know if there is anything we can do to expedite the process.
Traffic Safety and Design Ken Werho, GDOT TOTMC
1. We designed a roundabout in Wilkinson that had a degree of 45, 175 ft inscribed circle with 20 ft bypass lanes for trucks.
a. The Oregon Roundabout guide is a good reference for multilane roundabout design standards, spiral, and angles.
b. Also, see the MUTCD for striping. 2. Add splitter islands 100 ft long with pedestrian crossing 20 ft back. 3. Add bypass from SR372 onto CR27.
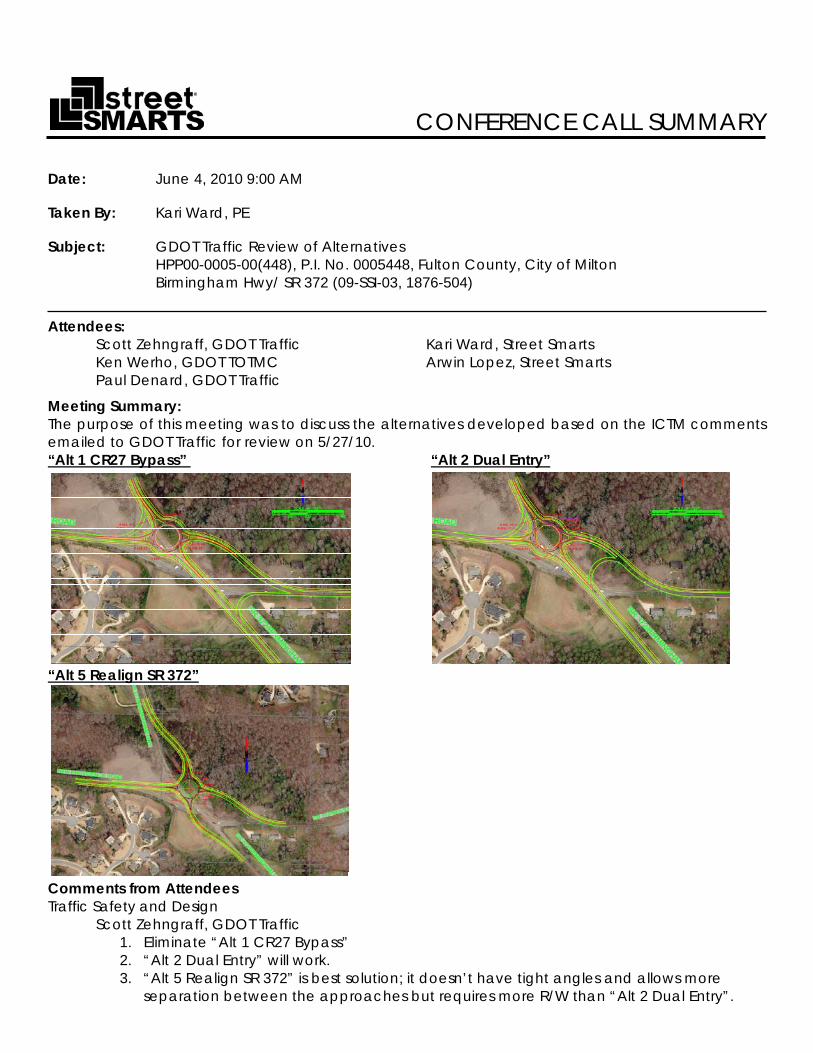
Scott Zehngraff, GDOT Traffic 1. Yield bypass lanes onto New Providence rather than free flow. Right turns are a problem
with design vehicles. 2. Add dual approach on southbound SR372. 3. Try skew angle of 45 degrees. Right of way cost will determine what angle to use. 4. Adjust alignment to achieve left offsets on SR372. 5. Look at shifting the alignment of SR372 to the left. 6. Show pedestrian crossings. 7. Use WB-67 design vehicle, include fastest path analysis in concept. 8. Dimension the entry and exit radius. 9. Send GDOT Traffic alternatives discussed for review; copy Ken Werho and Kelvin Wilson.
Right of Way Pam Hooks, GDOT Local Government
If the city deems a property abandoned/condemned, it is not considered a displacement. Action Items: 1. Send GDOT Traffic alternatives discussed for review; copy Ken Werho and Kelvin Wilson. 2. Schedule Concept Team Meeting in a month (mid-June).
The meeting was adjourned at 2:00 pm by Mike Lobdell, GDOT D7.
K:\1800\1876-503 Arnold Mill Rd\Roadway\Project Management\Meetings_Memos_Conv Records\Minutes 2010-05-19 ICTM.docx
MEETING SUMMARY
Date: July 6, 2010
Location: GDOT District 7 Conference Room
Taken By: Mallory Brewer
Reviewed By: Andy Anderson, PE (Project Manager)
Subject: Concept Team Meeting HPP00-0005-00(448), P.I. No. 0005448, Fulton County, City of Milton Birmingham Hwy/ SR 372 (09-SSI-03, 1876-504)
Attendees: Kelvin Wilson, GDOT D7 Cindy Trendway, GDOT NEPA Mike Lobdell, GDOT D7 Kaycee Mertz, GDOT Planning David M. Robbins, GDOT D7 Edlin Regis, GDOT D7 Traffic Ken Werho, GDOT TOTMC Alex Laffey, GDOT Traffic Pam Hooks, GDOT Local Government Andy Anderson, Street Smarts Joshua Higgins, GDOT D7 Preconstruction Kari Ward, Street Smarts Mac Cranford, GDOT D7 Mallory Brewer, Street Smarts Scott Zehngraff, GDOT Traffic Carter Lucas, City of Milton Paul Denard, GDOT Traffic Eric Martin, Kimley-Horn
Meeting Summary: The purpose of this meeting was to discuss the concept of the proposed intersection improvements to New Providence Road at Birmingham Highway, environmental issues and coordination efforts within the project and review the overall project schedule. The meeting took place in the GDOT District 7 Conference Room on July 6, 2010 at 1:30 PM.
Introduction of Each Attendee Project Overview (Street Smarts – Kari Ward/Andy Anderson) Described preferred alternate developed considering the 2006 approved concept report, Community Advisory Committee meetings, PIOH comments, and discussions with GDOT. Need and Purpose Statement (Street Smarts – Kari Ward) Review of statement from the 2006 approved concept. Traffic Projections/Accident History (Street Smarts – Kari Ward) The existing volume did not satisfy 8 warrants. Accidents from 2006-2008 had no fatalities, a few injuries, and the main accident type is rear end. Proposed Project Description (Street Smarts – Kari Ward) The alternative decided upon consists of realigning the intersection approximately 300’ north such that the intersecting skew angle with SR 372 is 80 degrees and improves the vertical site distance. The existing 4-way intersection will be replaced with a roundabout with right turn bypass lanes on SR 372.
ICTM Minutes 2 of 4 PI No. 0005448 Birmingham Hwy Fulton County, City of Milton Existing and Proposed Features (Street Smarts – Kari Ward) The features were reviewed as listed in the Concept Report including the addition of the 10’ multiuse trail in accordance with the City of Milton’s Trails Plan. Right of Way Requirements (Street Smarts – Kari Ward) There are approximately 14 parcel impacts, no displacements. There are 13 temporary easements. Utility Involvement (Street Smarts – Kari Ward) Read list of area utilities from draft Concept Report. Mac Cranford, GDOT D7 Where is Colonial Pipeline? Kari Ward, Street Smarts No utility submittals have been done. It has been included for now and can be taken off. Alternates Considered and Reasons for Rejection (Street Smarts – Kari Ward) Read alternatives from Concept Report. Preferred Concept Alternative (Street Smarts – Kari Ward) Review the concept chosen as described in the Concept Report. Cost Estimate (Street Smarts – Kari Ward) Read costs from Concept Report. Environmental Concerns (Street Smarts – Kari Ward/KHA – Eric Martin) Type of environmental document anticipated: one document for both projects PI No. 0005448 Birmingham Hwy/ SR 372 and PI No. 0000533 Arnold Mill Rd /SR140. Cindy Trendway, GDOT NEPA Is one document okay? Andy Anderson, Street Smarts If it becomes an issue we can separate the document. Eric Martin, KHA We can do whatever is best for the projects. Mike Lobdell, GDOT We don’t want one project to get held up because of the other. Carter Lucas, City of Milton We prefer not to have a project hung up because of another project too. Mike Lobdell, GDOT We are thinking this would be a CE. Kari Ward, Street Smarts At what point do we need to separate the two projects? Cindy Trendway, GDOT NEPA What did Johnathan say when you spoke with him? Kari Ward, Street Smarts It would be faster if we can approve in house. Mike Lobdell, GDOT This project will not be programmatical. Andy Anderson, Street Smarts As long as we are not displacing anything, we will do what we need to do. Ken Werhd, GDOT TOTMC
ICTM Minutes 3 of 4 PI No. 0005448 Birmingham Hwy Fulton County, City of Milton Let KHA do an initial study, and at that point decide if the projects should be separated. Mike Lobdell, GDOT Ok, do special study first and then decide. Mike Martin, KHA Sounds fine, we can look through documents to determine what is there. Andy Anderson, Street Smarts What is the endangered species out there? Mike Martin, KHA
Have to look through documents, but I would be surprised if there are any habitats at these intersections.
Environmental permits/studies required There are no known issues at this time. We are moving forward with developing a CE for both City of Milton Intersection projects PI No. 0005448 Birmingham Hwy/SR 372 and PI No. 0000533 Arnold Mill Rd /SR140.
Coordination (Street Smarts – Kari Ward) Read list from draft Concept Report.
Project Schedule (Street Smarts – Kari Ward) Letting is scheduled for end of 2012.
Comments from Attendees Traffic Safety and Design
Scott Zehngraff, GDOT Traffic 1. Concept won’t get approved without a letter from the local government that states
they are in concurrence with the roundabout and that they will pay the power bill for the lighting at the intersection. Look into design policy manual, chapter 9 for more details on lighting with roundabouts.
2. The max grade for roundabouts is 4%, but it is recommended that a 3% grade be used. Make sure the approaches are flat for site distance.
3. Follow the federal guidelines for site distance triangles at roundabout intersections. 4. Landscaping makes the roundabout easier to sell to community. Landscaping also
adds safety to the roundabout. Ken Werhd, GDOT TOTMC
1. Verify the power easements. There may be power lines that could hold up the process 90-180 days to relocate the power.
2. Verify where the water is going and if any special drainage is needed. 3. Do Erosion Control while designing the intersection.
Environmental Cindy Trendway, GDOT NEPA
1. 9 months for environmental is okay. 2. We don’t have history yet, there is a church and cemetery down the road, but project
ends before the cemetery. 3. Noise study is underway. 4. Special studies from 2006 show that there are two endangered species.
Right of Way Pam Hooks, GDOT, Local Government
1. Revise schedule - add 6 months to R/W Acquisition. 2. Lag letting 60 days from completion of R/W Acquisition.
ICTM Minutes 4 of 4 PI No. 0005448 Birmingham Hwy Fulton County, City of Milton Action Items: 1. Review the Design Policy Manual, Chapter 9 for more information on lighting in a roundabout. 2. Revise schedule - add 6 months to R/W Acquisition. 3. Lag letting 60 days from completion of R/W Acquisition.
The meeting was adjourned at 2:30 pm by Mike Lobdell, GDOT D7.
T h e C I T Y O F M I L T O N . . . k e e p i n g y o u i n f o r m e d
Date: January 14, 2010
Time: 6:00 PM
Location: City Hall, Executive Conference Room
Attendees:
Minutes:
• Carter Lucas began the meeting at 6:00 p.m. by welcoming everyone and giving a brief project introduction. He also discussed the purpose of CAC meeting #1, which is to verify that what was being presented as existing conditions is actually happening.
• Self introductions were made by committee members, City of Milton staff and Street Smarts staff.
• Erika Becker gave an overview of the public involvement process for the project and discussed the purpose of the four CAC meetings and the Public Information Open House (PIOH).
• Several of the CAC members stated that these intersection projects have already been through the review process and wanted to know why we’re doing it again. It was explained that the intersection projects were formerly under the authority of Fulton County. When the City of Milton incorporated, the projects were reassigned to the City. As mandated by GDOT, the review process has to be undertaken again as City of Milton projects.
• CAC members asked if the time to get the project approved could be shortened. Steve Bitney stated that we have to follow the GDOT process since we’re using
Mary Peace Brad Robinson Steve Bitney: Street Smarts
Wilson Borden Mike Stevens Kari Ward: Street Smarts
Yvonne Latorre Kevin O’Sullivan Erika Becker: Street Smarts
Cathy Rhea Sara Leaders: Milton
Star Voigt Carter Lucas: Milton
int
er
se
ct
ion
im
pr
ov
em
en
t p
ro
jec
ts
Sr
14
0 A
rn
ol
d m
il
l r
d a
t c
r 2
7 n
ew
pr
ov
id
en
ce
rd
Sr
37
2 B
ir
min
gh
am
hw
y a
t c
r 2
7 p
ro
vid
en
ce
/ n
ew
pr
ov
id
en
ce
rd
T h e C I T Y O F M I L T O N . . . k e e p i n g y o u i n f o r m e d
GDOT funds for the improvements, so we will not be able to shorten the process. To modify the review process and timeline the City of Milton would have to pay for the project in full.
• Erika Becker explained that counts were collected at each intersection with video cameras to determine the existing conditions at each location.
• The comment was made that many residents tell their children to avoid the intersection of Arnold Mill and New Providence due to safety concerns, so the counts may not be accurate.
• Erika Becker then presented the existing and future conditions simulations for the AM peak hour at the intersection of Arnold Mill Road and New Providence Road. It was noted that New Providence Road is currently operating at LOS F and will continue to decline into the future. Many of the committee members commented that traffic on Arnold Mill Road is actually much heavier than it appears in the simulation.
• Other questions asked about this simulation included:
• What is the peak hour? The AM peak hour is from 7:00 am to 8:00 am.
• When were the counts taken? Counts were collected on Wednesday November 11, 2009.
• What are the plans for future widening on SR 140 and will future plans be considered when designing this project? Arnold Mill is a GDOT roadway and any plans to widen the road are long range. Funds have not been identified for widening. As a result, this intersection will not be designed to tie into any future projects.
• A CAC member requested the City look into a “No-Left Turn” sign on SR 140 SB to improve conditions for vehicles waiting to turn left from New Providence onto SR 140.
• A CAC member commented that they had heard a signal was going to be installed at the intersection of Green Road and Arnold Mill Road. Other members commented that they didn’t think a signal was needed at this location. Carter Lucas stated that he was not aware of plans to install a signal at this location.
• The comment was made that a temporary signal could be installed at this location as was done by the City of Roswell at Rucker Road and Crabapple.
• Additional issues identified by the CAC for the SR 140/New Providence Road intersection include:
• Vehicles turning left from SR 140 onto New Providence cause additional delay, there is a need for an increased police presence, dump trucks are speeding, it is more difficult in the afternoon to turn left from New Providence onto SR 140.
• Erika Becker then presented the existing and future conditions simulations for the AM peak hour at the intersection of Birmingham Highway and Providence/New
Providence Road. It was noted that several legs of this intersection fail under existing conditions and that the level of service of the intersection will continue to fail into the future.
• Safety at this intersection was also discussed. Committee members commented that there is limited sight distance and many won’t drive through the intersection at night due to safety concerns.
• A CAC member requested accident data, which the consultant agreed to email to the committee.
• The CAC committee requested that the City look into short-term improvements at both intersections and get additional information from GDOT regarding such improvements.
• A CAC member asked about Fulton County Schools installing a temporary measure at Birmingham Highway and Providence Road due to the districting of the elementary schools and the routes that require difficult movements at the intersection. The response was that Fulton County Schools do not contribute to off-site improvements.
• Additional issues identified by the CAC for the Birmingham Highway/Providence Road intersection include:
• Difficult movements for access to schools due to redistricting, sight distance, speeds approaching the intersection and accidents.
• Kari Ward then presented the alternatives that were previously considered for the two intersections when Fulton County was leading the projects. She also discussed the new GDOT requirement to analyze the feasibility of a roundabout at each location.
• Erika Becker indicated that preliminary roundabout analysis shows that a roundabout will not operate adequately at either location with one lane. A multi-lane roundabout would be required. CAC members commented that a multi-lane roundabout may be confusing for drivers.
• Other alternatives presented by various CAC members include:
• Reroute traffic to Cox Road and cul-de-sac New Providence.
• Design a split interchange at Birmingham Highway. (Distance between the two intersections would have to meet GDOT requirements.)
• The consultant agreed to evaluate these additional alternatives along with the alternatives presented in the Fulton County concept report. Their finding will be presented to the CAC at the February 18th meeting.
• The meeting adjourned at 7:30 p.m.
int
er
se
ct
ion
im
pr
ov
em
en
t p
ro
jec
ts
Sr
14
0 A
rn
ol
d m
il
l r
d a
t c
r 2
7 n
ew
pr
ov
id
en
ce
rd
Sr
37
2 B
ir
min
gh
am
hw
y a
t c
r 2
7 p
ro
vid
en
ce
/ n
ew
pr
ov
id
en
ce
rd
T h e C I T Y O F M I L T O N . . . k e e p i n g y o u i n f o r m e d
CAC Meeting #2 Meeting Minutes
Sr
14
0 A
rn
ol
d m
il
l r
d a
t c
r 2
7 n
ew
pr
ov
id
en
ce
rd
Sr
37
2 B
ir
min
gh
am
hw
y a
t c
r 2
7 p
ro
vid
en
ce
/ n
ew
pr
ov
id
en
ce
rd
int
er
se
ct
ion
im
pr
ov
em
en
t p
ro
jec
ts
T h e C I T Y O F M I L T O N . . . k e e p i n g y o u i n f o r m e d
Date: February 18, 2010
Time: 6:00 PM
Location: City Hall, Executive Conference Room
Attendees:
Minutes: • The meeting began 6:00 p.m. Self introductions were made by committee members,
City of Milton staff and Street Smarts staff.
• Erika Becker presented the updated AM and PM existing conditions simulations for the Arnold Mill Road (SR 140) at New Providence Road (CR 27) intersection.
• Andy Anderson stated that since 2006, when these project first began with Fulton County, GDOT has changed their standards and we are now required to analyze a roundabout at each location.
• Mr. Anderson also stated that GDOT will fund a roundabout at 100%, as opposed to the 80%/20% split that is require for a signal.
• Star Voigt stated that she thought based on the information presented at the last meeting that a roundabout wouldn’t work at the Arnold Mill Road (SR 140) at New Providence Road (CR 27) intersection.
• Mr. Anderson stated that we have not yet completed our detailed analysis, but that a roundabout with slip lanes or a multi-lane roundabout would work.
• Yvonne Latorre asked which is more cost effective; a signal or a roundabout?
• Mr. Anderson stated that in many cases a roundabout is more cost effective because it doesn’t require as much right-of-way. Roundabouts require a little more land at the
Kevin O’Sullivan Star Voigt Andy Anderson: Street Smarts
Brad Robinson Scott Lutoa Kari Ward: Street Smarts
Yvonne Latorre Sara Leaders: Milton Erika Becker: Street Smarts
Cathy Rhea Carter Lucas: Milton John Lewis: Street Smarts
int
er
se
ct
ion
im
pr
ov
em
en
t p
ro
jec
ts
Sr
14
0 A
rn
ol
d m
il
l r
d a
t c
r 2
7 n
ew
pr
ov
id
en
ce
rd
Sr
37
2 B
ir
min
gh
am
hw
y a
t c
r 2
7 p
ro
vid
en
ce
/ n
ew
pr
ov
id
en
ce
rd
T h e C I T Y O F M I L T O N . . . k e e p i n g y o u i n f o r m e d
intersection, but signals require more land for turn lanes.
• Cathy Rhea asked if a roundabout could be installed faster than a signal, which is projected to take approximately 3 years. Ms. Rhea also expressed concern about vehicle speeds on SR 140 when they enter a proposed roundabout.
• Mr. Anderson stated that the timeframe to complete a roundabout would be the same as a signal. They both have to go through the same environmental review process. He also stated that speeds through a roundabout are typically 15-20 mph and that appropriate signage would be in place to prepare drivers for an upcoming roundabout.
• Ms. Latorre asked if Streets Smarts can prepare a simulation for the roundabouts?
• Mr. Anderson stated that a simulation will be created for the preferred alternative at each intersection. If a roundabout is recommended for these locations then a simulation will be created.
• Kari Ward presented the design alternatives for each intersection. The following alternatives for Arnold Mill were presented: (1) Realign the intersection 140 feet west and signalize, (2) realign the intersection 700 feet west and signalize, (3) no-build, and (4) installation of a roundabout.
• The following alternatives for Birmingham Highway were also presented: (1) realign the intersection 500 feet to the north and signalize, (2) realign the intersection 500 feet to the north and install a roundabout, (3) realign the intersection 500 feet to the north, signalized and reduce the speed to 35 mph, (4) no-build, and (5) installation of a roundabout at the existing intersection location.
• Ms. Ward showed the committee an example of a roundabout that was installed at an intersection with a similar design in Douglasville, GA.
• Ms. Voigt asked if the property around the Birmingham Highway intersection were developed as commercial, would access to the development negatively affect a roundabout?
• Mr. Anderson stated that GDOT requires driveways to be located at least 200 feet from a roundabout.
• Mr. Anderson also stated that the alternative with the least impact would be to install a roundabout at the current intersection location. A small amount of right-of-way would be required to adjust the intersection to a preferred 45 degree skew angle.
• Ms. Ward presented the following alternatives that were identified at CAC Meeting #1: (1) reroute traffic to Cox Road and cul-de-sac New Providence Road and (2) split interchange at Birmingham Highway.
• Carter Lucas then discussed short-term improvements that were identified during CAC Meeting #1. He stated that he had met with GDOT to discuss installation of a temporary signal at Arnold Mill. GDOT stated that they would not approve a
“temporary” signal. The “temporary” signal would have to go through the normal review process and that permanent materials would be required. Installation of a “temporary” signal would cost approximately $100,000 to $150,000. Based on the time required for the signal review process, the “temporary” signal will likely be installed only one year ahead of the projected “permanent” signal installation. In addition, the “temporary” signal could not be removed until the “permanent” signal is installed, which will cost an additional $100,000 to $150,000 in materials. In summary, it will cost twice as much to install a signal one year ahead of the projected schedule.
• Mr. Lucas stated that he had also met with City of Roswell staff to discuss the signal timing at the intersection of SR 140 at SR 372 (Crabapple Road). Unfortunately the meeting did not result in any changes to the signal timing, which seems to be playing a role in the queue of AM traffic through the SR 140 at CR 27 intersection.
• Ms. Voigt asked if there was any way to push the Birmingham project through faster than the projected 2013 completion date. She commented that this intersection is very dangerous and that residents shouldn’t have to wait that long.
• Mr. Anderson stated that if state and federal funds are used to pay for the project then the project process, including a lengthy environmental review, must be followed. If the sequence of events gets out of order there is a risk of losing funding, so unfortunately the timeline can’t really be moved ahead any faster.
• Mr. Lucas stated that the intersections are being designed concurrently. He asked if they could be separated if one runs into problems so that construction at the other intersection would not be delayed.
• Ms. Voigt suggested widening New Providence Road to allow for a dedicated right turn lane.
• Ms. Becker reviewed the upcoming meeting dates: CAC Meeting #3 March 18, 2010, PIOH April 20, 2010, and CAC Meeting #4 May 10, 2010.
• Many committee members stated that they are not available March 18, 2010 for CAC Meeting #3.
• Ms. Becker stated that she would send out an alternate date and let everyone know what works best for the committee as a whole.
• Ms. Becker also presented the project website to the committee and stated that the purpose of the website is to provide users with the materials presented at the CAC meetings and other relevant project information.
• Mr. Anderson stated that Street Smarts will begin the process of developing design details for the preferred alternative at each intersection and that these details will be presented at CAC Meeting #3.
• The meeting adjourned at 7:15 p.m.
int
er
se
ct
ion
im
pr
ov
em
en
t p
ro
jec
ts
Sr
14
0 A
rn
ol
d m
il
l r
d a
t c
r 2
7 n
ew
pr
ov
id
en
ce
rd
Sr
37
2 B
ir
min
gh
am
hw
y a
t c
r 2
7 p
ro
vid
en
ce
/ n
ew
pr
ov
id
en
ce
rd
T h e C I T Y O F M I L T O N . . . k e e p i n g y o u i n f o r m e d
CAC Meeting #3 Meeting Minutes
Sr
14
0 A
rn
ol
d m
il
l r
d a
t c
r 2
7 n
ew
pr
ov
id
en
ce
rd
Sr
37
2 B
ir
min
gh
am
hw
y a
t c
r 2
7 p
ro
vid
en
ce
/ n
ew
pr
ov
id
en
ce
rd
int
er
se
ct
ion
im
pr
ov
em
en
t p
ro
jec
ts
T h e C I T Y O F M I L T O N . . . k e e p i n g y o u i n f o r m e d
Date: March 23, 2010
Time: 6:00 PM
Location: City Hall, Executive Conference Room
Attendees:
Minutes: • The meeting began 6:00 p.m. Self introductions were made by meeting attendees
including committee members, GDOT staff, City of Milton staff and Street Smarts staff.
• Erika Becker gave an overview of the meeting purpose, which was to present the preferred design alternative for each intersection.
• Ms. Becker stated that installation of a traffic signal is the preferred alternative for the intersection of Arnold Mill Road (SR 140) at New Providence Road (CR 27). Future year 2032 AM and PM peak hour conditions simulations for the intersection were presented to the committee.
• Ms. Becker then presented a roundabout as the preferred alternative for the intersection of Birmingham Highway (SR 372) at Providence / New Providence Road (CR 27). Future year 2012 and 2032 AM peak hour conditions simulations for the intersection were presented to the committee.
• Andy Anderson stated that a signal would not be warranted at this location.
• A CAC member asked would a roundabout require more right-of-way (ROW) and therefore be more expensive than a signal?
• Mr. Anderson stated that the proposed roundabout would require more ROW at the
Kevin O’Sullivan Scott Lee: GDOT Andy Anderson: Street Smarts
Yvonne Latorre Kelvin Wilson: GDOT Erika Becker: Street Smarts
Cathy Rhea Sara Leaders: Milton
Adam Orkin Steve Bitney: Street Smarts
int
er
se
ct
ion
im
pr
ov
em
en
t p
ro
jec
ts
Sr
14
0 A
rn
ol
d m
il
l r
d a
t c
r 2
7 n
ew
pr
ov
id
en
ce
rd
Sr
37
2 B
ir
min
gh
am
hw
y a
t c
r 2
7 p
ro
vid
en
ce
/ n
ew
pr
ov
id
en
ce
rd
T h e C I T Y O F M I L T O N . . . k e e p i n g y o u i n f o r m e d
center, but when compared to the amount of ROW needed for a signalized intersection with turn lanes it is less and therefore less expensive. Mr. Anderson showed the committee the original signalized concept for the intersection and pointed out the greater amount of ROW that would be taken versus the ROW needed for the proposed roundabout.
• A CAC member asked about signage for the roundabout.
• Mr. Anderson stated that the roundabout will be well signed to alert oncoming drivers and that there will be a concrete apron for trucks and tractor-trailers.
• A CAC member asked if the approaches entering and exiting the roundabout could be separated more to allow for gaps to enter the roundabout.
• Mr. Anderson stated that, given the geometrics of the proposed intersection design, we’ve attempted to separated them as much as possible.
• A CAC member asked about the possibility of installing a “peak hour signal” at the Birmingham Highway intersection that would only operate during the AM and PM peak hours.
• Mr. Anderson stated that GDOT does not permit any type of “temporary” signal.
• A CAC member asked about funding for the roundabout.
• Mr. Anderson stated that GDOT will fund roundabouts at 100% as long as there is money available.
• In closing, Mr. Anderson stated that we will be working closely with GDOT to refine the proposed alternatives presented tonight to the CAC.
• The meeting adjourned at 7:00 p.m.
CONFERENCE CALL SUMMARY
Date: June 4, 2010 9:00 AM
Taken By: Kari Ward, PE
Subject: GDOT Traffic Review of Alternatives HPP00-0005-00(448), P.I. No. 0005448, Fulton County, City of Milton Birmingham Hwy/ SR 372 (09-SSI-03, 1876-504)
Attendees: Scott Zehngraff, GDOT Traffic Kari Ward, Street Smarts Ken Werho, GDOT TOTMC Arwin Lopez, Street Smarts Paul Denard, GDOT Traffic
Meeting Summary: The purpose of this meeting was to discuss the alternatives developed based on the ICTM comments emailed to GDOT Traffic for review on 5/27/10. “Alt 1 CR27 Bypass” “Alt 2 Dual Entry” “Alt 5 Realign SR 372”
Comments from Attendees Traffic Safety and Design Scott Zehngraff, GDOT Traffic
1. Eliminate “Alt 1 CR27 Bypass” 2. “Alt 2 Dual Entry” will work. 3. “Alt 5 Realign SR 372” is best solution; it doesn’t have tight angles and allows more
separation between the approaches but requires more R/W than “Alt 2 Dual Entry”.
Conference Call Minutes 2 of 3 PI No. 0005448 Birmingham Hwy Fulton County, City of Milton
4. For future expansion to a multilane roundabout, submit alternative to show multilane roundabout with dual exits on SR 372 (see Example 1).
5. Add flare and pavement markings on the eastbound New providence Road and northbound SR372 approaches (see Example 2).
Example 1 Two-Lane Entries and Exits on Major Route One-Lane Entries and Exits on Minor Route
Example 2 Two-Lane Entries and One-Lane Exists on Major Route One-Lane Entries and Exists on Minor Route
Example of two-lane approach with two Lanes at entry
Example of one-lane approach flaring to two lanes at lanes at entry
Conference Call Minutes 3 of 3 PI No. 0005448 Birmingham Hwy Fulton County, City of Milton
6. Send GDOT Traffic revisions discussed for review; copy Ken Werho, Paul Denard and
Kelvin Wilson. Ken Werho, GDOT TOTMC
1. Show the truck apron on the layouts. 2. Show the splitter islands on “Alt 5 Realign SR 372” the same as “Alt 3 Dual Entry”.
Paul Enard, GDOT TOTMC 1. Label the inscribed diameter.
Scott Zehngraff, GDOT Traffic Q: What is the inscribed diameter? Arwin Lopez, StreetSmarts A: 100’ radius (200’ diameter)
Action Items: Send GDOT Traffic revisions discussed for review; copy Ken Werho, Paul Denard and Kelvin Wilson.
The meeting was adjourned at 9:20 am.
K:\1800\1876-503 Arnold Mill Rd\Roadway\Project Management\Meetings_Memos_Conv Records\Minutes 2010-06-04 GODT Traffic Review.docx
3160 Main Street Suite 100 Duluth, GA 30096 phone: (770) 813-0882 fax: (770) 813-0688 www.streetsmarts.us
September 23, 2010 Mr. Kelvin Wilson GDOT District Seven Design 5025 New Peachtree Road Chamblee, GA 30341 Re: QC/QA Certification: Concept Report HPP00-0005-00(448), Fulton County, City of Milton
PI No. 0005448, SR 372/Birmingham Hwy @ CR 27/Providence Rd/New Providence
Mr. Wilson: In accordance to GDOT’s request for Consultant QC/QA certification, this letter certifies that the Concept Report for PI No. 0005448 SR 372/Birmingham Hwy @ CR 27/Providence Rd/New Providence Rd in Fulton County has been prepared in compliance with GDOT standards, is accurate and has been reviewed by our internal quality control and quality assurance policies, procedures and measures. Please do not hesitate to contact me if you have any questions or require additional information. Sincerely, Kari Ward, P.E. Project Manager