28
Department of Water and Power City of Los Angeles Energy Cost Adjustment Factor Modification August 2009 MODIFIED PROPOSAL WILL BE SUBMITTED ON DECEMBER 1, 2009
| Date post: | 30-Dec-2015 |
| Category: |
Documents |
| Upload: | avice-mathews |
| View: | 214 times |
| Download: | 0 times |

Department of Water and Power City of Los Angeles
Energy Cost Adjustment Factor ModificationAugust 2009
MODIFIED PROPOSAL WILL BE SUBMITTED ON DECEMBER 1, 2009
2
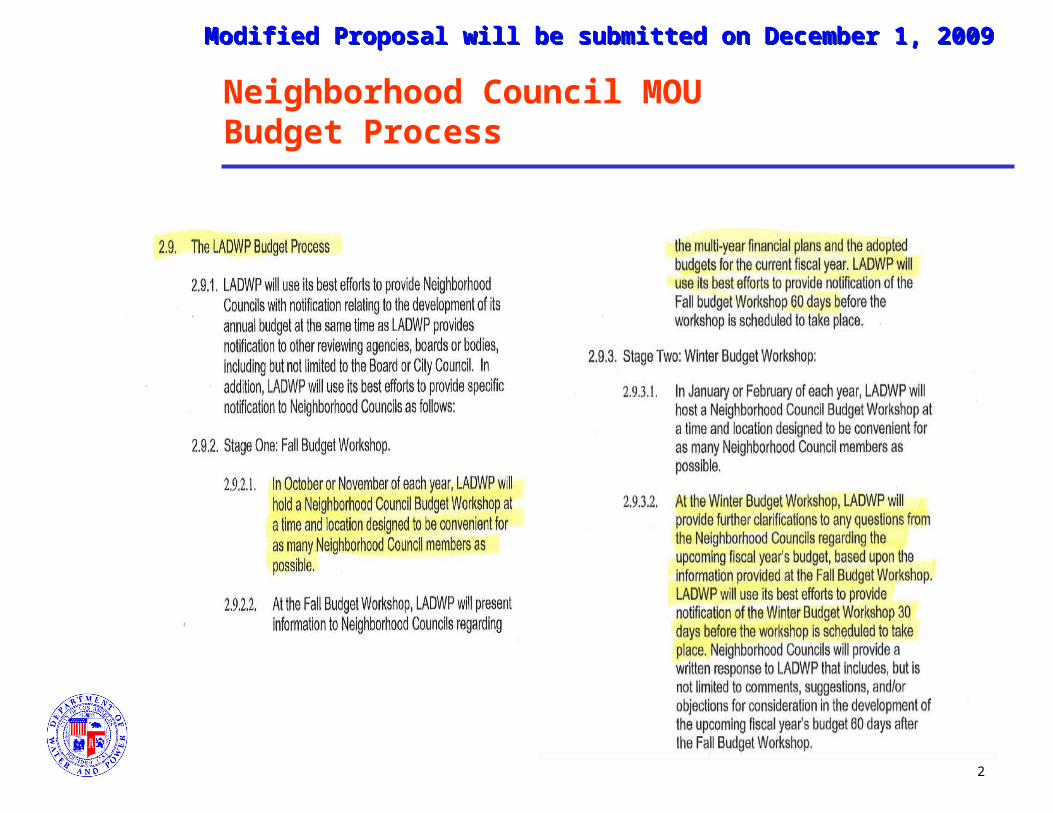
Neighborhood Council MOUBudget Process
Modified Proposal will be submitted on December 1, 2009Modified Proposal will be submitted on December 1, 2009

3
SCOPE OF PROPOSAL
Present a High Level Review of DWP’s Proposed Energy Cost Adjustment Factor (ECAF) Action and Underlying Revenue Requirements
Determine the Need and Propriety of the Magnitude and Timing of Proposed Rate Action, Based on DWP’s Financial Requirements
Present Options for Alternative ECAF Rate Designs– Restructuring of Tiered Electric Rates
Modified Proposal will be submitted on December 1, 2009Modified Proposal will be submitted on December 1, 2009

4
POWER SYSTEMFINANCIAL REQUIREMENTS
Maintain Double-A Bond Ratings– Target minimum debt service coverage of 2.25 times
Maintain City Transfer – Prior year’s net income must be equal to or greater than 8% of prior
year’s gross operating revenue
Maintain Appropriate Operating Cash Reserves– Current Estimated Target is $300 million
Maintain Appropriate Balance Between Debt and Equity Funding of Capital Improvement Program– 60% debt & 40% equity (cash)
Modified Proposal will be submitted on December 1, 2009Modified Proposal will be submitted on December 1, 2009

5
ECAF Cap Recommendations Financial Advisor Comments
• The LADWP had a review of the Power System Financial Planning Criteria in May 2009 to ensure that AA Bond Ratings are maintained given the substantial borrowing in a Changed Financial Market. Major recommendations related to ECAF:
- Future ratepayers may be faced with a massive liability if LADWP is exposed to extended periods of significant unanticipated power purchase or fuel cost increases.
- As a result, the LADWP could no longer finance under collected ECAF expenses and would have no option but to increase rates.
- The Cap on ECAF adjustments actually provides little benefit to ratepayers, but exposes the LADWP to great financial risks.
- Removing the Cap on the ECAF would prevent a reduction in the LADWP’s Bond rating.
Modified Proposal will be submitted on December 1, 2009Modified Proposal will be submitted on December 1, 2009

6
ECAF Cap Recommendations Industrial, Economic and Administrative Survey
• In February 2009, PA Consulting performed an Independent Strategic Assessment of the LADWP. The recently completed IEA Survey stated:
- While the ECAF allows the LADWP a measure of security, the quarterly rate adjustment cap prevent the complete sharing of risks with customers.
- A sharp increase in the natural gas price might compromise the LADWPs credit rating.
- PA Consulting also indicated the LADWP should consider increased hedging, however the primary increases to the ECAF are driven by renewables.
Modified Proposal will be submitted on December 1, 2009Modified Proposal will be submitted on December 1, 2009

7
ECAF Cap Recommendations Recent FitchRatings Downgrades
• In May 2009, downgraded its rating on Imperial Irrigation District (IID) from AA- to A+:
- IID was downgraded because they did not have adequate coverage of existing debt.
- The current ECAF only recovers a portion of the Power Supply Costs while the remaining amount is embedded in the Base Rates.
- IID is contemplating a restructure of the ECAF to capture their Full Supply Costs.
• Imperial Irrigation District
- Situated in Imperial Valley, the IID delivers water to over 450,000 acres of farmland in southernmost Southern California. The district’s electrical division, IID Energy, has become the sixth largest consumer-owned utility in the state and serves more than 145,000 residential, commercial and industrial customers. IID has a combined work force of more than 1,400 employees.
Modified Proposal will be submitted on December 1, 2009Modified Proposal will be submitted on December 1, 2009

8
Power Financial Plan Summary - Recommended
Base Revenue Inc % 0.0% 0.0% 6.6% 3.8% 3.8%
295 347 344 139 202
June (Final) Current*
FISCAL YEAR ENDING JUNE 30 2008 2009 2010 2011 2012 2013 2014
1. Retail Sales (GWh) 24,617 24,410 24,016 24,209 24,549 24,850 25,275 Adj. For DSM (GWh) 0 (150) (440) (708) (961) (1,246) Adj. For Solar (GWh) 0 0 (6) (16) (30) (48) (71) Net Retail Sales(GWh) 24,617 24,410 23,859 23,753 23,811 23,841 23,959
2. Operating Revenue:
Base Rate 1,634 1,614 1,594 1,589 1,593 1,843 1,999Base Rate Revenue Increases 0 (0) 0 0 248 145 156Energy Cost Adjustment 827 1,028 1,303 1,670 1,759 1,730 1,758Reliability Costs Adjustment 3 49 69 75 99 124 150Street Lighting & Special Contract 38 31 29 34 35 35 35Total Retail Revenue 2,502 2,722 2,995 3,368 3,735 3,878 4,098Wholesale Sales (Gen. & Trans.) 105 77 54 57 62 63 63Deferred Revenue 173 97 169 129 25 137 180Others 2 4 24 38 51 65 64Total Operating Revenue 2,782 2,900 3,242 3,591 3,873 4,143 4,405
3. Borrowing 654 550 616 951 993 835 736
4. Capital Expenditures 595 770 940 1,194 1,392 1,155 1,1325. Operation & Maintenance Expenses 774 814 863 926 1,001 1,085 1,1446. Public Benefits 15 18 38 39 41 42 43 Total Expenditures 1,384 1,602 1,841 2,159 2,434 2,282 2,319
7. Net Income 322 407 405 428 512 593 7448. Transfer to City 182 223 232 259 287 310 331 Income after City Transfer 140 185 173 169 225 284 4139.Financial Ratios: Debt Service Coverage (cur/cur) 3.1 2.89 2.26 2.26 2.44 2.30 2.37 Additional Bond Test (prev/max) 2.1 2.1 2.2 2.1 2.1 2.2 2.3 Capitalization Factor 52% 52.9% 54.3% 56.7% 58.7% 59.5% 59.4%
10. Average Rate ($/MWh)
Residential $107 $118 $131 $147 $163 $168 $177Small Business (A-1) $119 $131 $144 $161 $179 $186 $197Med. Business (A-2) $109 $120 $133 $150 $166 $172 $182Large Business (A - 3) $93 $104 $117 $134 $148 $153 $160System Average $102 $112 $126 $142 $158 $164 $172
FORECAST
Total Revenue Inc ($M)
Recommended Budget Case
Modified Proposal will be submitted on December 1, 2009Modified Proposal will be submitted on December 1, 2009
9
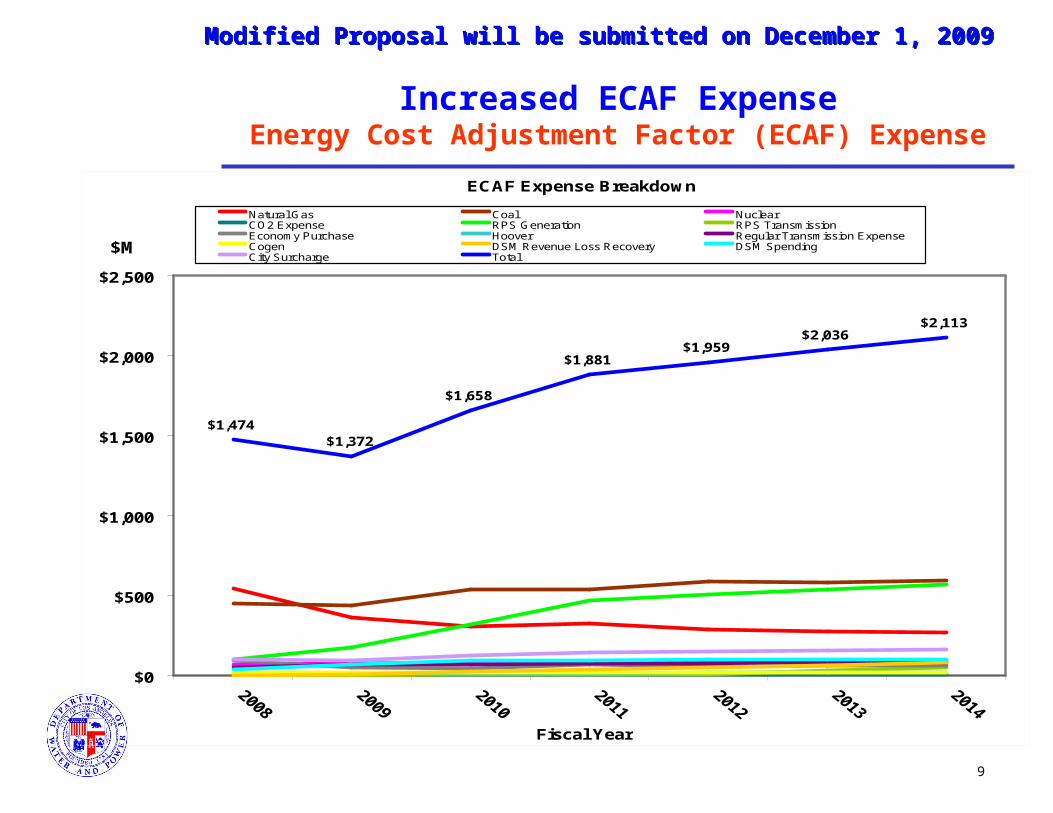
Increased ECAF ExpenseEnergy Cost Adjustment Factor (ECAF) Expense
ECAF Expense Breakdown
$1,474$1,372
$1,658
$1,881$1,959
$2,036$2,113
$0
$500
$1,000
$1,500
$2,000
$2,500
Fiscal Year
$M
Natural Gas Coal NuclearCO2 Expense RPS Generation RPS TransmissionEconomy Purchase Hoover Regular Transmission ExpenseCogen DSM Revenue Loss Recovery DSM SpendingCity Surcharge Total
Modified Proposal will be submitted on December 1, 2009Modified Proposal will be submitted on December 1, 2009

10
Increased ECAF ExpenseECAF Expense Breakdown
* Does not include State or Federal CO2 tax or expense* Does not include State or Federal CO2 tax or expense
ECAF Expense Categorized ($Millions)
FY 2008 2009 2010 2011 2012 2013 2014
Natural Gas $542 $362 $310 $325 $288 $278 $267
Coal $448 $438 $537 $537 $588 $583 $592
Nuclear $70 $73 $80 $86 $85 $84 $86
CO2 Expense $0 $0 $8 $8 $8 $8 $8
RPS Generation $102 $174 $319 $468 $509 $536 $571
RPS Transmission $0 $2 $6 $6 $6 $30 $50
Economy Purchase $93 $51 $48 $67 $60 $64 $66
Hoover $15 $15 $16 $16 $17 $17 $17
Regular Transmission Expense $48 $71 $73 $76 $79 $90 $86
Others $156 $185 $263 $292 $319 $346 $371
Total $1,474 $1,372 $1,658 $1,881 $1,959 $2,036 $2,113
Cost per MWh of ECAF Categories ($/MWh)
FY 2008 2009 2010 2011 2012 2013 2014
Natural Gas $61.4 $45.4 $56.8 $56.8 $59.5 $57.6 $56.7
Coal - Navajo, Fuel Only $16.4 $15.1 $16.0 $18.6 $19.6 $20.5 $21.5
Coal - IPP $46.2 $47.6 $54.2 $63.8 $63.9 $63.4 $64.7
Nuclear (LADWP), Fuel Only $5.1 $5.6 $10.6 $13.3 $11.5 $10.0 $10.0
Nuclear (SCPPA) $58.0 $54.4 $52.6 $53.5 $54.8 $56.4 $57.8
CO2 Expense $0.0 $0.0 $0.0 $0.0 $0.0 $0.0 $0.0
RPS Generation Expense $65.0 $67.8 $75.1 $92.9 $99.1 $103.1 $103.7
RPS Transmission Expense $0.0 $0.9 $1.5 $1.2 $1.2 $5.8 $9.1
Economy Purchase $56.7 $34.1 $36.7 $47.8 $49.9 $51.1 $52.0
Hoover $25.3 $26.2 $27.3 $27.9 $29.2 $29.9 $28.8
Average $51.5 $48.5 $61.0 $68.8 $70.5 $72.5 $74.0
Modified Proposal will be submitted on December 1, 2009Modified Proposal will be submitted on December 1, 2009

11
Increased ECAF Expense Renewable Portfolio Standard (RPS)
Natural Gas Expense Displaced by RPS Expense
$0
$100
$200
$300
$400
$500
$600
2008 2009 2010 2011 2012 2013 2014
$Millions
Natural Gas Digester Gas Hydro - Power SystemHydro - Water System RPS Biogas RPS GeothermalRPS Hydro RPS Solar - Central RPS Solar - UOSRPS Solar - Others RPS ST Purchase RPS WindTotal RPS
Total RPS
Natural Gas (not part of RPS)
GenerationGeneration
Modified Proposal will be submitted on December 1, 2009Modified Proposal will be submitted on December 1, 2009
12
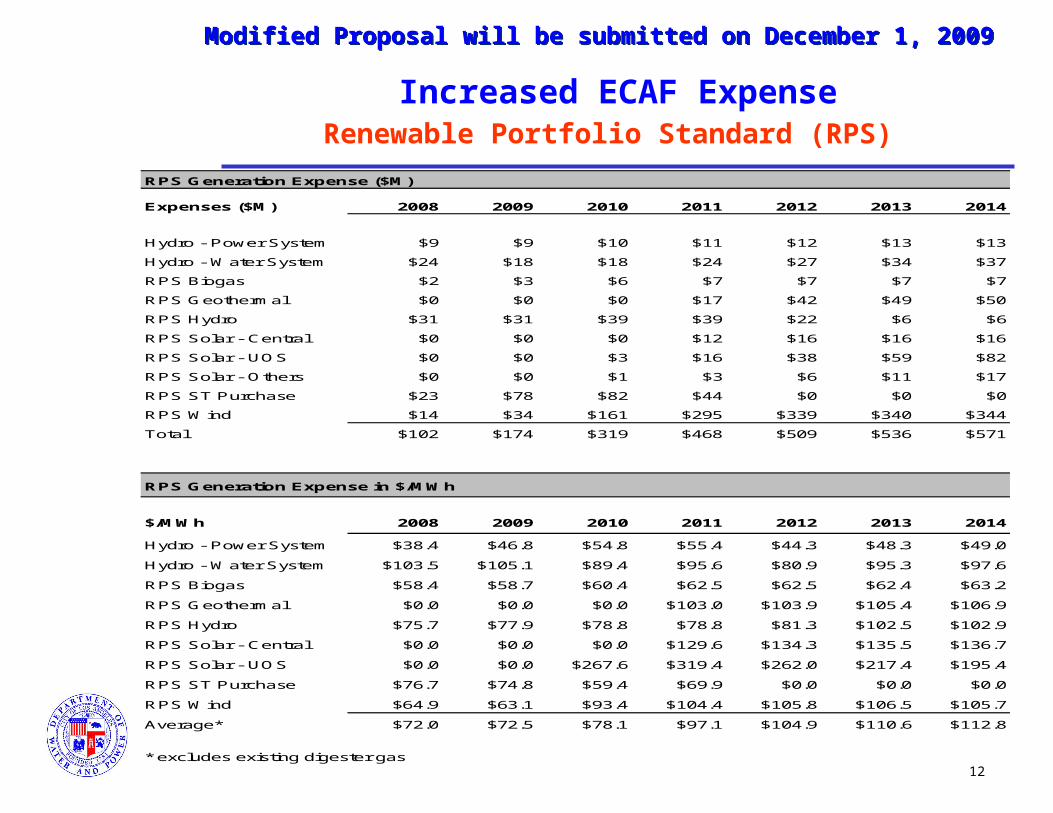
Increased ECAF ExpenseRenewable Portfolio Standard (RPS)
RPS Generation Expense ($M)
Expenses ($M) 2008 2009 2010 2011 2012 2013 2014
Hydro - Power System $9 $9 $10 $11 $12 $13 $13
Hydro - Water System $24 $18 $18 $24 $27 $34 $37
RPS Biogas $2 $3 $6 $7 $7 $7 $7
RPS Geothermal $0 $0 $0 $17 $42 $49 $50
RPS Hydro $31 $31 $39 $39 $22 $6 $6
RPS Solar - Central $0 $0 $0 $12 $16 $16 $16
RPS Solar - UOS $0 $0 $3 $16 $38 $59 $82
RPS Solar - Others $0 $0 $1 $3 $6 $11 $17
RPS ST Purchase $23 $78 $82 $44 $0 $0 $0
RPS Wind $14 $34 $161 $295 $339 $340 $344
Total $102 $174 $319 $468 $509 $536 $571
RPS Generation Expense in $/MWh
$/MWh 2008 2009 2010 2011 2012 2013 2014
Hydro - Power System $38.4 $46.8 $54.8 $55.4 $44.3 $48.3 $49.0
Hydro - Water System $103.5 $105.1 $89.4 $95.6 $80.9 $95.3 $97.6
RPS Biogas $58.4 $58.7 $60.4 $62.5 $62.5 $62.4 $63.2
RPS Geothermal $0.0 $0.0 $0.0 $103.0 $103.9 $105.4 $106.9
RPS Hydro $75.7 $77.9 $78.8 $78.8 $81.3 $102.5 $102.9
RPS Solar - Central $0.0 $0.0 $0.0 $129.6 $134.3 $135.5 $136.7
RPS Solar - UOS $0.0 $0.0 $267.6 $319.4 $262.0 $217.4 $195.4
RPS ST Purchase $76.7 $74.8 $59.4 $69.9 $0.0 $0.0 $0.0
RPS Wind $64.9 $63.1 $93.4 $104.4 $105.8 $106.5 $105.7
Average* $72.0 $72.5 $78.1 $97.1 $104.9 $110.6 $112.8
* excludes existing digester gas
Modified Proposal will be submitted on December 1, 2009Modified Proposal will be submitted on December 1, 2009

13
LADWP ProposalIncreased Cap on Energy Cost Adjustment Factor (ECAF)
• To ensure the Power System maintains its “AA” Bond Ratings LADWP is proposing to increase the cap of the ECAF based on the following criteria:
- Under collection / Over collection greater than $200M• Increase/Decrease quarterly cap by 2¢/kWh
- Under collection / Over collection greater than $400M• Increase/Decrease quarterly cap by 2¢/kWh
• Total annual increases (base rates and pass through charges) to the LADWP customers will be limited to less than 10% unless any or all of the following unfavorable Financial Conditions exist:
- Debt Service Coverage less than 2.25X- Cash Target less than $300 million- Capitalization Factor exceeds 60%
• The Board of Water and Power Commissioners will adjust the Cap as authorized in the current Electric Rate Ordinance
Modified Proposal will be submitted on December 1, 2009Modified Proposal will be submitted on December 1, 2009

14
LADWP Restructured Residential Rate Proposal for IncreasedEnergy Cost Adjustment Factor (ECAF)
• The modification to increase the ECAF cap will accomplish the following:
- Provide the Revenue to meet the Power System Financial Planning Criteria
- Support Financial Stability
• This Alternative Rate Proposal will Restructure Residential Tiered Rates to accomplish the following:
- Encourage Conservation- Minimize Rate Impact on Customers (TIER 1) who
Conserve Energy- Reduce Demand on Power System
Modified Proposal will be submitted on December 1, 2009Modified Proposal will be submitted on December 1, 2009

15
LADWP Alternative Proposal for IncreasedEnergy Cost Adjustment Factor (ECAF)
• This Alternative Rate Proposal will Restructure Residential Tiered Rates as follows:
- Modify 1st, 2nd and 3rd Tiers to increase price signals between each Tier
- Lower the 1st Tier price to reward customers who conserve energy
- Increase the 2nd and 3rd Tier rate to encourage customers with high energy use to reduce demand or switch to the time-of-use rate and shift demand
- Add a 2nd and 3rd Tier price signal during the Winter Season to encourage conservation year-round
Modified Proposal will be submitted on December 1, 2009Modified Proposal will be submitted on December 1, 2009

16
LADWP Alternative Proposal for IncreasedEnergy Cost Adjustment Factor (ECAF)Tiered Rates – Summer Rates
Energy Charge - per kWh Base Rate ECAF Total (1)Tier 1 - per Zone Allocation 0.07020$ 0.04890$ 0.11910$ Tier 2 - per Zone Allocation 0.08520$ 0.04890$ 0.13410$ Tier 3 - per Zone Allocation 0.10820$ 0.04890$ 0.15710$
Energy Charge - per kWh Base Rate ECAF Total (1) Increased AmountTier 1 - per Zone Allocation 0.07020$ 0.05290$ 0.12310$ 0.0040 Tier 2 - per Zone Allocation 0.08520$ 0.05290$ 0.13810$ 0.0040 Tier 3 - per Zone Allocation 0.10820$ 0.05290$ 0.16110$ 0.0040
Energy Charge - per kWh Base Rate ECAF Total (1) Increased AmountTier 1 - per Zone Allocation 0.05841$ 0.06690$ 0.12531$ 0.0062 Tier 2 - per Zone Allocation 0.11050$ 0.06690$ 0.17740$ 0.0433 Tier 3 - per Zone Allocation 0.17521$ 0.06690$ 0.24211$ 0.0850
(1) Total does not include ESA and RCA
Rate A - Standard Service (High Season, June through September)
(as of July 1, 2009 per existing rate ordinance)
(as of July 1, 2010 with Rate Restructure and with additional ECAF increase)
(as of July 1, 2010 without additional ECA increase and without rate restructuring)
Modified Proposal will be submitted on December 1, 2009Modified Proposal will be submitted on December 1, 2009

17
LADWP Alternative Proposal for IncreasedEnergy Cost Adjustment Factor (ECAF)Tiered Rates – Winter Rates
Energy Charge - per kWh Base Rate ECAF Total (1)Tier 1 - per Zone Allocation 0.07020$ 0.04990$ 0.12010$ Tier 2 - per Zone Allocation 0.07020$ 0.04990$ 0.12010$ Tier 3 - per Zone Allocation 0.07020$ 0.04990$ 0.12010$
Energy Charge - per kWh Base Rate ECAF Total (1) Increased AmountTier 1 - per Zone Allocation 0.07020$ 0.05390$ 0.12410$ 0.0040 Tier 2 - per Zone Allocation 0.07020$ 0.05390$ 0.12410$ 0.0040 Tier 3 - per Zone Allocation 0.07020$ 0.05390$ 0.12410$ 0.0040
Energy Charge - per kWh Base Rate ECAF Total (1) Increased AmountTier 1 - per Zone Allocation 0.05841$ 0.06790$ 0.12631$ 0.0062 Tier 2 - per Zone Allocation 0.09080$ 0.06790$ 0.15870$ 0.0386 Tier 3 - per Zone Allocation 0.09080$ 0.06790$ 0.15870$ 0.0386
(1) Total does not include ESA and RCA
Rate A - Standard Service (Low Season, October through May)
(as of October 1, 2009 per existing rate ordinance)
(as of October 1, 2010 with Rate Restructure and with additional ECAF increase)
(as of October 1, 2010 without additional ECA increase and without rate restructuring)
Modified Proposal will be submitted on December 1, 2009Modified Proposal will be submitted on December 1, 2009
18
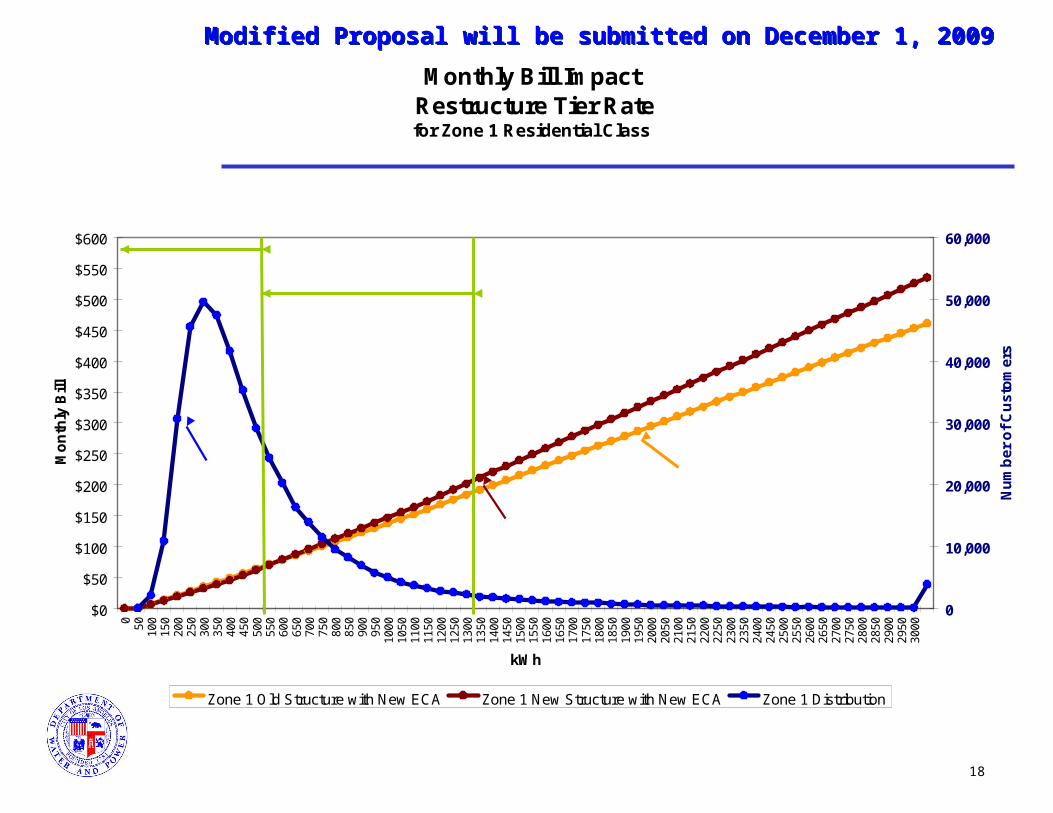
Monthly Bill Impact Restructure Tier Rate for Zone 1 Residential Class
$0
$50
$100
$150
$200
$250
$300
$350
$400
$450
$500
$550
$600
0 50 100
150
200
250
300
350
400
450
500
550
600
650
700
750
800
850
900
950
1000
1050
1100
1150
1200
1250
1300
1350
1400
1450
1500
1550
1600
1650
1700
1750
1800
1850
1900
1950
2000
2050
2100
2150
2200
2250
2300
2350
2400
2450
2500
2550
2600
2650
2700
2750
2800
2850
2900
2950
3000
kWh
Mo
nth
ly B
ill
0
10,000
20,000
30,000
40,000
50,000
60,000
Nu
mb
er o
f C
ust
om
ers
Zone 1 Old Structure with New ECA Zone 1 New Structure with New ECA Zone 1 Distribution
63.6% of Zone 1 customers will have no additional increase 30.7% of Zone 1 customers
will have an additional increase of not greater than 10%
500 kWh
1300 kWh
30,633customers
$211.12Monthly Bill After Restructure
$286.59Monthly Bill Before Restructure
Modified Proposal will be submitted on December 1, 2009Modified Proposal will be submitted on December 1, 2009

19
Monthly Bill Impact Restructure Tier Rate for Zone 2 Residential Class
$0
$50
$100
$150
$200
$250
$300
$350
$400
$450
$500
$550
0 50 100
150
200
250
300
350
400
450
500
550
600
650
700
750
800
850
900
950
1000
1050
1100
1150
1200
1250
1300
1350
1400
1450
1500
1550
1600
1650
1700
1750
1800
1850
1900
1950
2000
2050
2100
2150
2200
2250
2300
2350
2400
2450
2500
2550
2600
2650
2700
2750
2800
2850
2900
2950
3000
kWh
Mo
nth
ly B
ill
0
10,000
20,000
30,000
40,000
50,000
60,000
70,000
80,000
Nu
mb
er o
f C
ust
om
ers
Zone 2 Old Structure with New ECA Zone 2 New Structure with New ECA Zone 2 Distribution
20% of Zone 2 customers will have an additional increase of not greater than 10%
78% of Zone 2 customers will have no additional increase
750 kWh 2200 kWh
37,461customers
$225.19Monthly Bill After Restructure
$343.89Monthly Bill Before Restructure
Modified Proposal will be submitted on December 1, 2009Modified Proposal will be submitted on December 1, 2009

20
Rate Comparison LADWP versus SCE
LADWP Proposed Residential Tier Rate vs. SCE's
$-
$100
$200
$300
$400
$500
$600
$700
$800
$900
$1,000
015
030
045
060
075
090
010
5012
0013
5015
0016
5018
0019
5021
0022
5024
0025
5027
0028
5030
00
kWh
Mo
nth
ly B
ill
SCE Summer andWinter Monthly Bill
LADWP Summer Monthly Bill
LADWP Winter Monthly Bill
Modified Proposal will be submitted on December 1, 2009Modified Proposal will be submitted on December 1, 2009

21
FINANCIAL IMPACTS OF NO ACTION
Evaluated 5-Year Financial Impacts of Alternative Scenarios if cap increase is not adjusted:– Lower Debt Service Coverage
• Lose AA Bond Rating at a Cost of $41M per year in incremental Debt Service ($205M over the next 5 years). This does not include impact of issuing additional fixed debt through SCPPA (for renewable projects) and IPA.
Other Alternatives – Cut Capital Programs– Scale Back Infrastructure Improvements (PRP, IRP)– Scale Back RPS Goals
Massive ECAF Under Collection
Modified Proposal will be submitted on December 1, 2009Modified Proposal will be submitted on December 1, 2009

22
Debt Service Coverage Ratio
Financial Ratio with and without ECAF Action
0.00
0.25
0.50
0.75
1.00
1.25
1.50
1.75
2.00
2.25
2.50
2.75
2010 2011 2012 2013 2014
Fiscal Year
Debt Service Ratio
with Action without Action
“To meet coverage requirements in FY 2012/13 and forward, LADWP would have to cut capital spending in FY 2009/10 through FY 2011/12 by a total of $3.6 billion. With no action, debt service coverage ratios are less than 2.25 times in the FY 2009/10 through FY 2011/12.”
“To meet coverage requirements in FY 2012/13 and forward, LADWP would have to cut capital spending in FY 2009/10 through FY 2011/12 by a total of $3.6 billion. With no action, debt service coverage ratios are less than 2.25 times in the FY 2009/10 through FY 2011/12.”
Modified Proposal will be submitted on December 1, 2009Modified Proposal will be submitted on December 1, 2009

23
Five-Year Capital Expenditures
Others, $1,881
Others, $763
PRP, $2,568
PRP, $1,051
IRP, $578
RPS, $787
RPS, $471
$0
$1,000
$2,000
$3,000
$4,000
$5,000
$6,000
$7,000
with Action without Action
$Millions
$3.6B (62%)cuts needed to meet financial ratio
requirement in FY 2012/13
Total Capital Expenditures: $5,814M
Modified Proposal will be submitted on December 1, 2009Modified Proposal will be submitted on December 1, 2009
24
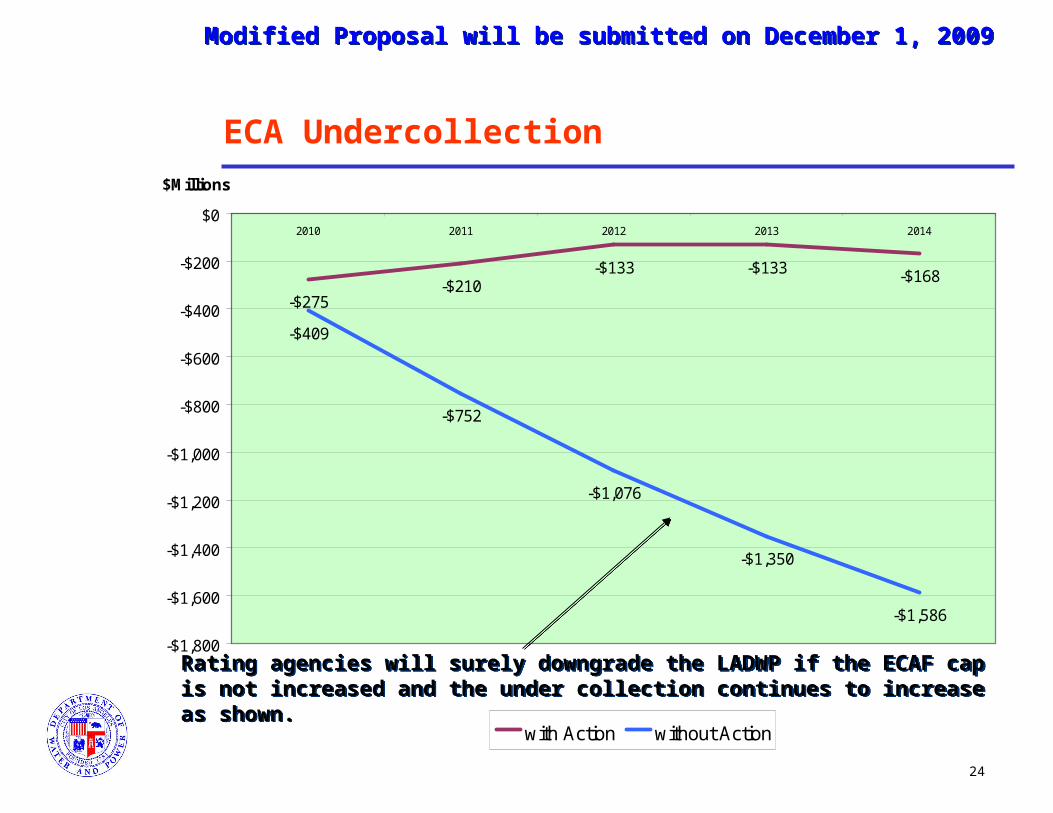
ECA Undercollection
-$275-$210
-$133 -$133 -$168
-$409
-$752
-$1,076
-$1,350
-$1,586
-$1,800
-$1,600
-$1,400
-$1,200
-$1,000
-$800
-$600
-$400
-$200
$02010 2011 2012 2013 2014
$Millions
with Action without Action
Rating agencies will surely downgrade the LADWP if the ECAF cap is not increased and the under collection continues to increase as shown.Rating agencies will surely downgrade the LADWP if the ECAF cap is not increased and the under collection continues to increase as shown.
Modified Proposal will be submitted on December 1, 2009Modified Proposal will be submitted on December 1, 2009

25
RECOMMENDATIONS
Consider adopting the proposed ECAF Cap increase to ensure that the Power System’s can meet near-term Financial Requirements to avoid potential downgrade of Bond Ratings:
- Debt Service Coverage greater than 2.25 times- Minimum Cash Target of $300 million- Capitalization Factor less than 60%
Support the Alternative Revenue Neutral Electric Rate Restructure of the Residential Tiered Rates to Accomplish the following:
- Encourage Conservation- Minimize Rate Impact on Customers (TIER 1) who
Conserve Energy- Reduce Demand on Power System
Modified Proposal will be submitted on December 1, 2009Modified Proposal will be submitted on December 1, 2009

26
TYPICAL ENERGY USAGERESIDENTIAL CUSTOMERS
Typical Energy Usage in Different Geographical Zones within the City of Los Angeles
during Summer Months
7 11 11
150
16 21 430 25
75
195
7 11 11
213
16 21 43 7525
75
775
277
2309
675
1989
760 760
0
500
1000
1500
2000
2500
Dishwas
her
Clothe
s Was
her
Clothe
s Dry
er
Refrig
erat
or
Outdo
or L
ights
Cookin
g TVFan
PC equ
ip & m
isc
Indo
or L
ightin
g
Air Con
dition
ing
Pool P
ump
2nd
Refrig
erat
orTot
al
Appliance/End-Use
KW
h p
er M
on
th
ZONE 1
ZONE 2
Modified Proposal will be submitted on December 1, 2009Modified Proposal will be submitted on December 1, 2009

27
EFFICIENT ENERGY USAGERESIDENTIAL CUSTOMERS
Efficient Energy Usage in Different Geographical Zones within the City of Los Angeles
during Summer Months
7 11 11
150
16 21 430 25
75
439
07 11 11
213
16 21 4375
2575
504
0
1381
1178
380 380
0
200
400
600
800
1000
1200
1400
1600
Dishwas
her
Clothe
s Was
her
Clothe
s Dry
er
Refrig
erat
or
Outdo
or L
ights
Cookin
g TVFan
PC equ
ip & m
isc
Indo
or L
ightin
g
Air Con
dition
ing
Pool P
ump
2nd
Refrig
erat
orTot
al
Appliance/End-Use
KW
h p
er M
on
th
ZONE 1
ZONE 2
Modified Proposal will be submitted on December 1, 2009Modified Proposal will be submitted on December 1, 2009

28
EFFICIENT ENERGY USAGE COMPARISON RESIDENTIAL CUSTOMERS
Typical vs Efficient Energy Usage in Different Geographical Zones within the City of Los Angeles
during Summer Months
675760
195
1989
439380
0
1178
775 760
277
2309
504
380
0
1381
0
500
1000
1500
2000
2500
Air Conditioning Pool Pump 2nd Refrigerator Total
Appliance / End Use
KW
h p
er M
on
th
Zone 1 - Typical
Zone 1 - Efficient
Zone 2 - Typical
Zone 2 - Efficient
40% Savings Potential
Modified Proposal will be submitted on December 1, 2009Modified Proposal will be submitted on December 1, 2009


![[Product Monograph Template - Standard] · 2020. 11. 19. · Dosage Adjustment: Dose modification). Hypertensive crisis occurred ... Fatal events of hepatic dysfunction were reported](https://static.documents.pub/doc/80x56/60f8b1d456569e706347a062/product-monograph-template-standard-2020-11-19-dosage-adjustment-dose.jpg)
