PHYSICAL REVIEW B VOLUME 28, NUMBER 8 15 OCTOBER 1983 Dependence on volume of the phonon frequencies and the ir effective charges of several III-V semiconductors J. A. Sanjurjo, * E. Lopez-Cruz, P. Vogl, ~ and M. Cardona Max Plan-ck Inst-itut fu'r Festkorperforschung, Heisenbergstrasse I, 7000 Stuttgart 80, Federal Republic of Germany (Received 23 June 1983) The mode Gruneisen parameters of the LO and TO Raman phonons of AlN, BN, and BP, and the dependence of eT on lattice constant have been measured by Raman scattering in a diamond an- vil cell. The results for eT are interpreted by means of pseudopotential calculations of eT versus lat- tice constant. I. INTRODUCTION The advent of the diamond anvil cell has made possible the accurate determination of mode Griineisen parameters of phonons in semiconductors by means of Raman spec- troscopy. ' Of particular interest has also been the volume dependence of the transverse effective charge which can be related to the dependence of the ionicity of the ch emical bond on bond length. ' The volume depen- dence of eT has been measured for several III-V (Refs. 1 — ) and II-VI (Ref. 5) compounds (GaAs, CxaP, InP, ZnS, ZnSe, and ZnTe) and for zinc-blende-type (a-) SiC. In all these cases, with the exception of SiC, er ~ and thus the ionicity has been found to decrease with decreas- ing bond length. For SiC the opposite occurs. A semi- quantitative interpretation of these results by means of a pseudopotential ba nd-structure calculation of eT has been made. ' The anomalous sign of the derivative of ~ eT ~ with respect to the bond length results from the strong difference in the pseudopotentials of C and Si for small wave vectors, which in turn is related to the lack of p elec- trons in the core of the carbon atoms. In this paper we present similar data for the more exot- ic large-band-gap III-V compounds BN, A1N, and BP. Reliable values of the effective charges of these materials are given. The mode Griineisen parameters yL& and yTO are similar to those found for the equivalent phonons of similar semiconductors (y between 1 and 1. 6 with 7 'fo ) 1 LQ). The dependence of eT on bond length for A1N and BP might have been similar to that of SiC ac- cording to Periodic Table systematics. We found, howev- er, that in all three cases ~ eT ~ decreased with decreasing bond length. These results agree qualitatively with pseu- dopotential calculations in spite of the difficulties encoun- tered with the pseudopotentials of the first row of the Periodic Table. were broken into small pieces and in each case one of them, suitable to fit into the 200-pm hole of the pressure cell gasket, was chosen under the microscope. For sam- ples of BN, several small crystallites approximately 200 pm in diameter were glued together and polished down to a 20 pm thickness. The final samples were of the ap- propriate size to fit into the hole of the pressure-cell gas- ket. A gasketed diamond anvil cell similar to that reported by Syassen and Holzapfel was employed for the Raman measurements. A 4:1 methanol-ethanol mixture served as the pressure medium; the fluorescence of a tiny ruby chip placed near the samples was used for the pressure calibra- tion. The Raman spectra were excited in backscattering geometry with the 5145-A (2. 4l-eV) line of an Ar+-ion gas laser. The scattered light was analyzed with a Spex 1401 double monochromator and detected with a RCA C31034 photomultiplier in the photon counting mode. All measurements were carried out at room temperature. III. RESULTS Figure 1 shows typical first-order Raman spectra of the TO and LO phonons in zinc-bleride-type BP and BN, and for the 2& and E& TO and LO phonons in wurtzite A1N for various pressures. The frequencies of the TO and LO modes for zero pressure agree with values reported by oth- er authors, with the exception of the TO phonon in BP. ' In all cases the LO(I )-TO(l ) splitting decreases with in- creasing pressures. Figures 2 — display the peak position of the LO and TO Raman lines as a function of pressure (bottom horizontal scale) and the relative lattice compres- sion — , a /ao (top horizontal scale) for BP, BN, and A1N, respectively. The Raman peaks show, within the experi- mental error, a linear dependence with pressure in the measurement range. The solid lines in Figs. 2 — are the least-squares fits to the data using the equations II. EXPERIMENTAL DETAILS The A1N samples used in the high-pressure measure- ments were prepared by polishing down to a thickness of 30 pm a film grown at the IBM Yorktown Heights Research Center on a sapphire substrate. A platelet of BP was polished to a thickness of 30 pm. These thin platelets coLo — 828. 9+0. 6) + (4. 89+0. 07)p, coTo — 799+ 1)+ (5. 48+0. 08)p, coLBo = (1305+ 1) + (3. 45+0. 07)p, coro —— ( 1054. 7+ 0. 6) + ( 3. 39+0. 08)p, (2) 28 4579 1983 The American Physical Society
Transcript
8/12/2019 Dependence of the phonon frequencies and the IR effective charges of several III-V semiconductors
PHYSICAL REVIEW B VOLUME 28, NUMBER 8 15 OCTOBER 1983
Dependence on volume of the phonon frequencies and the ir effective chargesof several III-V semiconductors
J. A. Sanjurjo,* E. Lopez-Cruz, P. Vogl, ~ and M. Cardona
Max Plan-ck Inst-itut fu'r Festkorperforschung, Heisenbergstrasse I,7000 Stuttgart 80, Federal Republic ofGermany
(Received 23 June 1983)
The mode Gruneisen parameters of the LO and TO Raman phonons of AlN, BN, and BP, and
the dependence of eT on lattice constant have been measured by Raman scattering in a diamond an-
vil cell. The results for eT are interpreted by means of pseudopotential calculations of eT versus lat-
tice constant.
I. INTRODUCTION
The advent of the diamond anvil cell has made possible
the accurate determination of mode Griineisen parameters
of phonons in semiconductors by means of Raman spec-
troscopy.'
Of particular interest has also been thevolume dependence of the transverse effective chargewhich can be related to the dependence of the ionicity ofthe chemical bond on bond length. ' The volume depen-
dence of eT has been measured for several III-V (Refs.1—) and II-VI (Ref. 5) compounds (GaAs, CxaP, InP,ZnS, ZnSe, and ZnTe) and for zinc-blende-type (a-) SiC.In all these cases, with the exception of SiC,
~er
~
and
thus the ionicity has been found to decrease with decreas-
ing bond length. For SiC the opposite occurs. A semi-
quantitative interpretation of these results by means of a
pseudopotential band-structure calculation of eT has been
made. ' The anomalous sign of the derivative of~eT
~
with respect to the bond length results from the strong
difference in the pseudopotentials of C and Si for small
wave vectors, which in turn is related to the lack ofp elec-trons in the core of the carbon atoms.
In this paper we present similar data for the more exot-
ic large-band-gap III-V compounds BN, A1N, and BP.Reliable values of the effective charges of these materials
are given. The mode Griineisen parameters yL& and yTOare similar to those found for the equivalent phonons ofsimilar semiconductors (y between 1 and 1.6 with
7 'fo ) 1 LQ). The dependence of eT on bond length forA1N and BP might have been similar to that of SiC ac-
cording to Periodic Table systematics. We found, howev-
er, that in all three cases~eT
~
decreased with decreasing
bond length. These results agree qualitatively with pseu-
dopotential calculations in spite of the difficulties encoun-
tered with the pseudopotentials of the first row of thePeriodic Table.
were broken into small pieces and in each case one ofthem, suitable to fit into the 200-pm hole of the pressure
cell gasket, was chosen under the microscope. For sam-
ples of BN, several small crystallites approximately 200
pm in diameter were glued together and polished down toa 20 pm thickness. The final samples were of the ap-
propriate size to fit into the hole of the pressure-cell gas-ket.A gasketed diamond anvil cell similar to that reported
by Syassen and Holzapfel was employed for the Raman
measurements. A 4:1 methanol-ethanol mixture served as
the pressure medium; the fluorescence of a tiny ruby chip
placed near the samples was used for the pressure calibra-
tion. The Raman spectra were excited in backscattering
geometry with the 5145-A (2.4l-eV) line of an Ar+-ion
gas laser. The scattered light was analyzed with a Spex
1401 double monochromator and detected with a RCAC31034 photomultiplier in the photon counting mode.
All measurements were carried out at room temperature.
III. RESULTS
Figure 1 shows typical first-order Raman spectra of the
TO and LO phonons in zinc-bleride-type BP and BN, and
for the 2& and E& TO and LO phonons in wurtzite A1N
for various pressures. The frequencies of the TO and LOmodes for zero pressure agree with values reported by oth-
er authors, with the exception of the TO phonon in BP. 'In all cases the LO(I )-TO(l ) splitting decreases with in-
creasing pressures. Figures 2— display the peak position
of the LO and TO Raman lines as a function of pressure
(bottom horizontal scale) and the relative lattice compres-
sion —,a /ao (top horizontal scale) for BP, BN, and A1N,
respectively. The Raman peaks show, within the experi-
mental error, a linear dependence with pressure in the
measurement range. The solid lines in Figs. 2— are the
least-squares fits to the data using the equations
II. EXPERIMENTAL DETAILS
The A1N samples used in the high-pressure measure-
ments were prepared by polishing down to a thickness of30 pm a film grown at the IBM Yorktown Heights
Research Center on a sapphire substrate. A platelet of BPwas polished to a thickness of 30 pm. These thin platelets
coLo —828.9+0.6)+ (4.89+0.07)p,
coTo—799+1)+(5.48+0.08)p,
coLBo = (1305+1)+ (3.45+0.07)p,
coro ——( 1054.7+0.6)+ ( 3.39+0.08)p,(2)
28 4579 1983 The American Physical Society
8/12/2019 Dependence of the phonon frequencies and the IR effective charges of several III-V semiconductors
DEPENDENCE ON VOLUME OF THE PHONON FREQUENCIES. . . 4581
Q.Q
I
E
900,—
LUz 850—UJ
~ 750—C)
Q700
hoQp
0.005 0.01
AlN T =300K~, o . experiment—:east-squares fit
E I ( LO)
A&(LO)
E1 t TO)
0.015I
dependence of eT on volume, we encounter the difficultythat the volume dependence of e is not known experi-
mentally. We have taken for all three compounds the
same value as for SiC, that is, dine /dlnap 1.8. This
step sounds justified in view of the discussion given in
Ref. 14. With the use of the data of Figs. 2—, Eq. (5),
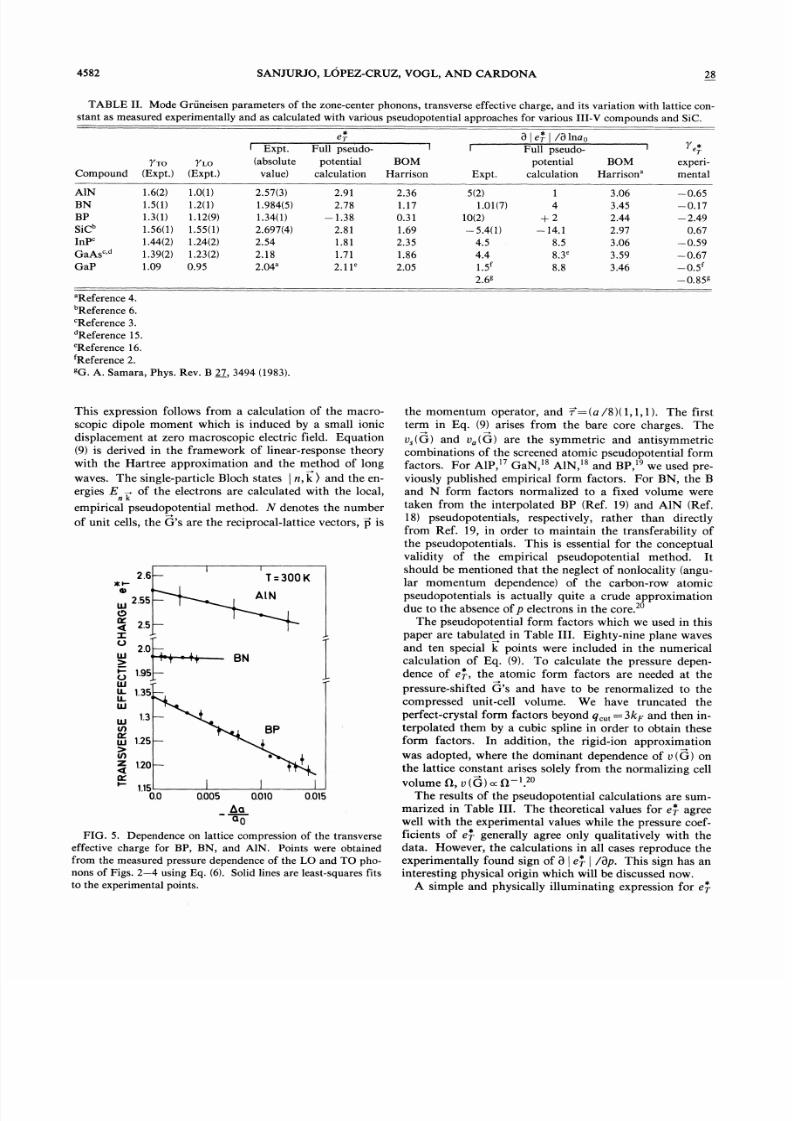
and the data of Table I, we obtain the dependence of eT onthe lattice constant displayed in Fig. 5. In AlN and BP,eT decreases clearly with increasing pressure, while BNshows a very small decrease with pressure. The solid lines
in Fig. 5 are the least-squares fits to the data. The values
of eT at zero pressure, as well as BeT/8 lna and
yeT — lneTIB lnV obtained from the above fit, are listed
in Table II. For comparison we also show in Table II pre-
vious results found for SiC, InP, and GaAs. '
IV. DISCUSSION
650
PRESSURE (GPa)
FIG. 4. Dependence of the LO(I ) and TO(I ) phonon fre-quencies of A1N with pressure (lower scale) and relative lattice
compression (upper scale). Solid lines are least-squares fits to
the experimental points with Eq. (3).
10
empirical relations for the elastic constants. 'They are
listed in Table I together with other parameters needed forthe discussion. For A1N we used the relation ao —V3a cto define an effective cubic lattice constant ap from the
hexagonal constants a and c of this material. The values
of yTo and yLo found from Eqs. (1)—4) with the 8's ofTable I are given in Table II. They are similar to the
values found for other diamond and zinc-blende-type
semiconductors. ' ' In zinc-blende-type semiconductors
the Born transverse effective charge is related to the split-
ting of the long-wavelength LO and TO phonon modes3
Q0PeT
16m.(~Lo—To) . (6)
In Eq. (5) p is the reduced mass of the two-component
atoms (p =m~ +mz ), ao the cubic lattice constant,—
and e the infrared dielectric constant. To calculate theI
Two different types of approaches can be used to calcu-late eT and its volume dependence. The first is based on
semiempirical modelsof
the tetrahedral bond. With this
model we find
30 8eT =—AZ + exp
—Qp
3 ~ 3
where AZ is one-half the difference in core charges be-
tween the anion and the cation (b,Z =0, 1,2 for IV-IV,III-V, and II-VI compounds, respectively) and a~ is the
polarity of the bond defined in Ref. 4. By choice of the
sign eT represents the charge of the cation. The depen-
dence of the polarity on lattice constant is given by '
Ba& 2=2a~(1—a~ ),
3 lnap
with Eqs. (7) and (8) we obtain the values listed in
columns 6 and 9 of Table II. Another approach is to use
the microscopic pseudopotential expression for eT in the
way followed recently for InP and SiC. ' The results ofthis full pseudopotential calculation are listed in columns
5 and 8 of Table II.The theoretical calculations of eT are based on the pseu-
dopotential expression'
VB CB
eT= —bZ+ —gG ~0
(n, k )p„[n', k)(n', k [e' '')n, k)
G„[tv,(G)smG r —, (G)cosG r]i.«.k —E.k)'
TABLE I. Relevant parameters for A1N, BN, and BP used in this work and measured zero-pressure
zone-center phonons.
A1N
BNBP
a@To(p =0)cm-'
667.5(7)1054.7(6)799(1)
cogo(p =0)cm
—
893(2)1305(1)828.9(6)
ap
4.37(3)'3.6155(2)'4.5383(4)'
Bp
GPa
218(20)b
465(50)190(15)'
4.76(8)'
4.50(2)'9.61(2)'
'Landolt-Bornstein Tables, edited by O. Madelung (Springer, Berlin, 1982), Vol. III, 17a.Interpolated using empirical relations for the elastic constants (Ref. 13).
'Reference 12.
8/12/2019 Dependence of the phonon frequencies and the IR effective charges of several III-V semiconductors
TABLE II. Mode Gruneisen parameters of the zone-center phonons, transverse effective charge, and its variation with lattice con-stant as measured experimentally and as calculated with various pseudopotential approaches for various III-V compounds and SiC.
+TO QLO
Compound (Expt. ) (Expt. )
Expt.
(absolute
value)
Full pseudo-
potential
calculation
BOM
Harrison Expt.
8 e /ulna
Full pseudo-
potential
calculation
BOMHarrison'
'T
experi-
mental
AlN
BNBPSiCInP'GaAs'd
CxaP
1.6(2)
1.5(1)1.3(1)1.56(1)1.44(2)1.39(2)
1.09
1.0(1)1.2(1)1.12(9)
1.55{1)1.24(2)1.23(2)
0.95
2.57(3)
1.984(5)1.34(1)2.697(4)2.54
2.182.04'
2.912.78
—1.382.81
1.81
1.71
2.11'
2.361.17
0.311.692.35
1.86
2.05
5(2)
1.01(7)10(2)—.4(1)
4.54.4
2.6g
1
4
+2—14.1
8.583'8.8
3.063.452.44
2.97
3.06
3.593.46
—.65—.17—.49
0.67—.59—.67—.5—.85g
'Reference 4.Reference 6.
'Reference 3.Reference 15.
'Reference 16.Reference 2.
gCx.
A. Samara, Phys. Rev. B 27, 3494 (1983).
This expression follows from a calculation of the macro-
scopic dipole moment which is induced by a small ionic
displacement at zero macroscopic electric field. Equation
(9) is derived in the framework of linear-response theory
with the Hartree approximation and the method of long
waves. The single-particle Bloch states~
n, k ) and the en-
ergies E —of the electrons are calculated with the local,nk
empirical pseudopotential method. X denotes the number
of unit cells, the G's are the reciprocal-lattice vectors, p is
2.6—I
2.55—
2.5—I:
T =300K
1.95—tULL 135—QLU
1.3
1.25
1.20
1.l5—
0.0
FIG. 5. Dependence on lattice compression of the transverse
effective charge for BP, BN, and AlN. Points were obtained
from the measured pressure dependence of the LO and TQ pho-
nons of Figs. 2— using Eq. (6). Solid lines are least-squares fits
to the experimental points.
the momentum operator, and r=(a/8)(1, 1,1). The firstterm in Eq. (9) arises from the bare core charges. The
u, (G) and u, (G) are the symmetric and antisyrnmetriccombinations of the screened atomic pseudopotential formfactors. For A1P,
'GaN, '
A1N,'
and BP,' we used pre-
viously published empirical form factors. For BN, the 8and N form factors normalized to a fixed volume were
taken from the interpolated BP (Ref. 19) and A1N (Ref.18) pseudopotentials, respectively, rather than directlyfrom Ref. 19, in order to maintain the transferability ofthe pseudopotentials. This is essential for the conceptualvalidity of the empirical pseudopotential method. Itshould be mentioned that the neglect of nonlocality (angu-lar momentum dependence) of the carbon-row atomicpseudopotentials is actually quite a crude approximationdue to the absence ofp electrons in the core.
The pseudopotential form factors which we used in this
paper are tabulated in Table III. Eighty-nine plane waves
and ten special k points were included in the numericalcalculation of Eq. (9). To calculate the pressure depen-
dence of eT, the atomic form factors are needed at the
pressure-shifted G's and have to be renorrnalized to the
compressed unit-cell volume. %e have truncated the
perfect-crystal form factors beyond q,„,=3kF and then in-
terpolated them by a cubic spline in order to obtain theseform factors. In addition, the rigid-ion approximation
was adopted, where the dominant dependence of u(G) onthe lattice constant arises solely from the normalizing cell
volume 0, u (G) ~0The results of the pseudopotential calculations are sum-
marized in Table III. The theoretical values for eT agreewell with the experimental values while the pressure coef-ficients of eT generally agree only qualitatively with thedata. However, the calculations in all cases reproduce theexperimentally found sign of 8
~eT
~
/Bp. This sign has aninteresting physical origin which will be discussed now.
A simple and physically illuminating expression for eT
8/12/2019 Dependence of the phonon frequencies and the IR effective charges of several III-V semiconductors
DEPENDENCE ON VOLUME OF THE PHONON FREQUENCIES. . .
TABLE III. Pseudopotential form factors (in Ry} for various III-V compounds used to calculate eT
with Eq. (9).
v, (3)v, (4)
v, (8)v, (11},(12)
v (3)(4)
v, (8)
,(11)v~( 12)
BN
—.585—.320
0.1550.0700.0130.2650.320
0.015—.050—.026
BP
—.373—.260
—.0850.0990.0910.0100.023
0.0380.0340.033
AlN
—.310—.221
0.0110.0700.092
0.280
0.2750.119
—.010—.032
CiaN
—.340—.229
0.0180.0700.0690.270
0.243
0.1320.0400.018
AlP
—.210—.130
0.0400.0800.076
0.130
0.0800.023
0.0150.012
can be obtained from Eq. (9) by neglecting all pseudopo-tential form factors but the dominating ones v, (3) and
v, (3), with~
G~
=(2m/a)~3. The Bloch states can then
be evaluated explicitly and one finds'
8p;eT——AZ+
1+pi(10)
Pi=—v, (3)
u, (3)
The ratio p; plays the role of a polarity [cf. Eq. (7)] and
is defined in such a way that 0&p; & 1 for most semicon-
ductors (cf. Table III). Taking the derivative of Eq. (10)with respect to the lattice constant
BeT 1—p; Bp;=8 (11)Ba (1+p, )2 Ba
one sees that the sign of BeT/Ba equals that of Bp;/Ba,
i.e., eT will decrease with pressure if the polarity also de-creases with pressure.
The pressure dependence of p; follows the pressure
dependence of the pseudopotentials. The origin of this
dependence can be seen most clearly by considering model
pseudopotentials rather than empirical form factors which
qualitatively agree with one another. The atomic formfactors (3 =anion, C=cation) uz(q), uc(q) behave like
screened Coulomb potentials for q~0, uz c(q)~—~Zq c/e(q)q . For q of the order of the inverse
core radius, I/R' , on the other hand, the pseudopoten-
tials tend to become small and to oscillate around zero. Ina IV-IV compound, such as SiC, the form factors of Siand C approach each other for q~0, since Zs; —Zc —,but they differ considerably for large
qsince
Rc' «Rs'; . The above behavior is displayed qualita-
tively in Fig. 6. As a consequence, the difference
u~ =(us; —c)/2 as well as the polarity p; increase when~'s are shifted to larger q, a fact which corresponds to in-
creased pressure. Therefore, IV-IV compounds arepredicted to have the effective charge increased with pres-
sure, in agreement with experiment. In a typical III-V
compound such as GaAs, on the other hand, the form fac-tors differ for q~0 since Z~, —3, Z~, =5, but they be-
come close for large q since these atoms have comparablecore radii (see Fig. 6). As a consequence, most III-V com-
v(q) v(q)
AK BUZ
(111)~g
III
(111)'f ~WjP
{a) (b)
FIG. 6. Schematic drawing of screened atomic pseudopoten-
tial form factors v (q) as a function of wave vector q for a typical
IV-IV compound such as (a) SiC and for a typical III-V com-
pound such as (b) CxaAs. The approximate position of the first
reciprocal-lattice vector is indicated by arrows. Under pressure
the reciprocal-lattice vector increases. Correspondingly, the
ionicity as measured by the difference of the A and B (111)pseudopotential form factors increases in a IV-IV compound but
decreases in a III-V compound.
pounds and also II-VI compounds are expected to show a
decreasing eT with increasing pressure, again in agreement
with experiment. Since er' is a measure of ionicity (ef=O.in Si), one concludes that this ionicity decreases with pres-
sure in GaAs but increases with pressure in SiC.In this paper we have studied III-V compounds with
group-III atoms from the carbon row of the Periodic
Table which have very small core radii. In these cases, the
pseudopotentials differ significantly for q~O and for
q —1/R . From the previous discussions it is clear that
these compounds therefore represent borderline cases be-
tween the normal (8~eT
~
/Ba &0) and anomalous pres-
sure dependence (8~eT
~
/Ba & 0) of eT. While A1N and
BN still behave like GaAs, BP is found theoretically to
behave anomalously. As can be deduced from Table II,the polarity p; =0 in BP, which implies the effective
charge of B to be negative ez-- —, according to the
analytical expression Eq. (10).The full pseudopotential calculation gives eT ——1.38
for BP. The pressure coefficient of p; and eT in BP istheoretically found to be anomalous, Bp;/Ba &0, as in
SiC. Experimentally, only~
eT~
can be measured optical-
ly and since eT itself is negative, one also obtains
8~
eT~
/Ba &0 for this material.
8/12/2019 Dependence of the phonon frequencies and the IR effective charges of several III-V semiconductors
The help of W. Dieterich and I. Stoll in loading the dia-
mond cell is gratefully acknowledged. We would like tothank Dr. %'. Wettling for making his elastic-constants
data for BP available to us prior to publication, and Dr. J.
Schneider for help in obtaining the BP and BN crystalsused. The BP crystals were kindly supplied by Dr. T.Kimura, University of Electrocommunications, Tokyo
and the BN crystals by deBeers Industrial Diamonds
Division, Shannon, Ireland. The A1N crystals were pro-vided by Dr. R. F. Rutz (IBM Thomas J. Watson
Research Center, Yorktown Heights) and Dr. R. Tsu (En-
ergy Conversion Devices, Inc. , Troy, MI) to whom thanks
are also due. One of us (E.L.C.) acknowledges the finan-
cial support of Consejo Nacional de Ciencia y Tecnologia
(Mexico). Partial support by the Fonds zur Forderung derwissenschaftlichen Forschung in Osterreich, Projekt Nr.4236, is also acknowledged.
'Instituto de Hsica Gleb Wataghin, Universidade Estadual de
Campinas, 13100Campinas, Sao Paulo, Brazil.
Departamento de Fisica, Instituto de Ciencias, Universidad
Autonoma de Puebla, Apartado J-48, CP-72570 Puebla, Pue,
B. A. Weinstein and G. Piermarini, Phys. Rev. 8 12, 1172
(1975).B. A. Weinstein and R. Zallen, in Topics in Applied Physics,
edited by G. Guntherodt and M. Cardona (Springer, Heidel-
berg, in press).3R. Trommer, H. Muller, M. Cardona, and P. Vogl, Phys. Rev.
8 21, 4869 (1980).4W. A. Harrison, Electronic Structure and the Properties of
Solids (Freeman, San Francisco, 1980).~B. A. Weinstein, Solid State Commun. 12, 473 (1973).D. Olego, M. Cardona, and P. Vogl, Phys. Rev. 8 25, 3878
{1982).~K. Syassen and W. Holzapfel, Phys. Rev. B 18, 5826 (1978).
J. D. Barnett, S. Block, and G. J. Piermarini, Rev. Sci. Instrum.44, 1 (1973);G. J. Piermarini, S. Block, J. O. Barnett, and R.A. Forman, J. Appl. Phys. 46, 2774 (1975).
9O. Brafman, G. Lengyel, S. S. Mitra, P. J. Gielisse, J. N.
Plendl, and L. C. Mansur, Solid State Commun. 6, 523
(1968).'oR. Tsu and R. F. Rutz, in Proceedings of the Third Interna
tional Conference on Light Scattering in Solids, edited by M.
Balkanski, R. C. C. Leite, and S. P. S. Porto {Flammarion,
Paris, 1976), p. 393.
G.Lucovsky, R. M. Martin, and E. Burstein, Phys. Rev. B 4,1367 (1971).
2%'. Wettling (private communication).
E.F. Steigmeier, Appl. Phys. Lett. 3, 6 (1963).&4M. Cardona, in Atomic Structure and Optical Properties of
Solids, edited by E. Burstein (Academic, New York, 1972), p.197.R. Trommer, E. Anastassakis, and M. Cardona, in Light
Scattering in Solids, edited by M. Balkanski, R. C. C. Leite,and S. P. S. Porto (Flammarion, Paris, 1976), p. 396.P. Vogl, J. Phys. C 11,251 (1978).
7Y. F. Tsay, A. J. Corey, and S. S. Mitra, Phys. Rev. B 12,1354 (1975)'.
S. Bloom, J. Phys. Chem. Solids 32, 2027 (1971).' L. A. Hemstreet, Jr. and C. Y. Fang, Phys. Rev. B 6, 1464
(1972).M. L. Cohen and V. Heine, in Solid State Physics, edited by H.Ehrenreich, F. Seitz, and D. Turnbull (Academic, New York,