Dependencies of Shear Wave Velocity andShear Modulus of Soil on Saturation
Yi Dong, A.M.ASCE1; and Ning Lu, F.ASCE2
Abstract: Shear wave propagation in soil is a physical phenomenon and has been used widely for monitoring and seismic property assess-ment in geotechnical engineering. Shear wave velocity Vs and small-strain shear modulus G0 are the key parameters in defining materialresponse to various dynamic loadings. To date, the dependencies of Vs and G0 on saturation, especially in high suction range, are still notwell understood because of the limited testing methodology and experimental evidence. In this study, the authors present a new laboratoryinstrumentation of measuring shear wave propagation in different types of unsaturated soils. Low relative humidity and water mist injectionenvironment are used for measuring shear wave velocity under both drying and wetting conditions. Bender element technique was usedto measure the shear wave responses. Step function was used as excitation, and determination of a first arrival time was identified andconsistently used for all shear wave measurements. Shear wave evolution and the calculated Vs andG0 with varying volumetric water contentunder zero total stress condition along drying and wetting are presented. The effects of different soil–water regimes on the evolution of G0
Small-strain shear modulus G0 provides valuable information onsoil skeleton stiffness, which is a fundamental physical propertyrelevant to liquefaction assessment, dynamic ground responseanalysis, and deep soil-structure design in geotechnical engineering(e.g., Kramer 1996; Clayton 2011; Yang and Gu 2013). Variousmethods exist for measuring the stiffness of soil at small strain,including, e.g., resonant column technique (Mancuso et al. 2002;Youn et al. 2008) and bender element technique (Qian et al. 1991;Marinho et al. 1995; Blewett et al. 2000; Inci et al. 2003; Lee andSantamarina 2005; Leong et al. 2009). Resonant column test is awidely used and reliable technique for measuring small-strain shearmodulus, but it is limited by the compatibility with other geotech-nical testing apparatus such as triaxial, direct shear, odometer(Airey and Mohsin 2013), and its inherent electromotive force in-terference (Wang et al. 2003). Over the years, the bender elementtechnique, because of its small size and nondestructive nature, hasbecome more common and has been incorporated into variousgeotechnical instrumentations, combining shear wave measure-ment with other soil property testing such as shear strength, friction
angle, and K0 parameters (Jovičic and Coop 1998; Zeng andNi 1998; Salgado et al. 2000; Alramahi et al. 2007; Ng and Yung2008).
However, the accessibility of a wide range of saturation or par-ticularly high suction range becomes the obstacle for most of thegeotechnical experimentations for unsaturated soils. The axis trans-lation technique, which involves high air-entry ceramic stone, isone common approach to control the suction integrated into triaxialtest (Alramahi et al. 2007; Ng et al. 2009; Sawangsuriya 2009;Ghayoomi et al. 2011; Khosravi and McCartney 2012; Heitor et al.2013; Oh and Vanapalli 2014), but it is limited to a long time du-ration of equilibrium and capability limitation of highest suction. Incontrast, a remarkable volume change in expansive soil during dry-ing or wetting also increases the difficulty in good control of thetesting sample. A recent study by Lu and Kaya (2013) provided agood solution to tackle such problems. A Drying Cake method wasestablished to measure the soil cake deformation and elastic modu-lus, and then determine the suction stress characteristic curve andsoil–water retention curve. Soils can be dried under a low relativehumidity environment with equivalent hundreds of MPa of suction.A zero-loading boundary condition frees the soils to deform with-out crack development.
In this study, we introduce a new system of measuring shearwave propagation and small-strain shear modulus for sandy, silty,and clayey soils over a wide range of saturation up to hundreds ofMPa in suction without external loading. Dry air evaporation andwater mist adsorption were employed to provide drying and wet-ting conditions. Bender element technique was used, and the deter-mination of wave traveling time was identified for all shear wavemeasurements. Shear wave velocity and small-strain shear moduluswere then calculated for analysis of their dependencies on soilmoisture.
1Postdoctoral Fellow, Dept. of Civil and Environmental Engineering,Colorado School of Mines, 1012 14th St., Golden, CO 80401 (correspond-ing author). E-mail: [email protected]
2Professor, Dept. of Civil and Environmental Engineering, ColoradoSchool of Mines, 1012 14th St., Golden, CO 80401. E-mail: [email protected]
The entire system consists of two components: (1) an environmen-tal chamber that provides controlled relative humidity for dryingand wetting, and a digital balance that connects to a computer andrecords the change of soil weight; and (2) sensors and signal ac-quisition system that monitor the shear wave transmitted thoughthe sample. Fig. 1 provides an illustrative scheme to demonstratethe setup and connections of the system. A cylinder with a topplate seated on a bottom plate forms a chamber containing soilsamples. The chamber is lifted to a certain height for soil weightmonitoring. Circular openings were cut on the bottom plate withslightly larger size than the sample diameter, so that soil samplescan be placed exactly on the balance through the openings and beinstalled inside the chamber without touching the bottom plate anddisturbing the weight monitoring. Lids with adjustable openingswere designed on the top plate for accelerating or deceleratingthe natural evaporation speed for drying. A vapor diffusor con-nected to a humidifier was set at the center of the bottom plateand provided water mist injection for the wetting process. Theentire chamber allowed two soil samples under testing separately.For simplicity, Fig. 1 shows only half capacity of the sampleconfigurations.
A pair of bender elements with 2 mm tip length was put on thetop and bottom surface of the soil specimen, respectively. The sig-nal system consisted of an oscilloscope (Tektronix MDO3012,Beaverton, Oregon) with a built-in signal generator module(MDO3AFG) for signal emission and storage, and a digital filter(Krohn-Hite 3940, Brockton, Massachusetts) for signal condition-ing. The signal flow started with the signal generator sending anexcitation to the sender (bottom bender element). Then the shearwave was transmitted through the soil, and the receiver (top benderelement) sensed shear wave. After that the received signal filteredoff the noise and then recorded and displayed it on the oscilloscope.
Testing Procedure
In total, seven types of soil were tested. Table 1 lists the classifi-cations and basic properties of the soils. These soils were chosen torepresent a wide range of soil type, from sandy to silty, and clayeysoils. All soils were remolded and prepared as soil cakes in a moldwith diameter of 76.2 mm (3 in.), and approximately 20 mm thick-ness. Soil cakes were immerged in de-aired water in a desiccatorwith vacuum applied for sufficient time to be saturated (usuallyapproximately 1–2 days). After saturation, the soil samples weregently transferred into the environmental chamber for drying andthen wetting. Adjusting the opening of the lid size controls the
evaporation rate and reduces the local relative humidity gradientbetween soil sample and its surrounding air. Throughout the evapo-ration drying process, the color of the entire soil cake surfacechanged uniformly, which ensured that the thin soil cakes weredried under a relatively homogeneous distribution of water content.A very thin film of Vaseline (Unilever, Englewood Cliffs, NewJersey) grease was spread on the surface of the sample holdingplate to minimize the friction between soil sample and holdingplate, and to prevent the soil cracking during drying or wetting. Theexperimental setup was maintained at a constant room temperature(25� 2°C). We took advantage of the low relative humidity of 31%(�10%) in local room condition, which is equivalent to a total suc-tion of approximately 123–215 MPa, based on Kelvin’s equation(e.g., Lu and Likos 2004). This can also be achieved by usingdesiccants or injecting dry nitrogen gas. A digital balance with0.01-g accuracy was used to monitor the water content, and tocalculate the water content of soil under drying or wetting. Afterdrying, an adjustable humidifier was used to provide water mistinto the chamber to gradually wet the soil cakes. Low strength ofthe mist plume was injected to prevent water droplet condensationon the specimen for wetting. One measurement needed to be takenapproximately every 12–24 h, and the duration of a single test var-ied from 7 to 16 days, depending on the soil type (Dong et al. 2016;Dong and Lu (2016).
The measurement of shear wave velocity was accomplished bysimilar settings in previously published papers (Truong et al. 2011;Dong et el. 2016). Because of the unknown natural frequency of thesoil-sensor system, a 50-Hz step-function signal was selected as theexcitation, because step function covers the entire frequency rangein a frequency domain. The excitation was emitted by the sendingsensor, which generated a sudden pulse of vibration (50 times in asecond). The excitation transmitted in the manner of shear wavethrough the soil skeleton. The frequency of the shear wave dependson the soil skeleton and stiffness of the bender element and itsmounting system (Lee and Santamarina 2005). The tiny local vi-bration was sensed and captured by the receiver bender element andtransferred into received signal, which was then filtered through100-Hz high-pass, 50-kHz low-pass channels, with 20 dB of gainamplification for each. The signals were digitized at a 2.5 GHzsampling rate (100,000 data points). A stack of 256 signal-acquiring permits reduced the noncoherent noise.
In the literature, different methods are used to determine thetraveling time of the shear wave: first arrival, peak to peak, crosscorrelation, wavelet analysis, phase detection analysis, and otherfrequency domain methods (Cho and Santamarina 2001; Bonalet al. 2012; Styler and Howie 2013). The first arrival under a step-function excitation is considered the most reliable method todetermine the travel time of shear wave over the distance. Theshear-wave velocity Vs can be evaluated by dividing the knowntip-to-tip distance between the two bender elements by the traveltime for the first arrival t:
Base
Top plate
Cylinder
Balance
SoilOscilloscope/Signal generator
Digital filter
Sending
Receiving
Bender elements
Bottom plate
Vapor diffuser
Fig. 1. Experimental setup for drying and wetting of the soil sampleand peripheral instruments for sensors and signals
Table 1. Basic Properties of Tested Soils and the Classifications
Vs ¼ ðdtt=ΔtÞ ð1Þwhere dtt = tip-to-tip distance between the sending and receivingbender elements (assuming constant sample thickness as a result ofthe negligible vertical deformation in a thin cake); and Δt = traveltime of the first arrival. Then the G0 values can be calculated using
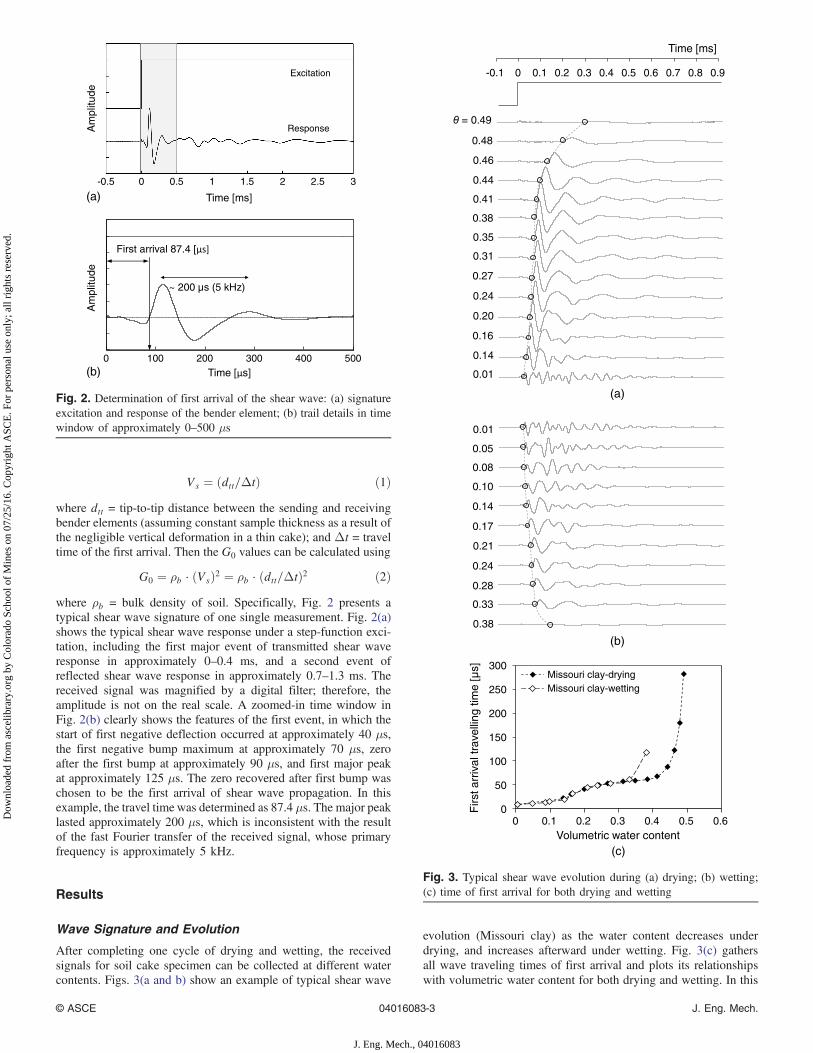
G0 ¼ ρb · ðVsÞ2 ¼ ρb · ðdtt=ΔtÞ2 ð2Þwhere ρb = bulk density of soil. Specifically, Fig. 2 presents atypical shear wave signature of one single measurement. Fig. 2(a)shows the typical shear wave response under a step-function exci-tation, including the first major event of transmitted shear waveresponse in approximately 0–0.4 ms, and a second event ofreflected shear wave response in approximately 0.7–1.3 ms. Thereceived signal was magnified by a digital filter; therefore, theamplitude is not on the real scale. A zoomed-in time window inFig. 2(b) clearly shows the features of the first event, in which thestart of first negative deflection occurred at approximately 40 μs,the first negative bump maximum at approximately 70 μs, zeroafter the first bump at approximately 90 μs, and first major peakat approximately 125 μs. The zero recovered after first bump waschosen to be the first arrival of shear wave propagation. In thisexample, the travel time was determined as 87.4 μs. The major peaklasted approximately 200 μs, which is inconsistent with the resultof the fast Fourier transfer of the received signal, whose primaryfrequency is approximately 5 kHz.
Results
Wave Signature and Evolution
After completing one cycle of drying and wetting, the receivedsignals for soil cake specimen can be collected at different watercontents. Figs. 3(a and b) show an example of typical shear wave
evolution (Missouri clay) as the water content decreases underdrying, and increases afterward under wetting. Fig. 3(c) gathersall wave traveling times of first arrival and plots its relationshipswith volumetric water content for both drying and wetting. In this
-0.5 0 0.5 1 1.5 2 2.5 3
Am
plitu
de
Time [ms]
Excitation
Response
0 100 200 300 400 500
~ 200 µs (5 kHz)
First arrival 87.4
Time [ s]
Am
plitu
de
(a)
(b)
Fig. 2. Determination of first arrival of the shear wave: (a) signatureexcitation and response of the bender element; (b) trail details in timewindow of approximately 0–500 μs
(a)
(b)
(c)
= 0.49
0.48
0.46
0.44
0.41
0.38
0.35
0.31
0.27
0.24
0.20
0.16
0.01
0.14
0.01
0.05
0.08
0.10
0.14
0.17
0.21
0.24
0.33
0.28
0.38
-0.1 0 0.1 0.2 0.3 0.4 0.5 0.6 0.7 0.8 0.9
Time [ms]
0
50
100
150
200
250
300
0 0.1 0.2 0.3 0.4 0.5 0.6
Firs
t arr
ival
trav
ellin
g tim
e [µ
s]
Volumetric water content
Missouri clay-dryingMissouri clay-wetting
Fig. 3. Typical shear wave evolution during (a) drying; (b) wetting;(c) time of first arrival for both drying and wetting
case, when the soil sample started to dry at full saturation, the firstarrival was relatively far away from the excitation at time zero(approximately 281.8 μs), and the amplitude was very small. Thisalso indicates that the soil is very soft under zero total stress and ina full-saturation condition at water content θ ¼ 0.49. As the soildesaturates, the major peak starts to become prominent with higheramplitude. In addition, the related time response turns are signifi-cantly compacted, reflecting the velocity increases and wave frontmoving closer toward the time zero of excitation: 179.4 and122.6 μs of the first arrivals at θ ¼ 0.48 and 0.46, respectively.
As the soil continues to dry, the major peak gradually movesclose to time zero of the excitation and the amplitude reaches amaximum amplitude of approximately θ ¼ 0.41, then stays at thesame order of magnitude but slightly decreases. At the end ofdrying at θ ¼ 0.01, the major peak of the first wave front movesvery close to the time zero of excitation, indicating a very fast shearwave velocity compared with that under the higher water contentconditions. The amplitude decreases but is still discernible. Afterthe major peak of the first event, the succeeding events such as thesecond or even third arrival of the reflected shear wave—or thereflected p-waves by the boundary—can be identified on the trailof the responsive signal, because of the significantly increased soilstiffness and propagating velocity. Therefore, more signal undula-tion can be identified on the trail in the range of approximately0–0.50 ms.
During the wetting process, the trend of responsive signal varia-tion is reversed. As the water content increases from 0.01 to 0.10,the reactive range signal fluctuation slightly decreases from approx-imately 0–0.50 to 0–0.40 ms. The composition of the multieventresponse at θ ¼ 0.01 gradually evolves into a single major-eventresponse at θ ¼ 0.14, with a prominent major peak and a firstarrival in the range of approximately 0–0.15 ms and subtle re-sponse of other events in the coda wave range of approximately0.15–0.35 ms. As the water content continues to increase from θ ¼0.14 to 0.28, the major peak becomes dominant over the others, andthe first arrival time gradually increases. During the final stage ofwetting at water content 0.33 and 0.38, the major peak on the re-sponse signal starts to decay, as a result of the increased amount ofwater and soil softening. At the end of wetting at water content0.38, the signal almost recovers back to the same response signalat water content 0.49 of drying, but with a shorter traveling time ofthe first arrival, which is considered caused by the effect of hyste-resis of the capillary water, and is consistent with some previousobservations (Ng et al. 2009; Khosravi and McCartney 2012).
In Fig. 3(c), the quantitative curves clearly illustrate the varia-tion of traveling time evolving with volumetric water content andits dependency on drying or wetting paths. The step-wise charac-teristics on curves of the first arrival time as the water contentdecreases under drying or increases under wetting indicates thatdifferent mechanisms are controlling throughout the entire soil–water regimes. The first arrival times of wetting path returns backalong the same track of drying path until the end of the first bump asthe water content increases (at θ ¼ 0.33). Then, the first arrival timestarts to increase significantly and deviates from the first arrivals ofdrying, which suggests a hysteresis of wave propagation caused bythe capillary water.
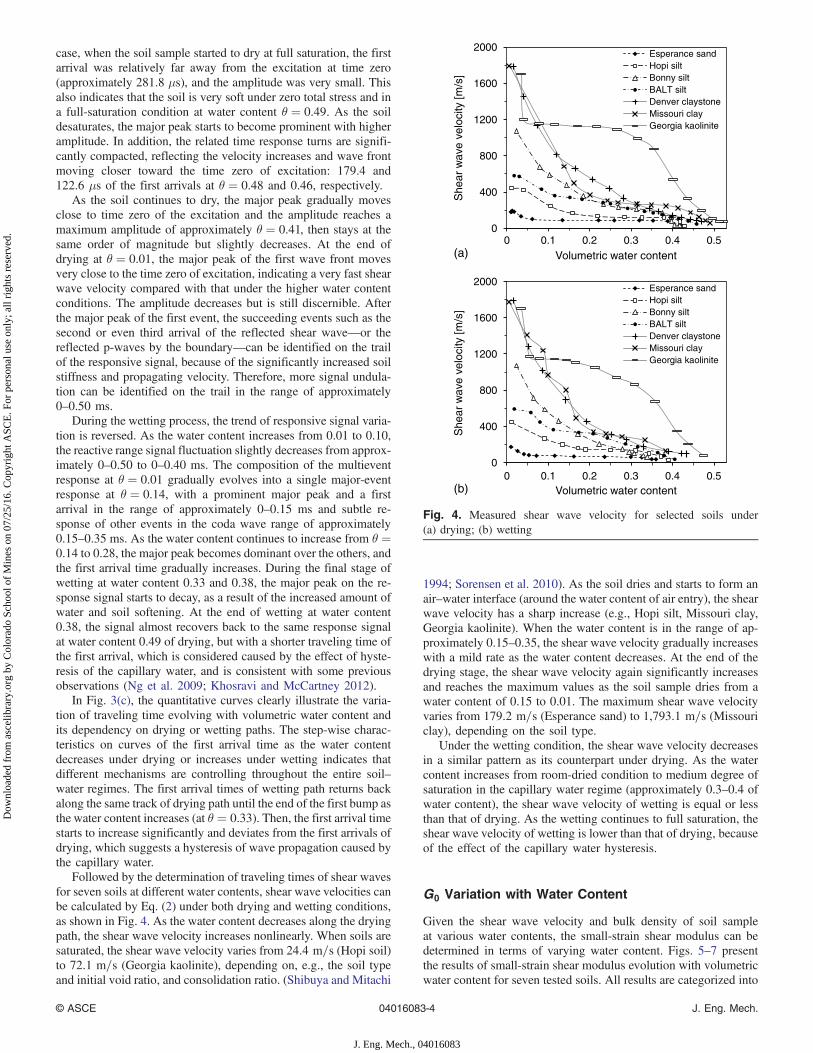
Followed by the determination of traveling times of shear wavesfor seven soils at different water contents, shear wave velocities canbe calculated by Eq. (2) under both drying and wetting conditions,as shown in Fig. 4. As the water content decreases along the dryingpath, the shear wave velocity increases nonlinearly. When soils aresaturated, the shear wave velocity varies from 24.4 m=s (Hopi soil)to 72.1 m=s (Georgia kaolinite), depending on, e.g., the soil typeand initial void ratio, and consolidation ratio. (Shibuya and Mitachi
1994; Sorensen et al. 2010). As the soil dries and starts to form anair–water interface (around the water content of air entry), the shearwave velocity has a sharp increase (e.g., Hopi silt, Missouri clay,Georgia kaolinite). When the water content is in the range of ap-proximately 0.15–0.35, the shear wave velocity gradually increaseswith a mild rate as the water content decreases. At the end of thedrying stage, the shear wave velocity again significantly increasesand reaches the maximum values as the soil sample dries from awater content of 0.15 to 0.01. The maximum shear wave velocityvaries from 179.2 m=s (Esperance sand) to 1,793.1 m=s (Missouriclay), depending on the soil type.
Under the wetting condition, the shear wave velocity decreasesin a similar pattern as its counterpart under drying. As the watercontent increases from room-dried condition to medium degree ofsaturation in the capillary water regime (approximately 0.3–0.4 ofwater content), the shear wave velocity of wetting is equal or lessthan that of drying. As the wetting continues to full saturation, theshear wave velocity of wetting is lower than that of drying, becauseof the effect of the capillary water hysteresis.
G0 Variation with Water Content
Given the shear wave velocity and bulk density of soil sampleat various water contents, the small-strain shear modulus can bedetermined in terms of varying water content. Figs. 5–7 presentthe results of small-strain shear modulus evolution with volumetricwater content for seven tested soils. All results are categorized into
three groups to demonstrate the dependency of G0 on watercontent.
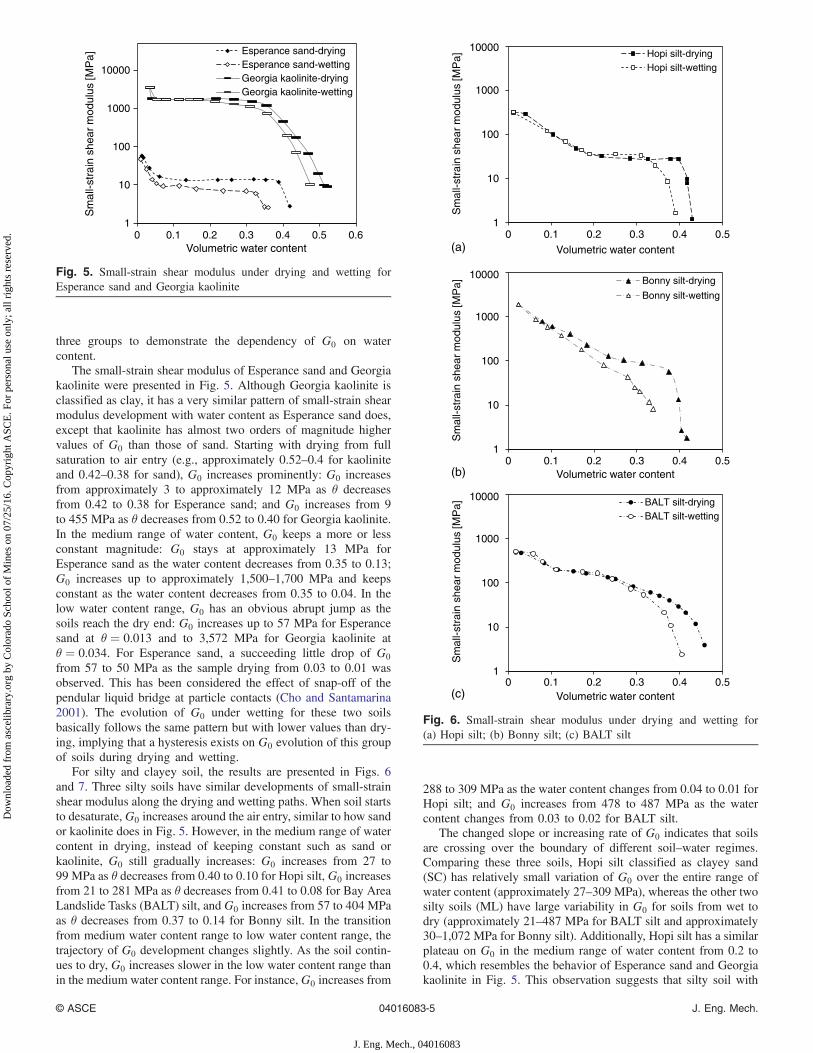
The small-strain shear modulus of Esperance sand and Georgiakaolinite were presented in Fig. 5. Although Georgia kaolinite isclassified as clay, it has a very similar pattern of small-strain shearmodulus development with water content as Esperance sand does,except that kaolinite has almost two orders of magnitude highervalues of G0 than those of sand. Starting with drying from fullsaturation to air entry (e.g., approximately 0.52–0.4 for kaoliniteand 0.42–0.38 for sand), G0 increases prominently: G0 increasesfrom approximately 3 to approximately 12 MPa as θ decreasesfrom 0.42 to 0.38 for Esperance sand; and G0 increases from 9to 455 MPa as θ decreases from 0.52 to 0.40 for Georgia kaolinite.In the medium range of water content, G0 keeps a more or lessconstant magnitude: G0 stays at approximately 13 MPa forEsperance sand as the water content decreases from 0.35 to 0.13;G0 increases up to approximately 1,500–1,700 MPa and keepsconstant as the water content decreases from 0.35 to 0.04. In thelow water content range, G0 has an obvious abrupt jump as thesoils reach the dry end: G0 increases up to 57 MPa for Esperancesand at θ ¼ 0.013 and to 3,572 MPa for Georgia kaolinite atθ ¼ 0.034. For Esperance sand, a succeeding little drop of G0
from 57 to 50 MPa as the sample drying from 0.03 to 0.01 wasobserved. This has been considered the effect of snap-off of thependular liquid bridge at particle contacts (Cho and Santamarina2001). The evolution of G0 under wetting for these two soilsbasically follows the same pattern but with lower values than dry-ing, implying that a hysteresis exists on G0 evolution of this groupof soils during drying and wetting.
For silty and clayey soil, the results are presented in Figs. 6and 7. Three silty soils have similar developments of small-strainshear modulus along the drying and wetting paths. When soil startsto desaturate, G0 increases around the air entry, similar to how sandor kaolinite does in Fig. 5. However, in the medium range of watercontent in drying, instead of keeping constant such as sand orkaolinite, G0 still gradually increases: G0 increases from 27 to99 MPa as θ decreases from 0.40 to 0.10 for Hopi silt, G0 increasesfrom 21 to 281 MPa as θ decreases from 0.41 to 0.08 for Bay AreaLandslide Tasks (BALT) silt, and G0 increases from 57 to 404 MPaas θ decreases from 0.37 to 0.14 for Bonny silt. In the transitionfrom medium water content range to low water content range, thetrajectory of G0 development changes slightly. As the soil contin-ues to dry, G0 increases slower in the low water content range thanin the medium water content range. For instance,G0 increases from
288 to 309 MPa as the water content changes from 0.04 to 0.01 forHopi silt; and G0 increases from 478 to 487 MPa as the watercontent changes from 0.03 to 0.02 for BALT silt.
The changed slope or increasing rate of G0 indicates that soilsare crossing over the boundary of different soil–water regimes.Comparing these three soils, Hopi silt classified as clayey sand(SC) has relatively small variation of G0 over the entire range ofwater content (approximately 27–309 MPa), whereas the other twosilty soils (ML) have large variability in G0 for soils from wet todry (approximately 21–487 MPa for BALT silt and approximately30–1,072 MPa for Bonny silt). Additionally, Hopi silt has a similarplateau on G0 in the medium range of water content from 0.2 to0.4, which resembles the behavior of Esperance sand and Georgiakaolinite in Fig. 5. This observation suggests that silty soil with
higher fine content can develop higher G0 variation between dryand saturated states than sandy soil.
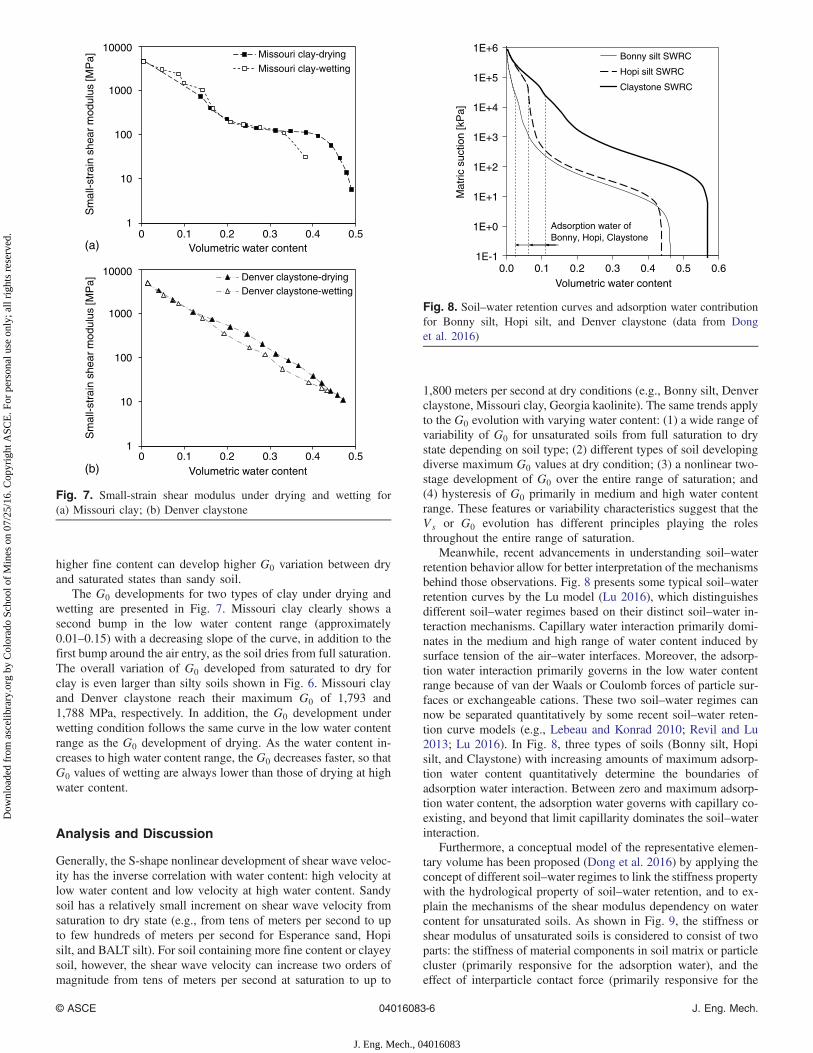
The G0 developments for two types of clay under drying andwetting are presented in Fig. 7. Missouri clay clearly shows asecond bump in the low water content range (approximately0.01–0.15) with a decreasing slope of the curve, in addition to thefirst bump around the air entry, as the soil dries from full saturation.The overall variation of G0 developed from saturated to dry forclay is even larger than silty soils shown in Fig. 6. Missouri clayand Denver claystone reach their maximum G0 of 1,793 and1,788 MPa, respectively. In addition, the G0 development underwetting condition follows the same curve in the low water contentrange as the G0 development of drying. As the water content in-creases to high water content range, the G0 decreases faster, so thatG0 values of wetting are always lower than those of drying at highwater content.
Analysis and Discussion
Generally, the S-shape nonlinear development of shear wave veloc-ity has the inverse correlation with water content: high velocity atlow water content and low velocity at high water content. Sandysoil has a relatively small increment on shear wave velocity fromsaturation to dry state (e.g., from tens of meters per second to upto few hundreds of meters per second for Esperance sand, Hopisilt, and BALT silt). For soil containing more fine content or clayeysoil, however, the shear wave velocity can increase two orders ofmagnitude from tens of meters per second at saturation to up to
1,800 meters per second at dry conditions (e.g., Bonny silt, Denverclaystone, Missouri clay, Georgia kaolinite). The same trends applyto the G0 evolution with varying water content: (1) a wide range ofvariability of G0 for unsaturated soils from full saturation to drystate depending on soil type; (2) different types of soil developingdiverse maximum G0 values at dry condition; (3) a nonlinear two-stage development of G0 over the entire range of saturation; and(4) hysteresis of G0 primarily in medium and high water contentrange. These features or variability characteristics suggest that theVs or G0 evolution has different principles playing the rolesthroughout the entire range of saturation.
Meanwhile, recent advancements in understanding soil–waterretention behavior allow for better interpretation of the mechanismsbehind those observations. Fig. 8 presents some typical soil–waterretention curves by the Lu model (Lu 2016), which distinguishesdifferent soil–water regimes based on their distinct soil–water in-teraction mechanisms. Capillary water interaction primarily domi-nates in the medium and high range of water content induced bysurface tension of the air–water interfaces. Moreover, the adsorp-tion water interaction primarily governs in the low water contentrange because of van der Waals or Coulomb forces of particle sur-faces or exchangeable cations. These two soil–water regimes cannow be separated quantitatively by some recent soil–water reten-tion curve models (e.g., Lebeau and Konrad 2010; Revil and Lu2013; Lu 2016). In Fig. 8, three types of soils (Bonny silt, Hopisilt, and Claystone) with increasing amounts of maximum adsorp-tion water content quantitatively determine the boundaries ofadsorption water interaction. Between zero and maximum adsorp-tion water content, the adsorption water governs with capillary co-existing, and beyond that limit capillarity dominates the soil–waterinteraction.
Furthermore, a conceptual model of the representative elemen-tary volume has been proposed (Dong et al. 2016) by applying theconcept of different soil–water regimes to link the stiffness propertywith the hydrological property of soil–water retention, and to ex-plain the mechanisms of the shear modulus dependency on watercontent for unsaturated soils. As shown in Fig. 9, the stiffness orshear modulus of unsaturated soils is considered to consist of twoparts: the stiffness of material components in soil matrix or particlecluster (primarily responsive for the adsorption water), and theeffect of interparticle contact force (primarily responsive for the
1
10
100
1000
10000
0 0.1 0.2 0.3 0.4 0.5
Sm
all-s
trai
n sh
ear
mod
ulus
[MP
a]
Volumetric water content
Missouri clay-drying
Missouri clay-wetting
1
10
100
1000
10000
0 0.1 0.2 0.3 0.4 0.5
Sm
all-s
trai
n sh
ear
mod
ulus
[MP
a]
Volumetric water content
Denver claystone-dryingDenver claystone-wetting
(a)
(b)
Fig. 7. Small-strain shear modulus under drying and wetting for(a) Missouri clay; (b) Denver claystone
1E-1
1E+0
1E+1
1E+2
1E+3
1E+4
1E+5
1E+6
0.0 0.1 0.2 0.3 0.4 0.5 0.6
Mat
ric s
uctio
n [k
Pa]
Volumetric water content
Bonny silt SWRC
Hopi silt SWRC
Claystone SWRC
Adsorption water ofBonny, Hopi, Claystone
Fig. 8. Soil–water retention curves and adsorption water contributionfor Bonny silt, Hopi silt, and Denver claystone (data from Donget al. 2016)
capillary water). The first-part contribution to the shear modulushas been found in a power law in terms of the inverse of degreeof saturation (Lu and Kaya 2014); the second part can be repre-sented using suction stress concept and be correlated to soil–waterretention (Dong and Lu 2016).
Therefore, the observations of G0 development obey the sameprinciple of the separation of soil–water regimes. As such, differentG0 development patterns indicate different soil–water interactionmechanisms. Specifically, Esperance sand and Georgia kaolinitedemonstrate a good example for G0 development primarily in thecapillary water regime. Esperance sand has little fine soil content,and kaolinite is nonexpansive soil with only particle-surface hy-dration at very low water content or suction (Lu and Khorshidi2015). Hence, in the medium and high range of water content(e.g., θ > 0.05), G0 shows a typical development in the capillarywater as the water content varies (Fig. 5): an initial increment of G0
around air entry followed by a barely changed plateau of G0 as soildries, and G0 of wetting always lower than G0 of drying. Thisfeature can also be found in clayey sand Hopi silt in θ > 0.20 inFig. 6(a). The G0 magnitude of Georgia kaolinite is approximatelytwo orders higher, because of the much smaller particle sizeand thus stronger capillary effect. In low water content range(θ > 0.05), Esperance sand and kaolinite have little increment ofG0 because of the gradual formation of isolated pendular liquidbridge at particle contacts. In contrast, in the medium and low watercontent range, three silty soils and two expansive clays (Figs. 6and 7) clearly illustrate that another type of G0 evolution in theadsorption water regime complies with the other mechanism. G0
gradually increases with a decreasing rate as the soil dries. There-fore, the G0 curve forms another bump in the range in which thecapillary water gradually diminishes, whereas the adsorption watertakes over the dominancy. The boundaries of second bump in thelow water content range are also consistent with the amount ofmaximum adsorption water content, as shown in Fig. 8. At the dryend, G0 increases to an upper-bound value that varies significantlyby types of soils. Finally, G0 along wetting follows the same pathalong drying, and no obvious hysteresis of G0 between drying andwetting can be found in the adsorption water regime.
Summary and Conclusions
In this study, a new technology is presented that is capable of meas-uring the shear wave velocity and small-strain shear modulus for alltypes of soils under both variably drying and wetting conditions.Using the low relative humidity and controlled water mist injectionenvironment, various types of soil were tested over a wide range ofwater content. Bender element technique was incorporated with asoil cake test to monitor the shear wave evolution and record the
wave propagation velocity, as the water content varies under thezero total stress conditions. The measured shear wave velocitychanges greatly with the water content, and it varies significantlyfrom tens to hundreds of meters per second, or even up to a fewthousands of meters per second, as soils change from fully wet todry. The maximum shear wave velocity of soil at dry state alsoalters greatly from a few hundreds of meters per second up to1,800 m=s, depending on the soil types. The small-strain shearmoduli for seven soils at different water contents were determinedalong both drying and wetting paths. It is demonstrated that sandysoil has relatively small variation on G0 over the saturation,whereas silty or clayey soil can develop hundreds of megapascalsor even a few gigapascals on G0 when soil is complete dry.
The Lu soil–water retention model, capable of separating theadsorption and capillary water regimes, provides insightful inter-pretation on the evolution characteristics of G0 with varying watercontent. The particle-scale conceptual model based on differentmechanisms for different soil–water regimes was employed to ex-plain the step-wise nonlinear evolution of G0 along both dryingand wetting paths. In the capillary water regime, G0 keeps almostconstant except the initial variation around the air entry, because ofthe formation of the air–water interface. Unlikely,G0 has a separatenonlinear relationship with the adsorption water, in which G0 in-creases with reducing water content. G0 of the adsorption regimesuperimposes with the capillary water contribution on G0 andforms another bump on the curves. In the adsorption water regime,the G0 of drying and wetting are more or less identical, whereas inthe capillary regime the G0 of wetting is always smaller than that ofdrying. Therefore, the hydraulic hysteresis of G0 was found to beprominent in the capillary water rather than the adsorption water.
Acknowledgments
This research is supported by a grant from the National ScienceFoundation (NSF CMMI-1230544).
References
Airey, D., and Mohsin, A. K. M. (2013). “Evaluation of shear wave velocityfrom bender elements using cross-correlation.” Geotech. Test. J., 36(4),1–9.
Alramahi, B., Dante, F., Khalid, A. A., and Stephen, T. (2007). “A suction-control apparatus for the measurement of P and S-wave velocity insoils.” Geotech. Test. J., 31(1), 266–275.
Blewett, J., Blewett, I. J., and Woodward, P. K. (2000). “Phase and ampli-tude responses associated with the measurement of shear-wave velocityin sand by bender elements.” Can. Geotech. J., 37(6), 1348–1357.
Bonal, J., Donohue, S., and McNally, C. (2012). “Wavelet analysis ofbender element signals.” Geotechnique, 62(3), 243–252.
Cho, G. C., and Santamarina, J. C. (2001). “Unsaturated particulate mate-rials: particle-level studies.” J. Geotech. Geoenviron. Eng., 10.1061/(ASCE)1090-0241(2001)127:1(84), 84–96.
Clayton, C. R. I. (2011). “Stiffness at small strain: Research and practice.”Géotechnique, 61(1), 5–37.
Dong, Y., and Lu, N. (2016). “Correlation between small-strain shearmodulus and suction stress of unsaturated soils in capillary regime.”J. Geotech. Geoenviron. Eng., 10.1061/(ASCE)GT.1943-5606.0001531, 04016056.
Dong, Y., Lu, N., and McCartney, J. (2016). “A unified model for small-strain shear modulus of variably saturated soil.” J. Geotech. Geoen-viron. Eng., 10.1061/(ASCE)GT.1943-5606.0001506, 04016039.
Ghayoomi, M., McCartney, J. S., and Ko, H. Y. (2011). “Centrifuge testto assess the seismic compression of partially saturated sand layers.”Geotech. Test. J., 34(4), 321–331.
Heitor, A., Indraratna, B., and Rujikiatkamjorn, C. (2013). “Laboratorystudy of small-strain behavior of a compacted silty sand.” Can.Geotech. J., 50(2), 179–188.
Inci, G., Nazli, Y., and Takaaki, K. (2003). “Experimental investigation ofdynamic response of compacted clayey soils.” Geotech. Test. J., 26(2),125.
Jovičic, V., and Coop, M. R. (1998). “The measurement of stiffnessanisotropy in clays with bender element tests in the triaxial apparatus.”Geotech. Test. J., 21(1), 3–10.
Khosravi, A., and McCartney, J. S. (2012). “Impact of hydraulichysteresis on the small-strain shear modulus of unsaturated soils.”J. Geotech. Geoenviron. Eng., 10.1061/(ASCE)GT.1943-5606.0000713, 1326–1333.
Kramer, S. L. (1996). Geotechnical earthquake engineering, Prentice Hall,Upper Saddle River, NJ.
Lebeau, M., and Konrad, J. M. (2010). “A new capillary and thin film flowmodel for predicting the hydraulic conductivity of unsaturated porousmedia.” Water Resour. Res., 46(12), W12554.
Lee, J. S., and Santamarina, J. C. (2005). “Bender element: Performanceand signal interpretation.” J. Geotech. Geoenviron. Eng., 10.1061/(ASCE)1090-0241(2005)131:9(1063), 1063–1070.
Leong, E. C., Cahyadi, J., and Rahardjo, H. (2009). “Measuring shear andcompression wave velocities of soil using bender-extender elements.”Can. Geotech. J., 46(7), 792–812.
Lu, N. (2016). “Generalized soil water retention equation for adsorptionand capillarity.” J. Geotech. Geoenviron. Eng., 10.1061/(ASCE)GT.1943-5606.0001524, 04016051.
Lu, N., and Kaya, M. (2013). “A drying cake method for measuringsuction-stress characteristic curve, soil–water-retention curve, and hy-draulic conductivity function.” Geotech. Test. J., 36(1), 1–19.
Lu, N., and Kaya, M. (2014). “Power law for elastic moduli of unsaturatedsoil.” J. Geotech. Geoenviron. Eng., 10.1061/(ASCE)GT.1943-5606.0000990, 46–56.
Lu, N., and Khorshidi, M. (2015). “Mechanisms for soil–water retentionand hysteresis at high suction range.” J. Geotech. Geoenviron. Eng.,10.1061/(ASCE)GT.1943-5606.0001325, 04015032.
Lu, N., and Likos, W. J. (2004). Unsaturated soil mechanics, Wiley,Hoboken, NJ.
Mancuso, C., Vassallo, R., and d’Onofrio, A. (2002). “Small strain behav-ior of a silty sand in controlled-suction resonant column torsional sheartests.” Can. Geotech. J., 39(1), 22–31.
Marinho, F. A. M., Chandler, R. J., and Crilly, M. S. (1995). “Stiffnessmeasurements on an unsaturated high plasticity clay using benderelements.” Proc., 1st Int. Conf. on Unsaturated Soils, ASCE, Reston,VA, 535–544.
Ng, C. W. W., Xu, J., and Yung, S. Y. (2009). “Effects of imbibition-drainage and stress ratio on an-isotropic stiffness of an unsaturated soilat very small strains.” Can. Geotech. J., 46(9), 1062–1076.
Ng, C. W. W., and Yung, S. Y. (2008). “Determination of the anisotropicshear stiffness of an unsaturated decomposed soil.” Géotechnique,58(1), 23–35.
Oh, W. T., and Vanapalli, S. K. (2014). “Semi-empirical model for estimat-ing the small-strain shear modulus of unsaturated non-plastic sandysoils.” Geotech. Geol. Eng., 32(2), 259–271.
Qian, X., Gray, D. H., and Woods, R. D. (1991). “Resonant column tests onpartially saturated sands.” Geotech. Test. J., 14(3), 266–275.
Revil, A., and Lu, N. (2013). “Unified water sorption and desorptionisotherms for clayey porous materials.” Water Resour. Res., 49(9),5685–5699.
Salgado, R., Bandini, P., and Karim, A. (2000). “Shear strength and stiff-ness of silty sand.” J. Geotech. Geoenviron. Eng., 10.1061/(ASCE)1090-0241(2000)126:5(451), 451–462.
Sawangsuriya, A., Edil, T. B., and Bosscher, P. J. (2009). “Modulus-suctionmoisture relationship for compacted soils in post compaction state.”J. Geotech. Geoenviron. Eng., 10.1061/(ASCE)GT.1943-5606.0000108, 1390–1403.
Shibuya, S., and Mitachi, T. (1994). “Small strain shear modulus of claysedimentation in a state of normal consolidation.” Soils Found., 34(4),67–77.
Sorensen, K. K., Baudet, B. A., and Simpson, B. (2010). “Influence ofstrain rate and acceleration on the behaviour of reconstituted clays atsmall strains.” Géotechnique, 60(10), 751–763.
Styler, M. A. and Howie, J. A. (2013). “Combined time and frequency do-main approach to the interpretation of bender-element tests on sand.”Geotech. Test. J., 36(5), 1–11.
Truong, Q., Lee, J., Dong, Y., and Yun, T. (2011). “Capillary induced small-strain stiffness for hydrophilic and hydrophobic granular materials:Experimental and numerical studies.” Soils Found., 51(4), 713–721.
Wang, Y. H., Cascante, G., and Santamarina, J. C. (2003). “Resonantcolumn testing: The inherent counter EMF effect.” Geotech. Test. J.,26(3), 1–11.
Yang, J., and Gu, X. Q. (2013). “Shear stiffness of granular material atsmall strains: Does it depend on grain size?” Géotechnique, 63(2),165–179.
Youn, J. U., Choo, Y. W., and Kim, D. S. (2008). “Measurement of small-strain shear modulus G max of dry and saturated sands by benderelement, resonant column, and torsional shear tests.” Can. Geotech. J.,45(10), 1426–1438.
Zeng, X. and Ni, B. (1998). “Application of bender elements in measuringGmax of sand under K0 condition.” Geotech. Test. J., 21(3), 251–263.