43
IN-USE FUEL ECONOMY AND EMISSION BENEFITS OF HYBRID- ELECTRIC SCHOOL BUSES IN IOWA Final Report July 2010 Sponsored by Iowa Energy Center
IN-USE FUEL ECONOMY AND EMISSION BENEFITS OF HYBRID-ELECTRIC SCHOOL BUSES IN IOWA
Final Report July 2010
Sponsored by Iowa Energy Center
About the Institute for Transportation The mission of the Institute for Transportation (InTrans) at Iowa State University is to develop and implement innovative methods, materials, and technologies for improving transportation efficiency, safety, reliability, and sustainability while improving the learning environment of students, faculty, and staff in transportation-related fields.
Iowa State University Disclaimer Notice The contents of this report reflect the views of the authors, who are responsible for the facts and the accuracy of the information presented herein. The opinions, findings and conclusions expressed in this publication are those of the authors and not necessarily those of the sponsors. The sponsors assume no liability for the contents or use of the information contained in this document. This report does not constitute a standard, specification, or regulation. The sponsors do not endorse products or manufacturers. Trademarks or manufacturers’ names appear in this report only because they are considered essential to the objective of the document.
Iowa State University Non-discrimination Statement Iowa State University does not discriminate on the basis of race, color, age, religion, national origin, sexual orientation, gender identity, sex, marital status, disability, or status as a U.S. veteran. Inquiries can be directed to the Director of Equal Opportunity and Diversity, (515) 294-7612.
Technical Report Documentation Page
1. Report No. 2. Government Accession No. 3. Recipient’s Catalog No.
4. Title and Subtitle 5. Report Date In-Use Fuel Economy and Emission Benefits of Hybrid-Electric School Buses in Iowa
July 2010 6. Performing Organization Code
7. Author(s) 8. Performing Organization Report No. Shauna Hallmark, Bob Sperry, and Abhisek Mudgal 9. Performing Organization Name and Address 10. Work Unit No. (TRAIS) Institute for Transportation Iowa State University 2711 South Loop Drive, Suite 4700 Ames, IA 50010-8664
11. Contract or Grant No.
12. Sponsoring Organization Name and Address 13. Type of Report and Period Covered Iowa Energy Center, 2521 University Boulevard, Suite 124 Ames, Iowa 50010-8229 and the Midwest Transportation Consortium at InTrans
Final Report 14. Sponsoring Agency Code
15. Supplementary Notes Visit www.intrans.iastate.edu for color PDF files of this and other research reports. 16. Abstract This report summarizes the evaluation results of an in-use fuel economy evaluation for two plug-in hybrid school buses deployed in two different school districts in Iowa. Each school district selected a control bus that runs a route similar to that of the hybrid bus. Odometer readings, fuel consumption, and maintenance needs were recorded for each bus. The buses were deployed in 2008.
17. Key Words 18. Distribution Statement emissions testing—fuel economy—hybrid-electric school buses—Iowa school routes
No restrictions.
19. Security Classification (of this report)
20. Security Classification (of this page)
21. No. of Pages 22. Price
Unclassified. Unclassified. 38 NA
Form DOT F 1700.7 (8-72) Reproduction of completed page authorized


IN-USE FUEL ECONOMY AND EMISSION BENEFITS OF HYBRID-ELECTRIC SCHOOL
BUSES IN IOWA
Final Report July 2010
Principal Investigator Shauna Hallmark
Associate Professor of Civil, Construction, and Environmental Engineering Institute for Transportation, Iowa State University
Principal Investigator
Bob Sperry Local Roads Safety Liaison, Iowa Local Technical Assistance Program
Institute for Transportation, Iowa State University
Research Assistant Abhisek Mudgal
Authors
Shauna Hallmark, Bob Sperry, and Abhisek Mudgal
Sponsored by the Iowa Energy Center
A report from Institute for Transportation
Iowa State University 2711 South Loop Drive, Suite 4700
Ames, IA 50010-8664 Phone: 515-294-8103 Fax: 515-294-0467
www.intrans.iastate.edu

TABLE OF CONTENTS TABLE OF CONTENTS .................................................................................................................7
1. EXECUTIVE SUMMARY .........................................................................................................8
2. BACKGROUND .......................................................................................................................11
2.1 Hybrid Performance in the Transit Market ..................................................................11 2.2 Hybrid-Electric School Bus .........................................................................................13 2.3 Project Scope and Objectives .......................................................................................14
3. IOWA’S PLUG-IN HYBRID-ELECTRIC SCHOOL BUSES .................................................16
3.1 Evaluation Plan ............................................................................................................18 3.2 Description of Buses in Nevada ...................................................................................19 3.3 Description of Buses in Sigourney ..............................................................................21
4. VEHICLE OPERATION ANALYSIS AND RESULTS ..........................................................22
4.1 General Vehicle Operation ..........................................................................................22 4.2 Fuel Economy ..............................................................................................................23 4.3 Maintenance .................................................................................................................26
5. EMISSIONS ANALYSIS AND RESULTS ..............................................................................27
5.1 Description of Portable Emissions Monitoring System ...............................................28 5.2 Description of Route ....................................................................................................30 5.3 Data Reduction.............................................................................................................32 5.4 Emissions Analysis ......................................................................................................33
6. RESULTS FROM OTHER HYBRID SCHOOL BUSES .........................................................37
6.1 Fuel Economy and Emissions ......................................................................................37 6.3 Maintenance Problems .................................................................................................39
7. SUMMARY ...............................................................................................................................40
8. ACKNOWLEDGEMENTS .......................................................................................................41
9. REFERENCES ..........................................................................................................................42

1. EXECUTIVE SUMMARY Although it is much safer and fuel-efficient to transport children to school in buses than in private vehicles, school buses still consume 8.2 million gallons of diesel fuel annually, and school transportation costs can account for a significant portion of resource-constrained school districts’ budgets. Additionally, children in diesel-powered school buses may be exposed to higher levels of particulates and other pollutants than children in cars. One solution to both emission and fuel concerns is use of hybrid-electric school buses, which have the potential to reduce emissions and overall life-cycle costs compared to conventional diesel buses. Hybrid-electric vehicles are available in the passenger vehicle market as well as the transit bus market and have a track record indicating both fuel economy and emissions benefits. Although the concept of hybrid-electric school buses was always promising, the technology was not commercially available in school buses before instigation of the Hybrid-Electric School Bus (HESB) Project. The HESB is a program organized by Advanced Energy and designed to bring hybrid-electric school buses to market by creating enough demand among school districts to encourage a manufacturer to invest in the development of the technology. A number of school districts in the U.S. joined the HESB project to purchase plug-in hybrid-electric school buses. Sixteen hybrid-electric school buses were purchased and are being piloted in 11 states. Two of the hybrid-electric school buses were purchased by Iowa school districts, Nevada and Sigourney. In-use fuel economy was assessed for the two hybrid school buses. Each school district also selected a control bus that runs on a route similar to the hybrid school bus. Each school recorded odometer readings and the amount of fuel used by the hybrid and control buses. Fuel consumption and other operational metrics were calculated and compared for each school district. The hybrid buses were deployed in January 2008, and data were recorded through May 2010. The control bus in Nevada was selected in February 2008, and the control bus in Sigourney was selected in November 2008. Both hybrid buses experienced problems with the battery charging systems, resulting in the battery not holding a charge. When this problem occurred, the hybrid system was switched off and the bus ran on just the internal combustion engine (ICE). This occurred for nearly six months for Nevada and seven months for Sigourney. Data for which the hybrid bus was not functioning properly or for which errors were noted were removed from the data set. Data for periods when the hybrid was not working or other problems occurred were not included in the analysis. Because temperature and weather can have impact fuel economy, data for a particular time period, these data were only included when there were observations for both the control and hybrid bus for that particular month. This limitation reduced the number of observations significantly. A total of 18 time periods were used in the analysis for Nevada, and 13 time periods were used in the analysis for Sigourney. An analysis was conducted to determine the statistical significance of the data. The data were not normally distributed, so a non-parametric alternative, the Wilcoxon signed rank test, was used to compare fuel economy for the reported time periods. Average fuel economy for all time periods for Nevada was 9.12 miles per gallon (mpg) for the HESB and 6.91 mpg for the control bus. As a result, fuel economy for the Nevada hybrid bus was 30% better than for the control bus. The
hybrid bus in Sigourney had an overall fuel economy that was 39% higher than the control bus, with an average fuel economy of 8.94 mpg for the HESB and 6.42 mpg for the control bus. Results for both school districts were statistically significant at the 95% level of significance. Data were also disaggregated and compared by season. Months in Iowa for which weather conditions were most alike were grouped into seasons. Due to a small number of observations, the results by season could not be tested for statistical significance. Fuel economy for the hybrid bus in Nevada was 32% higher than the control bus in fall, 25% higher in winter, and 31% higher in spring. Fuel economy for the hybrid bus in Sigourney was 38% higher in fall, 26% higher in winter, and 52% higher in spring. Only a small amount of data was recorded for either bus during the summer, so results for summer were not evaluated. The average cost per mile to operate both the hybrid and control buses was determined. For the hybrid buses, average kilowatt hours per mile were determined based on meter readings and the average diesel fuel and electricity use, and cost per mile was determined. The average fuel use and costs per mile were also calculated for the control buses. Maintenance costs were not included. The Nevada hybrid school bus averaged $0.38 per mile, while the control bus averaged $0.43 per mile. The Sigourney hybrid bus averaged $0.28 per mile, while the cost was $0.34 per mile for the control bus. The costs in Sigourney were lower since that district’s average diesel cost over the analysis period was lower than for Nevada. Both bus operators recorded maintenance problems with both hybrid buses experiencing problems with the charging system that required fixes and resulted in both buses running only on the ICE for several months during the analysis period. The problem may also have decreased the fuel economy because the operators felt that buses were not fully charged for the afternoon run. During the first winter, it was discovered that during periods of maximum electrical use (and minimal engine use), the idling engine did not circulate and heat enough water in its cooling system to provide adequate heat to the interior of the bus. This was unacceptable to the driver and all the riders, so the attempted solution was an auxiliary electric heater. Although the HESB experienced an unusual number of maintenance problems, which were frustrating for the school districts, the team believes that this problem is generational and can be overcome in future models. Transit buses have utilized both plug-in and conventional hybrid technologies for some time, and it does not appear that they have experienced the same challenges. As a result, it is believed that the potential exists for manufacturers to overcome the initial problems. Emissions were also evaluated. Originally, the team intended to measure emissions for both the hybrid and control buses so that they could be compared. However, the team discovered that the hybrid exhaust system has a completely different configuration than the control bus, so on-board emissions measurements were not comparable. The team finally decided to test the Nevada hybrid bus over a test route with the hybrid system on for several runs and then with only the ICE operating for several runs. Data were collected using a portable emissions monitor. Data could not be collected on the Sigourney bus because the charging system was inoperable for around 6 months when the emissions tests were taking place.

The results of the emissions analysis were inconclusive. In some cases emissions were higher for the hybrid bus, and in other cases emissions were lower for the hybrid bus. In many cases, the results were not statistically significant.
2. BACKGROUND There are over 480,000 school buses in the United States, which transport 26 million children to school and result in 5.76 billion miles of travel per year (ASBC, 2010). Transporting children in school buses is significantly safer (TRB, 2002) and more fuel-efficient than transportation in private passenger vehicles. The American School Bus Council (2010), for example, estimates that if children who customarily ride the school bus took those school trips in private vehicles, the school trips would consume 2.3 billion gallons of fuel. Although school bus travel is much safer and more fuel efficient than private vehicle transportation, school buses consume 8.2 million gallons of diesel fuel annually, and school transportation costs can account for a significant portion of resource-constrained school districts’ budgets. Additionally, school buses emit thousands of tons of pollutants per year (ASBC, 2010), and school children transported by bus spend an average of one and a half hours per day on school buses that are primarily diesel powered (USEPA, 2008; DARPA, 2000). One source measured on-board emissions in Connecticut school buses and found that particulate 2.5 (PM2.5) emissions were 5–10 times higher than at fixed-site monitoring sites (Wargo, 2002). Additionally, Adar et al. (2008) collected on-board concentrations of PM2.5 on 43 school buses during in-use driving in the State of Washington. They reported that average PM2.5 concentration levels were two times higher than level on corresponding roadways. Diesel exhaust affects children with respiratory problems, such as asthma and bronchitis. Common options to decrease school bus fuel costs and emissions include using different fuels such as biodiesel or natural gas and add-on emission control devices such as particulate filters and oxidation catalysts (Advanced Energy, 2010) Another solution to both emission and fuel concerns is the use of hybrid-electric school buses, which have the potential to reduce emissions and overall life-cycle costs compared to conventional diesel buses. Hybrids are available in the passenger vehicle market as well as in the transit bus market and have a track record indicating both fuel economy and emissions benefits. 2.1 Hybrid Performance in the Transit Market While not previously available in school buses, hybrid technology has been demonstrated in passenger vehicles and transit buses. Transit buses have used hybrid technology for some time and have overall shown significant fuel economy and emissions improvements over conventional buses. Chandler et al. (2002) conducted chassis dynamometer tests for 10 low-floor hybrid buses and 14 conventional high-floor diesel transit buses run by New York City Transit (NYCT). The buses were tested over three driving cycles: the Central Business District (CBD), New York bus cycle and the Manhattan cycle. The operating costs, efficiency, emissions, and overall performance were also compared while both types of buses were operating on similar routes. Data were collected from 1999 to 2001. Results indicate that for the CBD cycle, emissions for the hybrid transit buses were 97% lower for carbon monoxide (CO), 36% lower for nitrogen oxides (NOx), 43% lower for hydrocarbons (HC), 50% lower for particulate matter (PM), and 19% lower for carbon dioxide (CO2). Fuel
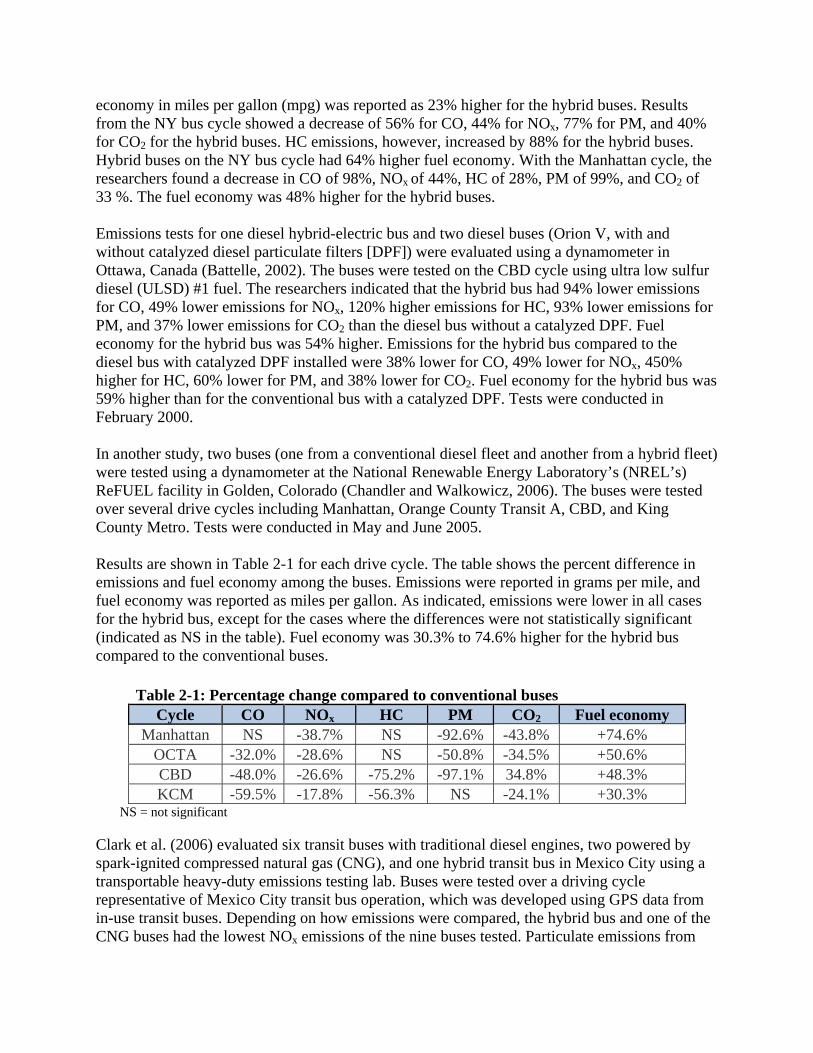
economy in miles per gallon (mpg) was reported as 23% higher for the hybrid buses. Results from the NY bus cycle showed a decrease of 56% for CO, 44% for NOx, 77% for PM, and 40% for CO2 for the hybrid buses. HC emissions, however, increased by 88% for the hybrid buses. Hybrid buses on the NY bus cycle had 64% higher fuel economy. With the Manhattan cycle, the researchers found a decrease in CO of 98%, NOx of 44%, HC of 28%, PM of 99%, and CO2 of 33 %. The fuel economy was 48% higher for the hybrid buses. Emissions tests for one diesel hybrid-electric bus and two diesel buses (Orion V, with and without catalyzed diesel particulate filters [DPF]) were evaluated using a dynamometer in Ottawa, Canada (Battelle, 2002). The buses were tested on the CBD cycle using ultra low sulfur diesel (ULSD) #1 fuel. The researchers indicated that the hybrid bus had 94% lower emissions for CO, 49% lower emissions for NOx, 120% higher emissions for HC, 93% lower emissions for PM, and 37% lower emissions for CO2 than the diesel bus without a catalyzed DPF. Fuel economy for the hybrid bus was 54% higher. Emissions for the hybrid bus compared to the diesel bus with catalyzed DPF installed were 38% lower for CO, 49% lower for NOx, 450% higher for HC, 60% lower for PM, and 38% lower for CO2. Fuel economy for the hybrid bus was 59% higher than for the conventional bus with a catalyzed DPF. Tests were conducted in February 2000. In another study, two buses (one from a conventional diesel fleet and another from a hybrid fleet) were tested using a dynamometer at the National Renewable Energy Laboratory’s (NREL’s) ReFUEL facility in Golden, Colorado (Chandler and Walkowicz, 2006). The buses were tested over several drive cycles including Manhattan, Orange County Transit A, CBD, and King County Metro. Tests were conducted in May and June 2005. Results are shown in Table 2-1 for each drive cycle. The table shows the percent difference in emissions and fuel economy among the buses. Emissions were reported in grams per mile, and fuel economy was reported as miles per gallon. As indicated, emissions were lower in all cases for the hybrid bus, except for the cases where the differences were not statistically significant (indicated as NS in the table). Fuel economy was 30.3% to 74.6% higher for the hybrid bus compared to the conventional buses.
Table 2-1: Percentage change compared to conventional buses
Cycle CO NOx HC PM CO2 Fuel economy Manhattan NS -38.7% NS -92.6% -43.8% +74.6%
OCTA -32.0% -28.6% NS -50.8% -34.5% +50.6% CBD -48.0% -26.6% -75.2% -97.1% 34.8% +48.3% KCM -59.5% -17.8% -56.3% NS -24.1% +30.3%
NS = not significant
Clark et al. (2006) evaluated six transit buses with traditional diesel engines, two powered by spark-ignited compressed natural gas (CNG), and one hybrid transit bus in Mexico City using a transportable heavy-duty emissions testing lab. Buses were tested over a driving cycle representative of Mexico City transit bus operation, which was developed using GPS data from in-use transit buses. Depending on how emissions were compared, the hybrid bus and one of the CNG buses had the lowest NOx emissions of the nine buses tested. Particulate emissions from
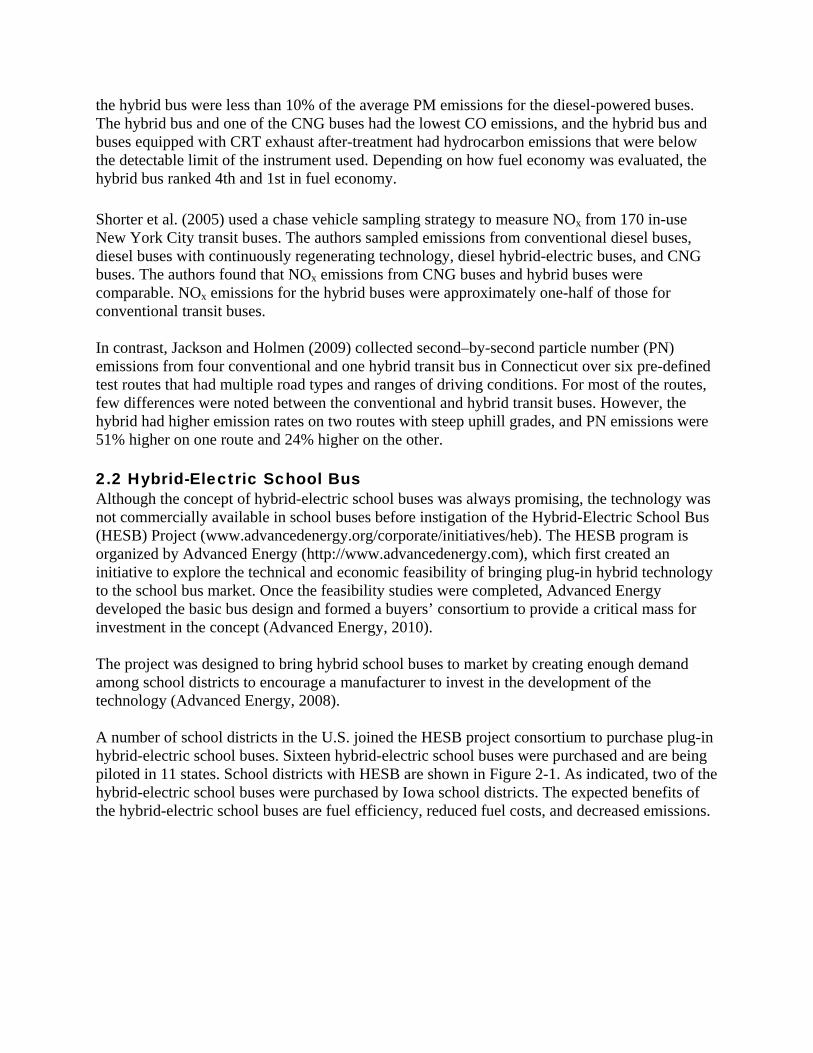
the hybrid bus were less than 10% of the average PM emissions for the diesel-powered buses. The hybrid bus and one of the CNG buses had the lowest CO emissions, and the hybrid bus and buses equipped with CRT exhaust after-treatment had hydrocarbon emissions that were below the detectable limit of the instrument used. Depending on how fuel economy was evaluated, the hybrid bus ranked 4th and 1st in fuel economy. Shorter et al. (2005) used a chase vehicle sampling strategy to measure NOx from 170 in-use New York City transit buses. The authors sampled emissions from conventional diesel buses, diesel buses with continuously regenerating technology, diesel hybrid-electric buses, and CNG buses. The authors found that NOx emissions from CNG buses and hybrid buses were comparable. NOx emissions for the hybrid buses were approximately one-half of those for conventional transit buses. In contrast, Jackson and Holmen (2009) collected second–by-second particle number (PN) emissions from four conventional and one hybrid transit bus in Connecticut over six pre-defined test routes that had multiple road types and ranges of driving conditions. For most of the routes, few differences were noted between the conventional and hybrid transit buses. However, the hybrid had higher emission rates on two routes with steep uphill grades, and PN emissions were 51% higher on one route and 24% higher on the other. 2.2 Hybrid-Electric School Bus Although the concept of hybrid-electric school buses was always promising, the technology was not commercially available in school buses before instigation of the Hybrid-Electric School Bus (HESB) Project (www.advancedenergy.org/corporate/initiatives/heb). The HESB program is organized by Advanced Energy (http://www.advancedenergy.com), which first created an initiative to explore the technical and economic feasibility of bringing plug-in hybrid technology to the school bus market. Once the feasibility studies were completed, Advanced Energy developed the basic bus design and formed a buyers’ consortium to provide a critical mass for investment in the concept (Advanced Energy, 2010). The project was designed to bring hybrid school buses to market by creating enough demand among school districts to encourage a manufacturer to invest in the development of the technology (Advanced Energy, 2008). A number of school districts in the U.S. joined the HESB project consortium to purchase plug-in hybrid-electric school buses. Sixteen hybrid-electric school buses were purchased and are being piloted in 11 states. School districts with HESB are shown in Figure 2-1. As indicated, two of the hybrid-electric school buses were purchased by Iowa school districts. The expected benefits of the hybrid-electric school buses are fuel efficiency, reduced fuel costs, and decreased emissions.

Figure 2-1: Location of school districts with plug-in hybrid-electric school buses (Advanced Energy 2010) The hybrid-electric school buses were manufactured by IC Bus, which was partnered with Enova (www.enovasystems.com). The school bus body is the same as that of a standard school bus. The plug-in hybrid-electric school bus specifications include the following (Advanced Energy, 2010):
• 6.4 L 210 hp diesel • Hybrid system with plug-in capability • Post-transmission parallel drive • 80kW electric motor • 35 kWh Li-ion phosphate battery pack
Both of the Iowa buses are 2009 International 65-passenger buses with an International MaxForce (V8) 6.4 L engine with an Allison automatic 2000 transmission. The hybrid function can be turned off so that the bus runs on the internal combustion engine (ICE) only. 2.3 Project Scope and Objectives Two school districts in Iowa participated in the HESB project. The Institute for Transportation (InTrans) at Iowa State University (ISU) monitored and evaluated bus performance for the two Iowa HESBs 2008 to 2010. The original objectives of the project were to monitor the buses and evaluate the following:
• Operating costs of HESB school buses compared to conventional buses • Emissions of the HESB buses compared to conventional buses • Fuel economy of the HESB buses compared to conventional buses • Other benefits and drawbacks of the hybrid system • Generational benefits and drawbacks (i.e., problems that can be overcome in future
models) versus systematic problems inherent to the system
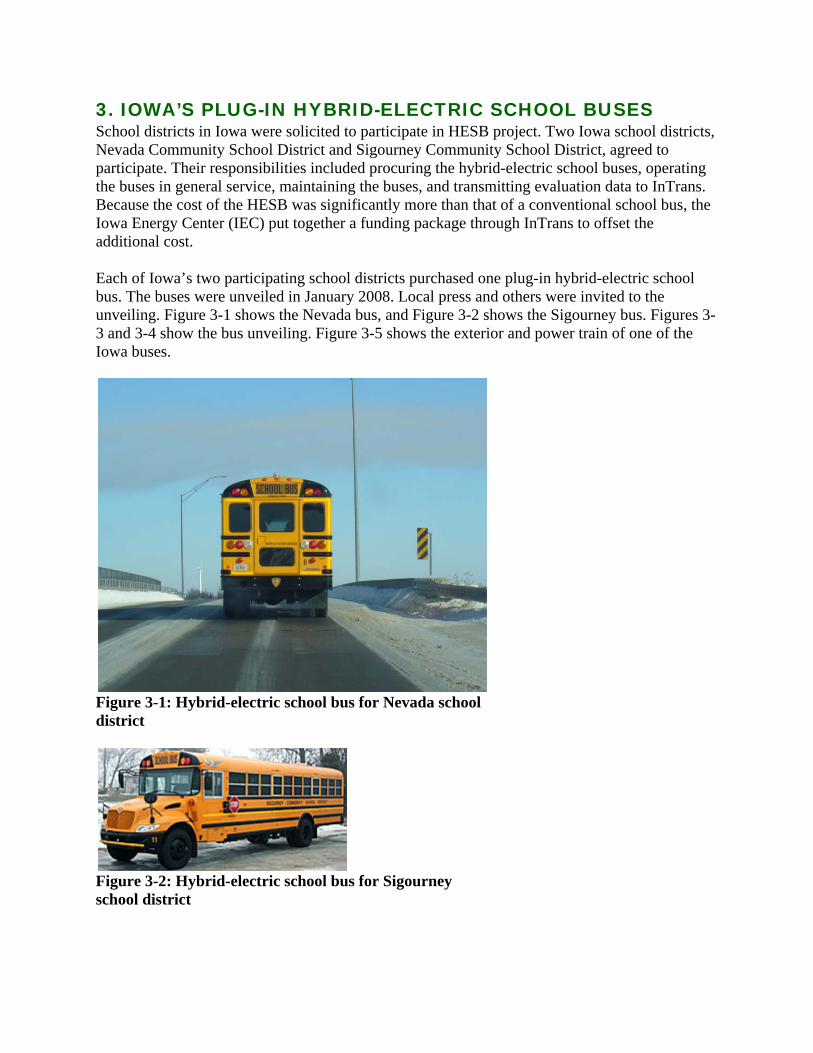
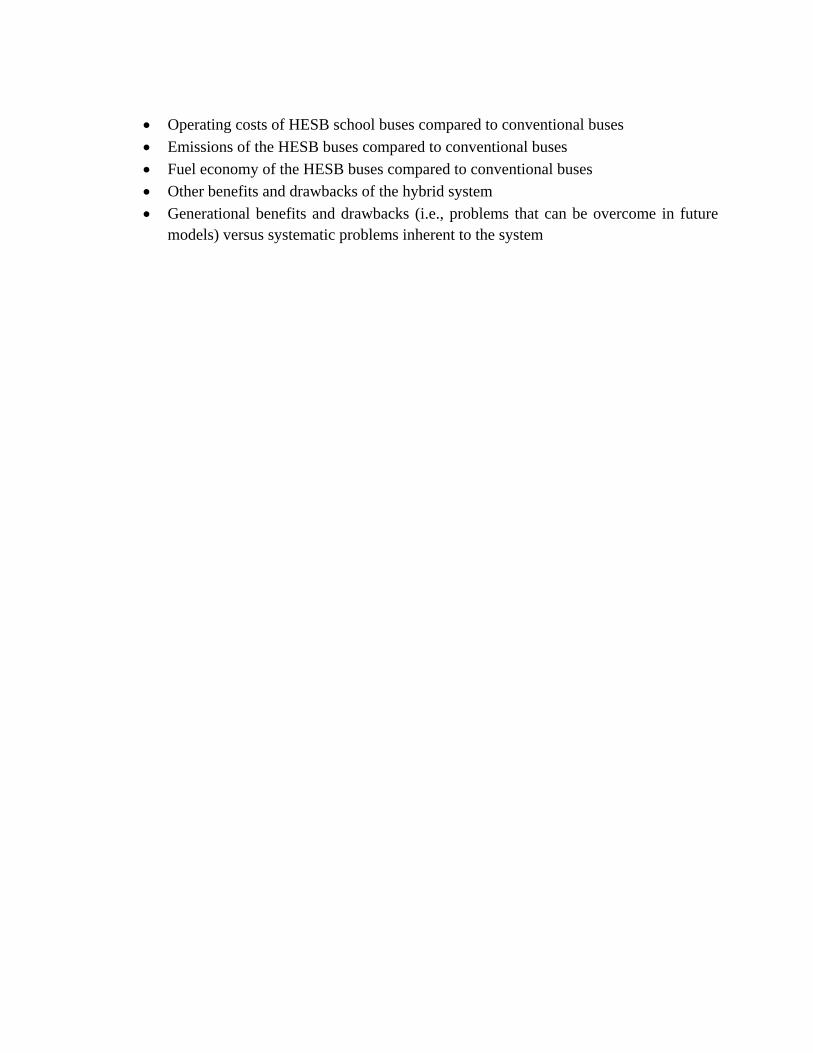
3. IOWA’S PLUG-IN HYBRID-ELECTRIC SCHOOL BUSES School districts in Iowa were solicited to participate in HESB project. Two Iowa school districts, Nevada Community School District and Sigourney Community School District, agreed to participate. Their responsibilities included procuring the hybrid-electric school buses, operating the buses in general service, maintaining the buses, and transmitting evaluation data to InTrans. Because the cost of the HESB was significantly more than that of a conventional school bus, the Iowa Energy Center (IEC) put together a funding package through InTrans to offset the additional cost. Each of Iowa’s two participating school districts purchased one plug-in hybrid-electric school bus. The buses were unveiled in January 2008. Local press and others were invited to the unveiling. Figure 3-1 shows the Nevada bus, and Figure 3-2 shows the Sigourney bus. Figures 3-3 and 3-4 show the bus unveiling. Figure 3-5 shows the exterior and power train of one of the Iowa buses.
Figure 3-1: Hybrid-electric school bus for Nevada school district
Figure 3-2: Hybrid-electric school bus for Sigourney school district
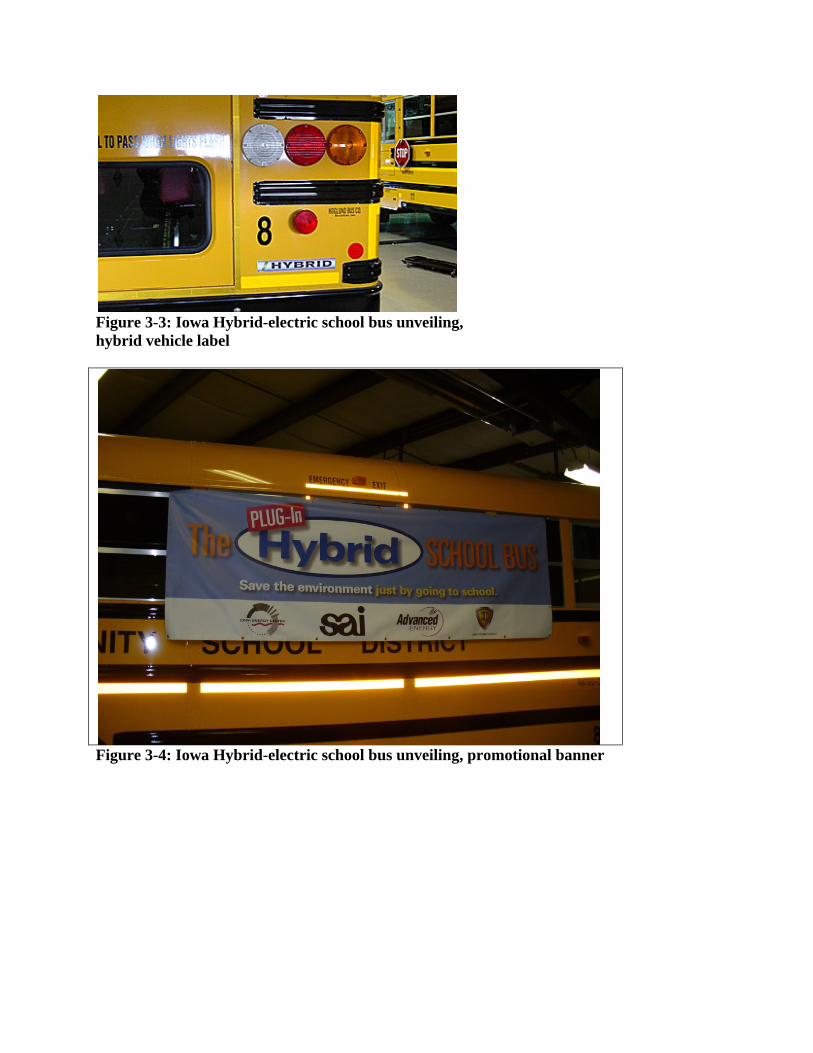
Figure 3-3: Iowa Hybrid-electric school bus unveiling, hybrid vehicle label
Figure 3-4: Iowa Hybrid-electric school bus unveiling, promotional banner

Figure 3-5: Power train for one of Iowa’s hybrid-electric school buses 3.1 Evaluation Plan Because the hybrid technology was new to the school bus market, part of the HESB project plan was to evaluate the hybrid buses. InTrans was funded by the Iowa Energy Center to conduct the evaluation for the two Iowa schools. As part of the evaluation, each school district was asked to select a control bus that was as similar as possible to the plug-in hybrid-electric school bus. The specifications for the hybrid school buses are provided in Section 2.2. The Nevada control school bus is a 2009 Bluebird 65-passenger bus with a Cummins ISB07 engine (220 HP, Allison automatic GEN4, 2500PTS, TC 221). The Sigourney control bus is a 2005 Bluebird, 65-passenger with a Caterpillar C-7 (V6) engine (210 HP) with an Allison automatic 2000 transmission. The school districts were asked to interchange the control bus with the HESB at regular intervals to reduce the variability between the hybrid bus and the control bus. The widest sources of variability in emissions and fuel economy would come from both the route and the driver of the vehicle. By keeping a specific driver on a specific route and interchanging the buses biweekly, the level of variability could be minimized. However, both school districts were reluctant to interchange the buses. Districts typically keep the same bus and driver on a route for the entire school year. School children are taught to

recognize the bus number and driver, and the districts felt that the children would be confused by having changes in bus and driver. Districts were also concerned that parents would complain about the lack of consistency. As a result, the control bus and HESB were assigned to similar routes within each district, and the buses were not interchanged. The evaluation program included reporting several variables regarding the operation of each school bus so that various metrics could be compared between the two types of buses. Each time a bus was refueled, school districts were asked to record the following:
• Date • Odometer reading • Gallons of fuel added • Fuel cost • kWh reading • Maintenance (type and cost) • Any problems encountered
School districts were asked to report fuel use and other items regularly through a webpage maintained by Advanced Energy. Schools regularly record this information for their own purposes. However, in the beginning of the analysis period, it was difficult to get the schools to enter the information at the Advanced Energy webpage. As a result, the project team began calling the school districts on a regular basis to obtain the desired information, and then the team entered the data into the webpage. This approach yielded much more consistent data updates. The school districts typically reported data from every two weeks to once a month. They reported the date, odometer reading, fuel used over the reporting period, fuel cost, and a kilowatt reading for the hybrid buses. Major maintenance issues and other notes were also recorded. Initially, neither Iowa school district had a separate electric meter for the hybrid bus, so much less electricity use information was available than for fuel use. Additionally, although the districts did a good job keeping track of major problems with the buses, they did not regularly report minor maintenance, such as adding oil. As a result, it was not possible to evaluate total maintenance per mile, as was originally desired. 3.2 Description of Buses in Nevada The Nevada School District is located in Nevada, Iowa, about 10 miles west of Ames, Iowa. The district has about 13 operational buses and transports around 828 school children per day. The district uses a 20% biodiesel blend. The blend amount varies, but the same fuel was used in both the hybrid and control buses. The Nevada school district started collecting data for a control bus in February 2008. The bus routes for the hybrid and regular school bus are shown in Figures 3-6 and 3-7.
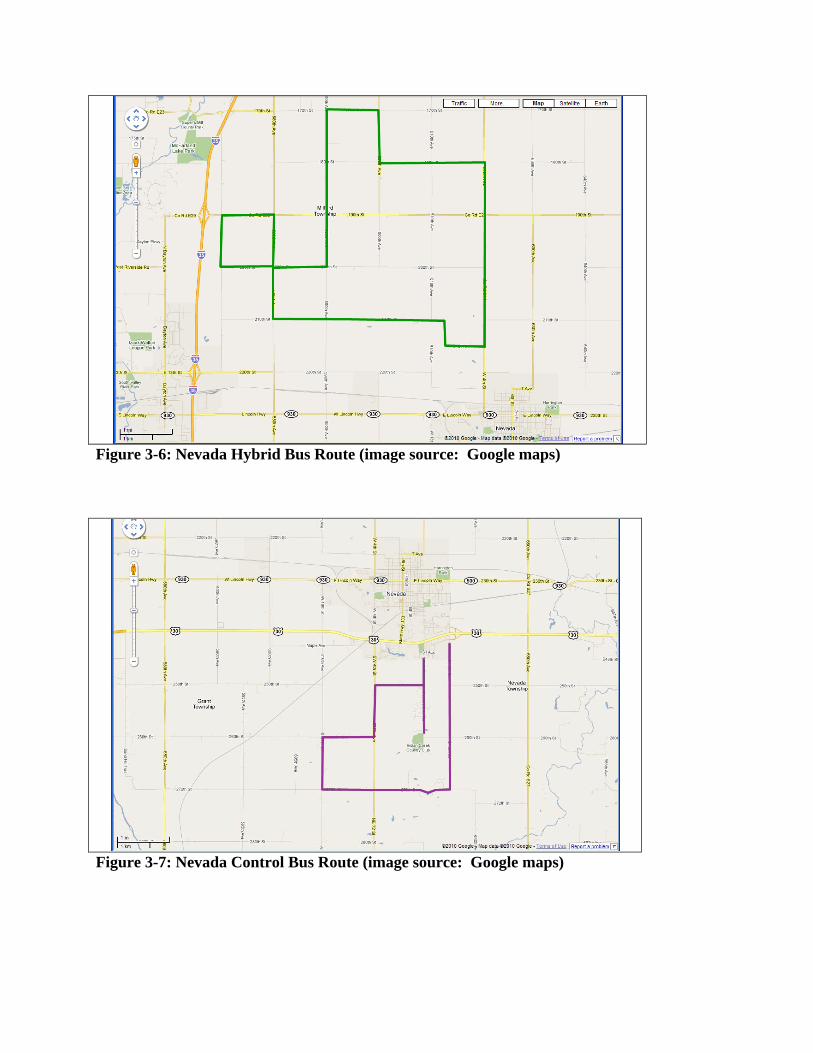
Figure 3-6: Nevada Hybrid Bus Route (image source: Google maps)
Figure 3-7: Nevada Control Bus Route (image source: Google maps)
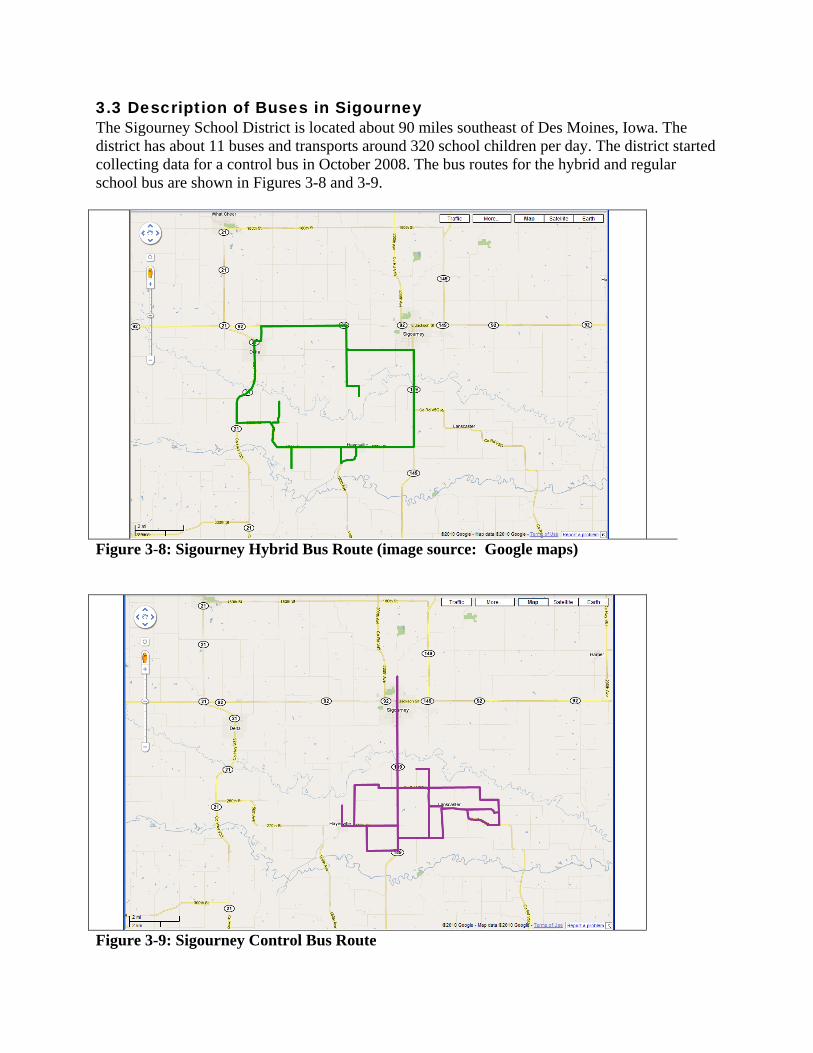
3.3 Description of Buses in Sigourney The Sigourney School District is located about 90 miles southeast of Des Moines, Iowa. The district has about 11 buses and transports around 320 school children per day. The district started collecting data for a control bus in October 2008. The bus routes for the hybrid and regular school bus are shown in Figures 3-8 and 3-9.
Figure 3-8: Sigourney Hybrid Bus Route (image source: Google maps)
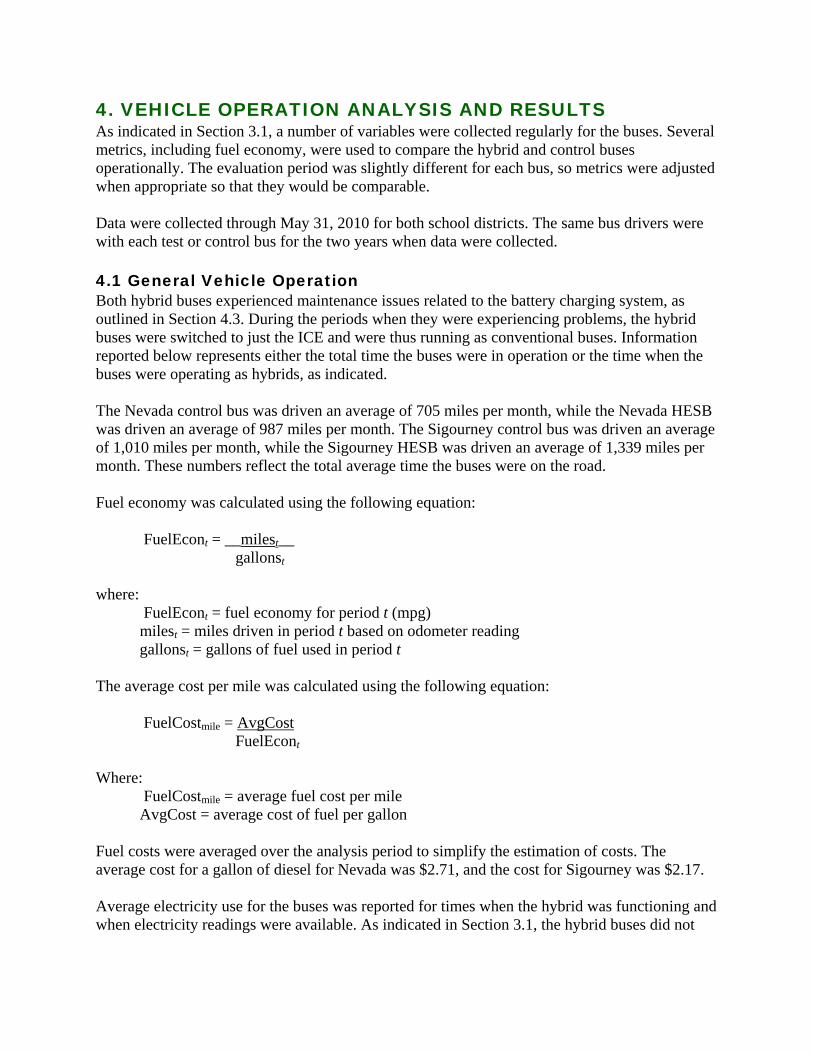
Figure 3-9: Sigourney Control Bus Route
4. VEHICLE OPERATION ANALYSIS AND RESULTS As indicated in Section 3.1, a number of variables were collected regularly for the buses. Several metrics, including fuel economy, were used to compare the hybrid and control buses operationally. The evaluation period was slightly different for each bus, so metrics were adjusted when appropriate so that they would be comparable. Data were collected through May 31, 2010 for both school districts. The same bus drivers were with each test or control bus for the two years when data were collected. 4.1 General Vehicle Operation Both hybrid buses experienced maintenance issues related to the battery charging system, as outlined in Section 4.3. During the periods when they were experiencing problems, the hybrid buses were switched to just the ICE and were thus running as conventional buses. Information reported below represents either the total time the buses were in operation or the time when the buses were operating as hybrids, as indicated. The Nevada control bus was driven an average of 705 miles per month, while the Nevada HESB was driven an average of 987 miles per month. The Sigourney control bus was driven an average of 1,010 miles per month, while the Sigourney HESB was driven an average of 1,339 miles per month. These numbers reflect the total average time the buses were on the road. Fuel economy was calculated using the following equation: FuelEcont = __milest__ gallonst where: FuelEcont = fuel economy for period t (mpg) milest = miles driven in period t based on odometer reading gallonst = gallons of fuel used in period t The average cost per mile was calculated using the following equation: FuelCostmile = AvgCost FuelEcont Where: FuelCostmile = average fuel cost per mile AvgCost = average cost of fuel per gallon Fuel costs were averaged over the analysis period to simplify the estimation of costs. The average cost for a gallon of diesel for Nevada was $2.71, and the cost for Sigourney was $2.17. Average electricity use for the buses was reported for times when the hybrid was functioning and when electricity readings were available. As indicated in Section 3.1, the hybrid buses did not

have a dedicated electricity meter available when the buses were initially placed in operation. As a result, data are summarized for periods when the meters were functioning. Electric use per mile was calculated using the following equation: KWHmile = KWHt
milest where: KWHmile = kilowatt hours per mile KWHt = kilowatt use for period t Cost per mile for electricity use was determined using the following equation: ElecCostmile = KWHmile x AvgCostkwh Where: ElecCostmile = average cost of electricity per mile AvgCostkwh = average cost per kilowatt hour MidAmerican Energy (2010), Iowa’s largest utility, reported that the average cost per kilowatt-hour is $0.060 for retail. This was the value used to calculate electricity cost per mile because the school bus garages could not obtain the actual cost paid by the districts for electricity. Table 4-1: Operational Metrics for Iowa Buses Avg fuel
economy (mpg)
Avg fuel cost ($/gal)
Avg fuel cost per mile
Avg kwh per mile
Avg cost per kwh
Avg kwh cost per mile
Total avg cost per mile
Nevada HESB 8.23 $2.71 $0.33 0.847 $0.06 $0.051 $0.38
Nevada Control 6.35 $2.71 $0.43 NA NA NA $0.43
Sigourney HESB 8.94 $2.17 $0.24 0.599 $0.06 $0.036 $0.28
Sigourney Control 6.42 $2.17 $0.34 NA NA NA $0.34
As shown, the cost to operate the hybrid bus in Nevada was 38 cents per mile while the control bus cost 43 cents per mile, making the hybrid bus 13% less expensive to operate. The hybrid bus in Sigourney was 28 cents per mile while the control bus was 34 cents per mile, making the hybrid bus 21% less expensive to operate. None of the maintenance costs directly related to the hybrid buses were paid by the school, so this cost was not factored in. Additionally, as indicated, regular maintenance was not recorded, so differences in regular maintenance could not be accounted for either. 4.2 Fuel Economy The hybrid buses were in use and evaluated from January 2008 to May 2010. The Nevada control bus was selected in January 2008, and data were recorded until May 2010. The control

bus in Sigourney was added in October 2008. The buses were typically not used in the summer, so data were not available from May to August each year during the analysis period. The fuel and mileage data and school district notes were examined to determine whether there were any problems with the data that needed to be addressed. In several cases, the battery charging system on the hybrid buses did not hold a charge. This occurred for nearly six months for Nevada and seven months for Sigourney. In other cases, the schools indicated that data were uncertain. (For instance, one bus was in the shop for several days, and the school district did not know whether additional fuel had been added). Data for which the hybrid bus was not functioning properly or errors were noted were removed from the data set. Bus information was provided during the summer when school was not in session if the buses were used during that time. However, the buses were only used a limited amount during the summer. Once erroneous data were removed, it was noted that a number of time periods only had data for either the control bus or the HESB. Because temperature and weather conditions impact bus fuel economy, it was important not to have more observations reported for a particular bus during one time period, as this could bias results. Consequently, data for a particular time period were only included in the analysis when there were observations for both the control and hybrid bus. Unfortunately, this reduced the number of observations significantly. A total of 18 time periods were used in the analysis for Nevada, and 13 time periods were used in the analysis for Sigourney. Simple statistics for the hybrid and conventional school buses are shown in Figure 4-1 for Nevada and in Figure 4-2 for Sigourney. Months when weather conditions were most alike in Iowa were grouped into seasons. Data for the months included in each season were aggregated for the simple statistics. Seasons included the following groupings:
Winter—December, January, February Spring —March, April, May Summer—June, July, August Fall—September, October, November
Average fuel economy is shown in Figures 4-1 and 4-2 by season. As shown, some variation occurred by season. However, data were not sufficient to test assumptions using a statistical test. In Nevada, the hybrid bus had an overall fuel economy 30% higher than that of the conventional bus. A total of 18 observations were available for each Nevada bus overall, with 5 observations for fall, 5 observations for winter, and 8 observations for spring. Fuel economy for the hybrid was 32% higher during fall than for the control bus, 25% higher during winter, and 31% higher during spring. The buses were used on a limited basis for summer, so no data are presented for the summer period. In Sigourney, the hybrid bus had an overall fuel economy 39% higher than that of the control bus. A total of 13 observations were available for each bus overall, with 4 observations for fall, 4 observations for winter, and 5 observations for spring. Fuel economy for the hybrid bus was 38% higher during fall, 26% higher during winter, and 52% higher during spring. No data were recorded for either bus during the summer.
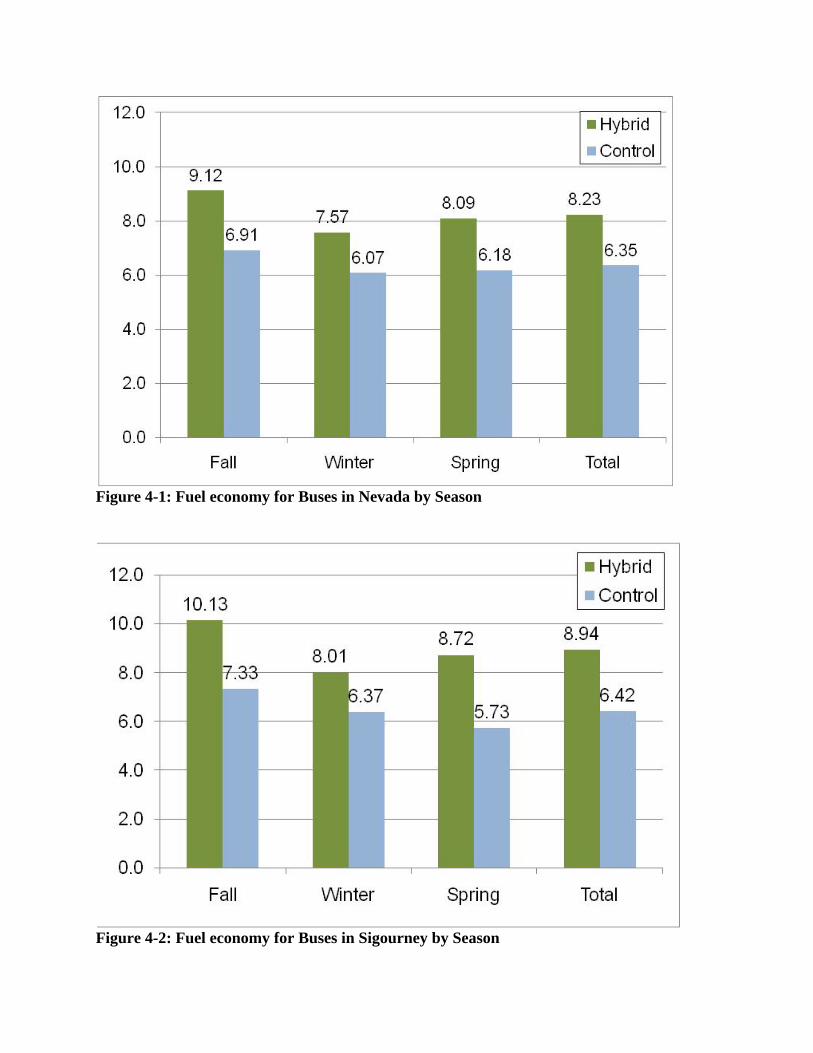
Figure 4-1: Fuel economy for Buses in Nevada by Season
Figure 4-2: Fuel economy for Buses in Sigourney by Season

An analysis was conducted to determine statistical significance. Data were evaluated to determine whether they were normally distributed. An assessment of the data indicated that the fuel economy data were not normally distributed. The data were also tested for autocorrelation to determine whether the samples were independent, and it was determined that autocorrelation was not a problem. Because the data were not normally distributed, a non-parametric alternative to the t-test was used to compare fuel economy for the reported time periods. The Wilcoxon signed rank test compares the magnitude and sign of the rank between pairs of measurements. Results for both school districts indicate that the hybrid bus overall had better fuel economy than the control bus and that the differences are statistically significant (for Nevada, p = 0; for Sigourney, p = 0.0003). 4.3 Maintenance In addition to the usual maintenance problems that school buses often have, the hybrid buses presented several new challenges to the local districts and to the development partners to find workable solutions. The most notable in Iowa are described below. Recharging system. The initial charging connections and power cords furnished with the buses proved to be inadequate for the function for which they were needed. After both districts’ chargers burned (or shorted) out, all were replaced with heavier duty cords and more positive (locking) connections. In addition, the batteries required about eight hours to achieve a full charge, so the intermediate charge between the typical morning and afternoon routes was insufficient to provide full electrical power in the afternoon. This resulted in the electrical mode being less capable of powering the buses in the afternoon than in the morning. This problem was much worse during the winter (cold weather) months, when the buses had to be brought in from the morning routes and warmed up before charging could begin, as the districts reported that the batteries would not take a charge without that warming. In winter, a shorter time was therefore left for the midday charge, meaning less power to assist the engine. The cold weather also reduced the power that the batteries could sustain while on the route. Further, both districts had multiple problems throughout this period with the battery cable ends corroding, and this lessened the efficiency of the recharge until it became so bad that the batteries simply would not recharge at all. Frequent cleaning of the terminal ends was tried, but it seemed difficult to stay ahead of the problem. Replacement of all the ends was performed on one bus for a longer lasting remedy, but additional corrosion problems occurred in another few months. Heating system. During periods of maximum electrical use (and minimal engine use), the idling engine did not circulate and heat enough water in its cooling system to provide adequate heat to the interior of the bus. This was unacceptable to the driver and the riders, so the attempted solution was an auxiliary electric heater. Although this greatly improved the amount of interior heat, the interior temperature still did not match that of a conventional bus. Tire wear. Although neither district had enough miles on their buses to ascertain the degree of this problem, both were concerned that the additional weight of the batteries would shorten the life of the tires. However, both districts also said that normal tire wear is 40,000–45,000 miles at best because the buses operate mostly on gravel and rock roads.

5. EMISSIONS ANALYSIS AND RESULTS Emissions were evaluated using a portable emissions monitoring system (PEMS). The team originally intended to measure and compare emissions for the control buses and hybrid buses. However, the team was only able to measure emissions for the hybrid bus in Nevada due to numerous issues. First, the team was not able to evaluate the hybrid bus in Sigourney because the charging system was not functioning for almost six months (from November 2009 through April 2010), which coincided with the time that the team had planned to evaluate the buses for emissions. As a result, the Sigourney bus had to be dropped from the emissions test. The team then planned to measure emissions for the hybrid bus and control bus in Nevada over a specified test route, but the team discovered that the hybrid bus has a completely different tailpipe configuration than a conventional school bus. This different configuration impeded emissions testing. The hybrid bus tailpipe has an extension pipe that fits over the regular tailpipe about 10 feet from the point where exhaust normally exits the bus. This tailpipe configuration is shown in Figures 5-1 and 5-2. The tailpipe has a larger diameter than a normal school bus’ tailpipe and has air inlet vents at the extension pipe.
Figure 5-1: Tailpipe Configuration on Hybrid School Bus
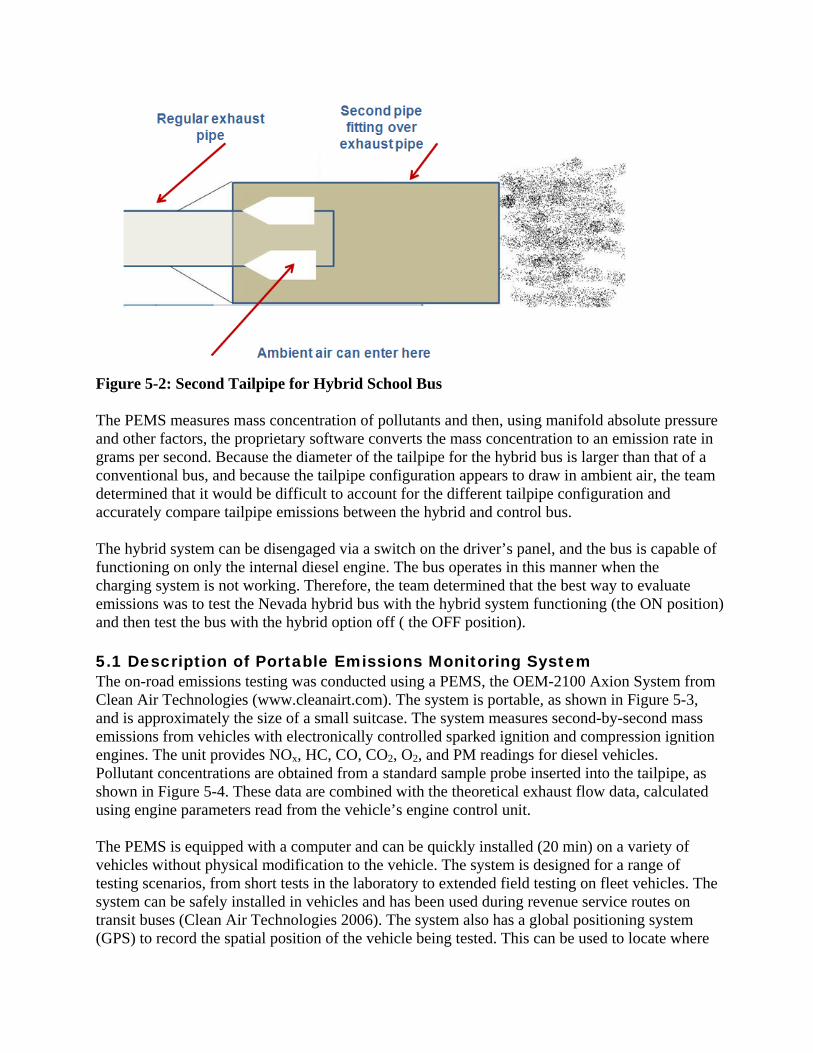
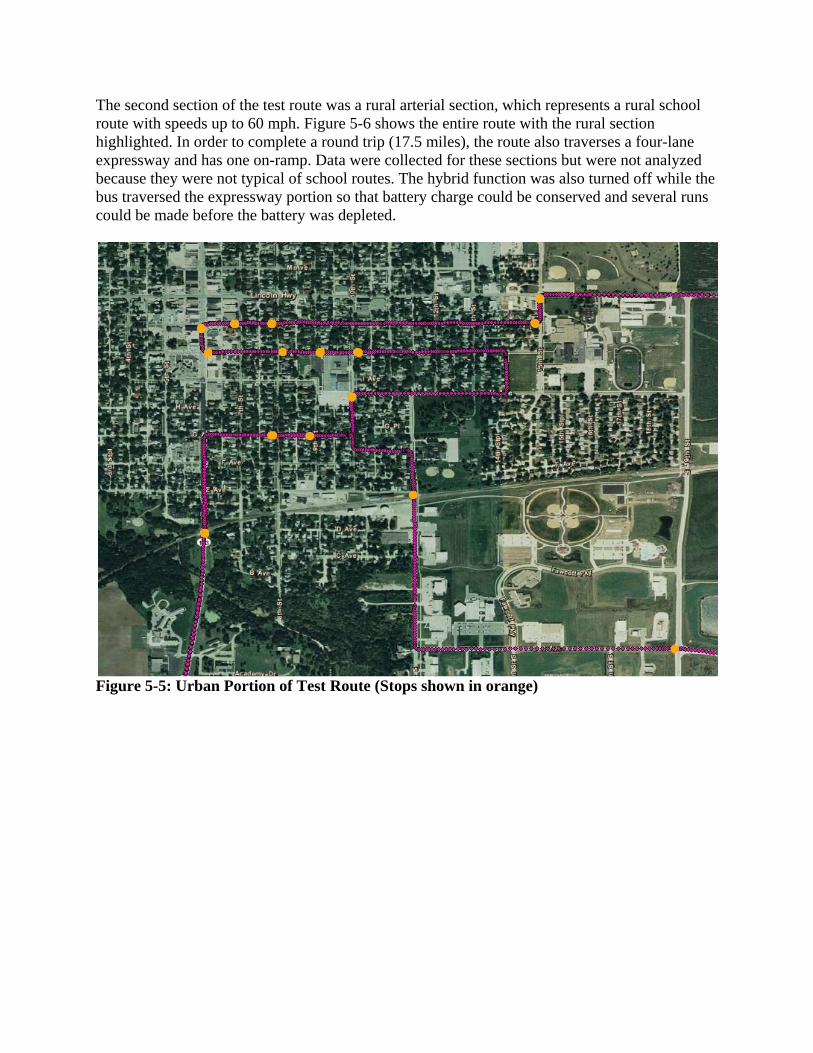
Figure 5-2: Second Tailpipe for Hybrid School Bus The PEMS measures mass concentration of pollutants and then, using manifold absolute pressure and other factors, the proprietary software converts the mass concentration to an emission rate in grams per second. Because the diameter of the tailpipe for the hybrid bus is larger than that of a conventional bus, and because the tailpipe configuration appears to draw in ambient air, the team determined that it would be difficult to account for the different tailpipe configuration and accurately compare tailpipe emissions between the hybrid and control bus. The hybrid system can be disengaged via a switch on the driver’s panel, and the bus is capable of functioning on only the internal diesel engine. The bus operates in this manner when the charging system is not working. Therefore, the team determined that the best way to evaluate emissions was to test the Nevada hybrid bus with the hybrid system functioning (the ON position) and then test the bus with the hybrid option off ( the OFF position). 5.1 Description of Portable Emissions Monitoring System The on-road emissions testing was conducted using a PEMS, the OEM-2100 Axion System from Clean Air Technologies (www.cleanairt.com). The system is portable, as shown in Figure 5-3, and is approximately the size of a small suitcase. The system measures second-by-second mass emissions from vehicles with electronically controlled sparked ignition and compression ignition engines. The unit provides NOx, HC, CO, CO2, O2, and PM readings for diesel vehicles. Pollutant concentrations are obtained from a standard sample probe inserted into the tailpipe, as shown in Figure 5-4. These data are combined with the theoretical exhaust flow data, calculated using engine parameters read from the vehicle’s engine control unit.
The PEMS is equipped with a computer and can be quickly installed (20 min) on a variety of vehicles without physical modification to the vehicle. The system is designed for a range of testing scenarios, from short tests in the laboratory to extended field testing on fleet vehicles. The system can be safely installed in vehicles and has been used during revenue service routes on transit buses (Clean Air Technologies 2006). The system also has a global positioning system (GPS) to record the spatial position of the vehicle being tested. This can be used to locate where

the vehicle was on the roadway during testing. Information about the roadway, such as grade, can be linked to emissions production. The equipment to extract engine data is used to record characteristics such as speed, acceleration, and throttle position. These characteristics have also been shown to influence vehicle emissions and are key components in assessing emission productions. HC, CO, CO2, O2, and NOx concentrations are sampled using a dual five-gas analyzer system. The analyzers self-calibrate in the field using ambient air as a benchmark. Particulate matter concentration is quantified using a laser light-scattering measurement subsystem. Speed, engine revolutions per minute (RPM), intake air pressure (manifold absolute pressure), and other engine operating parameters are collected to determine intake air mass flow. Using intake air mass flow, the known composition of intake air, measured composition of exhaust, and user-supplied composition of fuel, a second-by-second exhaust mass flow is calculated. The exhaust mass flow is multiplied by the concentrations of different pollutants to provide emissions in grams per second (Clean Air 2007). The system synchronizes the different data streams (second-by-second engine data, emissions, and GPS). Frey and Rouphail (2003) have conducted a number of on-road emissions tests using a similar system from Clean Air Technologies, and they indicate that the precision and accuracy of the equipment is comparable to that of laboratory instrumentation. They indicate that CO and CO2 are accurate to within 10% when compared to the measurement of average emission rates for dynamometer tests. They also indicate that NO is measured using an electrochemical cell in the PEMS and report that NO (reported as equivalent NO2) was accurate to ± 10%. PM is measured using a light-scattering method, which, according to Frey, is analogous to opacity and, as such, can be used to make relative comparisons of PM. The researchers caution, however, that it cannot be used to characterize the absolute magnitude of PM emissions (Frey et al. 2008). The equipment was calibrated each evening using the procedure outlined in the equipment manual (Clean Air 2007).
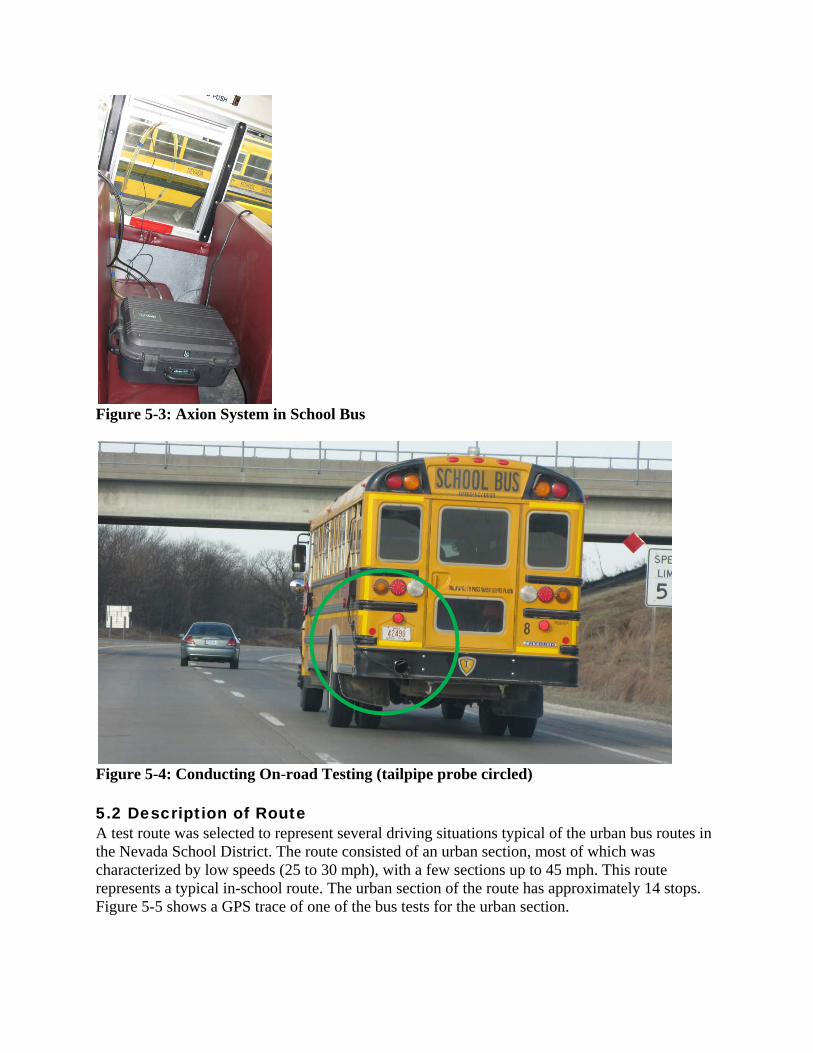
Figure 5-3: Axion System in School Bus
Figure 5-4: Conducting On-road Testing (tailpipe probe circled) 5.2 Description of Route A test route was selected to represent several driving situations typical of the urban bus routes in the Nevada School District. The route consisted of an urban section, most of which was characterized by low speeds (25 to 30 mph), with a few sections up to 45 mph. This route represents a typical in-school route. The urban section of the route has approximately 14 stops. Figure 5-5 shows a GPS trace of one of the bus tests for the urban section.
The second section of the test route was a rural arterial section, which represents a rural school route with speeds up to 60 mph. Figure 5-6 shows the entire route with the rural section highlighted. In order to complete a round trip (17.5 miles), the route also traverses a four-lane expressway and has one on-ramp. Data were collected for these sections but were not analyzed because they were not typical of school routes. The hybrid function was also turned off while the bus traversed the expressway portion so that battery charge could be conserved and several runs could be made before the battery was depleted.
Figure 5-5: Urban Portion of Test Route (Stops shown in orange)
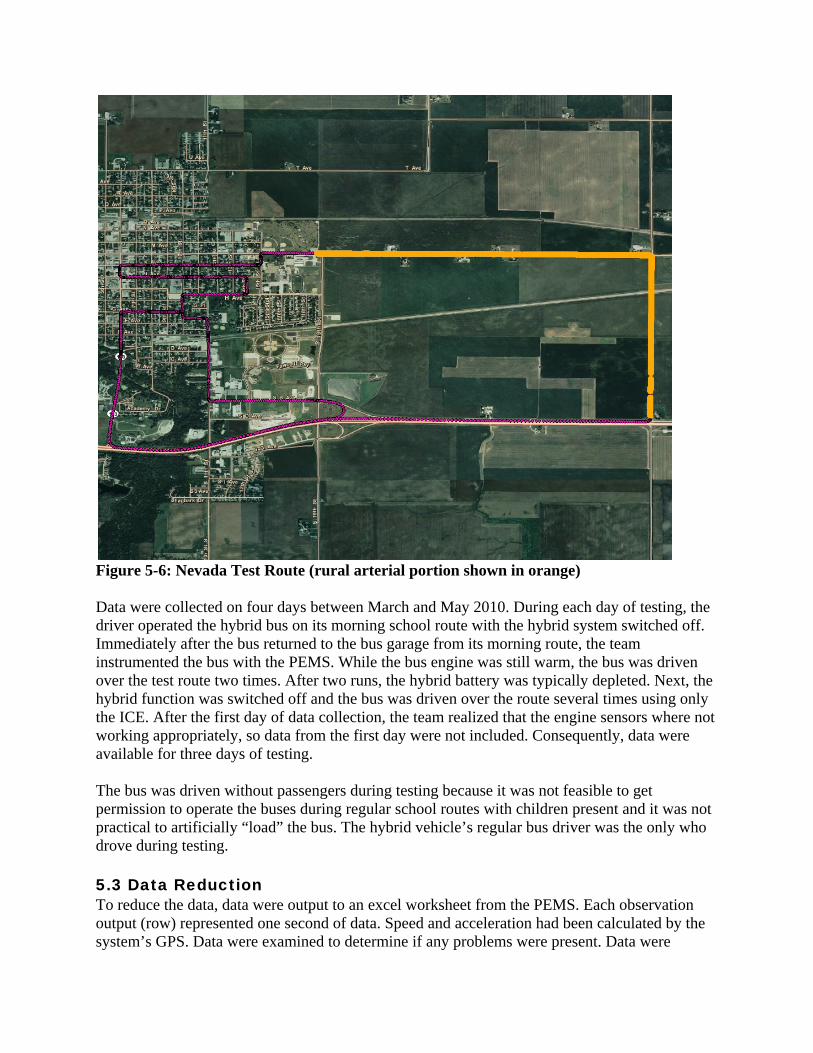
Figure 5-6: Nevada Test Route (rural arterial portion shown in orange) Data were collected on four days between March and May 2010. During each day of testing, the driver operated the hybrid bus on its morning school route with the hybrid system switched off. Immediately after the bus returned to the bus garage from its morning route, the team instrumented the bus with the PEMS. While the bus engine was still warm, the bus was driven over the test route two times. After two runs, the hybrid battery was typically depleted. Next, the hybrid function was switched off and the bus was driven over the route several times using only the ICE. After the first day of data collection, the team realized that the engine sensors where not working appropriately, so data from the first day were not included. Consequently, data were available for three days of testing. The bus was driven without passengers during testing because it was not feasible to get permission to operate the buses during regular school routes with children present and it was not practical to artificially “load” the bus. The hybrid vehicle’s regular bus driver was the only who drove during testing. 5.3 Data Reduction To reduce the data, data were output to an excel worksheet from the PEMS. Each observation output (row) represented one second of data. Speed and acceleration had been calculated by the system’s GPS. Data were examined to determine if any problems were present. Data were

disaggregated by whether the hybrid was on or off. The data were also mapped in a GIS, and data were coded by road type (1 = urban section, 2 = rural arterial section, 3 = rural expressway). Data were then disaggregated by roadway type. As indicated, only the urban and rural arterial sections were evaluated. Emissions are highly correlated to engine load. A number of studies have evaluated emissions using vehicle-specific power (VSP), which is a surrogate measure for engine load. VSP is generally defined as power per unit mass of the vehicle and is a function of vehicle speed, road grade, and acceleration. Haibo et al. (2006) derived an equation for VSP for transit buses that have a curb weight of 12 metric tons, as shown in Figure 5-1. School bus curb weight is similar, so the equation was utilized to calculate VSP.
300021.0)092.0)sin(( VgradegaVVSP ×++×+×= (5-1) where:
VSP = vehicle-specific power (kW/ton) V = the speed at which the vehicle is traveling (m/s) a = the acceleration of the vehicle (m/s2) grade = road grade (decimal fraction) Data for each test section were further disaggregated into bins by VSP, as shown in Table 5-1. The ranges used were similar to those defined by Frey et al. (2006). Table 5-1: Bins Used to Evaluate School Bus Emissions by VSP range Bin VSP range 1 VSP <= 0 2 2 > VSP > 0 3 4 > VSP >= 2 4 6 > VSP >= 4 5 8 > VSP >= 6 6 10 > VSP >= 8 7 VSP >= 10 VSP is in kW/ton Because the tailpipe configuration was different between the hybrid buses and normal vehicles, emission concentrations were compared rather than emission rates. Average concentration was calculated for each pollutant for each VSP bin. Concentrations for CO were below the detectable limit, so CO was not included in the analysis. Concentrations for CO2 were measured in percent, HC and NOx in parts per million (ppm), and PM in milligrams per meter cubed (mg/m3). 5.4 Emissions Analysis Data were evaluated by VSP bin for each roadway type. Data were disaggregated by bin type and compared for those periods when the hybrid was functioning or switched off. In order to select the appropriate statistical test, data were examined to determine whether they followed any obvious distribution (i.e., normal distribution). Data for several bins appeared to be Poisson
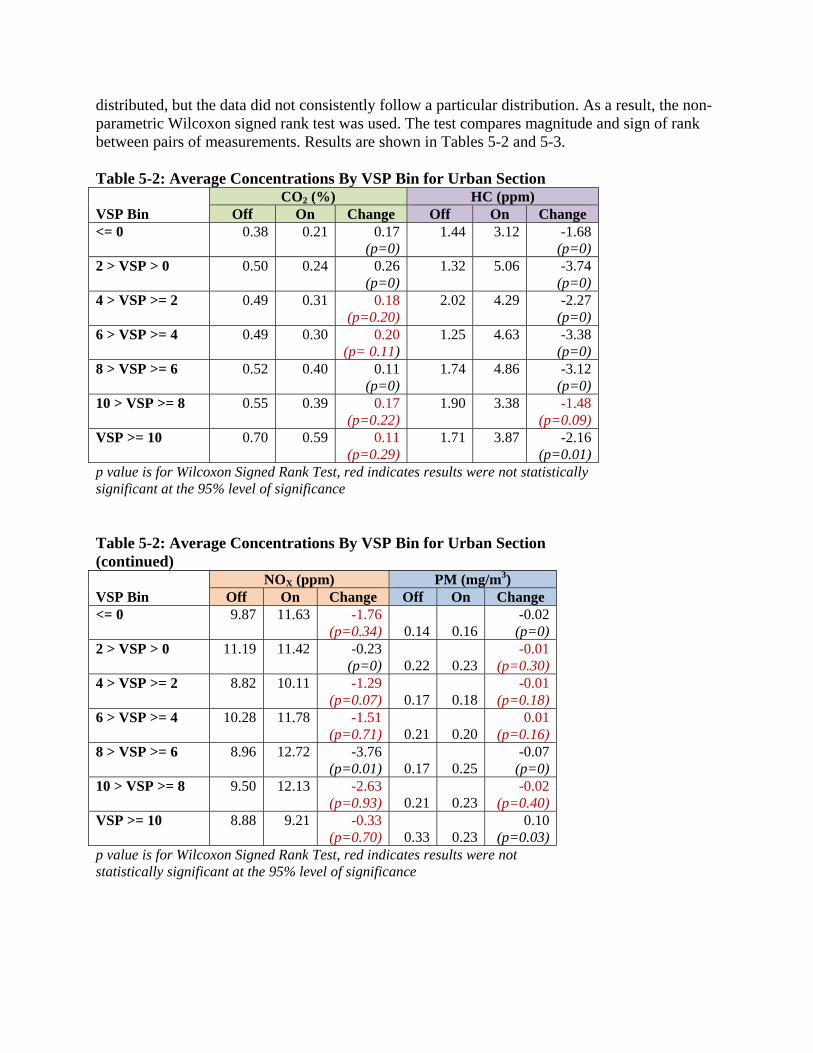
distributed, but the data did not consistently follow a particular distribution. As a result, the non-parametric Wilcoxon signed rank test was used. The test compares magnitude and sign of rank between pairs of measurements. Results are shown in Tables 5-2 and 5-3. Table 5-2: Average Concentrations By VSP Bin for Urban Section
VSP Bin CO2 (%) HC (ppm)
Off On Change Off On Change <= 0
0.38
0.21 0.17 (p=0)
1.44 3.12 -1.68 (p=0)
2 > VSP > 0
0.50
0.24 0.26 (p=0)
1.32 5.06 -3.74 (p=0)
4 > VSP >= 2
0.49
0.31 0.18 (p=0.20)
2.02 4.29 -2.27 (p=0)
6 > VSP >= 4
0.49
0.30 0.20 (p= 0.11)
1.25 4.63 -3.38 (p=0)
8 > VSP >= 6
0.52
0.40 0.11 (p=0)
1.74 4.86 -3.12 (p=0)
10 > VSP >= 8
0.55
0.39 0.17 (p=0.22)
1.90 3.38 -1.48 (p=0.09)
VSP >= 10
0.70
0.59 0.11 (p=0.29)
1.71 3.87 -2.16 (p=0.01)
p value is for Wilcoxon Signed Rank Test, red indicates results were not statistically significant at the 95% level of significance Table 5-2: Average Concentrations By VSP Bin for Urban Section (continued)
VSP Bin NOX (ppm) PM (mg/m3)
Off On Change Off On Change <= 0
9.87
11.63
-1.76 (p=0.34) 0.14 0.16
-0.02 (p=0)
2 > VSP > 0
11.19
11.42
-0.23 (p=0) 0.22 0.23
-0.01 (p=0.30)
4 > VSP >= 2
8.82
10.11
-1.29 (p=0.07) 0.17 0.18
-0.01 (p=0.18)
6 > VSP >= 4
10.28
11.78
-1.51 (p=0.71) 0.21 0.20
0.01 (p=0.16)
8 > VSP >= 6
8.96
12.72
-3.76 (p=0.01) 0.17 0.25
-0.07 (p=0)
10 > VSP >= 8
9.50
12.13
-2.63 (p=0.93) 0.21 0.23
-0.02 (p=0.40)
VSP >= 10
8.88
9.21
-0.33 (p=0.70) 0.33 0.23
0.10 (p=0.03)
p value is for Wilcoxon Signed Rank Test, red indicates results were not statistically significant at the 95% level of significance
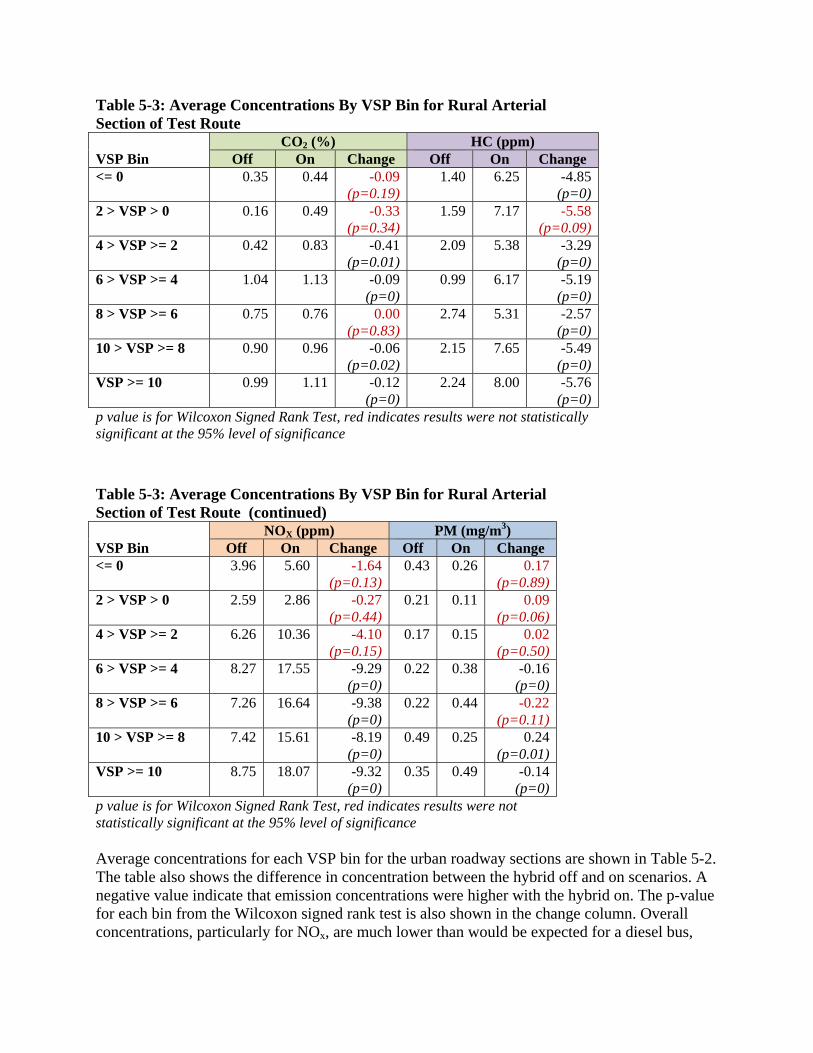
Table 5-3: Average Concentrations By VSP Bin for Rural Arterial Section of Test Route
VSP Bin CO2 (%) HC (ppm)
Off On Change Off On Change <= 0
0.35
0.44 -0.09 (p=0.19)
1.40 6.25 -4.85 (p=0)
2 > VSP > 0
0.16
0.49 -0.33 (p=0.34)
1.59 7.17 -5.58 (p=0.09)
4 > VSP >= 2
0.42
0.83 -0.41 (p=0.01)
2.09 5.38 -3.29 (p=0)
6 > VSP >= 4
1.04
1.13 -0.09 (p=0)
0.99 6.17 -5.19 (p=0)
8 > VSP >= 6
0.75
0.76 0.00 (p=0.83)
2.74 5.31 -2.57 (p=0)
10 > VSP >= 8
0.90
0.96 -0.06 (p=0.02)
2.15 7.65 -5.49 (p=0)
VSP >= 10
0.99
1.11 -0.12 (p=0)
2.24 8.00 -5.76 (p=0)
p value is for Wilcoxon Signed Rank Test, red indicates results were not statistically significant at the 95% level of significance Table 5-3: Average Concentrations By VSP Bin for Rural Arterial Section of Test Route (continued)
VSP Bin NOX (ppm) PM (mg/m3)
Off On Change Off On Change <= 0
3.96
5.60
-1.64 (p=0.13)
0.43 0.26 0.17 (p=0.89)
2 > VSP > 0
2.59
2.86
-0.27 (p=0.44)
0.21 0.11 0.09 (p=0.06)
4 > VSP >= 2
6.26
10.36
-4.10 (p=0.15)
0.17 0.15 0.02 (p=0.50)
6 > VSP >= 4
8.27
17.55
-9.29 (p=0)
0.22 0.38 -0.16 (p=0)
8 > VSP >= 6
7.26
16.64
-9.38 (p=0)
0.22 0.44 -0.22 (p=0.11)
10 > VSP >= 8
7.42
15.61
-8.19 (p=0)
0.49 0.25 0.24 (p=0.01)
VSP >= 10
8.75
18.07
-9.32 (p=0)
0.35 0.49 -0.14 (p=0)
p value is for Wilcoxon Signed Rank Test, red indicates results were not statistically significant at the 95% level of significance Average concentrations for each VSP bin for the urban roadway sections are shown in Table 5-2. The table also shows the difference in concentration between the hybrid off and on scenarios. A negative value indicate that emission concentrations were higher with the hybrid on. The p-value for each bin from the Wilcoxon signed rank test is also shown in the change column. Overall concentrations, particularly for NOx, are much lower than would be expected for a diesel bus,

even with the hybrid option functioning. It is suspected that this is due to dilution from the unusual tailpipe configuration. Results for the urban section indicate that CO2 was generally lower for the scenario with the hybrid system on than for the scenario with the hybrid function off, while the reverse was true for the rural arterial section. Many of the results for either test section, however, were not statistically significant at the 5% level of significance. For both roadway sections, hydrocarbon concentrations were generally higher for the hybrid system on scenario than for the hybrid system off scenario, as shown in Tables 5-2 and 5-3. HC concentrations overall, however are low for diesel buses. NOx concentrations were generally higher for the hybrid on scenario than for the hybrid off scenario. Most of the differences, however, were not statistically significant at the 95% level of significance, so, in general, NOx concentrations were similar for the two scenarios. Particulate emissions were usually lower for the hybrid on scenario than for the hybrid off scenario for both test sections. However, in many cases differences were not statistically significant. As a result, PM concentrations were similar for the two scenarios. Overall, it was difficult to detect differences in emissions concentrations between the two scenarios. This result may have occurred because the hybrid system does not entirely switch off during the off mode.

6. RESULTS FROM OTHER HYBRID SCHOOL BUSES The following describes results that have been reported from other sources for HESB project buses. 6.1 Fuel Economy and Emissions Enova tested a plug-in hybrid school bus using a chassis dynamometer to evaluate fuel economy under controlled test conditions. The company used the West Virginia University Suburban Cycle (WVUSC) and Torrance California Test Cycle (TCTC) (Advanced Energy, 2010). With the WVUSC, the researchers found that the hybrid bus had a fuel economy of 12.7 mpg, while a conventional bus used for comparison had a fuel economy of 7.1 mph (an 81% improvement). For the TCTC, the researchers found a 57% improvement in fuel economy for the hybrid bus, with 12.8 mpg for the hybrid and 8.1 mpg for the conventional bus. Garabedian (2010) evaluated hybrid-electric school buses for Vermont using an on-road emissions tester over a 32 kilometer route. It was estimated that the hybrid-electric school bus consumed 28.7% less fuel than a standard diesel school bus. It was also reported that NOx emissions were 49% lower for the hybrid-electric school bus than for the conventional school bus, CO emissions were 72% lower, and HC emissions were 49% lower. Advanced Energy (2010) cited a study by M.J. Bradley & Associates, which evaluated school buses for the New York Power Authority (NYPA). The researchers collected data on a conventional charge-sustaining (hybrid) bus, a standard diesel control bus, and a charge-depleting (plug-in hybrid) bus. They measured fuel consumption for three test routes (urban, suburban, and rural) and found that the plug-in hybrid school bus had a fuel economy 51% to 131% higher than the other buses, depending on the test route. However, this was only observed while the HESB operated in charge-depleting mode. Once it began operating in charge-sustaining mode, it performed similar to the conventional hybrid and diesel control buses. The University of Texas compared a plug-in hybrid school bus to a control bus for the U.S. Department of Transportation. The study authors found that fuel economy for the conventional bus was 6.9 mpg, while fuel economy was 9 mpg for the HESB (an increase of 30%). The researchers also reported that the control bus emitted approximately 63 kg of C02 per day while the HESB emitted 51 kg; when electricity regeneration to recharge batteries is included, this represents a reduction of 23.5% (Advanced Energy 2010). Advanced Energy (2010) conducted early tests using a chassis dynamometer to assess fuel economy under controlled conditions. They used the West Virginia University Suburban Cycle and the Torrance California route. Although not stated in the report, it is assumed that they tested one plug-in hybrid bus and one control bus. The plug-in hybrid had 81% better fuel economy on the West Virginia cycle than the control bus (12.7 versus 7.1 mpg). The plug-in hybrid had 57% better fuel economy on the Torrance route than the convention bus did (12.8 vs. 8.1 mph). Advanced Energy (2010) has also been collecting in-use fuel economy data from each school district involved in the HSEB project across the U.S. Advanced Energy’s researchers have reported the fuel economy results shown in Table 6-1. However, the report does not state how the comparison was conducted, for example, whether outliers were removed or the data were
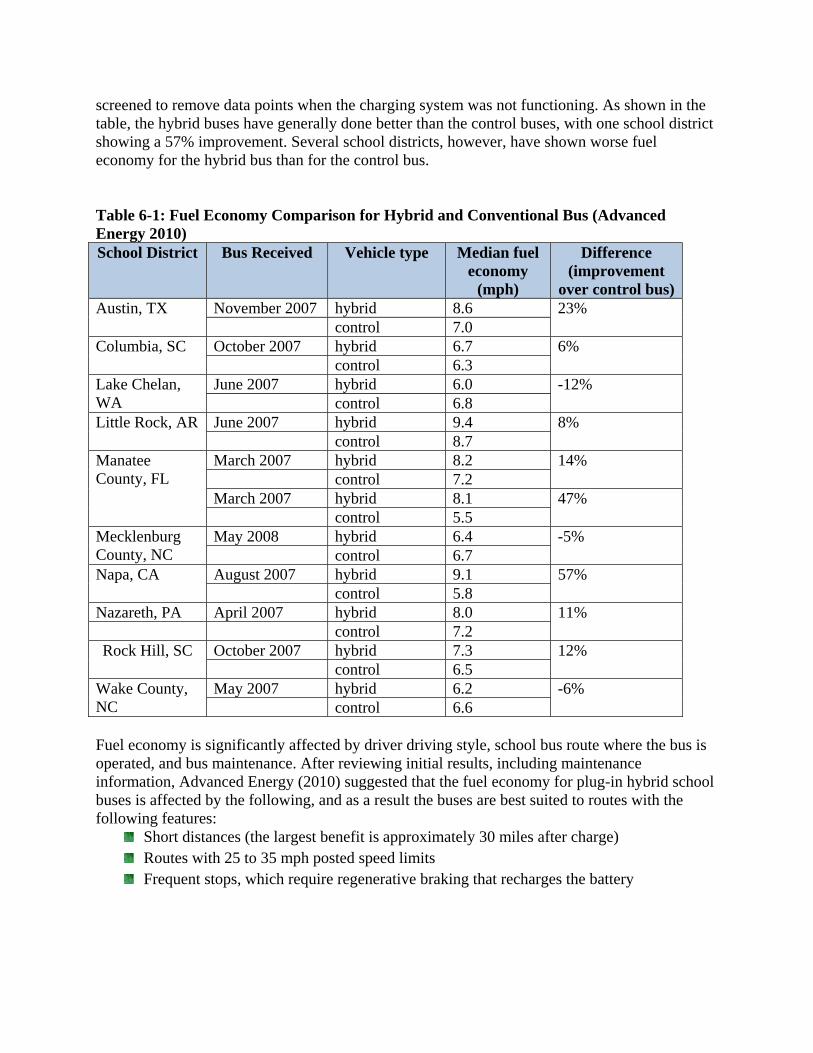
screened to remove data points when the charging system was not functioning. As shown in the table, the hybrid buses have generally done better than the control buses, with one school district showing a 57% improvement. Several school districts, however, have shown worse fuel economy for the hybrid bus than for the control bus. Table 6-1: Fuel Economy Comparison for Hybrid and Conventional Bus (Advanced Energy 2010) School District Bus Received Vehicle type Median fuel
economy (mph)
Difference (improvement
over control bus)Austin, TX November 2007 hybrid 8.6 23%
control 7.0 Columbia, SC October 2007 hybrid 6.7 6%
control 6.3 Lake Chelan, WA
June 2007 hybrid 6.0 -12% control 6.8
Little Rock, AR June 2007 hybrid 9.4 8% control 8.7
Manatee County, FL
March 2007 hybrid 8.2 14% control 7.2 March 2007 hybrid 8.1 47% control 5.5
Mecklenburg County, NC
May 2008 hybrid 6.4 -5% control 6.7
Napa, CA August 2007 hybrid 9.1 57% control 5.8
Nazareth, PA April 2007 hybrid 8.0 11% control 7.2 Rock Hill, SC October 2007 hybrid 7.3 12%
control 6.5 Wake County, NC
May 2007 hybrid 6.2 -6% control 6.6
Fuel economy is significantly affected by driver driving style, school bus route where the bus is operated, and bus maintenance. After reviewing initial results, including maintenance information, Advanced Energy (2010) suggested that the fuel economy for plug-in hybrid school buses is affected by the following, and as a result the buses are best suited to routes with the following features:
Short distances (the largest benefit is approximately 30 miles after charge) Routes with 25 to 35 mph posted speed limits Frequent stops, which require regenerative braking that recharges the battery

6.3 Maintenance Problems Advanced Energy (2010) reported overall for the Hybrid-Electric School Bus project that, when consortium members reported problems other than normal maintenance and safety checks, a greater number of maintenance issues were reported for the plug-in hybrid vehicles than for the corresponding control buses. Advanced Energy’s researchers also indicated that most maintenance issues were associated with the hybrid system itself. This information was based on data from seven districts (Advanced Energy 2010).

7. SUMMARY This report summarizes the evaluation results of an in-use fuel economy evaluation for two plug-in hybrid school buses deployed in two different school districts in Iowa. Each school district selected a control bus that runs a route similar to that of the hybrid bus. Odometer readings, fuel consumption, and maintenance needs were recorded for each bus. The buses were deployed in 2008 and data were collected through May 2010. Fuel consumption was calculated for each school district. In Nevada, the overall average fuel economy was 8.23 mpg for the hybrid and 6.35 mpg for the control bus. In Sigourney, the overall average fuel economy was 8.94 mpg for the hybrid and 6.42 mpg for the control bus. The fuel consumption data were compared for the hybrid and control buses using a Wilcoxon signed rank test. Results indicate that fuel economy for the Nevada hybrid bus was 30% better than for the Nevada control bus, and fuel economy for the Sigourney hybrid bus was 36% higher than for the Sigourney control bus. Both differences were statistically significant. Although the fuel economy was clearly much higher for the HESB, the school districts had expected a fuel economy of around 12 mpg. Fuel economy may have been compromised because the charging units in both districts experienced numerous problems that did not allow the buses to hold a charge. When the charging problem occurred and the bus operators were aware of it, the problem was noted in the records, and the hybrid system was shut off until the problem was resolved. When the problem was noted, the data for that time period was removed from analysis. However, it may have taken some time for the drivers to become aware of and note the problem, so the buses may have been running while the charging system was not fully operational. Additionally, the bus operators felt that the charging problems prevented the buses from fully charging after the morning run, so the buses were not fully charged for the afternoon run. The HESB experienced an unusual number of maintenance problems, which was frustrating for the school districts. The team believes that this problem is generational and can be overcome in future models. Transit buses have utilized both plug-in and conventional hybrid technologies for some time, and it does not appear that they have experienced the same challenges. As a result, it is believed that the potential exists for manufacturers to overcome the initial problems.

8. ACKNOWLEDGEMENTS The research team would like to thank the Iowa Energy Center for funding this project. They would also like thank the Nevada and Sigourney bus garages, drivers, and supervisors for their assistance in collecting data. In particular, the team would like to thank Mr. Dennis Kroeger, who conducted much of the work and provided much of the vision to bring hybrid school buses to Iowa.

9. REFERENCES Adar, Sara D., Mark Davey, James R. Sullivan, Michael Compher, Adam Szpiro, L.J. Liu. Predicting Airborne Particle Levels Aboard Washington State School Buses. Atmospheric Environment. Vol. 42. 2008. pp. 7590-7599. Advanced Energy. Plug-in Hybrid-electric School Bus Project: 2010 Program Report. http://www.advancedenergy.org/corporate/initiatives/heb/knowledge_library.php Advanced Energy. Plug-in Hybrid-electric School Bus. http://www.hybridschoolbus.org. Accessed Feb 2008. ASBC. National School Bus Fuel Data. American School Bus Council. http://www.americanschoolbuscouncil.org/index.php?page=fuel-calculator. Accessed May 2010. Battelle. Technical Assessment of Advanced Transit Bus Propulsion Systems. For the Dallas Area Rapid Transit. Dallas, Texas. August 2002. Chandler, Kevin, Kevin Walkowicz, and Leslie Eudy. New York City Transit Diesel Hybrid-Electric Buses: Final Results. DOE/NREL Transit Bus Evaluation Project. July 2002. Chandler, K, K. Walkowicz, and L. Eudy. New York City Transit Diesel Hybrid-Electric Buses: Final Results. Department of Energy. July 2002. Chandler, K. and K. Walkowicz. King County Metro Transit Hybrid Articulated Buses: Final Evaluation Report. National Renewable Energy Laboratory. NREL/TP-540-40585. December 2006. Clark, Nigel N.; Borrell, Enrique Rivero; McKain, David L.; Paramo, Victor Hugo; Wayne, W. Scott; Vergara, Walter; Barnett, Ryan A.; Gautam, Mridul ; Thompson, Gregory; Lyons, Donald W.; Schipper, Lee. Evaluation of emissions from new and in-use transit buses in Mexico City, Mexico. Journal of the Transportation Research Record. No. 1987. 2006. pp. 42-53. Clean Air Technologies. http://www.cleanairt.com. Accessed June 2006. DARPA. Hybrid-electric Drive Heavy-duty vehicle testing project. Defense Advanced Research Projects Agency. February 2000. Environmental and Energy Studies Institute. Hybrid Buses Costs and Benefits. http://www.eesi.org/files/eesi_hybrid_bus_032007.pdf. Accessed May 2010. Frey, H. Christopher, Nagui M. Rouphail, Haibo Zhai, Tiago L. Farias, Concalo A. Goncalves. Comparing Real-World Fuel Consumption For Diesel and Hydrogen-Fueled Transit Buses And Implications for emissions. Transportation Research Part D. Vol. 12. 2007. pp. 281-291. Frey, H. Christopher and Nagui M. Rouphail. Operational Evaluation of Emissions and Fuel Use of B20 versus Diesel Vehicles. North Carolina State University. 2003.
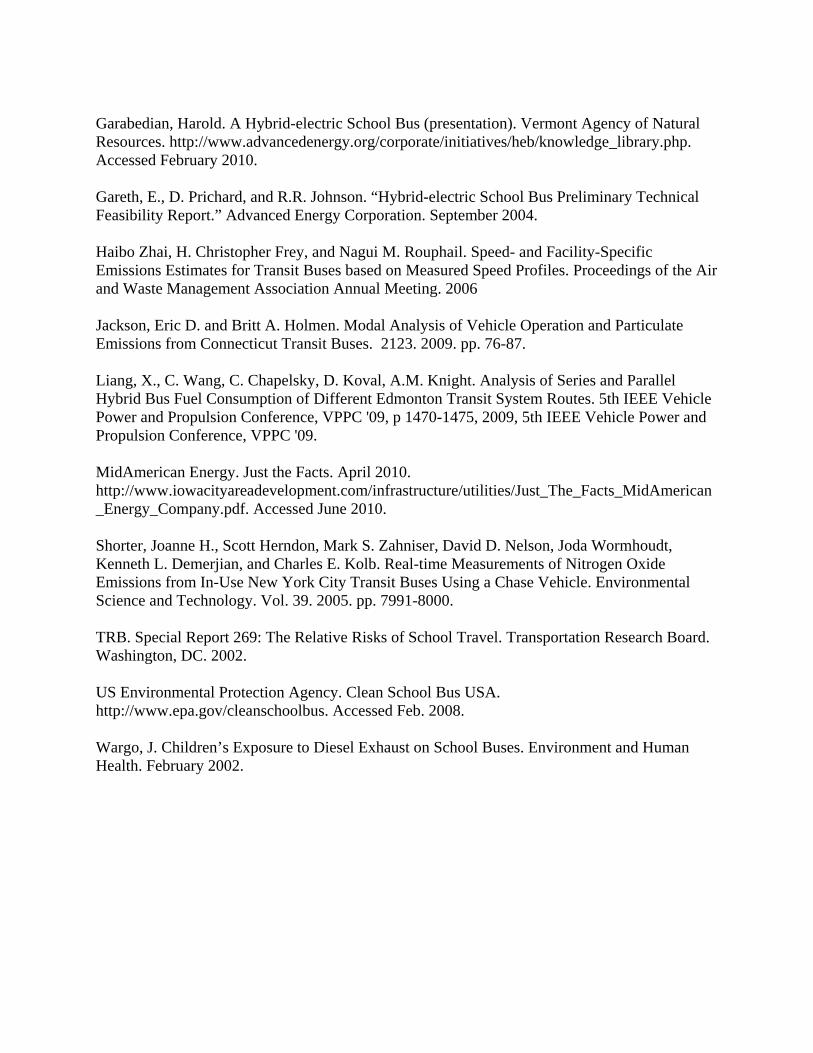
Garabedian, Harold. A Hybrid-electric School Bus (presentation). Vermont Agency of Natural Resources. http://www.advancedenergy.org/corporate/initiatives/heb/knowledge_library.php. Accessed February 2010. Gareth, E., D. Prichard, and R.R. Johnson. “Hybrid-electric School Bus Preliminary Technical Feasibility Report.” Advanced Energy Corporation. September 2004. Haibo Zhai, H. Christopher Frey, and Nagui M. Rouphail. Speed- and Facility-Specific Emissions Estimates for Transit Buses based on Measured Speed Profiles. Proceedings of the Air and Waste Management Association Annual Meeting. 2006 Jackson, Eric D. and Britt A. Holmen. Modal Analysis of Vehicle Operation and Particulate Emissions from Connecticut Transit Buses. 2123. 2009. pp. 76-87. Liang, X., C. Wang, C. Chapelsky, D. Koval, A.M. Knight. Analysis of Series and Parallel Hybrid Bus Fuel Consumption of Different Edmonton Transit System Routes. 5th IEEE Vehicle Power and Propulsion Conference, VPPC '09, p 1470-1475, 2009, 5th IEEE Vehicle Power and Propulsion Conference, VPPC '09. MidAmerican Energy. Just the Facts. April 2010. http://www.iowacityareadevelopment.com/infrastructure/utilities/Just_The_Facts_MidAmerican_Energy_Company.pdf. Accessed June 2010. Shorter, Joanne H., Scott Herndon, Mark S. Zahniser, David D. Nelson, Joda Wormhoudt, Kenneth L. Demerjian, and Charles E. Kolb. Real-time Measurements of Nitrogen Oxide Emissions from In-Use New York City Transit Buses Using a Chase Vehicle. Environmental Science and Technology. Vol. 39. 2005. pp. 7991-8000. TRB. Special Report 269: The Relative Risks of School Travel. Transportation Research Board. Washington, DC. 2002. US Environmental Protection Agency. Clean School Bus USA. http://www.epa.gov/cleanschoolbus. Accessed Feb. 2008. Wargo, J. Children’s Exposure to Diesel Exhaust on School Buses. Environment and Human Health. February 2002.


