Depositional Sediments and Stream Temperature Inventory and Assessment within the Babine Forest Product Company Chart Area. Prepared for: Babine Forest Products Ltd. P.O. Box 4000 Burns Lake BC V0J 1E0 Prepared by: Chris Schell, M.Sc., RPBio McElhanney Consulting Services Ltd PO Box 787, Smithers, BC V0J 2N0 March 2003
Transcript
Depositional Sediments and Stream Temperature Inventory and Assessment within the Babine Forest Product Company Chart Area. Prepared for: Babine Forest Products Ltd. P.O. Box 4000 Burns Lake BC V0J 1E0 Prepared by: Chris Schell, M.Sc., RPBio McElhanney Consulting Services Ltd PO Box 787, Smithers, BC V0J 2N0 March 2003
Sediment and temperature monitoring in the Lakes Forest District
EXECUTIVE SUMMARY This report summarizes the 2002 Babine Forest Products (BFP) Water Quality Inventory and Assessment Project conducted by McElhanney Consulting Services Ltd. (MCSL), in the North Babine chart area. The goals of the project included:
1. Depositional stream sediment impact assessment of two FSR stream crossings using, gravel buckets and surface fine sediment analysis (pebble counts) to monitor road crossing impacts on fish habitat;
2. Monitoring of stream temperatures at fifteen stream locations in the BFP chart
area to collect ambient or baseline stream temperature data in Northwestern British Columbia. Future uses of the temperature data are to identify temperature sensitive watersheds within the BFP chart area to aid future forest development planning.
Assessing the impacts of forestry activities, including road construction, stream crossings, block harvesting and riparian management on high value fish habitat within the North Babine chart area will provide information to assist with forest development planning. Two sites were pre-selected for depositional stream sediment impact assessments. The BFP biologist and MCSL selected two stream sites considered to be areas for potential sediment inputs. Field visits to these sites found one to be unsuitable for sampling. An unnamed tributary at 90.5km on the Loon FSR was found to be dry during the field visit, with a substrate of fines that was determined to be unsuitable for pebble counts or gravel bucket sampling. The other potential sediment monitoring site was located in Nellian Lake Creek at 22km on the North Road. This is a known fish bearing creek supporting rainbow trout. Erosion problems with the bridge embankments have been ongoing, making this site a good candidate for sediment monitoring. Lock-blocks have been used to limit erosion of the embankments. Gravel bucket sediment samplers were used to assess interstitial sediments in Nellian Lake Creek upstream and downstream of the crossing. Substrates were too large at the downstream site to use McNeil Coring to evaluate interstitial sediments. Pebble counts were used to characterize streambed substrates and measure surface fines. The results of the gravel bucket analysis show that buckets in the upstream site contained significantly higher levels of fines (<6.30 mm) than the downstream sites. Both sites were well below BC Water Quality Guidelines for interstitial sediments. The pebble count analysis found the average particle size to be 43 mm downstream and 92 mm upstream of the crossing. % surface fines resulting from the pebble counts were also significantly higher upstream and both values were well below the guidelines. The measured fine sediment levels were estimated to result in a 100% survival to emergence for salmonid eggs in Nellian Lake Creek. It was concluded that these sites were not well suited to evaluating the effects of the road crossing under the current experimental design. A BACI (before, after, control, impact) design would have been required to establish pre-impact conditions and then
Sediment and temperature monitoring in the Lakes Forest District
compare these with post impact conditions. Regular (automated) measurement of suspended sediments may be better suited to detecting impacts of this road crossing, but the data indicate that interstitial sediment levels do not justify further work at this site. Interstitial sediment levels at both sites were 5% to 10% of the BC guideline maximums. The stream temperature monitoring program in 2002 consisted of 19 temperature probes deployed in 15 separate streams. This is the first year of monitoring in 5 streams, the second year in 9, and the third year in 1 of the creeks. The purpose of this monitoring is to collect background information on summer water temperatures and identify temperature sensitive streams in the BFP chart area. Of the 15 streams monitored, only one exceeded the BC Guidelines for temperature: Tildesley Creek, a sockeye spawning creek. This is the second consecutive year that this creek has been found to exceed temperature Guideline levels for migrating sockeye salmon. Ling Creek had elevated temperatures, but still within BC Guidelines for the rearing rainbow trout in this creek. This system is being identified as temperature sensitive however, as the measured maximum temperature is near maximum guideline levels despite the fact that this watershed has not yet been developed. John Creek was another system of concern. While this creek is well below BC guidelines for stream temperature, it demonstrated a 2°C increase through a series of cutblocks. This increase will be transported downstream to Tildesley Creek, a temperature sensitive sockeye spawning creek. Due to this creek’s role as a cold water tributary to Tildesley Creek, the 2°C increase is of concern. Five sites were identified that experienced rates of change greater than 1°C per hour. Twain and Ling Creeks demonstrated regular rapid increases during the morning and early afternoon warming cycle. The other sites only rarely demonstrated rapid temperature changes, or the changes consisted of rapidly declining temperatures. Ling Creek has already been identified as temperature sensitive. Twain Creek should also potentially be identified as a “creek at risk”. Examining the results of this and the past years’ temperature monitoring program, it becomes apparent that lake headed systems are more likely to be temperature sensitive than non-lake headed creeks. While this is an intuitively obvious result, it can serve as a useful guide for selecting streams for monitoring. Lake headed systems should be a high priority for future monitoring efforts in order to evaluate these high-risk creeks. Cool water tributaries to temperature sensitive creeks are very important and should be treated as temperature sensitive. This will protect the important cold water inputs into the warm water systems. It is recommended that the temperature monitoring period next year begin earlier in the year. This would allow for a more reliable measure of the maximum summer temperature and provide temperature data during the rainbow trout incubation period, for which the temperature guidelines are much lower.
Sediment and temperature monitoring in the Lakes Forest District
1.0 Introduction........................................................................................................1 2.0 Detailed Surveys – Suspended and Depositional Sediment...........................2
2.1 Methods...........................................................................................................2 2.1.1 Sites.........................................................................................................2 2.1.2 Suspended and Depositional Sediments..................................................3 2.1.3 Ambient Water Quality Guidelines for Turbidity, Suspended and Benthic Sediments in streams .................................................................................3
2.2 Data Manipulation and Statistical Analysis.......................................................4 2.2.1 Surface Fine Sediments - Pebble Counts.................................................4 2.2.2 Gravel Buckets.........................................................................................4 2.2.3 Survival to Emergence of Salmonids........................................................4
2.3 Results and Conclusions .................................................................................5 2.3.1 Site History...............................................................................................5 2.3.2 General Physical Observations ................................................................5 2.3.3 Fish Habitat..............................................................................................5 2.3.4 Monitoring Techniques.............................................................................5 2.3.5 RESULTS ................................................................................................6 2.3.6 RECOMMENDATIONS............................................................................7
3.0 Stream Water Temperature Monitoring............................................................8 3.1 Methods...........................................................................................................8
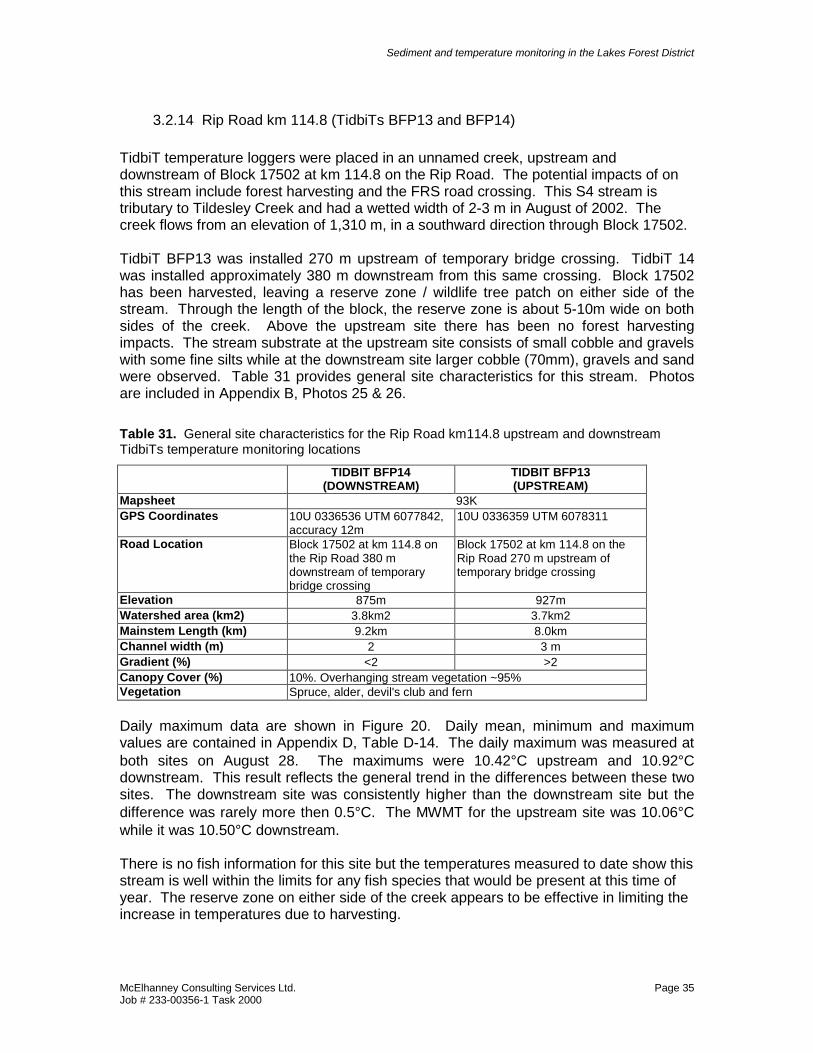
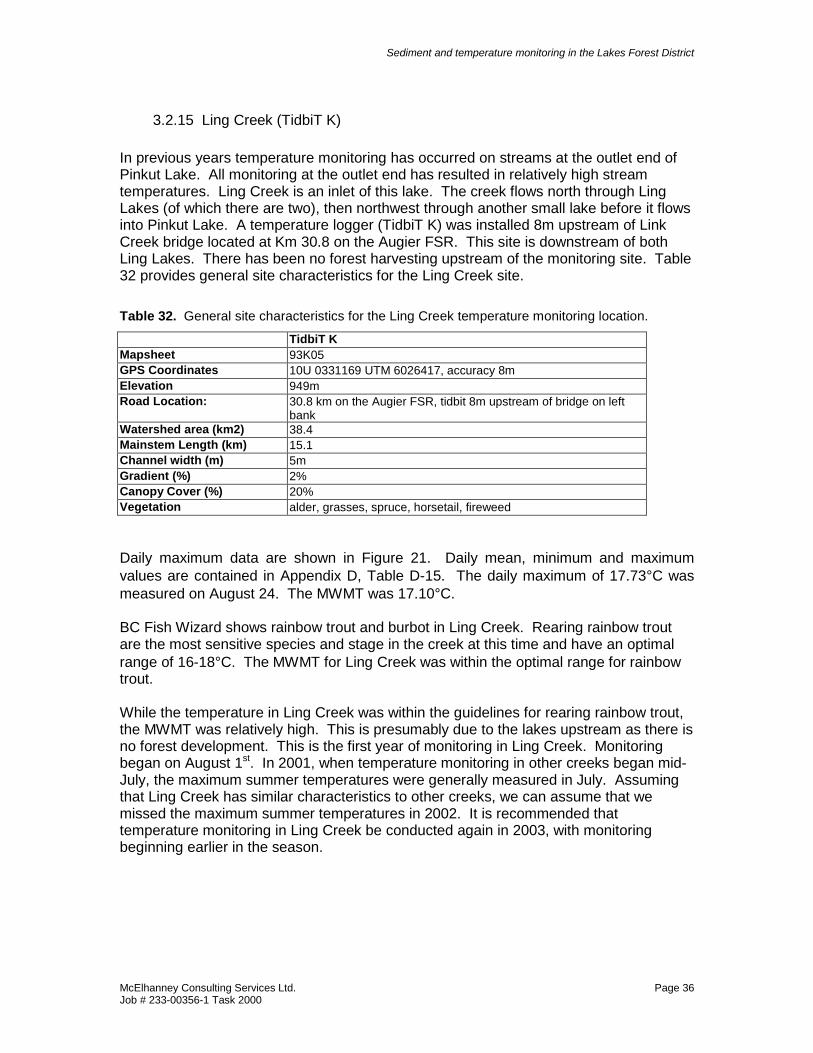
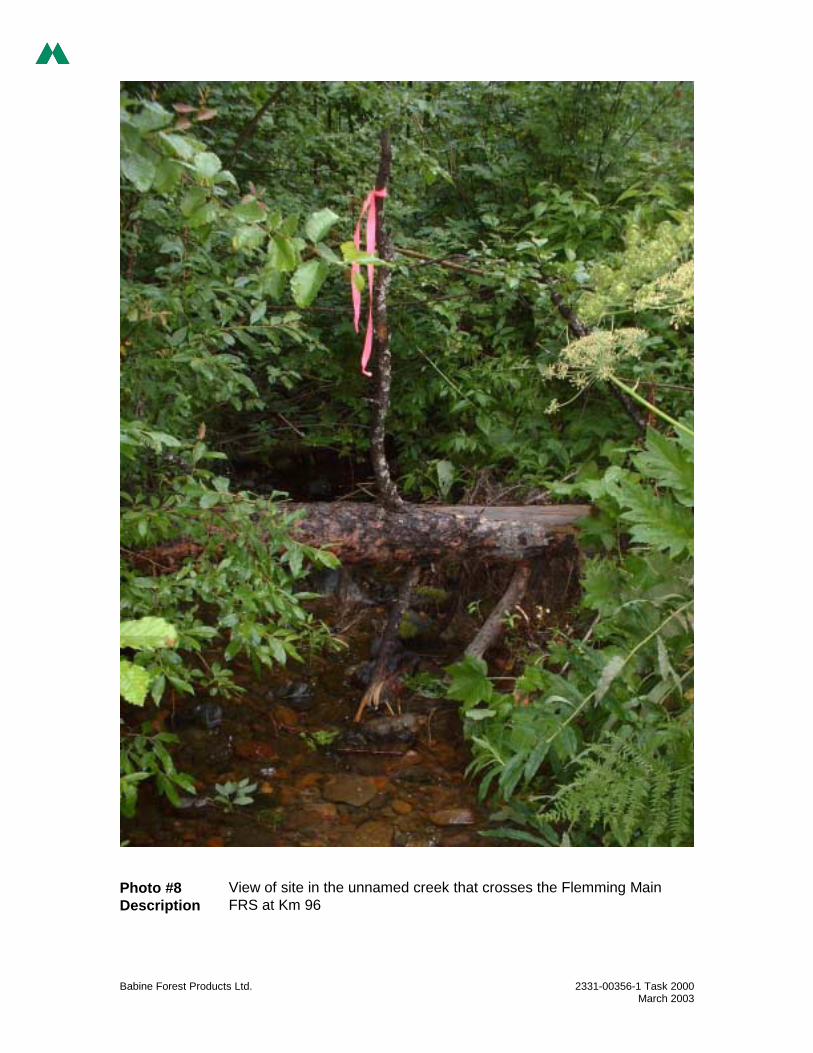
3.2 Temperature Monitoring Results ....................................................................12 3.2.1 Twain Creek (Tidbit BFP S and BFP T)..................................................14 3.2.2 Augier 25 km (BFP03)............................................................................16 3.2.3 Fleming km 96.9 (BFP17) ......................................................................18 3.2.4 Fleming km 96 (BFP16) .........................................................................20 3.2.5 Tildesley Creek (BFP15) ........................................................................21 3.2.6 Endako Road km 2.6 and 4.5 (BFP08 & BFP09)....................................23 3.2.7 Rentoul Creek (BFP12) ..........................................................................25 3.2.8 John Creek (BFP18 & BFP19) ...............................................................27 3.2.9 Tributary to John Creek (BFP20)............................................................29 3.2.10 177 Rd km 116.8 (BFP01)......................................................................31 3.2.11 Rip Road km 112 (TidbiT L) ...................................................................32 3.2.12 Blue Jay FSR (TidbiT BFP04) ................................................................33 3.2.13 Nellian Lake Creek (TidbiT BFP05)........................................................34 3.2.14 Rip Road km 114.8 (TidbiTs BFP13 and BFP14) ...................................35 3.2.15 Ling Creek (TidbiT K) .............................................................................36
3.3 Temperature Monitoring Conclusions ............................................................37 3.3.1 Application of results ..............................................................................37 3.3.2 Recommendations .................................................................................38
List of Tables Table 1. BFP “Watercourse crossing identification and management system”
(taken from the BFP Woodlands Operation Environmental Handbook, 2001)..........1 Table 2. Sediment quality results at the Nellian Lake Creek road crossing. BC
Water Quality Criteria are also.................................................................................6 Table 3. Summary data for the pebble counts taken upstream and downstream
of the Nellian Creek crossing. % fines less than 6.350 mm should be no greater than 20%.....................................................................................................7
Table 4. A list of stream locations selected for temperature monitoring during the 2002 field season. ...................................................................................................9
Table 5. Hardware accuracy of Stowaway TidbiT temperature loggers...................10 Table 6. Modified table (including only those species found in the study area) of
the optimum temperature range of specific life history stages of salmonids and other coldwater species for BC Stream Temperature guideline application (Oliver & Fidler, 2001)..........................................................................11
Table 7. Mean Weekly Maximum Temperature (MWMT) for the 2001 BFP field season TidbiT stream temperature monitors. Bold sites indicate that the BC Guidelines were exceeded. ...................................................................................12
Table 8. Hourly rate of change, direction of change, date and stream temperatures for BFP monitoring sites that exceeded the guideline of ±±±±1 degree hourly rate of change. ................................................................................13
Table 9. General site characteristics recorded for Twain Creek....................................15 Table 10. Summary statistics of maximum stream temperature data in Twain
Creek from Aug 2 to Sept 16 2000, 2001 and 2002. ..............................................15 Table 11. General site characteristics at the Augier 25 km TidbiT BFP03
location..................................................................................................................16 Table 12. Summary statistics of maximum stream temperature data in Augier
FSR km25 from Aug 2 to Sept 16 2000, 2001 and 2002........................................17 Table 13. General site characteristics at Fleming km 96.9, TidbiT BFP17 site..............18 Table 14. Summary statistics of maximum stream temperature data in Fleming
FSR km96.9 from Aug 2 to Sept 16 2000, 2001 and 2002.....................................19 Table 15. General site characteristics for Fleming km 96.0, TidbiT BFP16...................20 Table 16. Summary statistics of maximum stream temperature data in Fleming
FSR km96 from Aug 8 to Sept 15 2000, 2001 and 2002........................................20 Table 17. General site characteristics at Tildesley Creek, TidbiT BFP06......................21 Table 18. Summary statistics of maximum stream temperature data in Tildesley
Creek from Aug 8 to Sept 15 2001 and 2002.........................................................22 Table 19. General site characteristics for TidbiTs BFP08 and BFP09 sites ..................23 Table 20. Summary statistics of maximum stream temperature data in Endako
Rd creek from Aug 2 to Sept 16 2002....................................................................24 Table 21. General site characteristics at Rentoul Creek, TidbiT BFP14........................25 Table 22. Summary statistics of maximum stream temperature data in Rentoul
Creek from Aug 2 to Sept 19 2002. .......................................................................26 Table 23. General site characteristics for the John Creek at the Fleming FSR
and upstream of the block, TidbiTs BFP18 and BFP19 respectively. .....................27 Table 24. Summary statistics of maximum stream temperature data in John
Creek from Aug 9 to Sept 15, 2002........................................................................28 Table 25. General site characteristics at the tributary to John Creek BFP20 site..........29 Table 26. Summary statistics of maximum stream temperature data in John
Creek and the tributary creek from Aug 9 to Sept 15 2002. ...................................30
Sediment and temperature monitoring in the Lakes Forest District
Table 27. General site characteristics at the 177 Rd km 116.8 TidbiT BFP01 site........31 Table 28. General site characteristics at the Rip Road km 112, TidbiT L site. ..............32 Table 29. General site characteristics for the Blue Jay FSR temperature
monitoring location ................................................................................................33 Table 30. General site characteristics for the Nellian Lake Creek temperature
monitoring location ................................................................................................34 Table 31. General site characteristics for the Rip Road km114.8 upstream and
downstream TidbiTs temperature monitoring locations..........................................35 Table 32. General site characteristics for the Ling Creek temperature monitoring
Figure 1. Overview map showing the location of the 2002 study area. .........................43 Figure 2. Pebble count cumulative percent frequency results from the upstream
and downstream site on Nellian Creek. A z-test comparing the sample means showed a significant difference between the two sites (P < 0.0001). Both sites were well below the recommendations of < 20% surface fines < 6.3500. ...............................................................................................................44
Figure 3. Results (average with standard deviation) of gravel bucket sediment traps in Nellian Lake Creek, installed 100m upstream and downstream of the road crossing. Due to the high variance, a single factor ANOVA analysis of the data showed no significant difference between samples for particles <6.3mm in size (p = 0.317), <2.8 mm (p = 0.212), and <2.0mm (p=0.211). ...........45
Figure 4. Comparison between Augier FSR km25 maximum stream temperature data in Aug 2- September 16 2000, 2001 and 2002 recorded downstream of the pipe arch culvert. .............................................................................................46
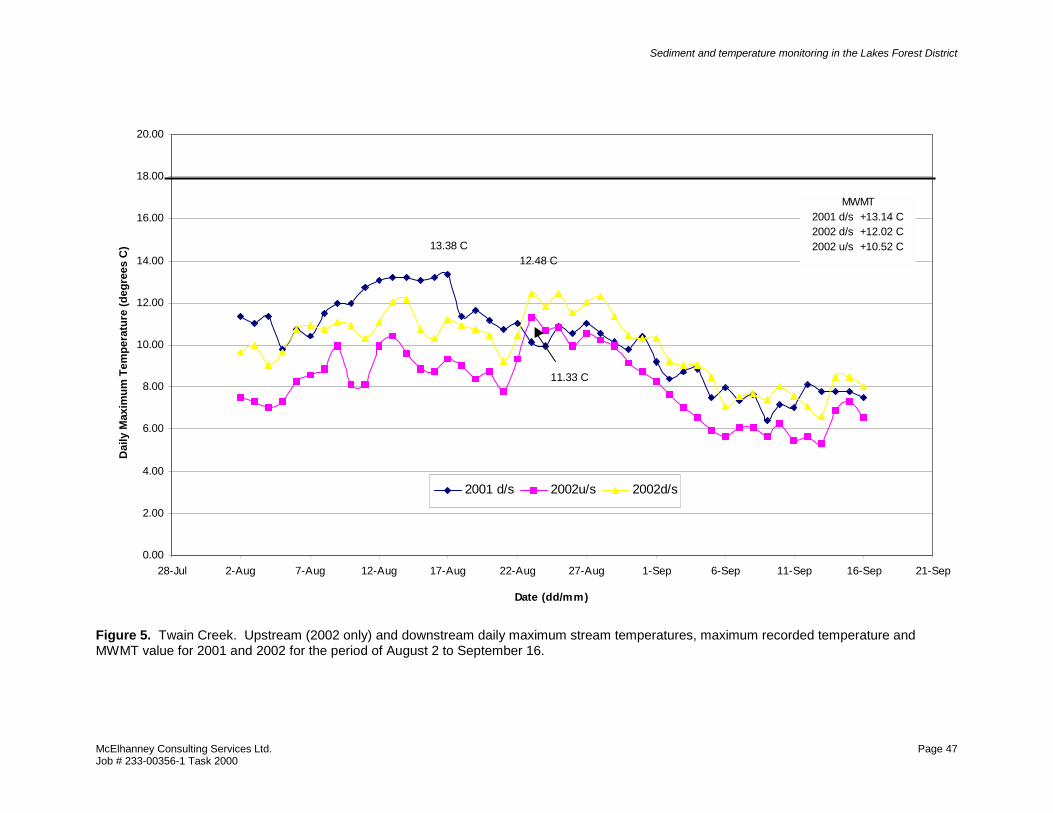
Figure 5. Twain Creek. Upstream (2002 only) and downstream daily maximum stream temperatures, maximum recorded temperature and MWMT value for 2001 and 2002 for the period of August 2 to September 16...................................47
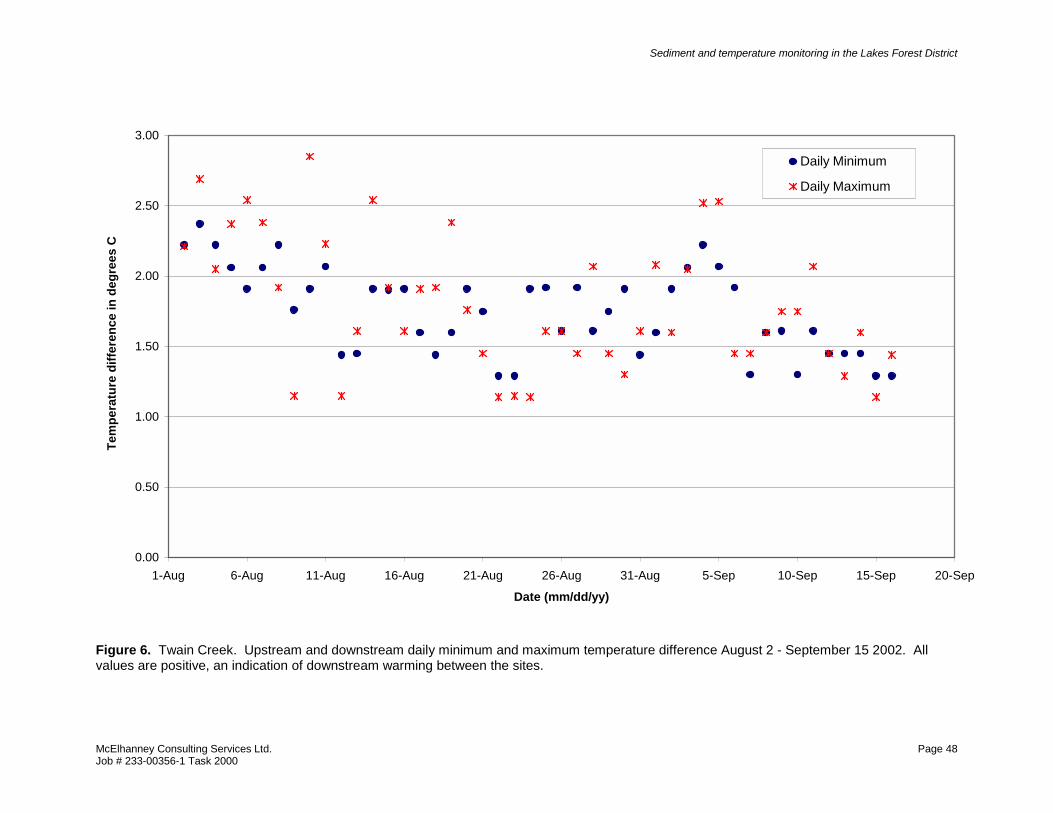
Figure 6. Twain Creek. Upstream and downstream daily minimum and maximum temperature difference August 2 - September 15 2002. All values are positive, an indication of downstream warming between the sites. ..................48
Figure 7. Flemming FSR km96.9. Unnamed Creek daily maximum stream temperatures, maximum recorded temperature and MWMT value for 2001 and 2002. Data collected between August 8 - September 15.................................49
Figure 8. Flemming FSR km96. Unnamed Creek daily maximum stream temperatures, maximum recorded temperature and MWMT value for 2001 and 2002. Data collected between August 8 - September 15.................................50
Figure 9. Tildeslely Creek daily maximum stream temperatures, maximum recorded temperature and MWMT value for August 8 - September 15, 2001 and 2002. ..............................................................................................................51
Figure 10. Comparison between Endako FSR km 2.6, Block DLFP51501 upstream and downstream site maximum stream temperature data from August 2 - September 16, 2002.............................................................................52
Figure 11. Comparison between Endako FSR km 2.6, Block DLFP51501 upstream and downstream site maximum stream temperature data from August 2 - September 16, 2001. ............................................................................53
Sediment and temperature monitoring in the Lakes Forest District
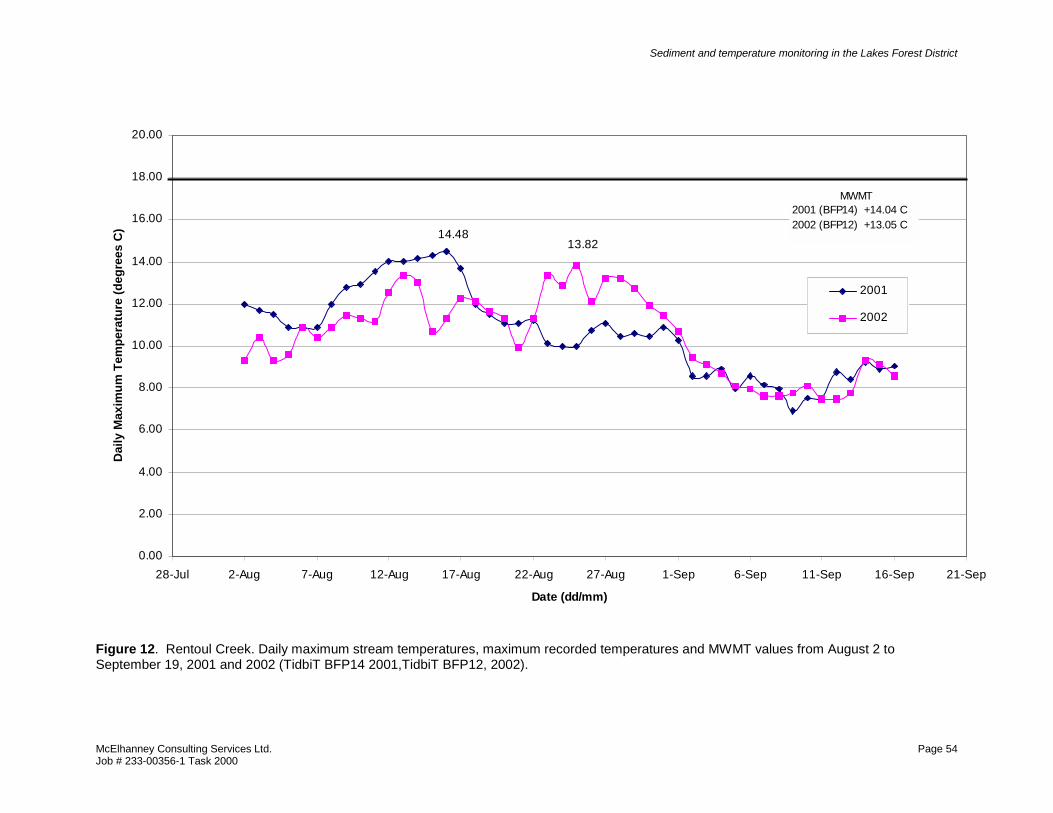
Figure 12. Rentoul Creek. Daily maximum stream temperatures, maximum recorded temperatures and MWMT values from August 2 to September 19, 2001 and 2002 (TidbiT BFP14 2001,TidbiT BFP12, 2002). ...................................54
Figure 13. John Creek and John Creek tributary. Daily maximum stream temperatures, maximum recorded temperatures and MWMT values from August 9 to September 15, 2002. ..........................................................................55
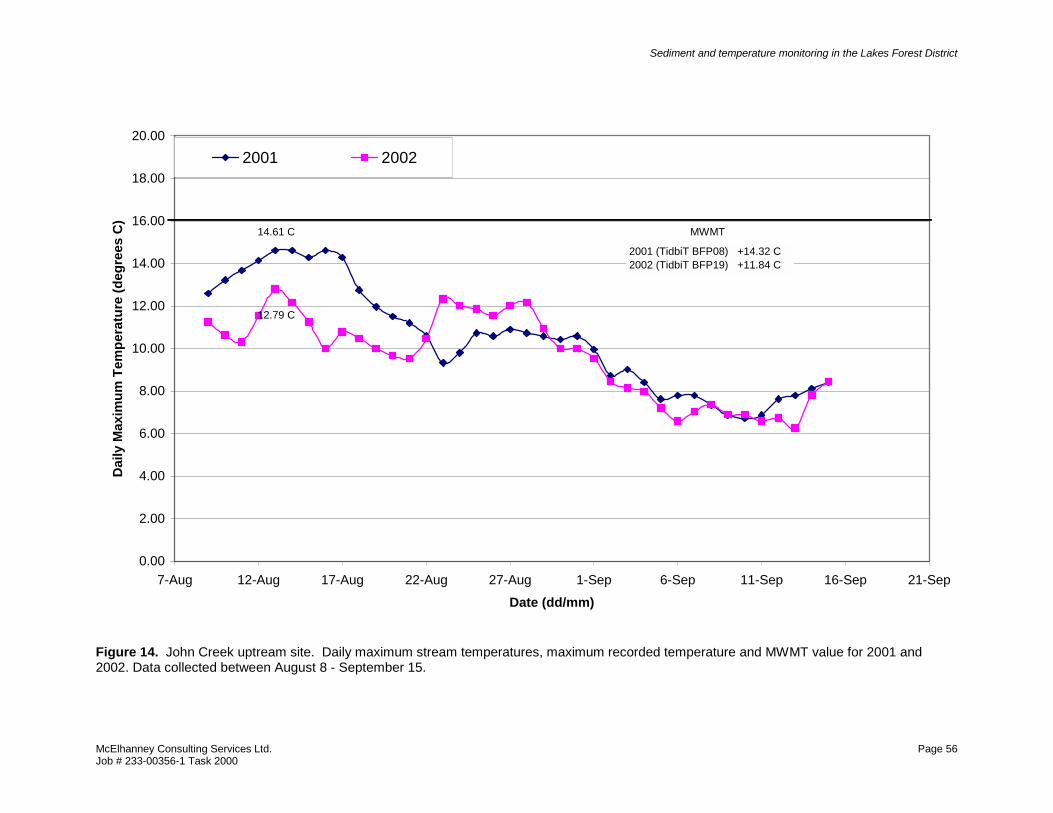
Figure 14. John Creek uptream site. Daily maximum stream temperatures, maximum recorded temperature and MWMT value for 2001 and 2002. Data collected between August 8 - September 15..........................................................56
Figure 15. John Creek tributary daily maximum stream temperatures, maximum recorded temperature and MWMT value for 2001 and 2002. Data collected between August 8 - September 15. .......................................................................57
Figure 16. 177 Rd. km 116.8. Daily maximum stream temperatures, maximum recorded temperature and MWMT value for 2001, July 13 to November 15. .........58
Figure 17. Rip Road km112, 10m downstream of culvert. Daily maximum stream temperatures, maximum recorded temperature and MWMT value for 2001 and 2002, August 8 to September 15............................................................59
Figure 18. Blue Jay FSR km 45, upstream of the road crossing culvert. TidbiT BFP04 daily maximum stream temperatures, maximum recorded temperature and MWMT value for August 2 - September 16 2002 ........................60
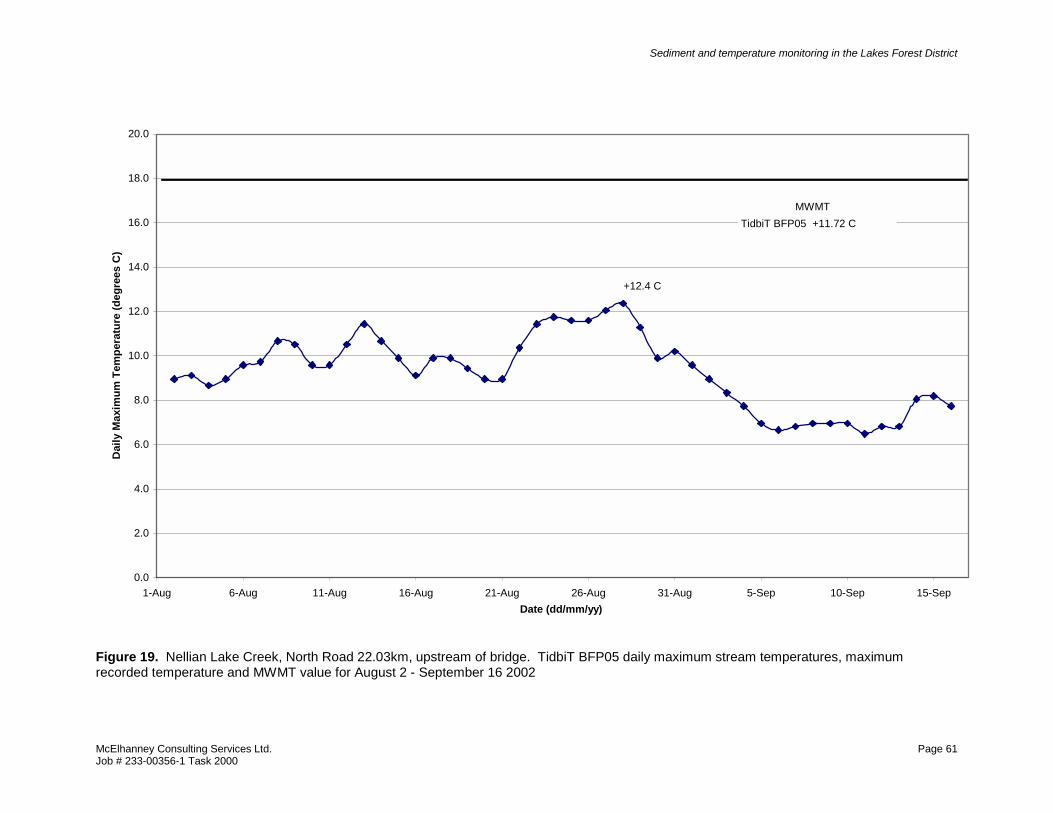
Figure 19. Nellian Lake Creek, North Road 22.03km, upstream of bridge. TidbiT BFP05 daily maximum stream temperatures, maximum recorded temperature and MWMT value for August 2 - September 16 2002 ........................61
Figure 20. Rip Road km 114.8 Block17502 upstream and downstream daily maximum stream temperatures, maximum recorded temperature and MWMT value for August 2 - September 15 2002 ...................................................62
Figure 21. Ling Creek (TidbiT BFP K) daily maximum stream temperatures, maximum recorded temperature and MWMT value for August 2 - September 16, 2002. ...............................................................................................................63
List of Appendices Appendix A: Figures Appendix B: Site Photographs Appendix C: Sediment Monitoring Site – Raw Data Appendix D: Temperature Monitoring Raw Data
Sediment and temperature monitoring in the Lakes Forest District
1.0 Introduction McElhanney Consulting Services Ltd. (MCSL) was contracted by Babine Forest Products Ltd. (BFP) to conduct water quality inventories and assessments within the BFP chart area. The work was carried out under a 2002 BFP General Service Agreement, and was directed by BFP. The 2003 Field Season activities included: • Assessment of two stream crossings for depositional sediment impact assessment
using gravel buckets and pebble counts • Deployment of TidbiT (Onset) temperature dataloggers in 15 BFP chart area streams
within the Lakes Forest District. BFP has developed a “Watercourse crossing identification and management system” in their chart area. Color marking on the culverts and their corresponding classifications are provided in Table 1. Table 1. BFP “Watercourse crossing identification and management system” (taken from the BFP Woodlands Operation Environmental Handbook, 2001).
CULVERT MARKING COLOR CLASSIFICATION
Red Fish-bearing Orange Direct Tributary to a fish-bearing stream
Blue Stream with no fish or coarse fish only Green Non-classified Yellow Cross-ditch
The watercourse crossing identification and management system was utilized in conjunction with the BFP chart area forest development plan maps and inventory reports to select high value fish habitat sampling sites for both of the monitoring activities. Other factors considered for site selection included accessibility, wadability, and surrounding land use practices. Figure 1 is a map showing the location of the study area.
Sediment and temperature monitoring in the Lakes Forest District
2.0 Detailed Surveys – Suspended and Depositional Sediment
Suspended and depositional sediment monitoring at stream crossings is key to understanding logging related impacts on aquatic ecosystems. The effects of suspended sediments on fish have been well documented in the literature and it is accepted that prolonged exposure to turbidity is detrimental to adult and juvenile fish. The effects on fish include: avoidance behaviour, physical damage, suppressed feeding, reduced food sources, delayed spawning, reduced egg to fry survival, overwintering restricted movement, and reduced survival (Newcombe, 1996). The effects of deposited sediments from stream crossings are more difficult to measure. Some known physical and biological habitat effects include stream widening, infilling of pools, increased bedload movement, angular versus rounded spawning gravels as well as reduction in available benthic invertebrates (Rex, J.F. and N.B. Carmichael. 2000) The objective of the sediment portion of this study was to monitor suspended and depositional sediment at two stream crossings in the North Babine BFP chart area. These sites had not been previously sampled. Sampling was conducted between September 16, 2002 and October 22, 2002.
2.1 Methods Study design and methods for this project generally followed the RIC document Guidelines for monitoring fine sediment deposition in streams, Field test edition, Version 1.3 (Rex and Carmichael 2002).
2.1.1 Sites Two stream crossings were assessed in the BFP chart area. One was dry at time of survey and deemed unsuitable for sediment sampling, the other was subject to monitoring of depositional sediments. The two sites were: • 90.5 km on the Loon FSR. This unnamed Babine Lake tributary has been found to
contain coho and rainbow trout during June sampling but is often dry at the end of August. The channel flows through a cutblock on both sides of the crossing. During the assessment on September 16, 2002, there was no flow was observed in the creek. The substrates were primarily fines and therefore unsuitable for pebble counts or McNeil coring. As a result, no further monitoring was performed at this site.
• 22.03 km on the North Rd. Nellian Lake Creek. The outlet to Nellian Lake is known
to be fish bearing and is likely the spawning stream for the Nellian Lake rainbow trout population. The embankments at this bridge crossing have been covered with “Lock-Blocks” to reduce sedimentation. Field assessments found this creek to be unsuitable for McNeil coring due to the large substrate size, but pebble counts and gravel buckets were used to monitor depositional sediments.
Sediment and temperature monitoring in the Lakes Forest District
At the Nellian Creek crossing, an impact site was selected approximately 100 meters downstream and a control site was selected 100 meters upstream of the road crossing.
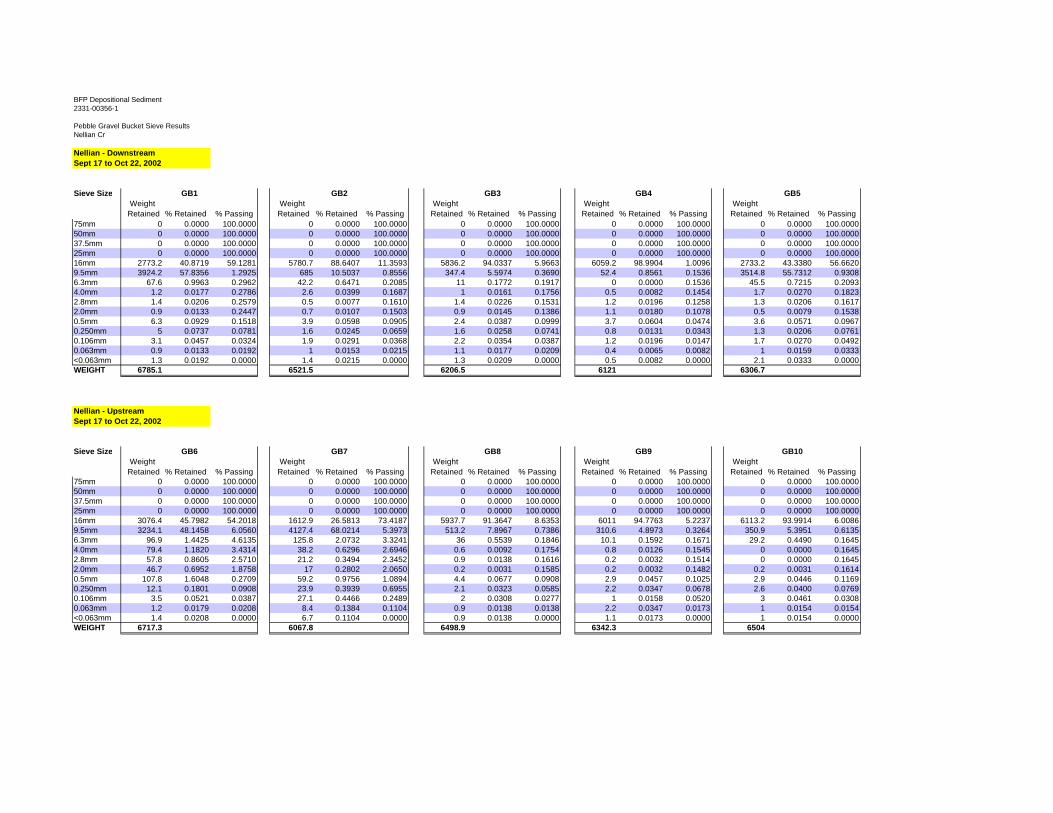
2.1.2 Suspended and Depositional Sediments To assess the stream depositional sediment load, gravel bucket sediment traps were installed for a 35 day period (September 17 to October 22). Five were installed upstream and five downstream of the road crossing. Flows were measured over the tops of the buckets when they were installed and when they were removed. After the 35 day period, the gravel bucket sediment traps were removed, lids placed, and the buckets delivered to AMEC Environmental Services in Smithers for particle size analysis. Pebble counts were conducted on October 22, 2002 to compare surface sediment particle sizes between the upstream and downstream sites. Two hundred pebbles were measured at each site. Photos of the site were taken during each visit to record changes to the sites.
2.1.3 Ambient Water Quality Guidelines for Turbidity, Suspended and Benthic Sediments in streams
The Ministry of Water, Land and Air Protection has developed comprehensive guidelines for the protection of drinking water, recreation, aquatic life and industrial/commercial use. These Water Quality Guidelines are treated as objectives, which should be attained to protect the use in question. In 1997, guidelines for Turbidity, Suspended Sediments and Benthic Sediments were produced. There are the standards that we will be using to evaluate the results of this monitoring program.
2.1.3.1 Benthic Sediments Guidelines The composition of fine sediment in streambed substrates (i.e. percent fines) should not exceed 10% having a diameter of <2.00 mm, 19% having a diameter of <3.00 mm, and 25% having a diameter of less than 6.35 mm, at potential salmonid spawning sites. The geometric mean and Fredle number of streambed substrates should not be less than 12.0 mm and 5.0 respectively. These guidelines apply to actual and potential spawning sites in streams throughout the province.
2.1.3.2 Guideline for “Surface Fine Sediment” Currently, no Canadian or provincial guidelines exist for “surface fine sediments“ (commonly referred to as pebble counts). However, in Idaho, Rhodes et.al. (1994) have developed a standard guideline for surface fine sediment. Their recommendation is that watersheds should be managed such that surface fine sediment levels average less than 20% of the surface area in spawning habitat and no increases should occur over time due to anthropogenic impacts.
Sediment and temperature monitoring in the Lakes Forest District
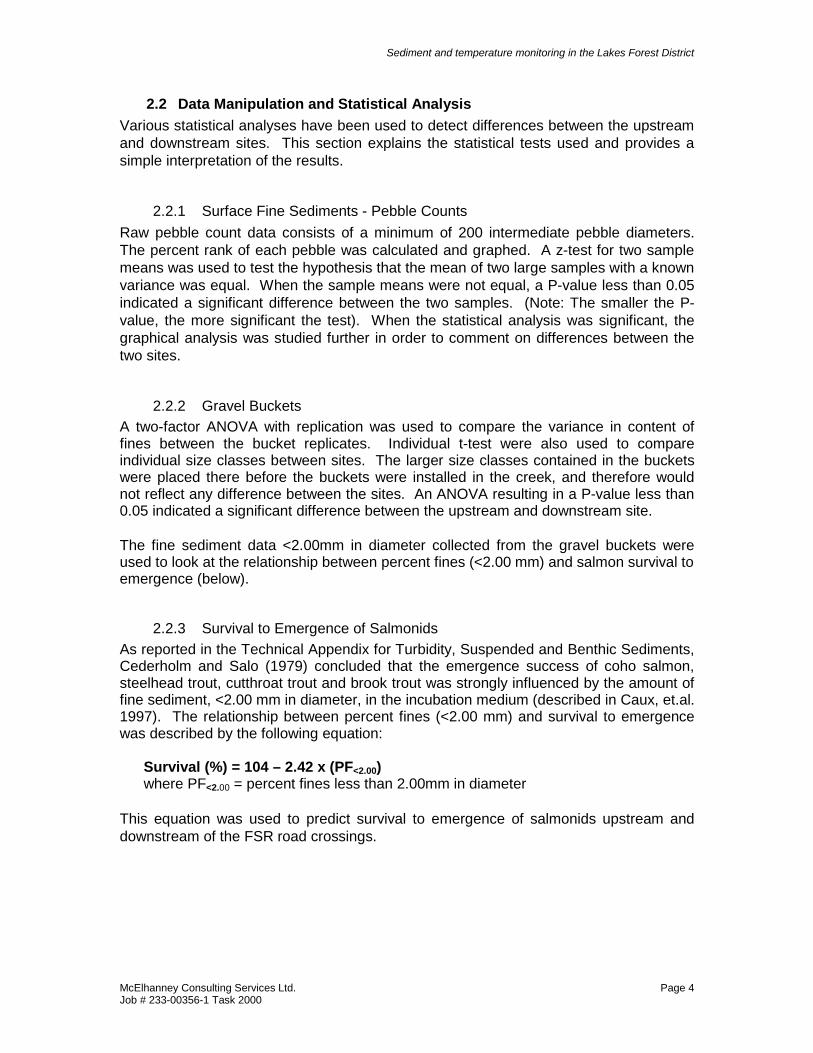
2.2 Data Manipulation and Statistical Analysis Various statistical analyses have been used to detect differences between the upstream and downstream sites. This section explains the statistical tests used and provides a simple interpretation of the results.
2.2.1 Surface Fine Sediments - Pebble Counts Raw pebble count data consists of a minimum of 200 intermediate pebble diameters. The percent rank of each pebble was calculated and graphed. A z-test for two sample means was used to test the hypothesis that the mean of two large samples with a known variance was equal. When the sample means were not equal, a P-value less than 0.05 indicated a significant difference between the two samples. (Note: The smaller the P-value, the more significant the test). When the statistical analysis was significant, the graphical analysis was studied further in order to comment on differences between the two sites.
2.2.2 Gravel Buckets A two-factor ANOVA with replication was used to compare the variance in content of fines between the bucket replicates. Individual t-test were also used to compare individual size classes between sites. The larger size classes contained in the buckets were placed there before the buckets were installed in the creek, and therefore would not reflect any difference between the sites. An ANOVA resulting in a P-value less than 0.05 indicated a significant difference between the upstream and downstream site. The fine sediment data <2.00mm in diameter collected from the gravel buckets were used to look at the relationship between percent fines (<2.00 mm) and salmon survival to emergence (below).
2.2.3 Survival to Emergence of Salmonids As reported in the Technical Appendix for Turbidity, Suspended and Benthic Sediments, Cederholm and Salo (1979) concluded that the emergence success of coho salmon, steelhead trout, cutthroat trout and brook trout was strongly influenced by the amount of fine sediment, <2.00 mm in diameter, in the incubation medium (described in Caux, et.al. 1997). The relationship between percent fines (<2.00 mm) and survival to emergence was described by the following equation:
Survival (%) = 104 – 2.42 x (PF<2.00) where PF<2.00 = percent fines less than 2.00mm in diameter
This equation was used to predict survival to emergence of salmonids upstream and downstream of the FSR road crossings.
Sediment and temperature monitoring in the Lakes Forest District
PARAMETER DESCRIPTION Forest District: Lakes Forest District TRIM Mapsheet: 93K072 Road Location: Km 22.03 on the North Road FSR Gazetted Name: Unnamed Stream alias “Nellian Lake Creek” - outlet of Nellian Lake Watershed Code 182-819600-95800-19000-6580 Site Referral Tobi Anaka, Biologist, Babine Forest Products
Suspected Impacts: road crossing with historical sedimentation problems including high turbidity and fine erodible soils.
2.3.1 Site History Nellian Lake Creek is crossed by the North FSR at km 22.03 km. It is a known fish bearing stream and likely provides spawning a rearing habitat key to the Nellian Lake rainbow trout population. The site is crossed by a bridge. The embankments of this bridge have been covered by lock blocks to prevent erosion. This site was selected for sediment monitoring to assess the effects of this erosion prevention technique.
2.3.2 General Physical Observations The stream substrate consisted of gravels, cobbles and some small boulders. Upstream of the road crossing the channel was narrower and the substrates tended more towards gravels. LWD was also more prevalent. Downstream, the channel was wider, the substrates larger, there was some bank erosion, and LWD was less common. The prevalent vegetation in the area included subalpine fir, willow, alder, false rhododendron, cow parsnip, horsetail, mosses, pink spirea, and meadow rue.
2.3.3 Fish Habitat Rainbow trout presence in this stream is documented in the BC Fisheries Warehouse. BFP identified the crossing as fish-bearing under their Environmental Management System. Juvenile rainbow trout were observed during the site visits.
2.3.4 Monitoring Techniques In the summer of 2002, the following site assessment tools were used: • Gravel bucket sediment traps were installed in the streambed. Five replicates were
installed upstream of the road crossing and five replicates were installed downstream of the road crossing;
• Pebble Counts: the intermediate diameter of 200 surface particles (“pebbles”) were measured and recorded at both upstream and downstream of the stream crossing;
• Photos were taken for a photo record.
Sediment and temperature monitoring in the Lakes Forest District
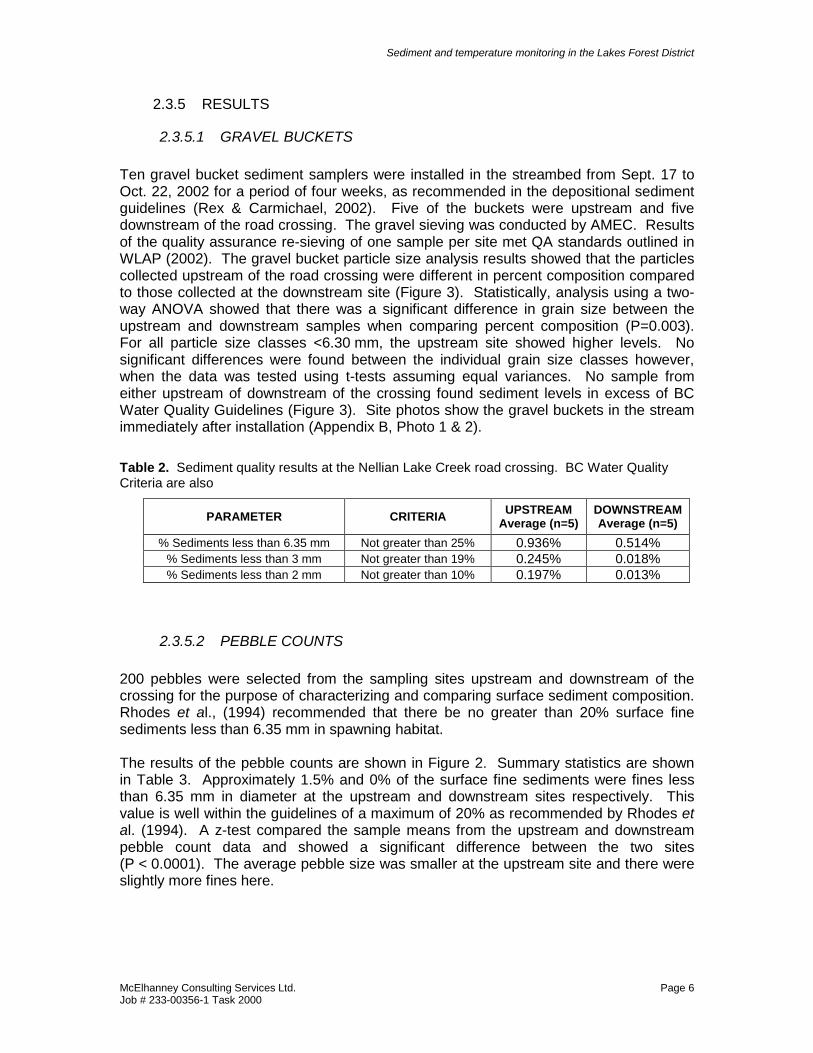
2.3.5.1 GRAVEL BUCKETS Ten gravel bucket sediment samplers were installed in the streambed from Sept. 17 to Oct. 22, 2002 for a period of four weeks, as recommended in the depositional sediment guidelines (Rex & Carmichael, 2002). Five of the buckets were upstream and five downstream of the road crossing. The gravel sieving was conducted by AMEC. Results of the quality assurance re-sieving of one sample per site met QA standards outlined in WLAP (2002). The gravel bucket particle size analysis results showed that the particles collected upstream of the road crossing were different in percent composition compared to those collected at the downstream site (Figure 3). Statistically, analysis using a two-way ANOVA showed that there was a significant difference in grain size between the upstream and downstream samples when comparing percent composition (P=0.003). For all particle size classes <6.30 mm, the upstream site showed higher levels. No significant differences were found between the individual grain size classes however, when the data was tested using t-tests assuming equal variances. No sample from either upstream of downstream of the crossing found sediment levels in excess of BC Water Quality Guidelines (Figure 3). Site photos show the gravel buckets in the stream immediately after installation (Appendix B, Photo 1 & 2). Table 2. Sediment quality results at the Nellian Lake Creek road crossing. BC Water Quality Criteria are also
PARAMETER CRITERIA UPSTREAM Average (n=5)
DOWNSTREAM Average (n=5)
% Sediments less than 6.35 mm Not greater than 25% 0.936% 0.514% % Sediments less than 3 mm Not greater than 19% 0.245% 0.018% % Sediments less than 2 mm Not greater than 10% 0.197% 0.013%
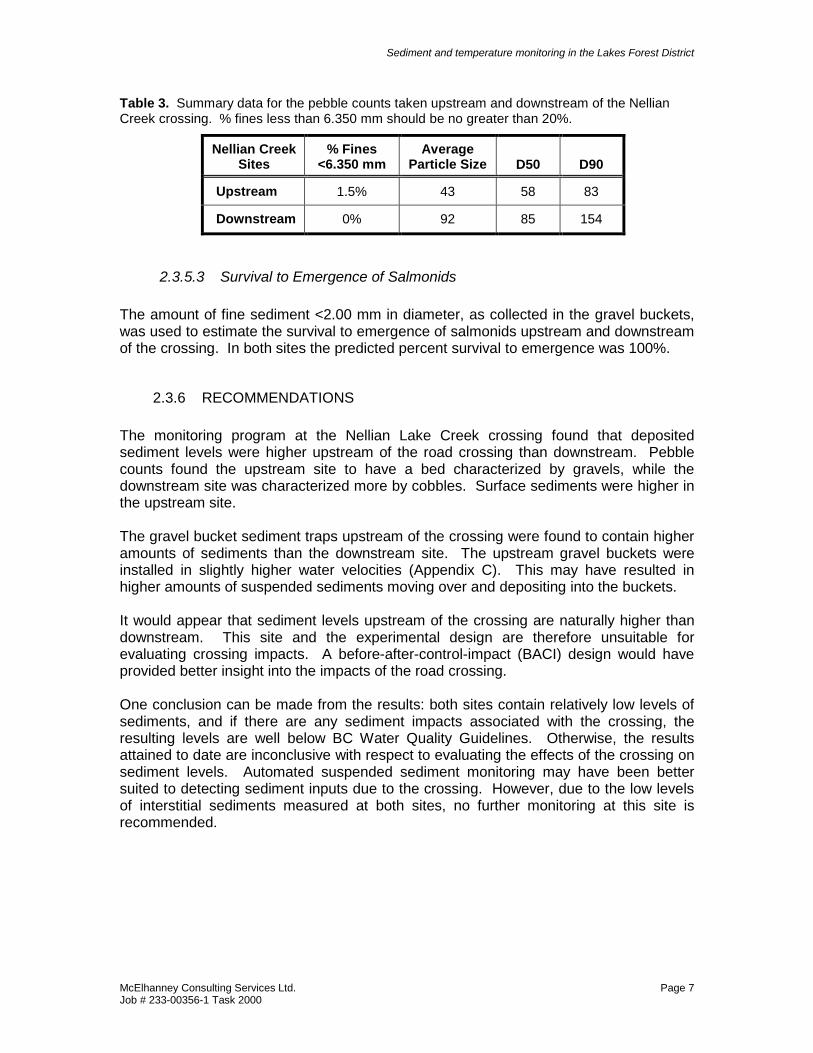
2.3.5.2 PEBBLE COUNTS 200 pebbles were selected from the sampling sites upstream and downstream of the crossing for the purpose of characterizing and comparing surface sediment composition. Rhodes et al., (1994) recommended that there be no greater than 20% surface fine sediments less than 6.35 mm in spawning habitat. The results of the pebble counts are shown in Figure 2. Summary statistics are shown in Table 3. Approximately 1.5% and 0% of the surface fine sediments were fines less than 6.35 mm in diameter at the upstream and downstream sites respectively. This value is well within the guidelines of a maximum of 20% as recommended by Rhodes et al. (1994). A z-test compared the sample means from the upstream and downstream pebble count data and showed a significant difference between the two sites (P < 0.0001). The average pebble size was smaller at the upstream site and there were slightly more fines here.
Sediment and temperature monitoring in the Lakes Forest District
Table 3. Summary data for the pebble counts taken upstream and downstream of the Nellian Creek crossing. % fines less than 6.350 mm should be no greater than 20%.
Nellian Creek Sites
% Fines <6.350 mm
Average Particle Size D50 D90
Upstream 1.5% 43 58 83
Downstream 0% 92 85 154
2.3.5.3 Survival to Emergence of Salmonids The amount of fine sediment <2.00 mm in diameter, as collected in the gravel buckets, was used to estimate the survival to emergence of salmonids upstream and downstream of the crossing. In both sites the predicted percent survival to emergence was 100%.
2.3.6 RECOMMENDATIONS The monitoring program at the Nellian Lake Creek crossing found that deposited sediment levels were higher upstream of the road crossing than downstream. Pebble counts found the upstream site to have a bed characterized by gravels, while the downstream site was characterized more by cobbles. Surface sediments were higher in the upstream site. The gravel bucket sediment traps upstream of the crossing were found to contain higher amounts of sediments than the downstream site. The upstream gravel buckets were installed in slightly higher water velocities (Appendix C). This may have resulted in higher amounts of suspended sediments moving over and depositing into the buckets. It would appear that sediment levels upstream of the crossing are naturally higher than downstream. This site and the experimental design are therefore unsuitable for evaluating crossing impacts. A before-after-control-impact (BACI) design would have provided better insight into the impacts of the road crossing. One conclusion can be made from the results: both sites contain relatively low levels of sediments, and if there are any sediment impacts associated with the crossing, the resulting levels are well below BC Water Quality Guidelines. Otherwise, the results attained to date are inconclusive with respect to evaluating the effects of the crossing on sediment levels. Automated suspended sediment monitoring may have been better suited to detecting sediment inputs due to the crossing. However, due to the low levels of interstitial sediments measured at both sites, no further monitoring at this site is recommended.
Sediment and temperature monitoring in the Lakes Forest District
3.1.1 Sites Eighteen TidbiT data loggers were deployed in streams in the Babine Forest Products Ltd. chart area between August 1 and 8, 2002. The purpose of this monitoring was to determine maximum summer water temperatures in known high value fish habitat, to monitor changes in temperature downstream of cutblocks, and to collect baseline information on creeks prior to development. Of the streams monitored, nine had been monitored in 2001, and one in 2000 and 2001. This allowed for an examination of year-to-year temperature variability. Some streams were selected to examine stream temperature responses to forest harvesting activities. In these cases, one TidbiT was placed upstream of a cut block while the second TidbiT was placed downstream of the same block. All other streams were selected to collect baseline temperature data since none currently exists. Information gathered in the office was used to find suitable locations for installation of the TidbiT data loggers. The office reconnaissance surveys involved referring to Forest Development Plan maps and Operational Stream Inventory reports obtained from Karen Grainger of Babine Forest Products Ltd. From the maps, we determined locations of potentially temperature sensitive streams and high value fish habitats. Proposed cutting permits were examined for S4-S6 streams located within or adjacent to the block. This information was used to identify sites with potential for maximum summer stream temperature impacts and where a field survey was required. Streams were also selected for background monitoring in areas where future development is planned in order to have data pre and post development. Each location was assessed for accessibility, slope, gradient, riparian management zone width, stream width, depth and volume of water. Based on all the information gathered, sites were either accepted or rejected for TidibiT temperature monitoring. Eighteen data loggers were installed in the BFP chart area in 2002. In addition, a data logger deployed in 2001 was collected in 2002. The collection of this data logger (TidbiT BFP01, in an unnamed creek at km 116.8 on the 177 Rd) was prevented in 2001 by bad weather and road conditions. Therefore we have results from a total of nineteen data loggers this year. The TidbiTs were retrieved from the streams between September 16th and 17th. All data loggers were retrieved successfully and all functioned correctly during the monitoring period.
Sediment and temperature monitoring in the Lakes Forest District
Table 4. A list of stream locations selected for temperature monitoring during the 2002 field season.
NAME DESCRIPTION
Twain Creek (TidbiT BFPS & T)
Twain Creek drains several existing cut blocks and flows into Babine Lake. TidbiT BFP S was located downstream of the crossing at 12.5 on Twain FSR, and TibdiT BFP T was placed downstream of the crossing at 68.7km on the Augier FSR. Second year of monitoring at the downstream site.
Augier 25 km (TidbiT BFP03)
This unnamed stream flows by an existing cut block and through a wetland before crossing the FSR through a culvert and then draining into Pinkut Creek downstream of Augier Lake. TidbiT was located downstream of the FSR crossing. This is the third year of monitoring for this site.
Fleming 96.9 km (TidbiT BFP17)
Unnamed stream, tributary to Fleming Creek. Fleming Main FSR km 96.9 – Stream runs from a small headwater pond eastward along the north side of Block 16302, through a culvert on the FSR. TidbiT was located upstream of the Fleming FSR. This is the second year of monitoring.
Fleming 96.0 (TidbiT BFP16)
This unnamed stream, a tributary to Fleming Creek, runs eastward through Blocks 10003, 18401 and NB003 before passing through a culvert on the FSR. The TidbiT was located upstream of the Fleming FSR. This is the second year of monitoring at this site.
Tildesley Creek (TidbiT BFP15)
Tildesley Creek flows out of Klaytahnkut Lake. TidbiT was placed upstream of bridge crossing bridge crossing on Tildesley FSR km107.6. This is the second year of monitoring at this site.
Endako 2.6 km (TidbiT BFP08) and 4.5 km (TidbiT BFP09)
Unnamed stream, headwaters of the Endako River. Endako FSR at 2.6 km - TidbiT was downstream of Block DLFP51501. Endako FSR km 4.5 – TidbiT was located upstream of Block DLFP51501. This is the second year of sampling at these sites.
Rentoul Creek (TidbiT BFP12)
Tributary to the Endako River. Taman Road km7.6 – Creek runs in a southwest direction along block DLFP51301. TidbiT was upstream of the FSR. This is the second year of sampling at this site.
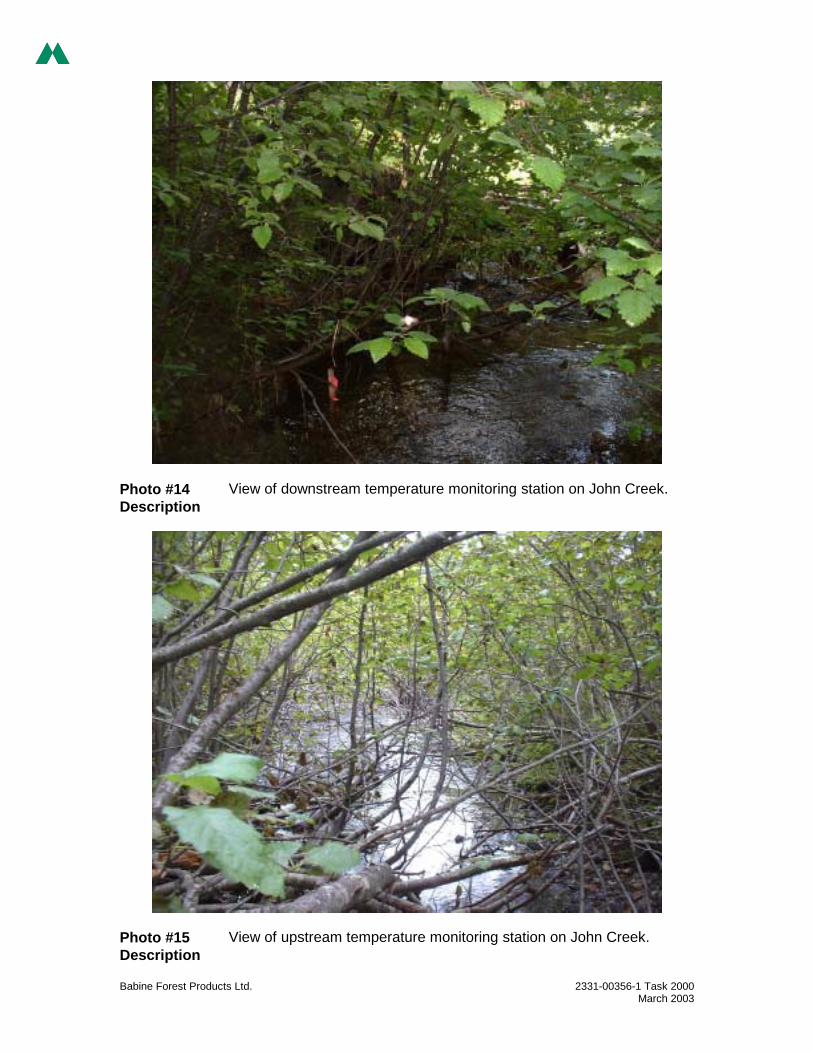
John Creek upstream (BFP19) and downstream (BFP18)
John Creek upstream: bridge crossing on Fleming Main FSR at km106.5. TidbiT was located in John Creek at the upstream edge of Block 17106. Downstream: John Creek bridge crossing on Fleming Main FSR at km106.5 – Stream runs eastward along the south side of several blocks and through block 17106. TidbiT was downstream of bridge crossing. This is the second year of sampling at the upstream site.
Tributary to John Creek (TidbiT BFP20)
Unnamed tributary to John Creek. Tributary flows into Block 18305 between BFP08 and BFP07. A spur road to the left at km 106 crosses the tributary. The TidbiT was located downstream of the crossing, within the block. This is the second year of monitoring at this site.
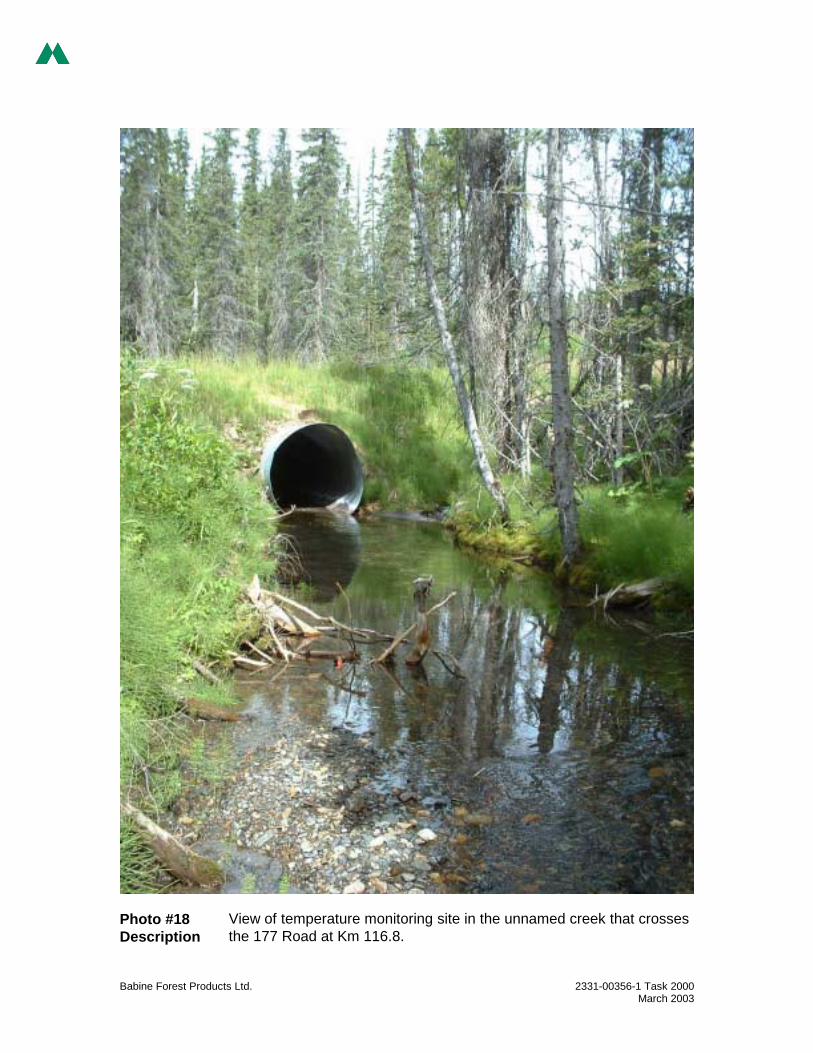
177Road km 116.8 (TidbiT BFP01)
Unnamed stream tributary to Tildesley Creek- Stream runs in a southwest direction through a culvert. TidbiT is downstream Fleming FSR.
Rip Road 112 (TidbiT L)
Unnamed stream, tributary to Tildesley Creek, flows south through a forested area without any direct logging activities. The TidbiT was located downstream of the bridge crossing. This is the second year of monitoring.
Blue Jay 45 km (TidbiT BFP04)
Unnamed creek that flows into a small lake and wetland complex that flows into Augier Lake. The TidbiT was installed upstream of the Blue Jay FSR at km 45. This is the first year of sampling at this site.
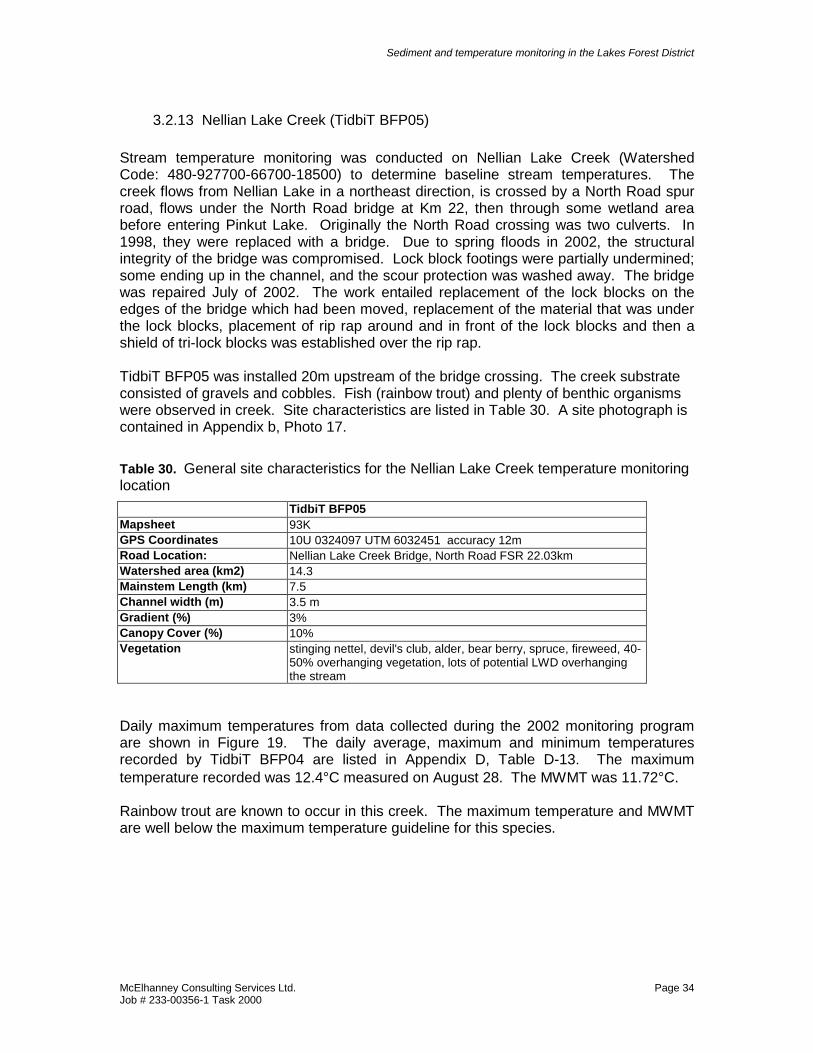
Nellian Lake Creek (TidbiT BFP05)
This creek flows out of Nellian Lake and into Pinkut Lake. The TidbiT was installed 20m upstream of the North Road FSR crossing at km 22.
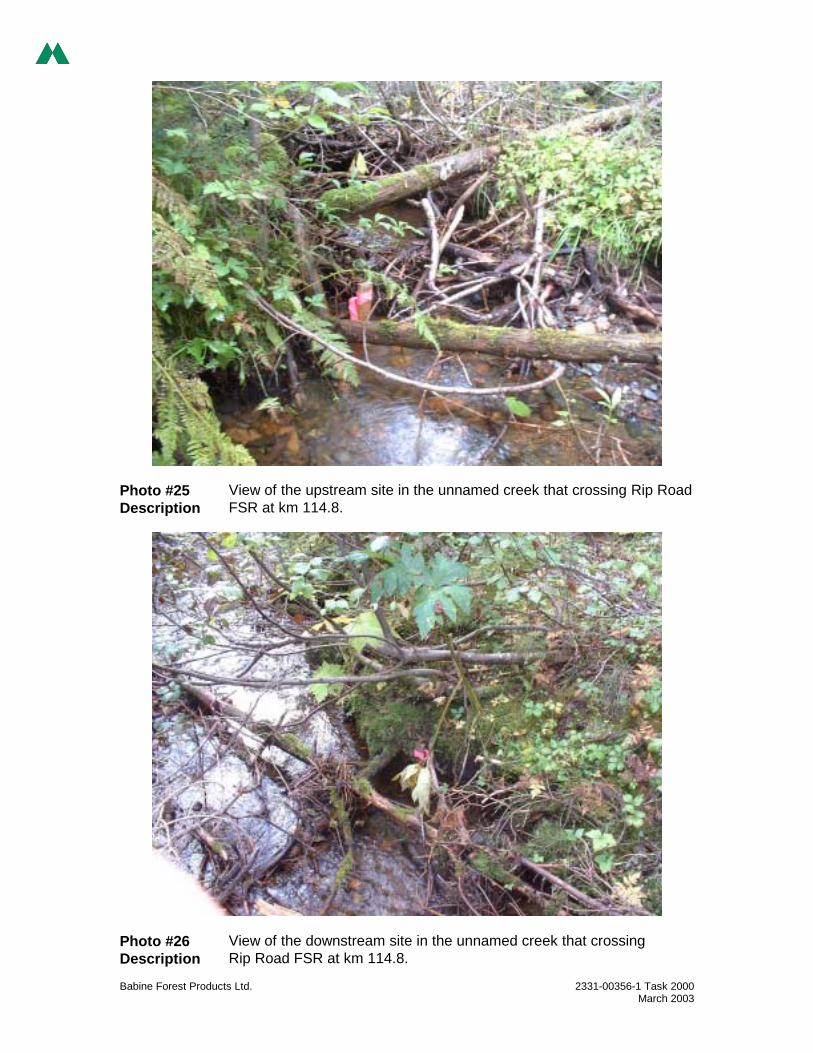
Rip Road 114.8 km (BFP13 & BFP14)
BFP13 was installed upstream of Block 17502 and BFP14 downstream of the block. The block is located at 144.8km on the Rip Road.
Ling Creek (TidbiT K)
This creek drains a series of lakes into Pinkut Creek. TidbiT K was deployed upstream of the bridge located at 30.8km on the Augier FSR.
Sediment and temperature monitoring in the Lakes Forest District
3.1.2 Equipment Self contained, waterproof, TidbiT temperature loggers were used for the 2002 field season temperature monitoring. Hardware accuracy of the TidbiT dataloggers is shown in Table 5. The optic logging system is comprised of the StowAway TidbiT temperature logger, Optic Base Station with coupler and logger software. BoxCarPro Version 3.51 computer software was used to communicate with the temperature logger. Communication was achieved by connecting the Optic Base Station to the host computer, placing the TidbiT onto the coupler and executing the software program. Then it was possible to upload the monitoring program or download the recorded data. Temperature loggers recorded the date, time in minutes and seconds and temperature to 0.01 degrees Celsius. Table 5. Hardware accuracy of Stowaway TidbiT temperature loggers.
FEATURE DETAILS Time Accuracy Logger time at room temperature may vary from the actual time as much as 1 hour
per year (100 ppm) Depth Rated to 1000 ft (330 m) Operating Range Temperature range of -20°C to +50°C Battery Life Five year battery life (not replaceable)
The daily average, maximum and minimum stream temperatures were calculated for each temperature monitoring station TidbiT. The results are presented in a table of daily average, maximum and minimum temperatures for each site. Figures were used to compare the daily maximum temperatures recorded for each TidbiT to proposed water temperature guidelines for British Columbia (Oliver & Fidler, 2001). As recommended in the proposed temperature guidelines, the mean weekly maximum temperature (MWMT) or 7-day average maximum temperature was calculated for each site in 2002. The MWMT is calculated by taking the average of the warmest daily maximum temperatures for seven consecutive days.
3.1.3 Standards The current water quality guidelines for temperature are contained in the document, Towards a Water Quality Guideline for Temperature in the Province of British Columbia (Oliver & Fidler, 2001). Temperature metrics were described using the mean weekly maximum temperature (MWMT) or the average of the warmest daily maximum temperatures for 7 consecutive days (alternatively described as the 7-day average maximum temperature). The ambient water quality guidelines for temperature developed by Oliver & Fidler (2001) are as follows: • In streams with bull trout or Dolly Varden, the maximum daily temperature is 15°C, Maximum incubation temperature is 10°C, minimum incubation temperature is 2°C, and maximum spawning temperature is 10°C.
Sediment and temperature monitoring in the Lakes Forest District
• Where fish distribution information is available, the MWMT should only vary +/- 1°C beyond the optimum temperature range of each life history phase for the most sensitive salmonids species present. The hourly rate of change is not to exceed 1°C. • Where fish distribution is unknown, the MWMT criterion is 18 °C, the maximum daily temperature criterion is 19°C, hourly rate of change should not exceed 1°C, and maximum incubation temperature should not exceed 12°C. For most streams, the fish species life-history phase of interest was rearing rainbow trout (refer to Table 6). Where other salmonids were present, incubation temperatures in August/September were considered. Table 6. Modified table (including only those species found in the study area) of the optimum temperature range of specific life history stages of salmonids and other coldwater species for BC Stream Temperature guideline application (Oliver & Fidler, 2001).
1 – data from the Generalized Fish Habitats for Regionally Important Salmonids in the Skeena Region (MELP, 2000). The 2002 stream temperature data was compared to the BC interim guidelines based on known fish species distributions (Oliver & Fidler 2001). Where fish distribution was not available MWMT values were compared to 18°C as suggested above. In other jurisdictions, non species-specific temperature guidelines are more stringent than in BC. For example, the Alaska Department of Environmental Conservation (ADEC) temperature guidelines for the protection of freshwater aquatic life are maximum 15°C for migration routes and rearing areas (ADEC, 1989). This value is non-species specific. Hass (2001) has found bull trout to be competitively excluded by rainbow trout at temperatures greater than 12°C, though this study has received some criticism (Filder 2002).
Sediment and temperature monitoring in the Lakes Forest District
3.2 Temperature Monitoring Results The mean weekly maximum temperatures (MWMT) for the 2001 temperature monitoring sites are presented in Table 7. The timing of the MWMT was almost always from August 23-29, varying only by a few days for most sites. Only the site on 177 Rd, km 116.8, was significantly different (August 8-13, 2001), but the data for this site is from 2001.
Table 7. Mean Weekly Maximum Temperature (MWMT) for the 2001 BFP field season TidbiT stream temperature monitors. Bold sites indicate that the BC Guidelines were exceeded.
DATA LOGGER (TidbiT)
MWMT (°°°°C)
MOST SENSITIVE FISH SPECIES & OPTIMUM
REARING TEMP. RANGE (°°°°C)
PROPOSED BC TEMP.
GUIDELINES
Twain Creek (BFP S and BFP T)
10.5°C us 12.0°C ds
Pink (9.3-15.5°C) Sockeye (10-15°C) Did not exceed
Augier 25 km (BFP18) 14.69°C Sockeye [Kokanee] (10-15°C) Did not exceed
Fleming 96.9 (BFP03) 12.09°C 18 °C Did not exceed
Fleming 96.0 (BFP16) 10.55°C Rainbow trout (16-18°C) Did not exceed
Tildesley Creek (BFP15) 17.90°°°°C Sockeye (10-15°°°°C) EXCEEDED Endako FSR km 2.6 (BFP08) and Endako FSR km 4.5 (BFP09)
13.5°C us 11.1°C ds Rainbow trout (16-18°C) Did not exceed
Rentoul Creek (BFP12) 13.05°C Rainbow trout (16-18°C) Did not exceed John Creek upstream (BFP19) and downstream (BFP18)
11.8°C us 13.7°C ds Rainbow trout (16-18°C)
Did not exceed, but a
concern 177 Rd. 116.8km (BFP01) 6.63°C Rainbow trout (16-18°C) Did not exceed
Tributary to John Creek (BFP20) 11.66°C 18°C Did not exceed
Rip Road FSR km 112 (TidbiT L) 10.19°C Rainbow trout (16-18°C) Did not exceed
Blue Jay FSR (BFP04) 10.12°C 18°C Did not exceed Nellian Lake Creek (BFP05) 11.72°C Rainbow trout (16-18°C) Did not exceed
Rip Road FSR km 114.8 (BFP13 and BFP14)
10.1°C us 10.5°C ds Rainbow trout (16-18°C) Did not exceed
Ling Creek (TidbiT K) 17.10°C Rainbow trout (16-18°C) Did not
exceed, but a concern
The MWMT metric for one site, Tildesley Creek (BFP15), exceeded the species specific BC MWMT temperature guidelines known fish species distribution. The MWMT value at this site was higher than the optimum rearing temperature range for sockeye salmon, the most sensitive fish species in this creek. This creek should be managed as temperature sensitive streams according to the Forest Practices Code of BC.
Sediment and temperature monitoring in the Lakes Forest District
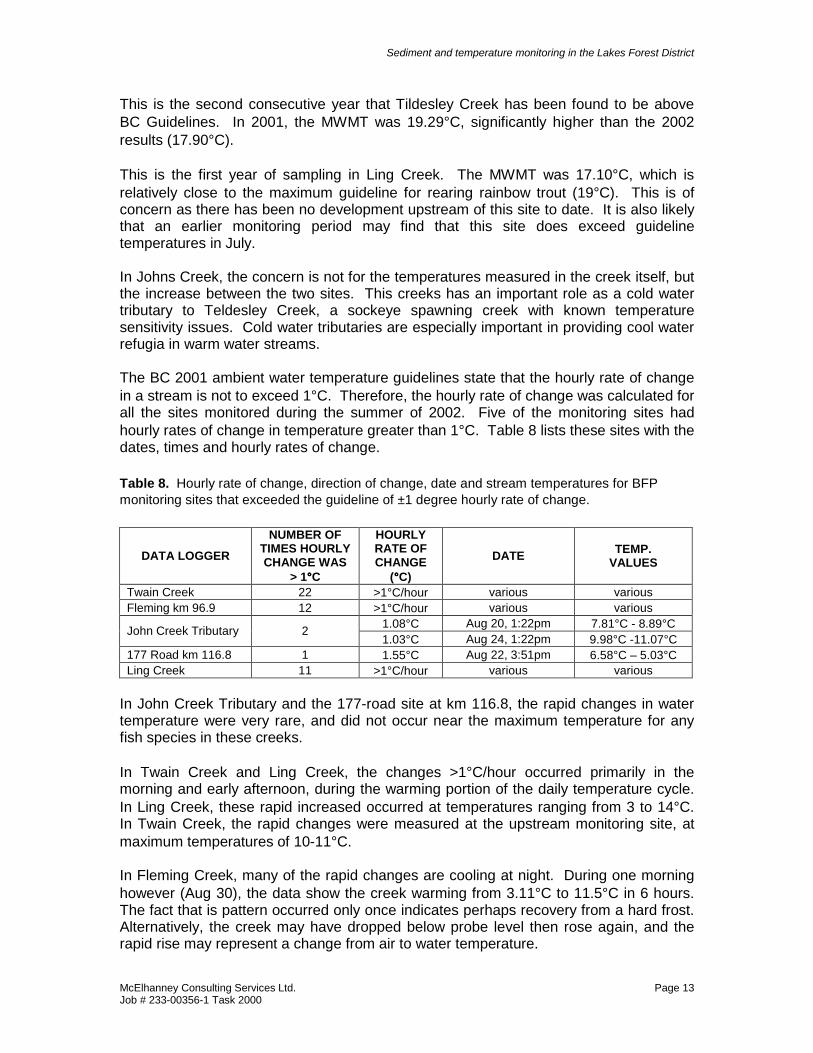
This is the second consecutive year that Tildesley Creek has been found to be above BC Guidelines. In 2001, the MWMT was 19.29°C, significantly higher than the 2002 results (17.90°C). This is the first year of sampling in Ling Creek. The MWMT was 17.10°C, which is relatively close to the maximum guideline for rearing rainbow trout (19°C). This is of concern as there has been no development upstream of this site to date. It is also likely that an earlier monitoring period may find that this site does exceed guideline temperatures in July. In Johns Creek, the concern is not for the temperatures measured in the creek itself, but the increase between the two sites. This creeks has an important role as a cold water tributary to Teldesley Creek, a sockeye spawning creek with known temperature sensitivity issues. Cold water tributaries are especially important in providing cool water refugia in warm water streams. The BC 2001 ambient water temperature guidelines state that the hourly rate of change in a stream is not to exceed 1°C. Therefore, the hourly rate of change was calculated for all the sites monitored during the summer of 2002. Five of the monitoring sites had hourly rates of change in temperature greater than 1°C. Table 8 lists these sites with the dates, times and hourly rates of change.
Table 8. Hourly rate of change, direction of change, date and stream temperatures for BFP monitoring sites that exceeded the guideline of ±1 degree hourly rate of change.
DATA LOGGER NUMBER OF
TIMES HOURLY CHANGE WAS
> 1°°°°C
HOURLY RATE OF CHANGE
(°°°°C) DATE TEMP.
VALUES
Twain Creek 22 >1°C/hour various various Fleming km 96.9 12 >1°C/hour various various
1.08°C Aug 20, 1:22pm 7.81°C - 8.89°C John Creek Tributary 2 1.03°C Aug 24, 1:22pm 9.98°C -11.07°C
177 Road km 116.8 1 1.55°C Aug 22, 3:51pm 6.58°C – 5.03°C Ling Creek 11 >1°C/hour various various
In John Creek Tributary and the 177-road site at km 116.8, the rapid changes in water temperature were very rare, and did not occur near the maximum temperature for any fish species in these creeks. In Twain Creek and Ling Creek, the changes >1°C/hour occurred primarily in the morning and early afternoon, during the warming portion of the daily temperature cycle. In Ling Creek, these rapid increased occurred at temperatures ranging from 3 to 14°C. In Twain Creek, the rapid changes were measured at the upstream monitoring site, at maximum temperatures of 10-11°C. In Fleming Creek, many of the rapid changes are cooling at night. During one morning however (Aug 30), the data show the creek warming from 3.11°C to 11.5°C in 6 hours. The fact that is pattern occurred only once indicates perhaps recovery from a hard frost. Alternatively, the creek may have dropped below probe level then rose again, and the rapid rise may represent a change from air to water temperature.
Sediment and temperature monitoring in the Lakes Forest District
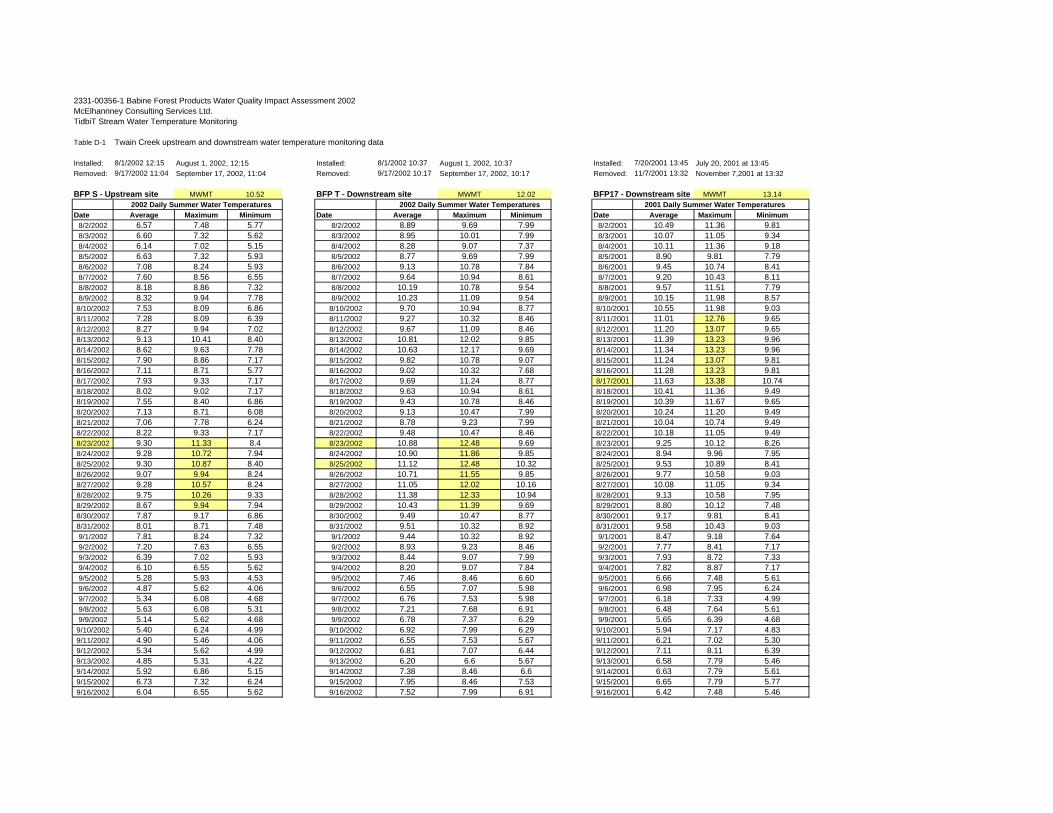
3.2.1 Twain Creek (Tidbit BFP S and BFP T) Twain Creek is a large tributary to Babine Lake with a watershed area of approximately 120 km2. Twain Creek (watershed code: 480-816400) drains a number of existing cut blocks to the south and west of Babine Lake. TidbiT S was installed 20 m downstream of a bridge crossing located at approximately 12.5 Km on the Twain FSR. TidbiT T was installed downstream of the Twain Creek bridge crossing located at approximately km 68.7 on the Augier FSR. In order to evaluate possible warming effects between these two locations, temperature data from each was compared. There are two blocks (11303 and 11403) within the watershed between the temperature monitoring locations. Twain Creek does not flow directly through either of these blocks but tributaries to Twain Creek do. Above the upstream site there are existing and approved blocks that are on tributaries to Twain Creek. The landscape between the upstream and downstream monitoring locations on Twain Creek changes from relatively open and hilly to more of a narrow gully. Between the monitoring sites there are areas, which have been identified as potentially unstable according to terrain hazard assessment mapping. The substrate in the creek also varied between the two locations. At the upstream site, the substrate consisted of cobble and gravel, with aquatic vegetation in the middle of the stream channel. At the downstream location, the substrate was bedrock with accumulations of sand and small gravels. Table 9 provides general site characteristics recorded for both locations of Twain Creek. Photos are included in Appendix B (Photos 3 & 4). The daily average, maximum and minimum temperatures recorded at Twain Creek BFP17 for 2001 and 2002 are shown in Appendix D, Table D-1. Daily maximum temperatures and MWTMs for the sampling period are shown in Figure 5. As can be seen, downstream temperatures were consistently higher than upstream temperatures during the monitoring period in 2002. The MWMT was elevated 1.5°C at the downstream site. Figure 6 shows an increase of 1.5-2.0°C in daily minimum and maximum temperatures downstream compared with the upstream site. This is the second year of monitoring at Twain Creek. In 2001, a single TidbiT was deployed at the downstream site. As with other sites, 2002 temperatures during early to mid August were lower than recorded last year during the same period. From late August onward, maximum daily temperatures are similar between years. Table 10 shows summary statistics for temperature data taken over the past two years in Twain Creek. In 2001, the TidbiT was installed in Twain Creek from July 21 to November 6, 2001. During this period the daily maximum temperature recorded in Twain Creek was +15.57°C (July 22, 2001), and the calculated MWMT value was +13.18 °C (MCL 2002). This is significantly higher than the data shown in Figure 5 and Table 10 for August 2 to September 16. In order to capture the maximum summer temperatures in this creek it is recommended that monitoring begin earlier in the year.
Sediment and temperature monitoring in the Lakes Forest District
Table 9. General site characteristics recorded for Twain Creek.
TWAIN CREEK TIDBIT S (UPSTREAM)
TWAIN CREEK TIDBIT T (DOWNSTREAM)
Mapsheet 93K and L GPS 10U 0309607 UTM 6051741,
accuracy 8m 10U 0316836 UTM 6053031, accuracy 9m
Elevation 835m 815m Road Location 12.5 kms down the Twain Creek
FSR, tidbit was 20m downstream from bridge on right bank
68.7 km on the Augier FSR, tidbit was 20m downstream from bridge on left bank.
Watershed area (km2) 25.1 88.4 Mainstem Length (km) 19 37 Channel width (m) 4.4m 10.2 m Gradient (%) 3% 2% Canopy Cover (%) 10% Lodgepole pine and trembling aspen
10% Vegetation
TidbiT S: alder, spruce, horsetail and grasses
TidbiT T: alder, devils club, spruce
3.2.1.1 Fish Habitat Fish species in Twain Creek include coho, sockeye and pink salmon, rainbow trout, kokanee and prickly sculpin (Fish Wizard, 2001). The most sensitive of these species with respect to their optimum rearing temperature ranges are pink (9.3 – 15.5) and sockeye salmon (10 – 15). Table 10 shows the maximum daily temperatures and MWMT at the Twain Creek monitoring sites from August 2 to September 16, 2001 and 2002. During this period, neither site was above BC temperature guidelines. Significant warming at the downstream site was noted however, raising some concern for this stream. Data from 2001 suggests that the monitoring period during 2002 and perhaps even 2001 may have missed the annual thermal peak. Earlier deployment of the temperature probes is required to fully evaluate maximum summer temperatures in Twain Creek. Table 10. Summary statistics of maximum stream temperature data in Twain Creek from Aug 2 to Sept 16 2000, 2001 and 2002.
Twain Creek 2001 2002
Upstream 2002
Downstream Max daily temperature 13.4 11.3 12.40 MWMT 13.1 10.5 12.02 Days >12°°°°C 7 0 4
Sediment and temperature monitoring in the Lakes Forest District
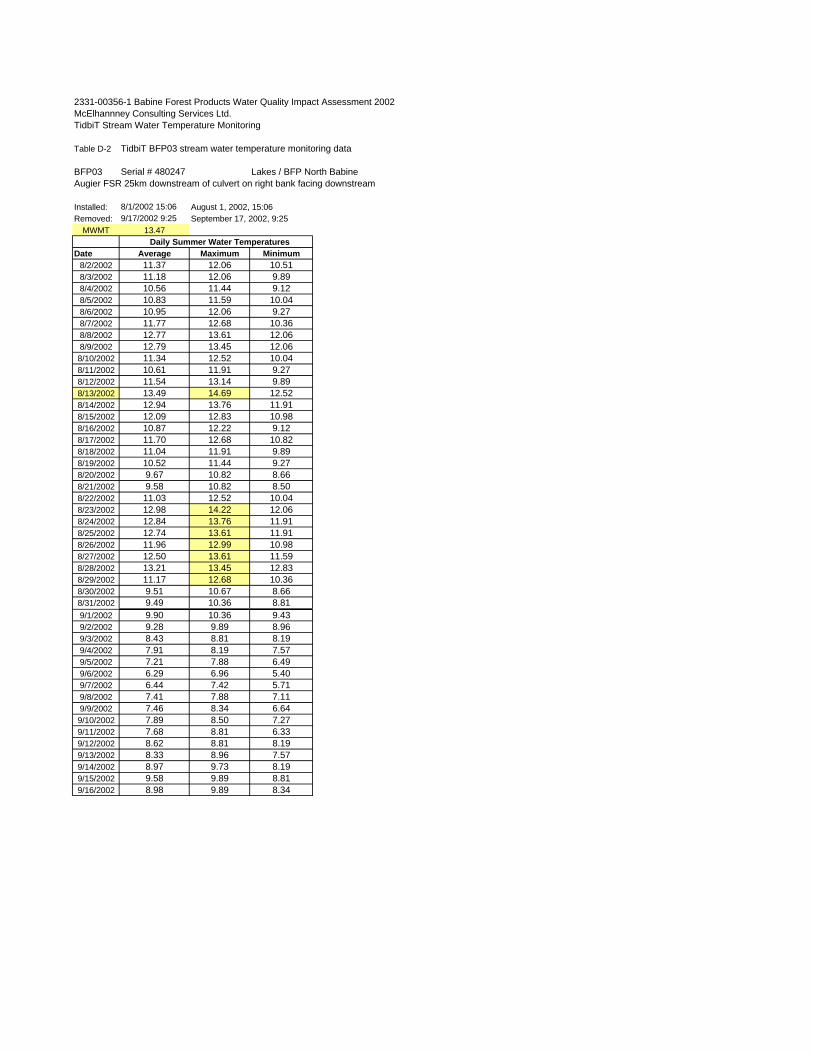
3.2.2 Augier 25 km (BFP03) This unnamed stream is a tributary to Pinkut Creek. The watershed code is: 480-927700-41700. It flows south and east through a wetland and largely undisturbed land to pass under the Augier FSR pipe arch culvert (installed fall 2000). The previous culverts were removed in August of 2000 because they were too short and road-bed material was eroding directly into the stream. Beavers damming the culverts were also a problem. The stream flows into Pinkut Creek downstream of Augier Lake. TidbiT BFP18 was installed 10 meters downstream of the road crossing from Aug 2 to Sept 16 2002. Table 11 shows general site characteristics at the TidbiT BFP03 location. Photos are included in Appendix B (Photo 5 & 6). Augier 25 km was monitored for maximum summer stream temperatures in 2000, 2001, and again this year. Figure 4 shows the maximum daily stream temperatures for all three years at Augier 25 km during the Aug 2 to Sept 16 period when all three monitors were in place. Daily average, minimum, and maximum temperatures are shown in Appendix D, Table D-2. Maximum daily stream temperatures during this period occur in early to mid August, and have shown a significant declining trend over the last 3 years. The MWMT has also decreased over this time period. From late August through September the daily maximum temperatures drop from their annual highs. During this period the numbers are very similar between years. Table 12 shows summary statistics for this site for the three years of monitoring during the period of August 2 to September 16. The trend in decreasing daily maximum temperatures is apparent in this data. In previous years, the temperature probes were deployed earlier in the season. For comparative reasons, only dates for which we have data from all three years are being discussed. In 2001, however the maximum temperature was recorded July 22, and it was the highest temperature recorded at this site (19.54°C). It is recommended that temperature probes be deployed earlier in the year at this site. Table 11. General site characteristics at the Augier 25 km TidbiT BFP03 location.
Augier km 25 - TidbiT BFP03 Mapsheet 93K GPS Coordinates 10U 0335742 UTM 6024867, accuracy 8 m Elevation 926m Road Location: Km25 on the Augier FSR, downstream from new pipe arch culvert-bridge Watershed area (km2) 16.2 km2 Mainstem Length (km) 4.06 km Channel width (m) 3.8m Gradient (%) 1% Vegetation willow, fireweed, spruce, horsetail, grasses, mosses
Sediment and temperature monitoring in the Lakes Forest District
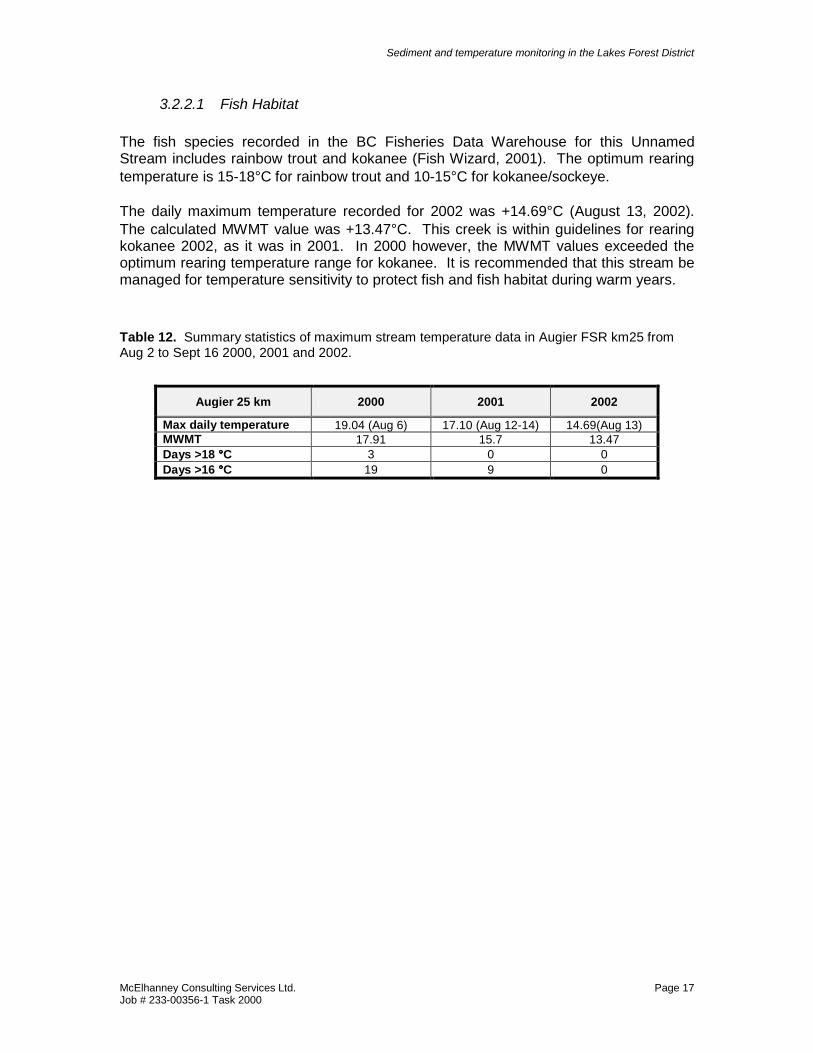
3.2.2.1 Fish Habitat The fish species recorded in the BC Fisheries Data Warehouse for this Unnamed Stream includes rainbow trout and kokanee (Fish Wizard, 2001). The optimum rearing temperature is 15-18°C for rainbow trout and 10-15°C for kokanee/sockeye. The daily maximum temperature recorded for 2002 was +14.69°C (August 13, 2002). The calculated MWMT value was +13.47°C. This creek is within guidelines for rearing kokanee 2002, as it was in 2001. In 2000 however, the MWMT values exceeded the optimum rearing temperature range for kokanee. It is recommended that this stream be managed for temperature sensitivity to protect fish and fish habitat during warm years. Table 12. Summary statistics of maximum stream temperature data in Augier FSR km25 from Aug 2 to Sept 16 2000, 2001 and 2002.
Augier 25 km 2000 2001 2002
Max daily temperature 19.04 (Aug 6) 17.10 (Aug 12-14) 14.69(Aug 13) MWMT 17.91 15.7 13.47 Days >18 °°°°C 3 0 0 Days >16 °°°°C 19 9 0
Sediment and temperature monitoring in the Lakes Forest District
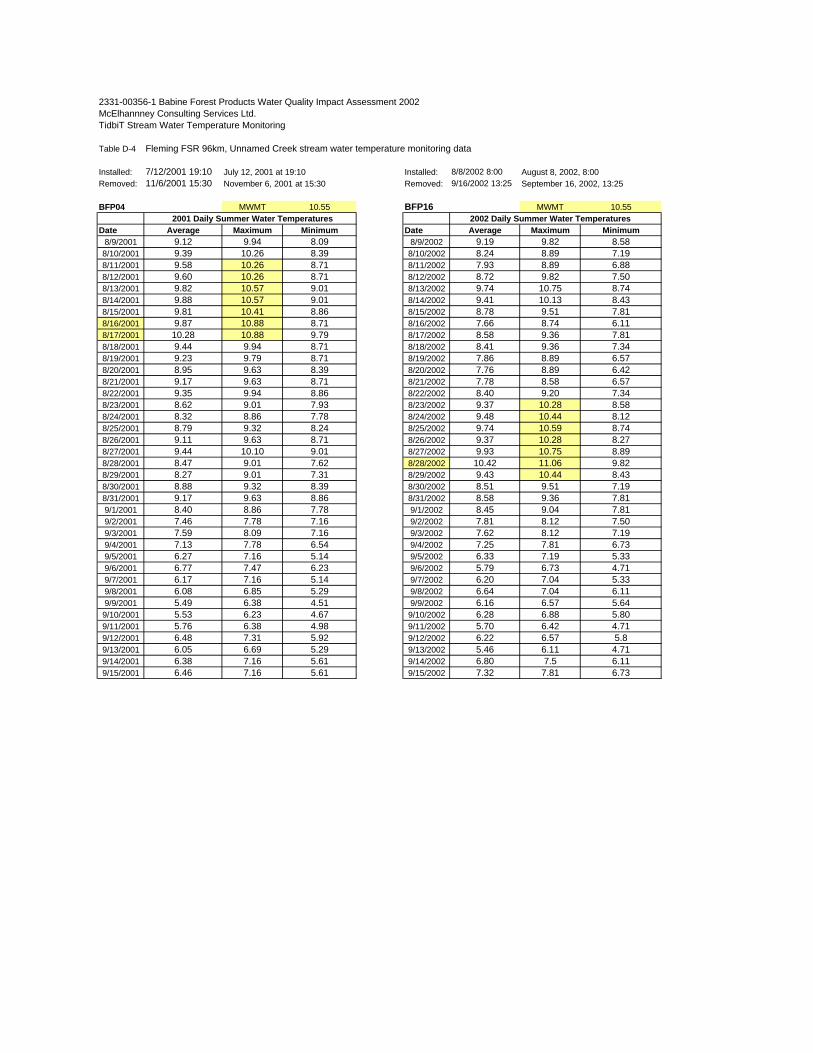
3.2.3 Fleming km 96.9 (BFP17) This unnamed stream runs from a wetland eastward along the south of Block 16202 (harvested in spring 2001), through the middle of an existing block 16603 and under the Fleming Main FSR at km 96.9. The stream is a tributary to Fleming Creek and had a 3% gradient at this location. There was a log across the stream, which has resulted in the formation of a relatively small plunge pool below. The TidbiT was installed upstream of the Fleming Main FSR in the plunge pool. Table 13 provides general site characteristics for the TidbiT BFP17 location. Site photos are contained in Appendix B, Photo 7. Table 13. General site characteristics at Fleming km 96.9, TidbiT BFP17 site.
TidbiT BFP17 Mapsheet 93K13 GPS Coordinates 10U 0329829 UTM 6071978, accuracy 9m Elevation 840 m Road Location: Fleming FSR km 96.9 Watershed area (km2) 2.06 km2 Mainstem Length (km) 3.2 km Channel width (m) 1 m Gradient (%) 3% Canopy Cover (%) Deciduous – willow, alder Vegetation Alder, ferns, rosy twisted stalk, cow parsnip, grasses, horsetail Figure 7 shows the daily maximum temperatures recorded for the unnamed stream located at km 96.9 on the Fleming Main FSR from August 8 to September 15, 2001 and 2002. The summary data during this same period is contained in Table 14 and the daily average, minimum, and maximum temperature data are contained in Appendix D, Table D-3. The data show that during the month of August, the stream was as much as 3°C different between years, but that as of September, temperature values tracked more closely between years. The maximum daily temperature was 13.07°C and MWMT 12.09°C during the monitoring period in 2002. Data from 2001 (MCSL 2002) show that the thermal maximum that year occurred in July. Earlier deployment of the temperature probes is recommended in future years.
Sediment and temperature monitoring in the Lakes Forest District
3.2.3.1 Fish Habitat The BC Fisheries Data Warehouse reports no fish have been caught in this stream and a cascade 3 m in height on this stream was considered a permanent barrier to fish passage (Fish Wizard, 2002). In 2002 the maximum daily temperature was 13.07°C, and the MWMT was 12.09°C. Both values were cooler during the same period in 2001. Neither the maximum temperature nor the MWMT for this stream was above the proposed BC guideline of 18°C. Table 14. Summary statistics of maximum stream temperature data in Fleming FSR km96.9 from Aug 2 to Sept 16 2000, 2001 and 2002.
Fleming FSR km 96.9 2001 2002
Max daily temperature 11.59 (Aug 17) 13.07 (Aug 27) MWMT 11.39 12.09 Days >18 °°°°C 0 0
Sediment and temperature monitoring in the Lakes Forest District
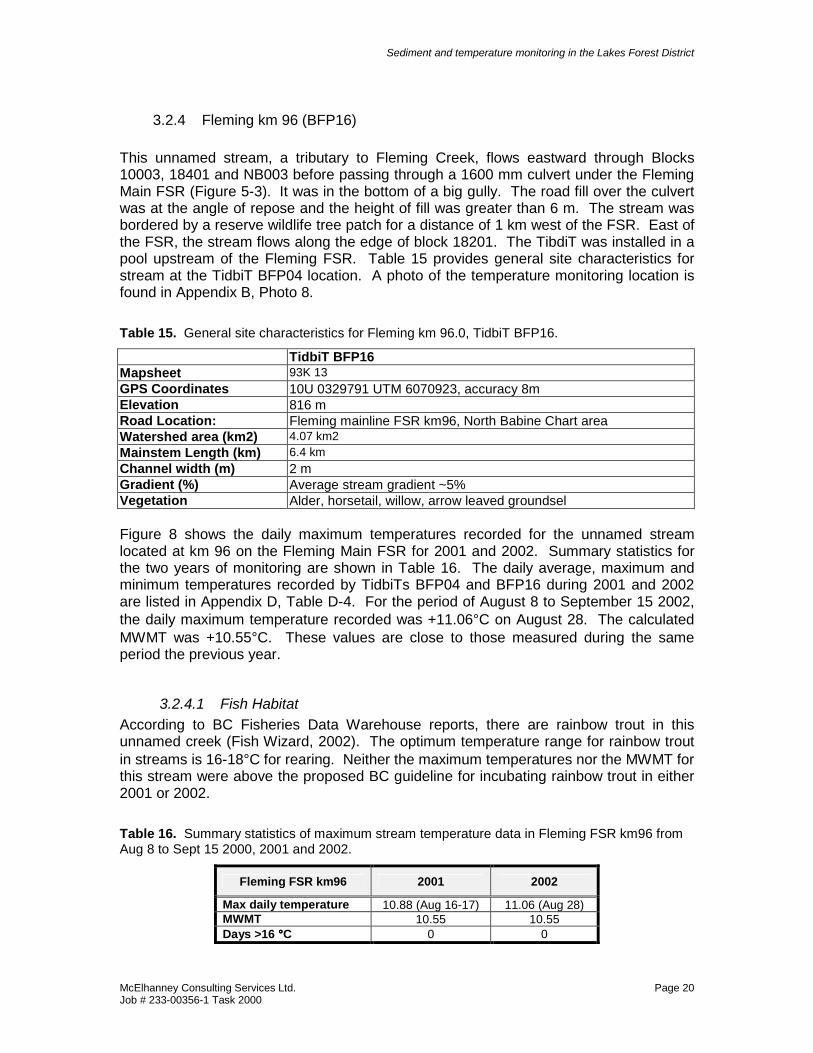
3.2.4 Fleming km 96 (BFP16) This unnamed stream, a tributary to Fleming Creek, flows eastward through Blocks 10003, 18401 and NB003 before passing through a 1600 mm culvert under the Fleming Main FSR (Figure 5-3). It was in the bottom of a big gully. The road fill over the culvert was at the angle of repose and the height of fill was greater than 6 m. The stream was bordered by a reserve wildlife tree patch for a distance of 1 km west of the FSR. East of the FSR, the stream flows along the edge of block 18201. The TibdiT was installed in a pool upstream of the Fleming FSR. Table 15 provides general site characteristics for stream at the TidbiT BFP04 location. A photo of the temperature monitoring location is found in Appendix B, Photo 8. Table 15. General site characteristics for Fleming km 96.0, TidbiT BFP16.
TidbiT BFP16 Mapsheet 93K 13 GPS Coordinates 10U 0329791 UTM 6070923, accuracy 8m Elevation 816 m Road Location: Fleming mainline FSR km96, North Babine Chart area Watershed area (km2) 4.07 km2 Mainstem Length (km) 6.4 km Channel width (m) 2 m Gradient (%) Average stream gradient ~5% Vegetation Alder, horsetail, willow, arrow leaved groundsel Figure 8 shows the daily maximum temperatures recorded for the unnamed stream located at km 96 on the Fleming Main FSR for 2001 and 2002. Summary statistics for the two years of monitoring are shown in Table 16. The daily average, maximum and minimum temperatures recorded by TidbiTs BFP04 and BFP16 during 2001 and 2002 are listed in Appendix D, Table D-4. For the period of August 8 to September 15 2002, the daily maximum temperature recorded was +11.06°C on August 28. The calculated MWMT was +10.55°C. These values are close to those measured during the same period the previous year.
3.2.4.1 Fish Habitat According to BC Fisheries Data Warehouse reports, there are rainbow trout in this unnamed creek (Fish Wizard, 2002). The optimum temperature range for rainbow trout in streams is 16-18°C for rearing. Neither the maximum temperatures nor the MWMT for this stream were above the proposed BC guideline for incubating rainbow trout in either 2001 or 2002. Table 16. Summary statistics of maximum stream temperature data in Fleming FSR km96 from Aug 8 to Sept 15 2000, 2001 and 2002.
Fleming FSR km96 2001 2002
Max daily temperature 10.88 (Aug 16-17) 11.06 (Aug 28) MWMT 10.55 10.55 Days >16 °°°°C 0 0
Sediment and temperature monitoring in the Lakes Forest District
3.2.5 Tildesley Creek (BFP15) Tildesley Creek flows out of Klaytahnkut Lake and is a tributary of Fleming Creek downstream of Fleming Lake. Fleming Creek is a major tributary to Trembleur Lake within the Fort St. James Forest District. A clear span bridge crossing is located on the Tildesley FSR at km107.6. This crossing is downstream of Klaytahnkut Lake. At the crossing, Tildesley Creek is an S2 creek, with an average wetted width of 9 m on July 13, 2001. The watershed code is: 182-819600-95800-19000. There were no steep approaches to the creek and there was a narrow right-of-way with abundant riparian vegetation. Upstream of the creek were deep pools and glides while downstream the creek narrowed. The TidbiT was installed on the left bank upstream of the bridge crossing in 2001 and 40m downstream of bridge on right bank facing downstream in 2002. Table 17 provides general site characteristics recorded at the 2002 TidbiT location. Site photos are included in Appendix B, Photo 9 & 10. Table 17. General site characteristics at Tildesley Creek, TidbiT BFP06
TidbiT BFP15 Mapsheet 93 K13 GPS Coordinates 10U 0330195 UTM 6073833, accuracy 12m Elevation 863 m Road Location: 40m downstresm of Tildesley Creek bridge crossing at Tildesley
FSR km107.6 Watershed area (km2) Estimated at 170 km2 Mainstem Length (km) 38.14 m Channel width (m) Estimated at 9 m Gradient (%) 1% Canopy Cover (%) Mature forest Vegetation Alder, grasses, horsetail Figure 9 shows the daily maximum temperatures recorded for Tildesley Creek from August 8 to September 15, in 2001 and 2002. Summary data are shown in Table 18, and the daily maximum, minimum, and average temperatures are shown in Appendix D, Table D-5. In 2002, the daily maximum temperature was 18.2°C (August 24, 25, and 27), and the calculated MWMT was 17.9°C. In 2001, the daily maximum temperature recorded was 20.31°C (August 15), and the calculated MWMT was 19.29°C.
3.2.5.1 Fish Habitat Fisheries Resources for this creek include rainbow trout and sockeye salmon (FISS, 2001). Barriers to fish passage exist upstream of Klaytahnkut Lake (FISS, 2001). DFO data has escapement data from 1993 to 2000 for Tildeslay Creek showing a maximum escapement of 2635 sockeye. The least tolerant species in the creek during the summer is migrating sockeye salmon, with an optimal range of 7.2-15.6°C. In 2002, the calculated MWMT was 17.9°C. In 2001, it was 19.29°C. Both these values are more than 1 degree above the proposed optimum temperature range for spawning sockeye salmon.
Sediment and temperature monitoring in the Lakes Forest District
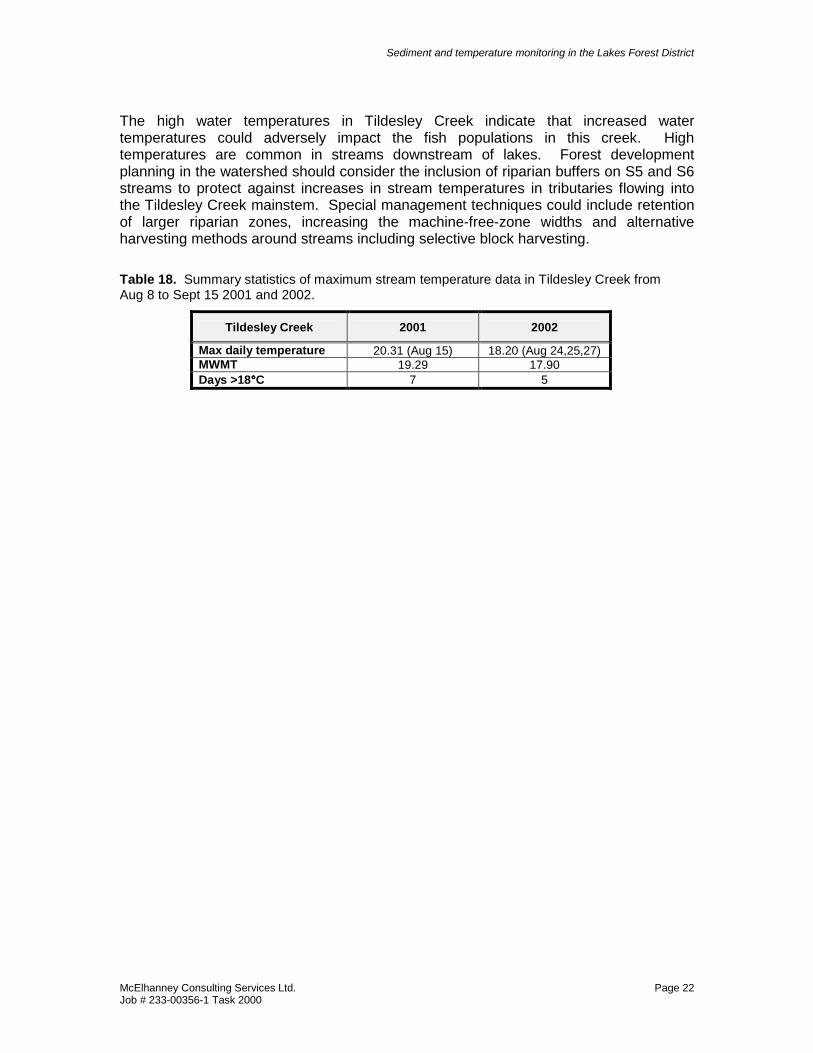
The high water temperatures in Tildesley Creek indicate that increased water temperatures could adversely impact the fish populations in this creek. High temperatures are common in streams downstream of lakes. Forest development planning in the watershed should consider the inclusion of riparian buffers on S5 and S6 streams to protect against increases in stream temperatures in tributaries flowing into the Tildesley Creek mainstem. Special management techniques could include retention of larger riparian zones, increasing the machine-free-zone widths and alternative harvesting methods around streams including selective block harvesting. Table 18. Summary statistics of maximum stream temperature data in Tildesley Creek from Aug 8 to Sept 15 2001 and 2002.
Tildesley Creek 2001 2002
Max daily temperature 20.31 (Aug 15) 18.20 (Aug 24,25,27) MWMT 19.29 17.90 Days >18°°°°C 7 5
Sediment and temperature monitoring in the Lakes Forest District
3.2.6 Endako Road km 2.6 and 4.5 (BFP08 & BFP09) Two temperature loggers were installed in an unnamed stream that is a tributary to the Endako River. The watershed code for this stream is: 180-374000-95200-01900-9975. The Endako FSR turns north from km 10.6 on the Taman FSR. The unnamed stream flows along the eastern edge of Block DLFP51501, harvested in 1999. TidbiT BFP09 was installed upstream of the block at Endako Road km 4.5, above where the stream entered the block. There are no watershed disturbances upstream of BFP09. TidbiT BFP08 was installed at Endako Road km 2.6, downstream of the block at the southeast corner. The purpose was to monitor the effects of block harvesting on stream temperatures upstream and downstream of Block 51501. At the upstream site BFP09 was deployed upstream of the 1200mm culvert at the Endako km 4.5 road crossing. The stream was boulder controlled and had a relatively high concentration of instream algae. At Endako km 2.6, BFP08 was deployed approximately 35 m downstream of the 1200 mm culvert. At the culvert, the gradient was flat. The culvert was embedded and filled with fines and small gravels. The depth of water in the culvert was approximately 20 cm. Table 19 shows general site characteristics for BFP08 and BFP09 and site photos are contained in Appendix B, Photo 11 & 12. Table 19. General site characteristics for TidbiTs BFP08 and BFP09 sites
` ENDAKO KM 2.6 TIDBIT BFP08 (DOWNSTREAM)
ENDAKO KM 4.5 TIDBIT BFP09 (UPSTREAM)
Mapsheet 93K GPS 10U 0307211 UTM 6036055
accuracy 14m 10U 0308098 UTM 6037481 accuracy 8m
Elevation 944m 1029m Road Location Taman FSR km 10.6, Endako Road
km 2.6 (culvert END08) Taman FSR km 10.6, Endako Road km 4.5, upstream of the spur road crossing.
Watershed area (km2) 5.34 4.01 Mainstem Length (km) 3.11 1.8 Channel width (m) 2 m 1 m Gradient (%) Flat gradient Canopy Cover (%) <5%, Deciduous overhanging
vegetation 85% Mature coniferous forest, 65%
Vegetation
alder, and willow, cow parsnip, grasses, twinberry - No coniferous cover
pink spirea, huckleberry, grasses, willow, twinberry, false rhododendron, lodgepole pine
Daily maximum temperature data are shown in Figure 10. Maximum temperatures recorded were 15.39°C upstream and 11.35°C downstream, on August 27 and 28 respectively. This is the second year of temperature monitoring at these sites. Summary statistics for 2001 and 2002 are shown in Table 20, and daily mean, max, and minimum temperature data are shown in Appendix D, Table D-6. Daily maximum temperature data for 2001 are shown in Figure 11.
Sediment and temperature monitoring in the Lakes Forest District
3.2.6.1 Fish Habitat The stream contains rainbow trout (Fish Wizard, 2002). Optimal temperatures for rainbow trout are 16-18 °C for rearing. Figure 10 shows a MWMT of 13.5°C and 11.1°C for the upstream and downstream sites respectively. Both sites are well within the limits for rearing rainbow trout. Figure 10 shows that upstream temperatures were generally higher than downstream temperatures in 2002. This is curious, given the cut block between the two sites and the opportunity for stream water warming. Ground water inputs are the likely cause of this counterintuitive result. Table 20. Summary statistics of maximum stream temperature data in Endako Rd creek from Aug 2 to Sept 16 2002.
Endako Rd creek Upstream Downstream
Max daily temperature 15.39 (Aug 27) 11.10 (Aug 28) MWMT 13.5 11.1 Days >18°°°°C 0 0
Sediment and temperature monitoring in the Lakes Forest District
3.2.7 Rentoul Creek (BFP12) Rentoul Creek is a tributary to the Endako River. An open bottom pipe arch culvert crossing is located on the Taman FSR at km 7.6. Rentoul Creek (watershed code: 180-374000-95200-01900-9800) is an S4 stream that had a wetted width of 1.26 m near the Taman FSR crossing on July 20, 2001. The creek flows south from an elevation of 1180 m, flows along the west edge of block DLFP51301 and continues south to the Taman FSR at km 7.6 at 800 m elevation. TidbiT BFP12 was installed 15 meters upstream of the open bottom pipe arch culvert on the Taman FSR at km 7.6. Table 21 provides general site characteristics for Rentoul Creek. Site photos are included in Appendix B, Photo 13. Table 21. General site characteristics at Rentoul Creek, TidbiT BFP14.
Rentoul Creek - TidbiT BFP12 Mapsheet 93K GPS Coordinates 10U 0308695 UTM 6032440 accuracy 8m Elevation 800 m. Maximum elevation 1180 m. Road Location: Taman FSR km 7.6 upstream FSR on left bank (facing
downstream) Watershed area (km2) 9.6 km2 Mainstem Length (km) 6.5 km Channel width (m) 1.26 m Gradient (%) 4% Vegetation Yarrow, clover, fireweed, alder, twinberry, buttercup, horsetail Figure 12 shows the daily maximum temperatures at this site between August 2 and September 19, 2001 and 2002. Daily mean, minimum and maximum values are contained in Appendix D, Table D7. The daily maximum temperature recorded at Rentoul Creek was 13.82°C (August 25) and the calculated MWMT was 13.05°C in 2002. In 2001, the maximum recorded daily temperature was +15.58°C (July 22, 2001). This suggests that for future monitoring programs, temperature probe deployment should take place earlier in the year. This would provide the opportunity to monitor stream temperatures during the rainbow trout incubation period (June-July).
Sediment and temperature monitoring in the Lakes Forest District
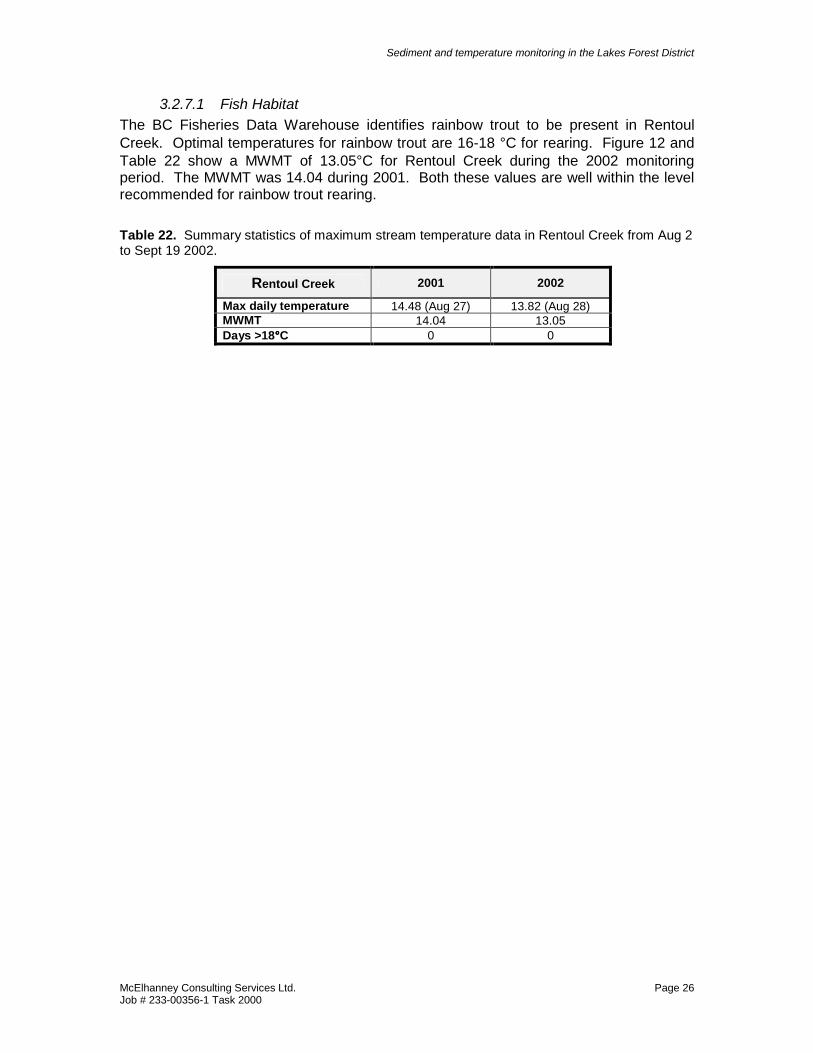
3.2.7.1 Fish Habitat The BC Fisheries Data Warehouse identifies rainbow trout to be present in Rentoul Creek. Optimal temperatures for rainbow trout are 16-18 °C for rearing. Figure 12 and Table 22 show a MWMT of 13.05°C for Rentoul Creek during the 2002 monitoring period. The MWMT was 14.04 during 2001. Both these values are well within the level recommended for rainbow trout rearing. Table 22. Summary statistics of maximum stream temperature data in Rentoul Creek from Aug 2 to Sept 19 2002.
Rentoul Creek 2001 2002
Max daily temperature 14.48 (Aug 27) 13.82 (Aug 28) MWMT 14.04 13.05 Days >18°°°°C 0 0
Sediment and temperature monitoring in the Lakes Forest District
3.2.8 John Creek (BFP18 & BFP19) The John Creek bridge crossing is located at km 106.5 on the Fleming Main FSR. John Creek (watershed code: 182-829600-95800-19000-4330) is a tributary to Tildesley Creek. The creek flows eastward along the south side of several blocks and through Bock 17106. Two temperature loggers were installed on John Creek to measure changes in stream temperatures through a harvested block with no riparian management zone (Figure 5-2). TidbiT BFP18 was located downstream of the block and the Fleming FSR. TidbiT BFP19 was installed upstream of the block. Because this was an older block, there was no riparian management zone and harvesting had occurred on this S3 stream on both stream banks. The temperature loggers were approximately 300m apart. Table 23 shows general site characteristics for each of the TidbiT locations. Site photos are contained in Appendix B, photo14 & 15. Table 23. General site characteristics for the John Creek at the Fleming FSR and upstream of the block, TidbiTs BFP18 and BFP19 respectively.
TIDBIT BFP18
(DOWNSTREAM) TIDBIT BFP19 (UPSTREAM)
Mapsheet 93K Road Location John Creek bridge crossing at
km 106.5 on the Fleming Main FSR, downstream block 17003
Upstream of the road crossing at km 106.5 and upstream block 17003
GPS 10U 0329793 UTM 6079114, accuracy 7m
10U 0329633 UTM 6079072, accuracy 8m
Elevation 893 m 891m Watershed area (km2) 24.3 km2 4.2 km2 Mainstem Length (km) 14 km 4.5 km Channel width (m) 4.3 m 3 m Gradient (%) 3% 2% Vegetation spruce, false rhododendron This is the second year of monitoring at these sites. In 2001 the downstream datalogger malfunctioned and no data was collected. 2001 and 2002 data from the upstream datalogger are shown in Figure 14 and daily mean, minimum and maximum values are contained in Appendix D, Table D9. Maximum daily temperatures and MWMT values were both roughly 2°C higher in 2001 than 2002. In 2002, data was collected in the two John Creek sites as well as a tributary (discussed in section 3.2.9). The daily maximum data over the monitoring period is shown in Figure 13. Daily mean, minimum and maximum values are contained in Appendix D, Table D8. The maximum at the upstream station was measured on August 13, 2002 (12.79°C) while the downstream maximum was approximately 2°C higher (14.89°C) and measured ten days later.
Sediment and temperature monitoring in the Lakes Forest District
3.2.8.1 Fish Habitat According to BC Fisheries Data Warehouse reports, there are rainbow trout in John Creek (Fish Wizard, 2002). Optimal temperatures for rearing rainbow trout are 16-18°C. Table 24 and Figure 13 show a MWMT of 13.73°C for the downstream John Creek site. The upstream site MWMT was about 2°C cooler. Both these values are well within the level recommended for rainbow trout rearing, however, the change in temperature between sites is of concern. This increase will be transported downstream into Tildesley Creek, a known sockeye spawning system that has been found to be temperature sensitive. Cold-water tributaries are important in warm water creeks with temperature sensitivity issues as they provide refugia during high temperature periods. Also of concern is the difference between 2001 and 2002 data for the upstream site, indicating that 2002 was a relatively cool year. In warmer years, the increase at the downstream site may be approach maximum recommended temperatures. Future harvest in the John Creek watershed should aim to reduce further increases. Table 24. Summary statistics of maximum stream temperature data in John Creek from Aug 9 to Sept 15, 2002.
John Creek Upstream 2001
Upstream 2002
Downstream 2002
Max daily temperature 14.61 (Aug 13) 12.79 (Aug 13) 14.89 (Aug 23) MWMT 14.32 11.84 13.73 Days >18°°°°C 0 0 0
Sediment and temperature monitoring in the Lakes Forest District
3.2.9 Tributary to John Creek (BFP20) TidbiT BFP20 was installed in a tributary to John Creek that flowed into Block 17003 between the two John Creek TidbiTs, BFP19 (upstream) and BFP18 (downstream). BFP18 and 19 are described in Section 3.2.8. Upstream of Block 17003, the tributary flows through Block 18305. There were no riparian zones in Block 17003 and the TidbiT monitoring location. Farther upstream there is a wildlife tree patch reserve (WTP) providing streamside riparian vegetation. The TidbiT was deployed approximately three meters downstream of the block spur road. Temperature conditions in the tributary have been compared to those recorded on John Creek. Table 25 shows general site characteristics for the TidbiT BFP20 location. A site photo is contained in Appendix B, photo 16. Table 25. General site characteristics at the tributary to John Creek BFP20 site.
TidbiT BFP20 Mapsheet 93K 13 GPS Coordinates 10U 0329695 UTM 6078981, accuracy 9m Elevation 890 m Road Location: Block upstream of John Creek bridge crossing, km 106.5 on the Fleming
Main FSR Watershed area (km2) 2.8 km2 Mainstem Length (km) 1.8 km Channel width (m) 1m Gradient (%) 2.5% Canopy Cover (%) 0% Vegetation Alder, grasses, horsetail Figure 13 compares the daily maximum temperatures recorded in John Creek (TidbiTs BFP18 and BFP19) and those recorded in the John Creek tributary (BFP20) in 2002. Daily mean, minimum and maximum values are contained in Appendix D, Table D8. The maximum temperature recorded at the tributary site was +11.84°C on August 13 compared to +12.79°C for the upstream John Creek site on the same day. The maximum temperature recorded at the downstream John Creek site was 14.89°C recorded on September 23. Throughout the monitoring period, the John Creek tributary was found to be consistently at lower temperature than both John Creek sites. The increase in temperature in the downstream John Creek site despite the cool water input from the tributary underlines the impact the removing stream side shading along John’s Creek. In 2001, the maximum daily temperatures in the upstream John Creek site and the tributary were recorded on July 22. This suggests that temperature probe deployment should take place earlier in the year than occurred in 2002. This would provide the opportunity to monitor stream temperatures during the warmest water period and during the rainbow trout incubation period (June-July). Figure 15 compares the 2001 and 2002 data for John Creek tributary during the 2002 monitoring period. Daily mean, minimum and maximum values are contained in Appendix D, Table D10. The data show no consistent difference between years in the John Creek tributary.
Sediment and temperature monitoring in the Lakes Forest District
3.2.9.1 Fish Habitat Rainbow trout are known to be present in John Creek and are assumed to be present in its tributary. The optimum rearing temperature for rainbow trout is 16-18°C. The highest recorded temperature in the tributary was 11.84°C indicting no temperature sensitivity issues in this creek. Table 26. Summary statistics of maximum stream temperature data in John Creek and the tributary creek from Aug 9 to Sept 15 2002.
John Creek Tributary 2001 2002
Max daily temperature 11.66 (Aug 13) 11.84 (Aug 13) MWMT 11.84 11.66 Days >18°°°°C 0 0
Sediment and temperature monitoring in the Lakes Forest District
3.2.10 177 Rd km 116.8 (BFP01) This unnamed stream flows into a relatively large block (Block 17703) from the north end and proceeds in a southeastward direction, flowing into Tildesley Creek in the North Babine Chart area. This unnamed stream, located northeast of Gloyazikut Creek, was the same location where MCSL carried out suspended and depositional sediment studies in 2001. The stream gully was quite open with a wide bottom (25-30 m), and gully walls approximately 3-5 m high. General site characteristics of the 177 Rd km 116.8 TidbiT are shown in Table 27. The watershed has had block harvesting of almost all the tributaries to this fish stream. The basin soils are erodible and there is evidence of flash flooding and road washouts in tributaries above the mainstem. There was a wetland 1440 m upstream from the crossing and from 1460-1480 m. Block 17704 was northwest of the site and Block 17703 was located downstream. A site photo is shown in Appendix B, photo 17. The TidbiT was installed on July 12, 2001. In attempting the retrieval in November 2001, MCSL was unable to access the 177 Rd because of unusually heavy snowfalls and trees fallen across the road. The TidbiT was retrieved July 7, 2002 and the 2001 data will be presented here. Table 27. General site characteristics at the 177 Rd km 116.8 TidbiT BFP01 site.
TidbiT BFP01 Map sheet 93K 13, TRIM 93K092 GPS Coordinates 10U 038573 UTM 6087488 accuracy 11m Elevation TidbiT 1120 m. The maximum watershed elevation is 1500 m. Road Location North side of Babine Lake, Tildesley watershed, 177 FSR km 116.8.
TidbiT is located 10m d/s from culvert on right bank. Watershed area (km2) 1.70 km2 Mainstem Length (km) 4606 m Aspect South facing Channel width (m) 3.2 m, depth 0.25 m Average stream Gradient (%): 4% Canopy Cover (%) Mature timber. lodgepole pine, sub-boreal spruce. Cover 50% Vegetation lodgepole pine, sub-boreal spruce, mosses, huckleberry, low bush
blueberry, cow parsnip, twinberry. Figure 16 shows the maximum daily temperatures and MWMT from the monitoring period from July 8 to November 15, 2002. Daily mean, minimum and maximum values are contained in Appendix D, Table D16. The maximum temperature recorded in the creek was 6.74°C on August 8, 12, and 22. The MWMT was 6.63°C. Only rainbow trout have been captured in this tributary to Tildesley Creek, approximately at this FSR crossing location (Fins, 2000). The temperatures measured in this creek are well below the BC guidelines for rainbow trout or any fish species that may in the creek during the time of year the MWMT was measured.
Sediment and temperature monitoring in the Lakes Forest District
3.2.11 Rip Road km 112 (TidbiT L) This unnamed stream flows southward through a forested area without any disturbance or logging activities in the watershed. The stream was on a south-facing slope. It is a tributary to Tildesley Creek. The TidbiT was installed on the right bank approximately 10 meters downstream of Rip road crossing. Table 28 provides general site characteristics recorded at the TidbiT location. A photo of the km 112 Rip Road site is shown in Appendix B, Photo 19. Temperature was monitored at this location in both 2001 and 2002 however in 2001 the location was reported as km113. Table 28. General site characteristics at the Rip Road km 112, TidbiT L site.
TidbiT L Mapsheet 93K 083 GPS Coordinates 10U 033284 UTM 6078937, accuracy 10m Elevation 900 m Road Location: Rip Road km 112 Watershed area (km2) 0.7 km2 Mainstem Length (km) 1.2 km Channel width (m) 2.15 m Gradient (%) 2% Vegetation Alder, horsetail, willow, arrow leaved groundsel Figure 17 shows the 2001 and 2002 daily maximum temperatures recorded for this unnamed stream at Rip Road km 112. The daily average, maximum and minimum temperatures recorded by TidbiT L are listed in Appendix D, Table D-11. In 2001, the daily maximum temperature recorded was +10.67°C on July 22, 2001. The maximum in 2002 was 10.19°C. The calculated MWMT was +10.00°C in 2001 and 10.01 in 2002. In May 2000, Fins Consulting sampled two locations and found rainbow trout in this stream, confirming the inventory work completed by RGS in 1999 (Fins, 2000). BFP identified this stream as fish bearing in their Environmental Management System. Neither the maximum temperatures nor the MWMT values for this stream was above the proposed BC guideline for rainbow trout rearing.
Sediment and temperature monitoring in the Lakes Forest District
3.2.12 Blue Jay FSR (TidbiT BFP04) The Blue Jay FSR is a relatively new road being constructed off which there will be a second spur road. An unnamed creek flowing northeast under the Blue Jay FSR was selected for temperature monitoring. TidbiT BFP04 was installed upstream of the Blue Jay Road FSR at km 45 to provide background stream temperature data. Potential future impacts to the unnamed include road crossing and forest harvesting (block 22803 –status ready to harvest) upstream of the monitoring location. The stream flows into a small lake and wetland complex, which flows into Augier Lake. Heavy vegetative cover (~90%) was observed to be overhanging the stream upstream and downstream of crossing. Streambed material was fine silt and sand with some boulder size material. Table 29. General site characteristics for the Blue Jay FSR temperature monitoring location TidbiT BFP04 Mapsheet 93K GPS Coordinates 10U 0328246 UTM 6035107 accuracy 08m Elevation 935 m Road Location: Blue Jay Road, 45km - Tibdit upstream of road Watershed area (km2) 1.3 Mainstem Length (km) 3.5 Channel width (m) 2 m Gradient (%) <2% Canopy Cover (%) 10% Vegetation Alder, spruce, fern, devil's club, horsetail Daily maximum temperatures from data collected during the 2002 monitoring program are shown in Figure 18. The daily average, maximum and minimum temperatures recorded by TidbiT BFP04 are listed in Appendix D, Table D-12. The maximum temperature recorded was 10.4°C measured on August 28. The MWMT was 10.12°C. These data show that this creek can be characterized as a cool water system pre-development.
Sediment and temperature monitoring in the Lakes Forest District
3.2.13 Nellian Lake Creek (TidbiT BFP05) Stream temperature monitoring was conducted on Nellian Lake Creek (Watershed Code: 480-927700-66700-18500) to determine baseline stream temperatures. The creek flows from Nellian Lake in a northeast direction, is crossed by a North Road spur road, flows under the North Road bridge at Km 22, then through some wetland area before entering Pinkut Lake. Originally the North Road crossing was two culverts. In 1998, they were replaced with a bridge. Due to spring floods in 2002, the structural integrity of the bridge was compromised. Lock block footings were partially undermined; some ending up in the channel, and the scour protection was washed away. The bridge was repaired July of 2002. The work entailed replacement of the lock blocks on the edges of the bridge which had been moved, replacement of the material that was under the lock blocks, placement of rip rap around and in front of the lock blocks and then a shield of tri-lock blocks was established over the rip rap. TidbiT BFP05 was installed 20m upstream of the bridge crossing. The creek substrate consisted of gravels and cobbles. Fish (rainbow trout) and plenty of benthic organisms were observed in creek. Site characteristics are listed in Table 30. A site photograph is contained in Appendix b, Photo 17. Table 30. General site characteristics for the Nellian Lake Creek temperature monitoring location TidbiT BFP05 Mapsheet 93K GPS Coordinates 10U 0324097 UTM 6032451 accuracy 12m Road Location: Nellian Lake Creek Bridge, North Road FSR 22.03km Watershed area (km2) 14.3 Mainstem Length (km) 7.5 Channel width (m) 3.5 m Gradient (%) 3% Canopy Cover (%) 10% Vegetation stinging nettel, devil's club, alder, bear berry, spruce, fireweed, 40-
50% overhanging vegetation, lots of potential LWD overhanging the stream
Daily maximum temperatures from data collected during the 2002 monitoring program are shown in Figure 19. The daily average, maximum and minimum temperatures recorded by TidbiT BFP04 are listed in Appendix D, Table D-13. The maximum temperature recorded was 12.4°C measured on August 28. The MWMT was 11.72°C. Rainbow trout are known to occur in this creek. The maximum temperature and MWMT are well below the maximum temperature guideline for this species.
Sediment and temperature monitoring in the Lakes Forest District
3.2.14 Rip Road km 114.8 (TidbiTs BFP13 and BFP14) TidbiT temperature loggers were placed in an unnamed creek, upstream and downstream of Block 17502 at km 114.8 on the Rip Road. The potential impacts of on this stream include forest harvesting and the FRS road crossing. This S4 stream is tributary to Tildesley Creek and had a wetted width of 2-3 m in August of 2002. The creek flows from an elevation of 1,310 m, in a southward direction through Block 17502. TidbiT BFP13 was installed 270 m upstream of temporary bridge crossing. TidbiT 14 was installed approximately 380 m downstream from this same crossing. Block 17502 has been harvested, leaving a reserve zone / wildlife tree patch on either side of the stream. Through the length of the block, the reserve zone is about 5-10m wide on both sides of the creek. Above the upstream site there has been no forest harvesting impacts. The stream substrate at the upstream site consists of small cobble and gravels with some fine silts while at the downstream site larger cobble (70mm), gravels and sand were observed. Table 31 provides general site characteristics for this stream. Photos are included in Appendix B, Photos 25 & 26. Table 31. General site characteristics for the Rip Road km114.8 upstream and downstream TidbiTs temperature monitoring locations
Road Location Block 17502 at km 114.8 on the Rip Road 380 m downstream of temporary bridge crossing
Block 17502 at km 114.8 on the Rip Road 270 m upstream of temporary bridge crossing
Elevation 875m 927m Watershed area (km2) 3.8km2 3.7km2 Mainstem Length (km) 9.2km 8.0km Channel width (m) 2 3 m Gradient (%) <2 >2 Canopy Cover (%) 10%. Overhanging stream vegetation ~95% Vegetation Spruce, alder, devil's club and fern Daily maximum data are shown in Figure 20. Daily mean, minimum and maximum values are contained in Appendix D, Table D-14. The daily maximum was measured at both sites on August 28. The maximums were 10.42°C upstream and 10.92°C downstream. This result reflects the general trend in the differences between these two sites. The downstream site was consistently higher than the downstream site but the difference was rarely more then 0.5°C. The MWMT for the upstream site was 10.06°C while it was 10.50°C downstream. There is no fish information for this site but the temperatures measured to date show this stream is well within the limits for any fish species that would be present at this time of year. The reserve zone on either side of the creek appears to be effective in limiting the increase in temperatures due to harvesting.
Sediment and temperature monitoring in the Lakes Forest District
3.2.15 Ling Creek (TidbiT K) In previous years temperature monitoring has occurred on streams at the outlet end of Pinkut Lake. All monitoring at the outlet end has resulted in relatively high stream temperatures. Ling Creek is an inlet of this lake. The creek flows north through Ling Lakes (of which there are two), then northwest through another small lake before it flows into Pinkut Lake. A temperature logger (TidbiT K) was installed 8m upstream of Link Creek bridge located at Km 30.8 on the Augier FSR. This site is downstream of both Ling Lakes. There has been no forest harvesting upstream of the monitoring site. Table 32 provides general site characteristics for the Ling Creek site. Table 32. General site characteristics for the Ling Creek temperature monitoring location.
TidbiT K Mapsheet 93K05 GPS Coordinates 10U 0331169 UTM 6026417, accuracy 8m Elevation 949m Road Location: 30.8 km on the Augier FSR, tidbit 8m upstream of bridge on left
bank Watershed area (km2) 38.4 Mainstem Length (km) 15.1 Channel width (m) 5m Gradient (%) 2% Canopy Cover (%) 20% Vegetation alder, grasses, spruce, horsetail, fireweed Daily maximum data are shown in Figure 21. Daily mean, minimum and maximum values are contained in Appendix D, Table D-15. The daily maximum of 17.73°C was measured on August 24. The MWMT was 17.10°C. BC Fish Wizard shows rainbow trout and burbot in Ling Creek. Rearing rainbow trout are the most sensitive species and stage in the creek at this time and have an optimal range of 16-18°C. The MWMT for Ling Creek was within the optimal range for rainbow trout. While the temperature in Ling Creek was within the guidelines for rearing rainbow trout, the MWMT was relatively high. This is presumably due to the lakes upstream as there is no forest development. This is the first year of monitoring in Ling Creek. Monitoring began on August 1st. In 2001, when temperature monitoring in other creeks began mid-July, the maximum summer temperatures were generally measured in July. Assuming that Ling Creek has similar characteristics to other creeks, we can assume that we missed the maximum summer temperatures in 2002. It is recommended that temperature monitoring in Ling Creek be conducted again in 2003, with monitoring beginning earlier in the season.
Sediment and temperature monitoring in the Lakes Forest District
3.3 Temperature Monitoring Conclusions The summer stream temperature monitoring in the Babine Forest Products chart area identified one stream, Tildesley Creek, that has water temperatures that exceed the BC Guidelines for maximum temperature thresholds for the salmonids in these stream. Another stream, Ling Creek, was found to have temperatures near guideline maximums and is identified as a stream of concern. In addition, we also identified an undesirable temperature increase in John Creek, a cold water tributary to a temperature sensitive salmon spawning stream. These watersheds should be managed for temperature sensitivity. The various land use activities in sensitive watersheds must be managed to avoid increases in summer stream temperatures.
3.3.1 Application of results The results from the 2001 and 2002 monitoring program show that streams draining lakes tend to be warmer than non-lake headed streams. While this result is hardly surprising, it bears important implications for future temperature monitoring in the Lakes Forest District. Lake headed systems should be considered temperature sensitive by default and given an increased priority for temperature monitoring to evaluate this status. This monitoring will determine the maximum summer temperatures and compare these with known fish species presence. Of the fifteen streams monitored during the 2002 season, the one that was found to be above BC guidelines (Tildesley Creeks) drained relatively large lakes. Ling Creek, which was also found to be high, drains a series of lakes. Other lake headed systems include Nellian Lake Creek, which was relatively cool with a MWMT of 11.72°C, and Augier Creek, which has a small lake and relatively large wetland in its drainage. Augier creek had higher temperatures then most other creeks monitored this year (MWMT of 14.69°C), and has been found to have temperatures up to 19°C in 2000 (Chaplin 2001). While the temperatures in John Creek are well within the guidelines for the rainbow trout present in this stream, monitoring shows a 2°C increase as the creek flows through a series of cut blocks. This system is a cold water tributary to Tildesley Creek, a sockeye spawning creek with temperature sensitivity issues. Consideration should be given to the downstream impacts of raising temperatures in John creek. Cold water tributaries to temperature sensitive streams provide important refugia for fish during high temperatures and help moderate the temperatures in the warm water system. It is recommended that once a system has been identified as temperature sensitive, all tributaries to this system should be managed for no increase in water temperatures. This is similar to the management strategy currently used for the south bank tributaries to the Nadina River. The unnamed creek crossing Rip Rd at Km 114.8 was monitored upstream and downstream of cut block 17502. The creek flows north to south on a south-facing slope through the block. A 5-10 m reserve zone 650 m in length was left around this creek as it flowed through the block. The rise in temperature through this block was only 0.5°C.
Sediment and temperature monitoring in the Lakes Forest District
This narrow reserve zone appears to have limited the increase in temperature through the block to only a modest increase.
3.3.2 Recommendations During the 2001 monitoring program, the temperature probes were deployed in late July. It was recommended in the report reviewing the 2001 results that that the probes be deployed in early June (MCSL 2002) to be certain of capturing the summer maximum temperatures. This year, the probes were deployed between August 1st and 8th. We agree with last year’s recommendation that earlier deployment of the temperature probes is necessary. There are two primary reasons for earlier deployment of the probes. First, this would allow for the capture of the true summer maximum temperatures, which appear to occur during the month of July. This is important in identifying creeks that may now appear to be marginally temperature sensitive. Second, monitoring during June and July would allow us to evaluate the water temperatures during the rainbow trout incubation period, which ends with emergence in June or July. Rainbow trout was the most common fish species identified in creeks monitored. This species has a much lower maximum range for incubating (10-12°C) than for rearing (16-18°C). This lower threshold, and the fact that we may be missing summer maximums in many of these creeks, make a very strong argument for earlier probe deployment. It is recommended that the monitoring program continue in 2003. Tildesley Creek has been identified as temperature sensitive for two consecutive years, and monitoring in this site is deemed to be no longer necessary. Creeks that are deemed important targets for monitoring are as noted above: other lake headed systems and their tributaries.
Sediment and temperature monitoring in the Lakes Forest District
4.0 References ADEC (Alasks Department of Environmental Conservation). 1989. Water quality
standards: 18AAC 70. Register 145. Anchorage, Alaska. 49p Bennett, R. 2001. A Benthic Invertebrate Index of Biological Integrity for Streams in the
Bulklley TSA. Field Season 2000. Prepared for Pacific Inland Resources, Bulkley Forest District and the Ministry of Water, Land and Air Protection.
Bevenger, G.S., and R.M. King. 1995. A pebble count procedure for assessing
watershed cumulative effects. Research Paper RM-RP-319. USDA Forest Service, Rocky Mountain Forest and Range Experiment Station, Fort Collins, Colorado. 17p.
Rysavy, S. 2000. Calibration of a Multimetric Benthic Invertebrate Index of Biological
Integrity for the Upper Bulkley River Watershed - A Tool for Assessing & Monitoring Stream Condition. Prepared by Bio Logic Consulting. Prepared for: Community Futures Development Corporation of Nadina
Dykens, T. and S. Rysavy. 1998. Operations Inventory of Water Quality and Quantity of
Rivers Ecosystems in the Skeena Region (SB96-190INV), 1997 Field Season Interim Report. Prepared for the Pollution Prevention Program, BC Environment, Skeena Region.
Cavanagh, N., R.N. Nordin, L.W. Pommen and L.G. Swain. 1994. Ambient Fresh Water
and Effluent Sampling Manual. BC MELP, Water Quality Branch. Caux P.Y ., D.R.J Moore and D.MacDonald. 1997. Ambient Water Quality Guidelines
(Criteria) for Turbidity, Suspended and Benthic Sediments. Unpublished, Water Management Branch, Ministry of Environment, Lands and Parks.
Fidler, L.E. 2002. A review of the paper “The mediated associations and preferences of
native bull trout and rainbow trout with respect to maximum water temperature, its measurement standards, and habitat.” By Gordon Hass, and its relevance to the recently developed BC water quality guideline for temperature. Prepared for MELP, Water Management Branch, Water Quality Section, Victoria. Prepared by Aspen Applied Sciences Ltd.
FINS Consulting Ltd. 2000. Operational Stream Inventories for FL A-16825 and A-
16823. Prepared for Babine Forest Products Co. FINS Consulting Ltd. 2001. 2000 Operational Stream Inventories for FL A-16823.
Prepared for Babine Forest Products Co. Government of British Columbia Fish Wizard 2001 URL: http://www.fishwizard.com/ (5
December 2001). Harper, J.L. 1999. 1998 Guidebook of impact assessment of rivers ecosystems of the
Bulkley, Morice and Lakes Districts of the Skeena Region of the Ministry of
Sediment and temperature monitoring in the Lakes Forest District
Environment, Lands and Parks, British Columbia. Prepared by AGRA Earth & Environmental Ltd., Smithers BC. Prepared for Mr. Ian Sharpe of the Ministry of Environment, Lands and Parks, Skeena Region.
Harper, J.L. 2000. 1999. Aquatic Impact Assessment of Rivers Ecosystems of the
Bulkley, Morice and Lakes Districts, Skeena Region of the Ministry of Environment, Lands and Parks, British Columbia. Prepared by AGRA Earth & Environmental Ltd., Smithers BC. Prepared for Mr. Ian Sharpe of the Ministry of Environment, Lands and Parks, Skeena Region.
Hass, G.R. 2001. The mediated association and preferences of native bull trout and
rainbow trout with respect to maximum water temperature, its measurements standards, and habitat. Bull Trout II Conference Proceedings 99-99.
Chaplin, J.L. 2001. Rivers Ecosystems East Field Season 2000 Report. Operational
Inventory of Water Quality and Quantity of Rivers Ecosystems in the of the Bulkley, Lakes and Morice Districts of the Skeena Region, Northwest British Columbia. Prepared by McElhanney Consulting Services Ltd., Smithers BC. Prepared for the Pollution Prevention Program, Ministry of Environment, Lands and Parks, British Columbia.
Kane, D.L., C.E. Belke, R.E. Gieck and R.F. McLean. 2000.Juvenile Fish Passage
Through Culverts in Alaska: A Field Study. Research sponsored by the Alaska Department of Transportation and Public Facilities.
Karr, J.R. 1981. Assessment of biotic integrity using fish communities. Fisheries 6(6): pg
21 – 27. Karr, J.R et al. 1986. Assessing Biological Integrity in Running Waters a Method and Its
Rational. Illinois Natural History Survey Special Publication 5. Major, E.B. and M.T. Barbour. 1997. Standard Operating Procedures for the Alaska
Stream Condition Index: A Modification of the U.S. EPA Rapid Bioassessment Protocols. Prepared for Alaska Department of Environmental Conservation, Anchorage, Alaska.
Newcombe, C.P and J.O.T Jensen. 1996. Channel Suspended Sediment and Fisheries:
A Synthesis for Quantitative Assessment of Risk and Impact. North American Journal of Fisheries Management 16:-693-727.
Oliver, G.G and L.E. Fidler. 2000. Towards a Water Guideline for Temperature in the
Province of British Columbia. Prepared for MELP, Water Management Branch, Water Quality Section, Victoria. Prepared by Aspen Applied Sciences Ltd.
Parker, M.A 2000. Fish Passage – Culvert Inspection Procedures, Watershed
Restoration Technical Circular No 11. Ministry of Environment, Lands and Parks. Poulin V.A and H. W. Argent. 1995. Forest Practices Code Stream Crossing Guidebook
for Fish Streams - Working Draft, 1997/98. Prepared for the Ministry of Forests
Sediment and temperature monitoring in the Lakes Forest District
Rex, J.F. and N.B. Carmichael. 2000. Guidelines for Monitoring Depositional Sediment in Streams. Field Test Edition Draft Copy. Prepared for the BC Ministry of Water, Land and Air Protection Resource Inventory Branch and the Resources Task Committee Aquatic Inventory Task Force.
Rhodes, J. J., D.A. McCullough, and F. A. Espinosa. 1994. A coarse screening process
for evaluation of the effects of land management activities on salmon spawning and rearing habitat in ESA consultations. Technical Report 94-4. Columbia River Inter-Tribal Fish Commission. 200 pp.
Zar, J. H. 1984. Biostatistical Analysis. Second Edition. Prentice-Hall Inc., New
Jersey.
Sediment and temperature monitoring in the Lakes Forest District
Figure 2. Pebble count cumulative percent frequency results from the upstream and downstream site on Nellian Creek. A z-test comparing the sample means showed a significant difference between the two sites (P < 0.0001). Both sites were well below the recommendations of < 20% surface fines < 6.3500.
Sediment and temperature monitoring in the Lakes Forest District
Figure 3. Results (average with standard deviation) of gravel bucket sediment traps in Nellian Lake Creek, installed 100m upstream and downstream of the road crossing. Due to the high variance, a single factor ANOVA analysis of the data showed no significant difference between samples for particles <6.3mm in size (p = 0.317), <2.8 mm (p = 0.212), and <2.0mm (p=0.211).
Sediment and temperature monitoring in the Lakes Forest District
Augier 25 km (TidbiTC) MWMT 2000 +17.9 C Augier 25 km (BFP18) MWMT 2001 +15.7 C Augier 25 km (BFP03) MWMT 2002 +13.5 C
+19 C +17.1 C
+14.7 C
Figure 4. Comparison between Augier FSR km25 maximum stream temperature data in Aug 2- September 16 2000, 2001 and 2002 recorded downstream of the pipe arch culvert.
Sediment and temperature monitoring in the Lakes Forest District
Figure 5. Twain Creek. Upstream (2002 only) and downstream daily maximum stream temperatures, maximum recorded temperature and MWMT value for 2001 and 2002 for the period of August 2 to September 16.
Sediment and temperature monitoring in the Lakes Forest District
Figure 6. Twain Creek. Upstream and downstream daily minimum and maximum temperature difference August 2 - September 15 2002. All values are positive, an indication of downstream warming between the sites.
Sediment and temperature monitoring in the Lakes Forest District
2001 (TidbiT BFP03) +11.39 C2002 (TidbiT BFP17) +12.09 C
13.07 C
11.59 C
Figure 7. Flemming FSR km96.9. Unnamed Creek daily maximum stream temperatures, maximum recorded temperature and MWMT value for 2001 and 2002. Data collected between August 8 - September 15.
Sediment and temperature monitoring in the Lakes Forest District
2001 (TidbiT BFP04) +10.55 C2002 (TidbiT BFP16) +10.55 C
11.06 C10.88 C
Figure 8. Flemming FSR km96. Unnamed Creek daily maximum stream temperatures, maximum recorded temperature and MWMT value for 2001 and 2002. Data collected between August 8 - September 15.
Sediment and temperature monitoring in the Lakes Forest District
Upstream site MWMT +13.5 CDow nstream site MWMT +11.1 C
15.39
11.35
Figure 10. Comparison between Endako FSR km 2.6, Block DLFP51501 upstream and downstream site maximum stream temperature data from August 2 - September 16, 2002
Sediment and temperature monitoring in the Lakes Forest District
2001Upstream site MWMT +17.9 CDownstream site MWMT +15.7 C
Figure 11. Comparison between Endako FSR km 2.6, Block DLFP51501 upstream and downstream site maximum stream temperature data from August 2 - September 16, 2001.
Sediment and temperature monitoring in the Lakes Forest District
Figure 12. Rentoul Creek. Daily maximum stream temperatures, maximum recorded temperatures and MWMT values from August 2 to September 19, 2001 and 2002 (TidbiT BFP14 2001,TidbiT BFP12, 2002).
Sediment and temperature monitoring in the Lakes Forest District
Figure 13. John Creek and John Creek tributary. Daily maximum stream temperatures, maximum recorded temperatures and MWMT values from August 9 to September 15, 2002.
Sediment and temperature monitoring in the Lakes Forest District
2001 (TidbiT BFP08) +14.32 C2002 (TidbiT BFP19) +11.84 C
12.79 C
14.61 C
Figure 14. John Creek uptream site. Daily maximum stream temperatures, maximum recorded temperature and MWMT value for 2001 and 2002. Data collected between August 8 - September 15.
Sediment and temperature monitoring in the Lakes Forest District
MWMT2001 (TidbiT BFP09) +11.46 C2002 (TidbiT BFP20) +11.13 C
11.84 C 11.66 C
Figure 15. John Creek tributary daily maximum stream temperatures, maximum recorded temperature and MWMT value for 2001 and 2002. Data collected between August 8 - September 15.
Sediment and temperature monitoring in the Lakes Forest District
2001 (TidbiT BFP05) +10.00 C2002 (TidbiT BFP L) +10.01 C
10.20 C 10.19 C
Figure 17. Rip Road km112, 10m downstream of culvert. Daily maximum stream temperatures, maximum recorded temperature and MWMT value for 2001 and 2002, August 8 to September 15.
Sediment and temperature monitoring in the Lakes Forest District
Figure 18. Blue Jay FSR km 45, upstream of the road crossing culvert. TidbiT BFP04 daily maximum stream temperatures, maximum recorded temperature and MWMT value for August 2 - September 16 2002
Sediment and temperature monitoring in the Lakes Forest District
Figure 19. Nellian Lake Creek, North Road 22.03km, upstream of bridge. TidbiT BFP05 daily maximum stream temperatures, maximum recorded temperature and MWMT value for August 2 - September 16 2002
Sediment and temperature monitoring in the Lakes Forest District
Upstream (TidbiT BFP13) +10.06 CDownstream (TidbiT BFP14) +10.50 C
+10.92 C
+10.42 C
Figure 20. Rip Road km 114.8 Block17502 upstream and downstream daily maximum stream temperatures, maximum recorded temperature and MWMT value for August 2 - September 15 2002
Sediment and temperature monitoring in the Lakes Forest District
2331-00356-1 Babine Forest Products Water Quality Impact Assessment 2002 McElhannney Consulting Services Ltd.TidbiT Stream Water Temperature Monitoring
Table D-1 Twain Creek upstream and downstream water temperature monitoring data
Installed: 8/1/2002 12:15 August 1, 2002, 12:15 Installed: 8/1/2002 10:37 August 1, 2002, 10:37 Installed: 7/20/2001 13:45 July 20, 2001 at 13:45Removed: 9/17/2002 11:04 September 17, 2002, 11:04 Removed: 9/17/2002 10:17 September 17, 2002, 10:17 Removed: 11/7/2001 13:32 November 7,2001 at 13:32
BFP S - Upstream site MWMT 10.52 BFP T - Downstream site MWMT 12.02 BFP17 - Downstream site MWMT 13.142002 Daily Summer Water Temperatures 2002 Daily Summer Water Temperatures 2001 Daily Summer Water Temperatures
2331-00356-1 Babine Forest Products Water Quality Impact Assessment 2002 McElhannney Consulting Services Ltd.TidbiT Stream Water Temperature Monitoring
Table D-3 Fleming FSR 96.9km, Unnamed tributary to Flemming Creek stream water temperature monitoring data
Installed: 7/12/2001 18:58 July 12, 2001 at 18:58 Installed: 8/8/2002 9:45 August 8, 2002, 9:45Removed: 11/6/2001 15:05 November 6, 2001 at 15:05 Removed: 9/16/2002 13:15 September 16, 2002, 13:15
BFP03 MWMT 11.39 BFP17 MWMT 12.092001 Daily Summer Water Temperatures 2002 Daily Summer Water Temperatures
2331-00356-1 Babine Forest Products Water Quality Impact Assessment 2002 McElhannney Consulting Services Ltd.TidbiT Stream Water Temperature Monitoring
Table D-4 Fleming FSR 96km, Unnamed Creek stream water temperature monitoring data
Installed: 7/12/2001 19:10 July 12, 2001 at 19:10 Installed: 8/8/2002 8:00 August 8, 2002, 8:00Removed: 11/6/2001 15:30 November 6, 2001 at 15:30 Removed: 9/16/2002 13:25 September 16, 2002, 13:25
BFP04 MWMT 10.55 BFP16 MWMT 10.552001 Daily Summer Water Temperatures 2002 Daily Summer Water Temperatures
2331-00356-1 Babine Forest Products Water Quality Impact Assessment 2002 McElhannney Consulting Services Ltd.TidbiT Stream Water Temperature Monitoring
Table D-5 Tildesley Creek 2001 & 2002 stream water temperature monitoring dataTildesley Creek at km 107.6 on the Tildesley FSR
Installed: 7/13/2001 14:30 July 13, 2001 at 14:30 Installed: 8/7/2002 16:15 August 7, 2002, 16:15Removed: 11/6/2001 13:01 November 6, 2001 at 13:01 Removed: 9/16/2002 12:25 September 16, 2002, 12:25
BFP06 MWMT 19.29 BFP15 MWMT 17.902001 Daily Summer Water Temperatures 2002 Daily Summer Water Temperatures
2331-00356-1 Babine Forest Products Water Quality Impact Assessment 2002 McElhannney Consulting Services Ltd.TidbiT Stream Water Temperature Monitoring
Table D-8 John Creek upstream (BFP18), downstream (BFP19) and tributary (BFP20) 2002 stream water temperature monitoring data
Installed: 8/8/2002 10:12 August 8, 2002, 10:12 Installed: 8/8/2002 10:35 August 8, 2002, 10:35 Installed: 8/8/2002 10:55 August 8, 2002, 10:55Removed: 9/16/2002 12:37 September 16, 2002, 12:37 Removed: 9/16/2002 12:47 September 16, 2002, 12:47 Removed: 9/16/2002 12:57 September 16, 2002, 12:57John Creek downstream John Creek upstreamBFP 18 MWMT 13.73 BFP19 MWMT 11.84 BFP20 MWMT 11.13
2002 Daily Summer Water Temperatures 2002 Daily Summer Water Temperatures 2002 Daily Summer Water TemperaturesDate Average Maximum Minimum Date Average Maximum Minimum Date Average Maximum Minimum
2331-00356-1 Babine Forest Products Water Quality Impact Assessment 2002 McElhannney Consulting Services Ltd.TidbiT Stream Water Temperature Monitoring
Table D-9 John Creek upstream site water temperature monitoring data
Installed: 7/13/2001 15:17 July 13, 2001 at 15:17 Installed: 8/8/2002 10:35 August 8, 2002, 10:35Removed: 11/6/2001 13:30 November 6, 2001 at 13:30 Removed: 9/16/2002 12:47 September 16, 2002, 12:47
BFP08 MWMT 14.32 BFP19 MWMT 11.842001 Daily Summer Water Temperatures Daily Summer Water Temperatures
2331-00356-1 Babine Forest Products Water Quality Impact Assessment 2002 McElhannney Consulting Services Ltd.TidbiT Stream Water Temperature Monitoring
Table D-10 John Creek tributary, stream water temperature monitoring data
Installed: 7/13/2001 15:25 July 13, 2001 at 15;25 Installed: 8/8/2002 10:55 August 8, 2002, 10:55Removed: 11/6/2001 14:00 November 6, 2001 at 14:00 Removed: 9/16/2002 12:57 September 16, 2002, 12:57
BFP09 MWMT 11.46 BFP20 MWMT 11.132001 Daily Summer Water Temperatures 2002 Daily Summer Water Temperatures
2331-00356-1 Babine Forest Products Water Quality Impact Assessment 2002 McElhannney Consulting Services Ltd.TidbiT Stream Water Temperature Monitoring
Table D-11 Rip Road FSR, km 112, stream water temperature monitoring data
Installed: 7/13/2001 14:08 July 13, 2001 at 14:08 Installed: 8/7/2002 17:13 August 7, 2002, 17:13Removed: 11/6/2001 12:30 November 6, 2001 at 12:30 Removed: 9/16/2002 12:06 September 17, 2002, 12:06
BFP05 MWMT 10.0 BFP L MWMT 10.012001 Daily Summer Water Temperatures 2002 Daily Summer Water Temperatures