OW OW - - OPP OPP Harmonization and Derivation of Harmonization and Derivation of Aquatic Life Screening Values: Aquatic Life Screening Values: Growers Growers ’ ’ Perspectives Perspectives Loren J. Larson Managing Partner Caltha LLP , Minneapolis, MN CropLife America and RISE 2011 Science and Regulatory Spring Conference| April 7, 2011
Transcript
OW OW -- OPPOPP Harmonization and Derivation of Harmonization and Derivation of Aquatic Life Screening Values:Aquatic Life Screening Values:
GrowersGrowers’’ PerspectivesPerspectives
Loren J. Larson Managing Partner
Caltha LLP, Minneapolis, MN
CropLife America and RISE 2011 Science and Regulatory Spring Conference| April 7, 2011
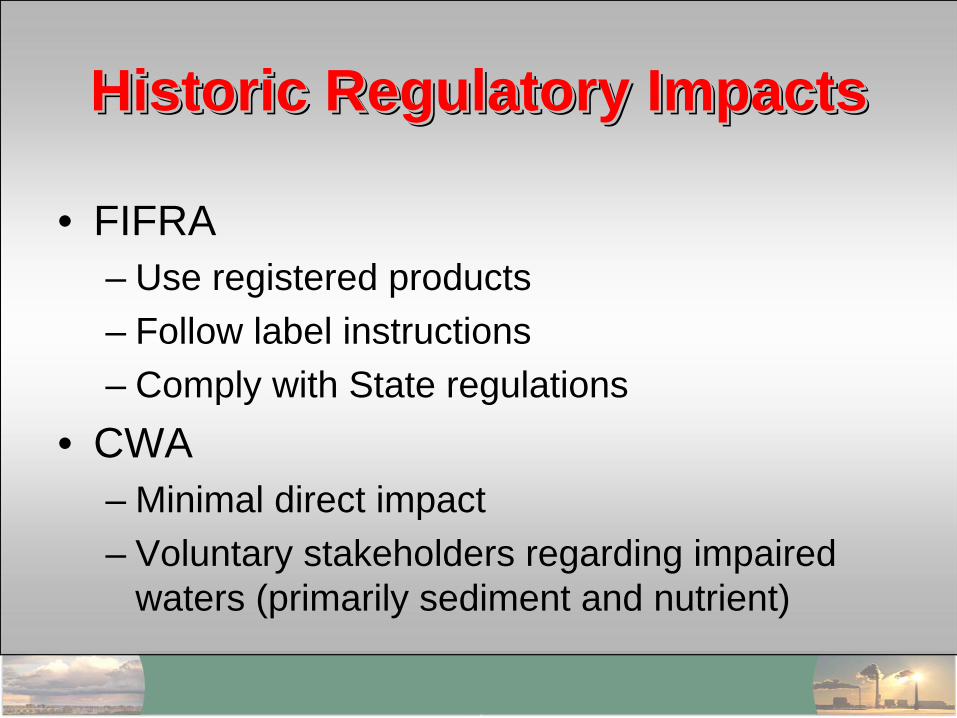
– Potential elimination of registered products based on monitoring data
– Additional label requirements or use restrictions– State restrictions, required or voluntary BMPs
• CWA– More surface waters listed as impaired due to
herbicides, insecticides, etc.– Restricted uses under State or EPA Pesticide
Application NPDES general permits– Prohibited use and discharge to listed impaired
waters
Use of WQ Benchmarks Minnesota Example
Use of WQ BenchmarksUse of WQ Benchmarks Minnesota ExampleMinnesota Example
• Minnesota Pesticide Management Plan• Selecting reference values to interpret
surface water monitoring data• Preference is to compare pesticide monitoring data
to promulgated State Water Quality Standard• In the absence of State Water Quality Standard,
“reference values” from the EPA or other states will be considered
Use of WQ Benchmarks Minnesota Example
Use of WQ BenchmarksUse of WQ Benchmarks Minnesota ExampleMinnesota Example
• If monitoring data exceed 10%-50% of reference value, “preventive measures” are considered
– Development of voluntary pesticide-specific BMPs to protect surface waters from further contamination,
• MDA has authority to take additional action to prevent any unreasonable adverse effects on the environment including impacts to surface waters,
• MDA can approve, deny or cancel the registration of any pesticide and can impose state use and distribution restrictions to prevent unreasonable adverse effects on the environment.
Areas of ConcernAreas of ConcernAreas of Concern
1. Using Screening Methods To Set Legally Enforceable Water Quality Standards
1. Using Screening Methods To Set Legally 1. Using Screening Methods To Set Legally Enforceable Water Quality StandardsEnforceable Water Quality Standards
• Intended use of ALSV to set water quality standards under CWA
“ALSVs …may be used by States and Tribes in the development of water quality standards.”, Animal paper, page 5, 24.“ALSV may be considered by USEPA, States and Tribes to derive scientifically defensible water quality standards…”,
Animal paper, page 7, 28, 29“This paper also provides a conceptual approach that may be used to integrate chemical-specific data, tools and
methods for deriving community level benchmarks (i.e., ALSVs) that may be used by USEPA, States and Tribes to derive scientifically defensible water quality criteria ”, Animal paper, page 32.
• Additional intended use of ALSV as screening tool and in risk assessment
“ALSVs may be used to screen concentrations of pesticides and effluents in ambient waters.”, Animal paper, page 5, 24;
“These additional methods may be used to augment the ability of the USEPA, as well as states, local and tribal water management agencies to derive taxa-based and cross-taxa (community-based) toxicity benchmark values for chemicals, such as pesticides, for risk assessment, monitoring and diagnostic purposes. ”, Animal paper, page 6;
“…additional tools and approaches that may be used to augment the ability of the EPA, and states, local and tribal water management agencies to derive taxa specific and cross-taxa (community) benchmark values for chemicals such as pesticides.”, Plant paper, page 5..
1. Using Screening Methods To Set Legally Enforceable Water Quality Standards
1. Using Screening Methods To Set Legally 1. Using Screening Methods To Set Legally Enforceable Water Quality StandardsEnforceable Water Quality Standards
• A method used to develop legally enforceable water quality standards needs to be more rigorous compared to a method used to develop screening values.
• Therefore, if the intent is to develop a method to derive ALSV to be used as both standards and screening values, a more rigorous analysis will be required to assure ALSV do not over or under estimate effects
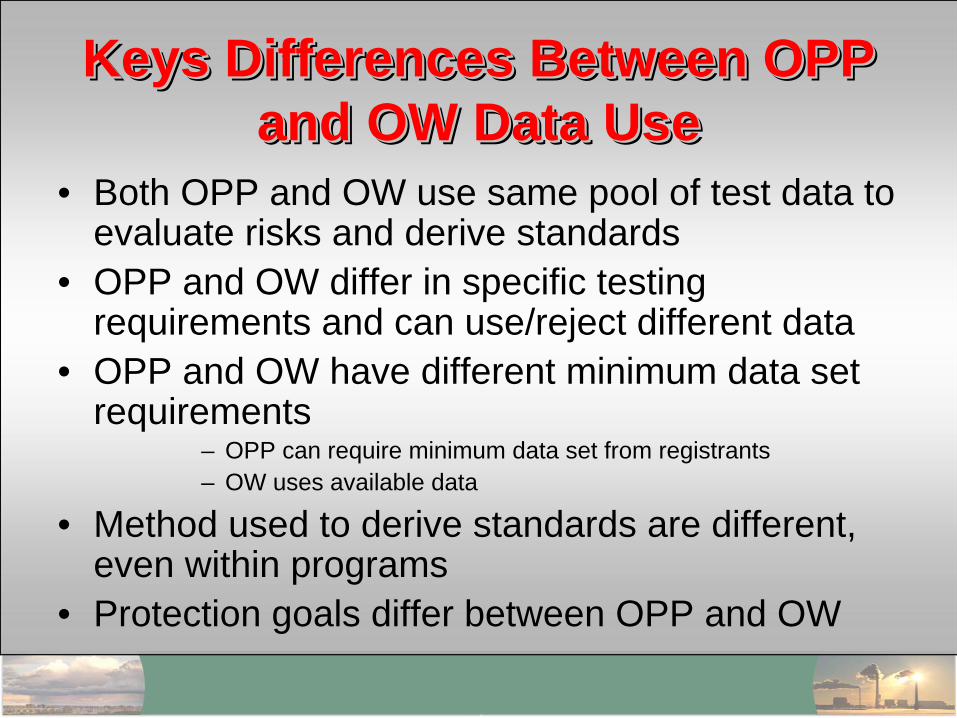
2. Data Acceptability Requirements Between OPP and OW Are Not Adequately Addressed 2. Data Acceptability Requirements Between 2. Data Acceptability Requirements Between OPP and OW Are Not Adequately AddressedOPP and OW Are Not Adequately Addressed
• Assumption that data sets used by OPP and OW are the same
“Currently, both OPP and OW rely on the same aquatic toxicity test results (e.g., scientific literature, registrant-submitted studies)”, Animal paper, page 5.
“Although the assessment endpoints of OPP and OW differ … they both rely upon similar aquatic toxicity test results. ”, Animal paper, page 6.
• Current OW data acceptance criteria exclude some data accepted by OPP
• Use of “greater than” values, used in OPP screening assessments
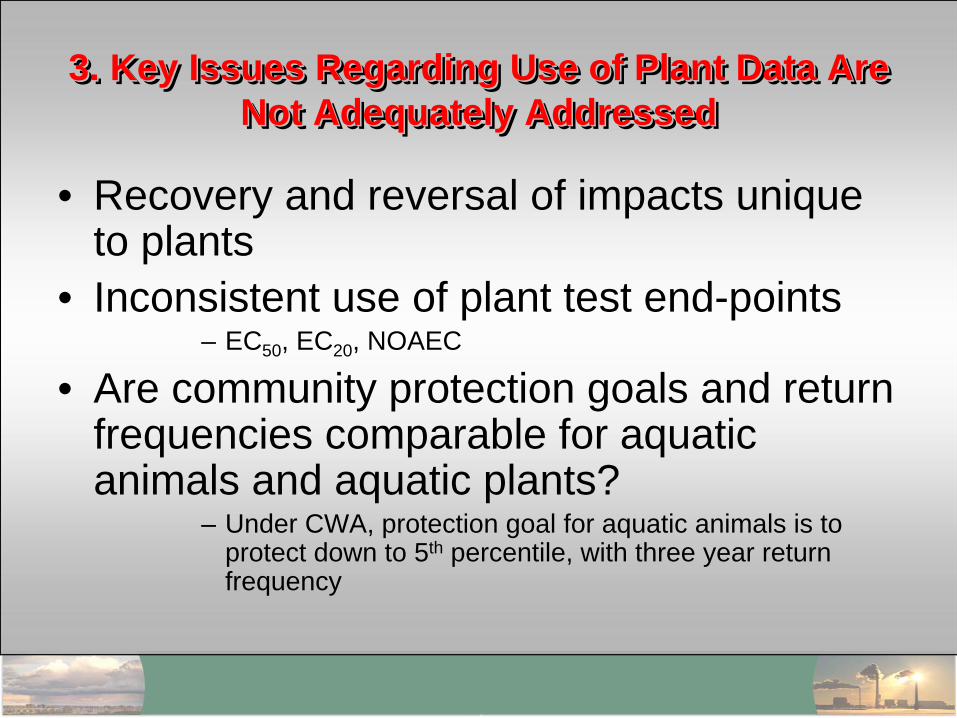
3. Key Issues Regarding Use of Plant Data Are Not Adequately Addressed
3. Key Issues Regarding Use of Plant Data Are 3. Key Issues Regarding Use of Plant Data Are Not Adequately AddressedNot Adequately Addressed
• Recovery and reversal of impacts unique to plants
• Inconsistent use of plant test end-points– EC50 , EC20 , NOAEC
• Are community protection goals and return frequencies comparable for aquatic animals and aquatic plants?
– Under CWA, protection goal for aquatic animals is to protect down to 5th percentile, with three year return frequency
4. Stated Criteria For Evaluation of Methodologies Are Inconsistent
4. Stated Criteria For Evaluation of 4. Stated Criteria For Evaluation of Methodologies Are InconsistentMethodologies Are Inconsistent
• Protection goals should be consistent with CWA– 5th percentile, 3 year recovery
• EPA describes its intent to develop a methodology that would result in a more conservative (i.e. lower) ASLV compared to a methodology that would approximate the 5th
percentile (HC5 ).• Current OW methods estimate most likely value
for HC5 ; methods are discussed to estimate lower 95th percentile confidence limit of HC5
5. Implementation and Uses of Methodologies Under FIFRA - CWA Inadequately Addressed
5. Implementation and Uses of Methodologies 5. Implementation and Uses of Methodologies Under FIFRA Under FIFRA -- CWA Inadequately AddressedCWA Inadequately Addressed
• Alternative methodologies to derive ALSV need to address intended implementation and uses of the ALSV by EPA, States and Tribes.
• Should aquatic animal and aquatic plant ALSV be used interchangeably?
• Are averaging periods equivalent?
6. Use of Predicted or Estimated Values6. Use of Predicted or Estimated Values6. Use of Predicted or Estimated Values
• In the absence of actual test data, EPA is exploring the use of predicted or calculated toxicity data, to fill some or all minimum data needs
• Concern is that, based on EPA’s assessment of the accuracy of these predictive methods, use of predicted or calculated data adds significant uncertainty to calculation of ALSVs, as well as a bias to over estimating the toxicity of chemicals.
6. Use of Predicted or Estimated Values6. Use of Predicted or Estimated Values6. Use of Predicted or Estimated Values
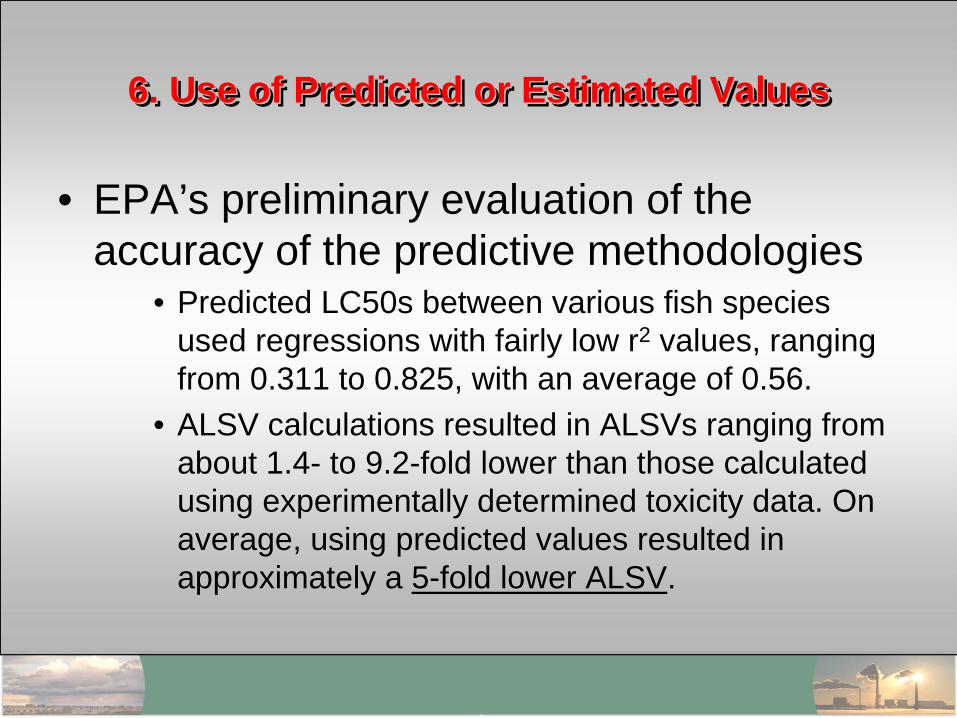
• EPA’s preliminary evaluation of the accuracy of the predictive methodologies
• Predicted LC50s between various fish species used regressions with fairly low r2 values, ranging from 0.311 to 0.825, with an average of 0.56.
• ALSV calculations resulted in ALSVs ranging from about 1.4- to 9.2-fold lower than those calculated using experimentally determined toxicity data. On average, using predicted values resulted in approximately a 5-fold lower ALSV.
7. Use of Unqualified Data and Requirement For Minimum Data Set
7. Use of Unqualified Data and Requirement 7. Use of Unqualified Data and Requirement For Minimum Data SetFor Minimum Data Set
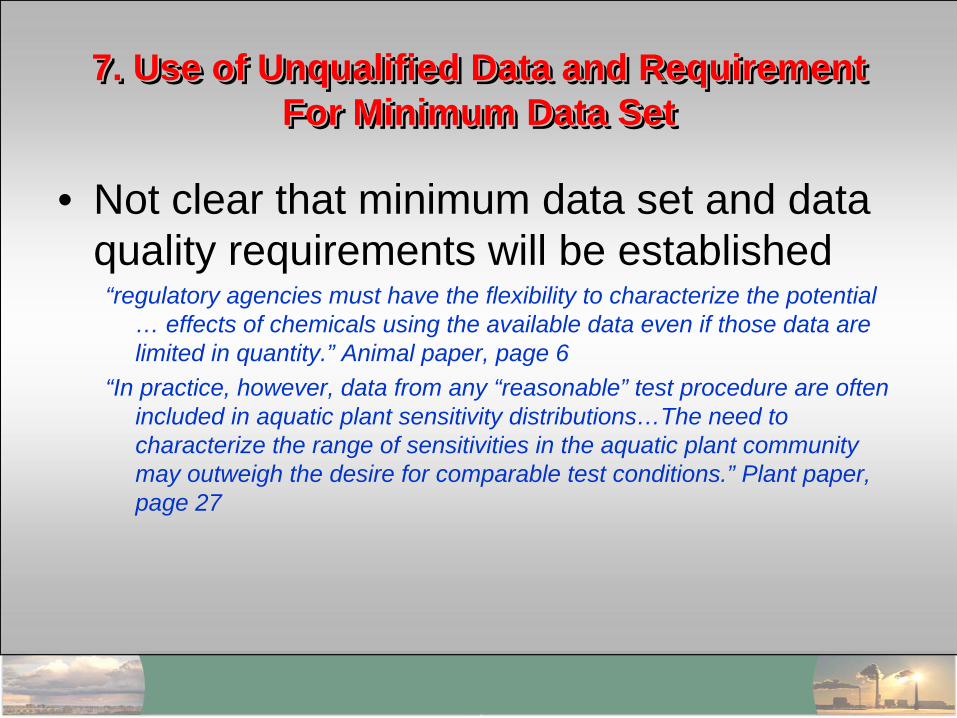
• Not clear that minimum data set and data quality requirements will be established“regulatory agencies must have the flexibility to characterize the potential
… effects of chemicals using the available data even if those data are limited in quantity.” Animal paper, page 6
“In practice, however, data from any “reasonable” test procedure are often included in aquatic plant sensitivity distributions…The need to characterize the range of sensitivities in the aquatic plant community may outweigh the desire for comparable test conditions.” Plant paper, page 27
Why should growers be concerned?
Why should growers be Why should growers be concerned?concerned?
Minnesota example – AcetochlorState Water Quality Standard 3.6 µg/L
Why should growers be concerned?
Why should growers be Why should growers be concerned?concerned?
Minnesota example – AcetochlorState Water Quality Standard 3.6 µg/L
Mean concentration (2004-2009) <0.17 µg/L • Median <0.050 µg/L • ND for 71% of samples• 2,030 samples collected 2004- 2009
% of samples exceeding WQ standard
0.4% • 9 samples collected on 4 rivers
% of samples above high range of action under MDA Pesticide Mgmt. Plan
1% • 24 samples collected on 12 rivers
% of samples above low range of action under MDA Pesticide Mgmt. Plan
9% • 187 samples collected on 34 rivers
Why should growers be concerned?
Why should growers be Why should growers be concerned?concerned?
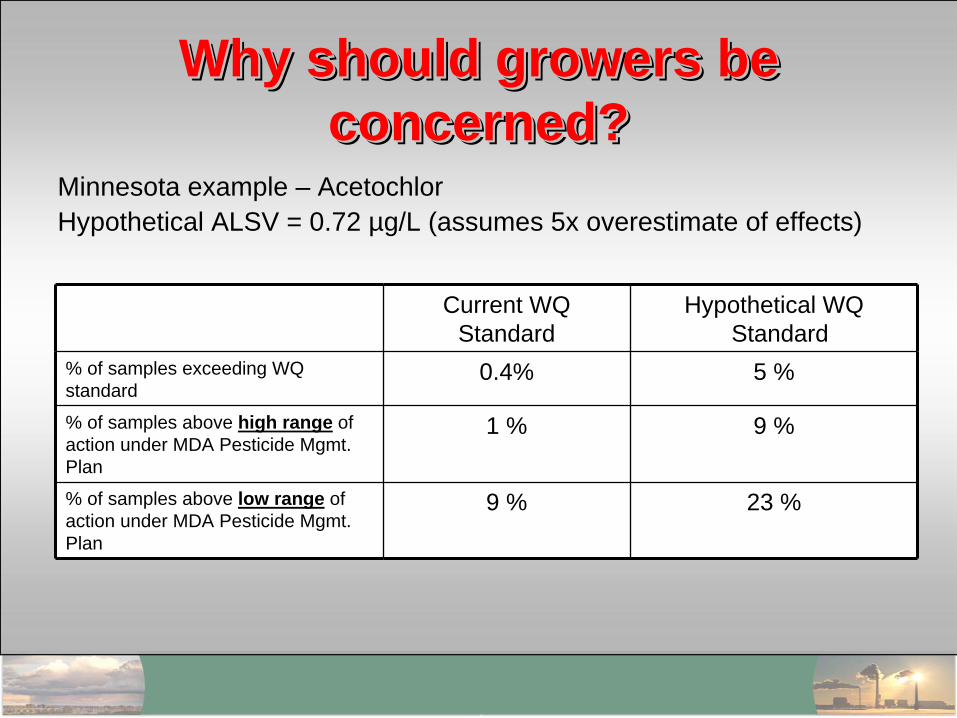
Minnesota example – AcetochlorHypothetical ALSV = 0.72 µg/L (assumes 5x overestimate of effects)
Why should growers be concerned?
Why should growers be Why should growers be concerned?concerned?
Minnesota example – AcetochlorHypothetical ALSV = 0.72 µg/L (assumes 5x overestimate of effects)
Current WQ Standard
Hypothetical WQ Standard
% of samples exceeding WQ standard
0.4% 5 %
% of samples above high range of action under MDA Pesticide Mgmt. Plan
1 % 9 %
% of samples above low range of action under MDA Pesticide Mgmt. Plan