+ All Categories
Home > Documents > Derivative Valuation and GASB 53 Compliance Report For · PDF fileSchedule D. GASB 53 Results...

Derivative Valuation and GASB 53 Compliance Report For · PDF fileSchedule D. GASB 53 Results...

Date post: 19-Mar-2018
Category:
Upload: nguyendang
View: 215 times
Download: 1 times
Share this document with a friend
20
Derivative Valuation and GASB 53 Compliance Report For the Period Ending September 30, 2015 Prepared On Behalf Of Broward County, Florida October 9, 2015 BLX Group LLC 777 S. Figueroa Street, Suite 3200 Los Angeles, CA 90017 213 612 2200 PH 213 612 2499 FX www.blxgroup.com
Transcript

Derivative Valuation and GASB 53 Compliance Report

For the Period Ending September 30, 2015

Prepared On Behalf Of

Broward County, Florida

October 9, 2015

BLX Group LLC777 S. Figueroa Street, Suite 3200

Los Angeles, CA 90017213 612 2200 PH213 612 2499 FX

www.blxgroup.com

Broward County, FloridaDerivative Valuation and GASB 53 Compliance Report

For the Period Ending September 30, 2015

DERIVATIVE VALUATION AND GASB 53 COMPLIANCE REPORT

TABLE OF CONTENTS

1 Transmittal Letter

2 Notes, Assumptions, and Disclaimer Information

3 Report Section I – Summary of Transactions 5-9Schedule A. GASB 53 Accounting SummarySchedule B. Transaction Accounting ClassificationsSchedule C. Hedged ItemsSchedule D. GASB 53 Results – Hedging DerivativesSchedule E. Transaction Market Valuations

4 Report Section II – Transaction Analysis Detail 10-18

5 Appendix – Hedging Allocation 19

6 Exhibit – Suggested Journal Entries 20

October 9, 2015

Ms. Leah BrassoDirector of FinancePort Everglades Department1850 Eller DriveFort Lauderdale, FL 33316

Re: Derivative Valuation and GASB 53 Report For the Period EndingSeptember 30, 2015 ( the "Reporting Period")

BLX Group LLC is pleased to provide the attached Derivative Valuation and GASB 53 Compliance Report (the “Report”) for the benefit of Broward County, Florida (the "County") in connection with the Government Accounting Standards Board Statement No. 53 – Accounting and Financial Reporting for Derivative Instruments ("GASB 53"). Pursuant to the terms of our engagement, we have analyzed each of the transactions listed on Schedule A hereto (each, a “Transaction,” which is, in whole, or in part, a “Derivative Instrument” as defined in GASB 53) pursuant to the procedural guidelines and provisions of GASB 53.

Generally, the objective of GASB 53 is to enhance the usefulness and comparability of derivative instrument information reported by state and local governments. Under GASB 53, instruments, in whole or in part, such as interest rate swaps and similar transactions that fall under the definition of Derivative Instruments must be reported on the statement of net assets, the classification of which depends on whether they represent assets or liabilities, and Derivative Instruments generally should be measured at "Fair Value." In addition, Derivative Instruments that are potential hedging instruments may be determined to be either "Effective" or "Ineffective." If a Derivative Instrument is determined to be Effective, changes in Fair Value are reported as deferred outflows or inflows of resources, and, if a Derivative Instrument is determined to be Ineffective, changes in fair value are reported within the investment revenue classification on the flow of resources statement.

In this Report we have undertaken the analyses and calculations to determine the appropriate recognition and measurement of the County's Derivative and Related Instruments, and, if applicable, any related instruments. Our findings are summarized in Report Section I, Schedules A through E and the supporting calculations and analyses are provided in Report Section II and the related Appendix and Exhibit.

The Report is based on information available to us as of the end of the Reporting Period, and therefore may be inapplicable thereafter. Please see the attached Notes, Assumptions, and Disclaimer Information attached. We have no obligation to inform you if and when information used in the Report has changed or new information becomes available to us. We have no obligation to update this Report delivered herewith because of any events occurring, changes in existing laws, regulations, or rulings or interpretations thereof, or data or information received, subsequent to the date hereof.

This Report is not to be used, circulated, quoted, referred to, or relied upon by any other person without the express written permission of BLX or the County.

Very truly yours,

BLX Group LLC

Broward County, FloridaDerivative Valuation and GASB 53 ReportFor the Period Ending September 30, 2015

NOTES, ASSUMPTIONS, AND DISCLAIMER INFORMATION

For purposes of the Report, Fair Value (or “Market Value” as that term is used in the Report) was determined as of the market close or end of business on the last day of the Reporting Period (or if such day is not a business day, the preceding business day), or the date that is otherwise indicated. Our determination of Market Value utilizes “mid-market” interest rates and/or securities prices (i.e., the mean between the bid and offer prices) available to us from public and subscription sources and which we believe to be reliable. Accordingly, Market Values set forth on the Report (a) do not necessarily reflect the actual dollar amount that the counterparty to each such Derivative Instrument would pay, or require to be paid, to terminate each Derivative Instrument, or that a third party would pay or require to be paid to accept assignment of such Derivative Instrument, and (b) do not reflect any transaction costs that might be incurred in effecting a disposition (termination), in whole or in part, of the Derivative Instrument.

The methodologies employed in the Report are based on what we believe to be widely accepted industry standard valuation models. Expected future cash flows from Derivative Instruments are valued using the discounted cash flow methodology, which considers the net present value of the future payments from payments to be made or received under the swap. The present value of a “fixed leg” is calculated as the sum of the present values, as of the computation date, of the payment amounts (computed at the fixed swap rate) expected to be paid over the scheduled term of the swap. The value of a “floating leg” is calculated as the sum of the present values, as of the valuation date, of the floating leg payment amounts expected to be paid over the scheduled term of the swap. The floating leg coupon rates are based on the forward rates derived from the relevant interest rate swap yield curve data (e.g., LIBOR, SIFMA, etc.) as of the valuation date. The present value discount factors for each future payment date is determined by the LIBOR swap curve data using the zero coupon method. The fixed swap rate, which may be adjusted for estimated bid-ask and other spread components, that would produce a net present value of $0, is the “On-Market Rate,” and the difference between the actual fixed and the On-Market Rate is the “Off-Market Rate Component.” On-Market Rates may be expressed differently for different types of Derivative Instruments. In certain circumstances when On-Market Rates or related information is required to perform the calculations in the Report, at your direction, BLX will rely upon information previously determined (e.g., in a tax or related certificate) that is provided to us.

From your perspective, if the net present value is negative, the Derivative Instrument is a liability, and, if positive, the Derivative Instrument is an asset. Outstanding loans, bonds, or other fixed yield liabilities are expressed as positive numbers. The Report may also include certain information other than the Market Value of each Derivative Instrument, including calculations and information related to compliance with GASB and/or FASB pronouncements, as well as other supplemental information.

Note that certain information and calculations provided in the Report may be based on historical information, estimates of future performance and other assumptions that may not be realized. Actual events may differ from those assumed and changes to any assumptions may have a material impact on any projections or estimates. Other events not taken into account may occur and may significantly affect the projections or estimates contained or implied in the Report.

DERIVATIVE VALUATION AND GASB 53 COMPLIANCE REPORT REPORT SECTION I

FOR THE PERIOD ENDING SEPTEMBER 30, 2015 SUMMARY OF TRANSACTIONS

BROWARD COUNTY, FLORIDA

Schedule A. GASB 53 Accounting Summary

ID Description 9/30/2014 9/30/2015Change in

Value

Assets:

Deferred outflows on derivative instruments

1 46.145MM Goldman (3,991,460.93) (4,895,428.67) (903,967.74)

Total (3,991,460.93) (4,895,428.67) (903,967.74)

Liabilities:

Derivative instruments

1 46.145MM Goldman (3,991,460.93) (4,895,428.67) (903,967.74)

Total (3,991,460.93) (4,895,428.67) (903,967.74)

5

DERIVATIVE VALUATION AND GASB 53 COMPLIANCE REPORT REPORT SECTION I

FOR THE PERIOD ENDING SEPTEMBER 30, 2015 SUMMARY OF TRANSACTIONS

BROWARD COUNTY, FLORIDA

Schedule B. Transaction Accounting Classifications

ID DescriptionGASB 53 TransactionClassification

GASB 53 DerivativeClassification

1 46.145MM Goldman Derivative InstrumentDerivative Consists of Hedging Portion Only

6

DERIVATIVE VALUATION AND GASB 53 COMPLIANCE REPORT REPORT SECTION I

FOR THE PERIOD ENDING SEPTEMBER 30, 2015 SUMMARY OF TRANSACTIONS

BROWARD COUNTY, FLORIDA

Schedule C. Hedged Items

ID Description Hedged Item Hedging Objective

1 46.145MM Goldman

$46,145,000

Broward County, Florida

Refunding Revenue Bonds, Series 2008

To hedge changes in the benchmark interest rate, i.e. SIFMA, that will adversely affect the cash flows of the Hedged Item.

7

DERIVATIVE VALUATION AND GASB 53 COMPLIANCE REPORT REPORT SECTION I

FOR THE PERIOD ENDING SEPTEMBER 30, 2015 SUMMARY OF TRANSACTIONS

BROWARD COUNTY, FLORIDA

Schedule D. GASB 53 Results – Hedging Derivatives1

1 Referred to as “Deferred outflows (or inflows, as applicable) on derivative instrument” in Broward County’s CAFR and Port Everglades’ Audited Financial Report.2 REG – Regression analysis method

ID Description

Hedging Derivative

Value as of 9/30/2014

Hedging Derivative

Value as of 9/30/2015

Change in Value

Evaluation Method2

GASB 53 Result

1 46.145MM Goldman (3,991,460.93) (4,895,428.67) (903,967.74) REGEffective-Deferred

Total (3,991,460.93) (4,895,428.67) (903,967.74)

8

DERIVATIVE VALUATION AND GASB 53 COMPLIANCE REPORT REPORT SECTION I

FOR THE PERIOD ENDING SEPTEMBER 30, 2015 SUMMARY OF TRANSACTIONS

BROWARD COUNTY, FLORIDA

Schedule E. Transaction Market Valuations3

ID Description

Market Value as of

9/30/2014

Market Value as of

9/30/2015Change in

Value

1 46.145MM Goldman (3,991,460.93) (4,895,428.67) (903,967.74)

Total (3,991,460.93) (4,895,428.67) (903,967.74)

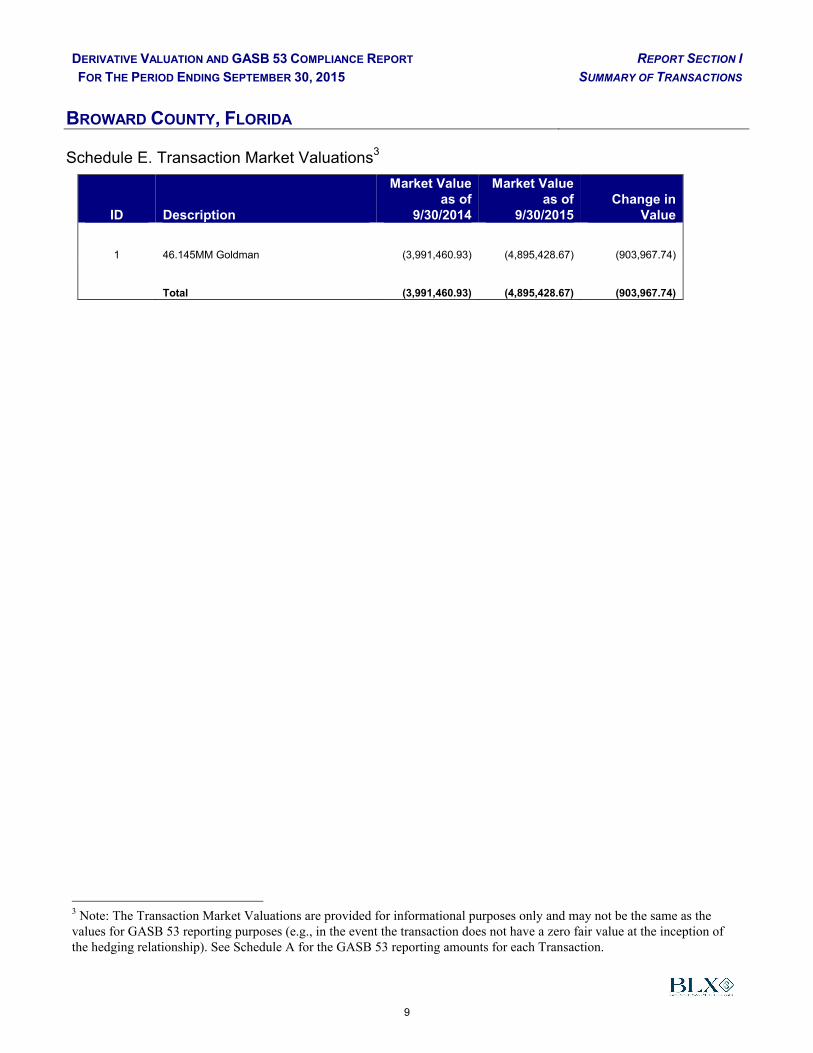
3 Note: The Transaction Market Valuations are provided for informational purposes only and may not be the same as the values for GASB 53 reporting purposes (e.g., in the event the transaction does not have a zero fair value at the inception ofthe hedging relationship). See Schedule A for the GASB 53 reporting amounts for each Transaction.

9

DERIVATIVE VALUATION AND GASB 53 COMPLIANCE REPORT REPORT SECTION II

FOR THE PERIOD ENDING SEPTEMBER 30, 2015 TRANSACTION ANALYSIS DETAIL

BROWARD COUNTY, FLORIDA TRANSACTION #1 – 46.145MM GOLDMAN 2008

TRANSACTION GENERAL TERMS

Principal Terms Pay Leg Receive Leg

Counterparty Name Goldman Sachs Bank USA Fixed Rate 3.642% Reference Index 100% SIFMACounterparty Ref. LTAA1717608484.0/00694613101 Pay Frequency Monthly Pay Frequency MonthlyTrade Date 7/7/2008 Reset Frequency WeeklyEffective Date 7/10/2008Maturity Date 9/1/2027

OFF-MARKET SWAP ADJUSTMENTS & ALLOCATIONS

Investment Derivative Portion Hedging Instrument Portion

Swap In Excess of Related Bonds During Fiscal Year 0 0

On-Market ComponentIs the Swap an Off-Market Swap? No 3.642%

Off-Market Portion Trade Date

Off-Market Portion Settlement Date

Off-Market Portion Component

Off-Market Portion Amount

September 30, 2014

Principal Accrued Total

Pay Leg (8,275,080.99) (98,972.87) (8,374,053.86)Receive Leg 4,381,428.38 1,164.55 4,382,592.93

Swap Value (3,893,652.61) (97,808.32) (3,991,460.93)

September 30, 2015

Principal Accrued Total

Pay Leg (7,396,162.38) (92,885.16) (7,489,047.54)Receive Leg 2,593,115.78 503.09 2,593,618.87

Swap Value (4,803,046.60) (92,382.07) (4,895,428.67)

TRANSACTION MARKET VALUATIONS

GASB 53 ACCOUNTING VALUATIONSSeptember 30, 2014 September 30, 2015 Change in Value

Investment Portion Balance 0

On-Market Hedging Portion Balance (3,991,460.93) (4,895,428.67) (903,967.74)

Off-Market Amount Portion Balance 0

10

DERIVATIVE VALUATION AND GASB 53 COMPLIANCE REPORT REPORT SECTION II

FOR THE PERIOD ENDING SEPTEMBER 30, 2015 TRANSACTION ANALYSIS DETAIL

BROWARD COUNTY, FLORIDA TRANSACTION #1 – 46.145MM GOLDMAN 2008

Key GASB 53 Considerations

Criteria ExplanationEvaluation

Result

1 Is the financial instrument a "derivative instrument"? Yes, the settlement factors, leverage, and net settlement of the swap are characteristic of a derivative instrument, and the swap is not an instrument excluded from the scope of GASB 53.

Yes, applicable

2 Does the derivative instrument result from the termination of a previous hedging relationship?

No, the derivative instrument doesn’t result from a termination of a previous hedge.

Not applicable

3 Is the derivative instrument embedded in a financial instrument and therefore a "hybrid instrument"?

No, the derivative instrument is not a hybrid instrument.

Not applicable

4 Is the derivative instrument associated with a "hedgeable item"?

Yes, the swap is associated with a hedgeable item having a consistent quantity, is reported from the same fund, and has a consistent term.

Yes, applicable

5 Is the derivative instrument designed to reduce an identified financial risk by offsetting changes in cash flows or fair values of the hedged item?

Yes, the swap is designed to offset changes in cash flows of the hedged item and is therefore a "potential hedging derivative instrument."

Yes, applicable

6 a. Does the potential hedging derivative instrument meet the criteria of the "consistent critical terms method"?

No, consistent with PFM report. No or N/A, therefore see 6(b) below

b. Is the potential hedging derivative instrument eligible for evaluation of effectiveness using the "regression analysis method"?

All criteria under i. - iii. below must be satisfied. PASS (see i. - iii. below)

i. The R-squared of the regression analysis is at least 0.80.

Yes, the R-squared is 0.99497. PASS

ii. The F-statistic calculated for the regression model demonstrates that the model is significant using a 95 percent confidence interval.

Yes, the F-statistic is 0.00000. PASS

iii. The regression coefficient for the slope is between -1.25 and -0.80.

Yes, the regression coefficient for the slope is-1.01946.

PASS

11

DERIVATIVE VALUATION AND GASB 53 COMPLIANCE REPORT REPORT SECTION II

FOR THE PERIOD ENDING SEPTEMBER 30, 2015 TRANSACTION ANALYSIS DETAIL

BROWARD COUNTY, FLORIDA TRANSACTION #1 – 46.145MM GOLDMAN 2008

GASB 53 Conclusion

Since (i) the swap has been determined to be a potential hedging derivative instrument, (ii) no new market conditions arose during the current reporting period, and (iii) the swap meets the criteria of one of the permitted methods, i.e., regression analysis method, the swap is an Effective Hedge as defined in GASB 53.

12

DERIVATIVE VALUATION AND GASB 53 COMPLIANCE REPORT REPORT SECTION II

FOR THE PERIOD ENDING SEPTEMBER 30, 2015

BROWARD COUNTY, FLORIDA TRANSACTION #1 – 46.145MM GOLDMAN 2008

Historical Basis Data Regression Analysis Method Summary

Payment Date Bond Variable Rate 100%SIFMA Difference

10/02/08 -5.84000% 5.74000% 0.10% R-Squared 0.99497

10/09/08 -4.92000% 4.82000% 0.10%

10/16/08 -3.55000% 3.45000% 0.10% Significance F 0.00000

10/23/08 -2.38000% 2.28000% 0.10%

10/30/08 -1.88000% 1.82000% 0.06% Slope Regression Coefficient -1.01946

11/06/08 -1.32000% 1.26000% 0.06%

11/13/08 -1.20000% 1.14000% 0.06%

11/20/08 -1.18000% 1.12000% 0.06%

11/27/08 -1.09000% 1.03000% 0.06%

12/04/08 -0.91000% 0.85000% 0.06%

12/11/08 -0.91000% 0.85000% 0.06%

12/18/08 -1.14000% 1.08000% 0.06%

12/25/08 -1.31000% 1.25000% 0.06%

01/01/09 -0.96000% 0.90000% 0.06%

01/08/09 -0.65000% 0.59000% 0.06%

01/15/09 -0.52000% 0.46000% 0.06%

01/22/09 -0.57000% 0.51000% 0.06%

01/29/09 -0.59000% 0.53000% 0.06%

02/05/09 -0.54000% 0.48000% 0.06%

02/12/09 -0.61000% 0.55000% 0.06%

02/19/09 -0.72000% 0.66000% 0.06%

02/26/09 -0.73000% 0.67000% 0.06%

03/05/09 -0.61000% 0.55000% 0.06%

03/12/09 -0.64000% 0.58000% 0.06%

03/19/09 -0.63000% 0.57000% 0.06%

03/26/09 -0.60000% 0.54000% 0.06%

04/02/09 -0.60000% 0.48000% 0.12%

04/09/09 -0.57000% 0.51000% 0.06%

TRANSACTION ANALYSIS DETAIL

R² = 0.995

-7.00%

-6.00%

-5.00%

-4.00%

-3.00%

-2.00%

-1.00%

0.00%0.00% 1.00% 2.00% 3.00% 4.00% 5.00% 6.00% 7.00%

Linear Regression

04/16/09 -0.59000% 0.53000% 0.06%

04/23/09 -0.63000% 0.57000% 0.06%

04/30/09 -0.69000% 0.63000% 0.06%

05/07/09 -0.53000% 0.47000% 0.06%

05/14/09 -0.50000% 0.44000% 0.06%

05/21/09 -0.48000% 0.42000% 0.06%

05/28/09 -0.45000% 0.39000% 0.06%

06/04/09 -0.34000% 0.34000% 0.00%

06/11/09 -0.31000% 0.36000% -0.05%

06/18/09 -0.36000% 0.36000% 0.00%

06/25/09 -0.30000% 0.35000% -0.05%

07/02/09 -0.25000% 0.30000% -0.05%

07/09/09 -0.22000% 0.27000% -0.05%

07/16/09 -0.27000% 0.32000% -0.05%

07/23/09 -0.32000% 0.37000% -0.05%

07/30/09 -0.36000% 0.41000% -0.05%

08/06/09 -0.30000% 0.35000% -0.05%

08/13/09 -0.38000% 0.43000% -0.05%

08/20/09 -0.35000% 0.42000% -0.07%

08/27/09 -0.30000% 0.39000% -0.09%

09/03/09 -0.28000% 0.28000% 0.00%

09/10/09 -0.25000% 0.31000% -0.06%

09/17/09 -0.25000% 0.31000% -0.06%

09/24/09 -0.35000% 0.40000% -0.05%

10/01/09 -0.30000% 0.34000% -0.04%

10/08/09 -0.20000% 0.24000% -0.04%

10/15/09 -0.21000% 0.26000% -0.05%

10/22/09 -0.21000% 0.26000% -0.05%

10/29/09 -0.20000% 0.26000% -0.06%

11/05/09 -0.20000% 0.23000% -0.03%

11/12/09 -0.20000% 0.23000% -0.03%

11/19/09 -0.22000% 0.28000% -0.06%

11/26/09 -0.26000% 0.27000% -0.01%

12/03/09 -0.22000% 0.22000% 0.00%

12/10/09 -0.22000% 0.24000% -0.02%

13

DERIVATIVE VALUATION AND GASB 53 COMPLIANCE REPORT REPORT SECTION II

FOR THE PERIOD ENDING SEPTEMBER 30, 2015

BROWARD COUNTY, FLORIDA TRANSACTION #1 – 46.145MM GOLDMAN 2008

Historical Basis Data Regression Analysis Method Summary

Payment Date Bond Variable Rate 100%SIFMA Difference

TRANSACTION ANALYSIS DETAIL

12/17/09 -0.26000% 0.27000% -0.01%

12/24/09 -0.30000% 0.32000% -0.02%

12/31/09 -0.23000% 0.25000% -0.02%

01/07/10 -0.13000% 0.15000% -0.02%

01/14/10 -0.14000% 0.16000% -0.02%

01/21/10 -0.18000% 0.20000% -0.02%

01/28/10 -0.18000% 0.20000% -0.02%

02/04/10 -0.16000% 0.17000% -0.01%

02/11/10 -0.18000% 0.20000% -0.02%

02/18/10 -0.21000% 0.23000% -0.02%

02/25/10 -0.18000% 0.20000% -0.02%

03/04/10 -0.14000% 0.17000% -0.03%

03/11/10 -0.20000% 0.23000% -0.03%

03/18/10 -0.21000% 0.24000% -0.03%

03/25/10 -0.34000% 0.29000% 0.05%

04/01/10 -0.29000% 0.29000% 0.00%

04/08/10 -0.24000% 0.24000% 0.00%

04/15/10 -0.30000% 0.30000% 0.00%

04/22/10 -0.32000% 0.32000% 0.00%

04/29/10 -0.30000% 0.30000% 0.00%

05/06/10 -0.23000% 0.25000% -0.02%

05/13/10 -0.30000% 0.30000% 0.00%

05/20/10 -0.30000% 0.31000% -0.01%

05/27/10 -0.27000% 0.29000% -0.02%

06/03/10 -0.24000% 0.26000% -0.02%

06/10/10 -0.27000% 0.29000% -0.02%

06/17/10 -0.30000% 0.32000% -0.02%

06/24/10 -0.29000% 0.31000% -0.02%

07/01/10 -0.23000% 0.25000% -0.02%

07/08/10 -0.23000% 0.25000% -0.02%

07/15/10 -0.24000% 0.26000% -0.02%

07/22/10 -0.27000% 0.29000% -0.02%

07/29/10 -0.26000% 0.28000% -0.02%

08/05/10 -0.23000% 0.25000% -0.02%

08/12/10 -0.25000% 0.27000% -0.02%

08/19/10 -0.28000% 0.30000% -0.02%

08/26/10 -0.28000% 0.30000% -0.02%

09/02/10 -0.23000% 0.25000% -0.02%

09/09/10 -0.25000% 0.27000% -0.02%

09/16/10 -0.27000% 0.29000% -0.02%

09/23/10 -0.28000% 0.30000% -0.02%

09/30/10 -0.25000% 0.27000% -0.02%

10/07/10 -0.23000% 0.25000% -0.02%

10/14/10 -0.25000% 0.27000% -0.02%

10/21/10 -0.28000% 0.30000% -0.02%

10/28/10 -0.26000% 0.28000% -0.02%

11/04/10 -0.24000% 0.26000% -0.02%

11/11/10 -0.25000% 0.27000% -0.02%

11/18/10 -0.26000% 0.28000% -0.02%

11/25/10 -0.28000% 0.30000% -0.02%

12/02/10 -0.25000% 0.27000% -0.02%

12/09/10 -0.25000% 0.27000% -0.02%

12/16/10 -0.28000% 0.30000% -0.02%

12/23/10 -0.38000% 0.34000% 0.04%

12/30/10 -0.32000% 0.34000% -0.02%

01/06/11 -0.21000% 0.23000% -0.02%

01/13/11 -0.22000% 0.24000% -0.02%

01/20/11 -0.25000% 0.27000% -0.02%

01/27/11 -0.27000% 0.29000% -0.02%

02/03/11 -0.24000% 0.26000% -0.02%

02/10/11 -0.25000% 0.27000% -0.02%

02/17/11 -0.26000% 0.28000% -0.02%

02/24/11 -0.24000% 0.26000% -0.02%

14

DERIVATIVE VALUATION AND GASB 53 COMPLIANCE REPORT REPORT SECTION II

FOR THE PERIOD ENDING SEPTEMBER 30, 2015

BROWARD COUNTY, FLORIDA TRANSACTION #1 – 46.145MM GOLDMAN 2008

Historical Basis Data Regression Analysis Method Summary

Payment Date Bond Variable Rate 100%SIFMA Difference

TRANSACTION ANALYSIS DETAIL

03/03/11 -0.22000% 0.24000% -0.02%

03/10/11 -0.23000% 0.25000% -0.02%

03/17/11 -0.24000% 0.26000% -0.02%

03/24/11 -0.24000% 0.26000% -0.02%

03/31/11 -0.23000% 0.25000% -0.02%

04/07/11 -0.21000% 0.23000% -0.02%

04/14/11 -0.23000% 0.25000% -0.02%

04/21/11 -0.25000% 0.27000% -0.02%

04/28/11 -0.24000% 0.26000% -0.02%

05/05/11 -0.21000% 0.23000% -0.02%

05/12/11 -0.19000% 0.21000% -0.02%

05/19/11 -0.18000% 0.20000% -0.02%

05/26/11 -0.16000% 0.18000% -0.02%

06/02/11 -0.13000% 0.15000% -0.02%

06/09/11 -0.11000% 0.13000% -0.02%

06/16/11 -0.10000% 0.12000% -0.02%

06/23/11 -0.09000% 0.11000% -0.02%

06/30/11 -0.07000% 0.09000% -0.02%

07/07/11 -0.06000% 0.08000% -0.02%

07/14/11 -0.05000% 0.07000% -0.02%

07/21/11 -0.05000% 0.07000% -0.02%

07/28/11 -0.06000% 0.08000% -0.02%

08/04/11 -0.16000% 0.18000% -0.02%

08/11/11 -0.16000% 0.18000% -0.02%

08/18/11 -0.18000% 0.20000% -0.02%

08/25/11 -0.19000% 0.21000% -0.02%

09/01/11 -0.16000% 0.18000% -0.02%

09/08/11 -0.13000% 0.15000% -0.02%

09/15/11 -0.14000% 0.16000% -0.02%

09/22/11 -0.15000% 0.17000% -0.02%

09/29/11 -0.14000% 0.16000% -0.02%

10/06/11 -0.12000% 0.14000% -0.02%

10/13/11 -0.12000% 0.14000% -0.02%

10/20/11 -0.12000% 0.14000% -0.02%

10/27/11 -0.12000% 0.14000% -0.02%

11/03/11 -0.13000% 0.13000% 0.00%

11/10/11 -0.11000% 0.13000% -0.02%

11/17/11 -0.12000% 0.14000% -0.02%

11/24/11 -0.12000% 0.14000% -0.02%

12/01/11 -0.10000% 0.12000% -0.02%

12/08/11 -0.09000% 0.11000% -0.02%

12/15/11 -0.09000% 0.11000% -0.02%

12/22/11 -0.10000% 0.12000% -0.02%

12/29/11 -0.08000% 0.10000% -0.02%

01/05/12 -0.05000% 0.07000% -0.02%

01/12/12 -0.04000% 0.06000% -0.02%

01/19/12 -0.05000% 0.07000% -0.02%

01/26/12 -0.06000% 0.08000% -0.02%

02/02/12 -0.06000% 0.08000% -0.02%

02/09/12 -0.13000% 0.15000% -0.02%

02/16/12 -0.15000% 0.17000% -0.02%

02/23/12 -0.14000% 0.16000% -0.02%

03/01/12 -0.12000% 0.14000% -0.02%

03/08/12 -0.11000% 0.13000% -0.02%

03/15/12 -0.12000% 0.14000% -0.02%

03/22/12 -0.14000% 0.16000% -0.02%

03/29/12 -0.17000% 0.19000% -0.02%

04/05/12 -0.16000% 0.18000% -0.02%

04/12/12 -0.25000% 0.23000% 0.02%

04/19/12 -0.24000% 0.26000% -0.02%

04/26/12 -0.23000% 0.25000% -0.02%

05/03/12 -0.21000% 0.23000% -0.02%

05/10/12 -0.20000% 0.22000% -0.02%

15

DERIVATIVE VALUATION AND GASB 53 COMPLIANCE REPORT REPORT SECTION II

FOR THE PERIOD ENDING SEPTEMBER 30, 2015

BROWARD COUNTY, FLORIDA TRANSACTION #1 – 46.145MM GOLDMAN 2008

Historical Basis Data Regression Analysis Method Summary

Payment Date Bond Variable Rate 100%SIFMA Difference

TRANSACTION ANALYSIS DETAIL

05/17/12 -0.20000% 0.22000% -0.02%

05/24/12 -0.18000% 0.20000% -0.02%

05/31/12 -0.16000% 0.18000% -0.02%

06/07/12 -0.14000% 0.16000% -0.02%

06/14/12 -0.17000% 0.19000% -0.02%

06/21/12 -0.20000% 0.20000% 0.00%

06/28/12 -0.16000% 0.18000% -0.02%

07/05/12 -0.13000% 0.18000% -0.05%

07/12/12 -0.17000% 0.15000% 0.02%

07/19/12 -0.25000% 0.16000% 0.09%

07/26/12 -0.17000% 0.15000% 0.02%

08/02/12 -0.16000% 0.14000% 0.02%

08/09/12 -0.15000% 0.13000% 0.02%

08/16/12 -0.15000% 0.13000% 0.02%

08/23/12 -0.16000% 0.14000% 0.02%

08/30/12 -0.19000% 0.17000% 0.02%

09/06/12 -0.17000% 0.15000% 0.02%

09/13/12 -0.18000% 0.16000% 0.02%

09/20/12 -0.19000% 0.17000% 0.02%

09/27/12 -0.18000% 0.18000% 0.00%

10/04/12 -0.17000% 0.16000% 0.01%

10/11/12 -0.20000% 0.18000% 0.02%

10/18/12 -0.25000% 0.20000% 0.05%

10/25/12 -0.26000% 0.21000% 0.05%

11/01/12 -0.26000% 0.21000% 0.05%

11/08/12 -0.24000% 0.20000% 0.04%

11/15/12 -0.24000% 0.20000% 0.04%

11/22/12 -0.23000% 0.18000% 0.05%

11/29/12 -0.21000% 0.16000% 0.05%

12/06/12 -0.18000% 0.13000% 0.05%

12/13/12 -0.18000% 0.13000% 0.05%

12/20/12 -0.21000% 0.13000% 0.08%

12/27/12 -0.18000% 0.13000% 0.05%

01/03/13 -0.15000% 0.10000% 0.05%

01/10/13 -0.13000% 0.08000% 0.05%

01/17/13 -0.14000% 0.09000% 0.05%

01/24/13 -0.15000% 0.10000% 0.05%

01/31/13 -0.15000% 0.10000% 0.05%

02/07/13 -0.14000% 0.09000% 0.05%

02/14/13 -0.16000% 0.11000% 0.05%

02/21/13 -0.16000% 0.11000% 0.05%

02/28/13 -0.16000% 0.11000% 0.05%

03/07/13 -0.15000% 0.10000% 0.05%

03/14/13 -0.17000% 0.12000% 0.05%

03/21/13 -0.17000% 0.12000% 0.05%

03/28/13 -0.17000% 0.12000% 0.05%

04/04/13 -0.16000% 0.11000% 0.05%

04/11/13 -0.23000% 0.16000% 0.07%

04/18/13 -0.29000% 0.23000% 0.06%

04/25/13 -0.28000% 0.22000% 0.06%

05/02/13 -0.24000% 0.19000% 0.05%

05/09/13 -0.23000% 0.18000% 0.05%

05/16/13 -0.23000% 0.18000% 0.05%

05/23/13 -0.20000% 0.15000% 0.05%

05/30/13 -0.17000% 0.12000% 0.05%

06/06/13 -0.13000% 0.08000% 0.05%

06/13/13 -0.13000% 0.08000% 0.05%

06/20/13 -0.07000% 0.07000% 0.00%

06/27/13 -0.11000% 0.06000% 0.05%

07/04/13 -0.10000% 0.05000% 0.05%

07/11/13 -0.10000% 0.05000% 0.05%

07/18/13 -0.10000% 0.05000% 0.05%

07/25/13 -0.11000% 0.06000% 0.05%

16

DERIVATIVE VALUATION AND GASB 53 COMPLIANCE REPORT REPORT SECTION II

FOR THE PERIOD ENDING SEPTEMBER 30, 2015

BROWARD COUNTY, FLORIDA TRANSACTION #1 – 46.145MM GOLDMAN 2008

Historical Basis Data Regression Analysis Method Summary

Payment Date Bond Variable Rate 100%SIFMA Difference

TRANSACTION ANALYSIS DETAIL

08/01/13 -0.10000% 0.05000% 0.05%

08/08/13 -0.10000% 0.05000% 0.05%

08/15/13 -0.11000% 0.06000% 0.05%

08/22/13 -0.11000% 0.06000% 0.05%

08/29/13 -0.11000% 0.06000% 0.05%

09/05/13 -0.10000% 0.05000% 0.05%

09/12/13 -0.11000% 0.06000% 0.05%

09/19/13 -0.12000% 0.07000% 0.05%

09/26/13 -0.12000% 0.07000% 0.05%

10/03/13 -0.11000% 0.06000% 0.05%

10/10/13 -0.12000% 0.07000% 0.05%

10/17/13 -0.14000% 0.09000% 0.05%

10/24/13 -0.15000% 0.10000% 0.05%

10/31/13 -0.13000% 0.08000% 0.05%

11/07/13 -0.11000% 0.06000% 0.05%

11/14/13 -0.11000% 0.06000% 0.05%

11/21/13 -0.11000% 0.06000% 0.05%

11/28/13 -0.10000% 0.05000% 0.05%

12/05/13 -0.10000% 0.05000% 0.05%

12/12/13 -0.11000% 0.06000% 0.05%

12/19/13 -0.11000% 0.06000% 0.05%

12/26/13 -0.11000% 0.06000% 0.05%

01/02/14 -0.09000% 0.06000% 0.03%

01/09/14 -0.08000% 0.03000% 0.05%

01/16/14 -0.09000% 0.04000% 0.05%

01/23/14 -0.08000% 0.04000% 0.04%

01/30/14 -0.08000% 0.04000% 0.04%

02/06/14 -0.07000% 0.03000% 0.04%

02/13/14 -0.06000% 0.03000% 0.03%

02/20/14 -0.07000% 0.04000% 0.03%

02/27/14 -0.06000% 0.03000% 0.03%

03/06/14 -0.07000% 0.04000% 0.03%

03/13/14 -0.08000% 0.05000% 0.03%

03/20/14 -0.09000% 0.06000% 0.03%

03/27/14 -0.08000% 0.06000% 0.02%

04/03/14 -0.08000% 0.06000% 0.02%

04/10/14 -0.09000% 0.07000% 0.02%

04/17/14 -0.14000% 0.11000% 0.03%

04/24/14 -0.15000% 0.12000% 0.03%

05/01/14 -0.13000% 0.10000% 0.03%

05/08/14 -0.11000% 0.08000% 0.03%

05/15/14 -0.11000% 0.08000% 0.03%

05/22/14 -0.11000% 0.08000% 0.03%

05/29/14 -0.09000% 0.06000% 0.03%

06/05/14 -0.08000% 0.05000% 0.03%

06/12/14 -0.09000% 0.06000% 0.03%

06/19/14 -0.10000% 0.07000% 0.03%

06/26/14 -0.09000% 0.06000% 0.03%

07/01/14 -0.07000% 0.06000% 0.01%

07/03/14 -0.06000% 0.04000% 0.02%

07/10/14 -0.06000% 0.04000% 0.02%

07/17/14 -0.07000% 0.05000% 0.02%

07/24/14 -0.08000% 0.06000% 0.02%

07/31/14 -0.08000% 0.06000% 0.02%

08/07/14 -0.07000% 0.05000% 0.02%

08/14/14 -0.07000% 0.05000% 0.02%

08/21/14 -0.07000% 0.05000% 0.02%

08/28/14 -0.07000% 0.05000% 0.02%

09/04/14 -0.06000% 0.05000% 0.01%

09/11/14 -0.06000% 0.04000% 0.02%

09/18/14 -0.06000% 0.04000% 0.02%

09/25/14 -0.06000% 0.04000% 0.02%

10/02/14 -0.05000% 0.04000% 0.01%

17

DERIVATIVE VALUATION AND GASB 53 COMPLIANCE REPORT REPORT SECTION II

FOR THE PERIOD ENDING SEPTEMBER 30, 2015

BROWARD COUNTY, FLORIDA TRANSACTION #1 – 46.145MM GOLDMAN 2008

Historical Basis Data Regression Analysis Method Summary

Payment Date Bond Variable Rate 100%SIFMA Difference

TRANSACTION ANALYSIS DETAIL

10/09/14 -0.06000% 0.04000% 0.02%

10/16/14 -0.06000% 0.04000% 0.02%

10/23/14 -0.06000% 0.04000% 0.02%

10/30/14 -0.07000% 0.05000% 0.02%

11/06/14 -0.06000% 0.04000% 0.02%

11/13/14 -0.07000% 0.05000% 0.02%

11/20/14 -0.07000% 0.05000% 0.02%

11/27/14 -0.06000% 0.04000% 0.02%

12/04/14 -0.05000% 0.04000% 0.01%

12/11/14 -0.06000% 0.03000% 0.03%

12/18/14 -0.06000% 0.04000% 0.02%

12/25/14 -0.06000% 0.04000% 0.02%

01/01/15 -0.05000% 0.03000% 0.02%

01/08/15 -0.04000% 0.03000% 0.01%

01/15/15 -0.04000% 0.02000% 0.02%

01/22/15 -0.04000% 0.02000% 0.02%

01/29/15 -0.04000% 0.02000% 0.02%

02/05/15 -0.04000% 0.02000% 0.02%

02/12/15 -0.04000% 0.02000% 0.02%

02/19/15 -0.04000% 0.02000% 0.02%

02/26/15 -0.04000% 0.02000% 0.02%

03/05/15 -0.04000% 0.02000% 0.02%

03/12/15 -0.04000% 0.02000% 0.02%

03/19/15 -0.04000% 0.02000% 0.02%

03/26/15 -0.04000% 0.02000% 0.02%

04/02/15 -0.04000% 0.02000% 0.02%

04/09/15 -0.05000% 0.02000% 0.03%

04/16/15 -0.06000% 0.02000% 0.04%

04/23/15 -0.10000% 0.04000% 0.06%

04/30/15 -0.13000% 0.08000% 0.05%

05/07/15 -0.12000% 0.11000% 0.01%

05/14/15 -0.13000% 0.10000% 0.03%

05/21/15 -0.13000% 0.11000% 0.02%

05/28/15 -0.11000% 0.11000% 0.00%

06/04/15 -0.09000% 0.10000% -0.01%

06/11/15 -0.09000% 0.07000% 0.02%

06/18/15 -0.09000% 0.07000% 0.02%

06/25/15 -0.08000% 0.08000% 0.00%

07/02/15 -0.06000% 0.07000% -0.01%

07/09/15 -0.05000% 0.05000% 0.00%

07/16/15 -0.04000% 0.04000% 0.00%

07/23/15 -0.04000% 0.03000% 0.01%

07/30/15 -0.03000% 0.03000% 0.00%

08/06/15 -0.03000% 0.02000% 0.01%

08/13/15 -0.03000% 0.02000% 0.01%

08/20/15 -0.03000% 0.02000% 0.01%

08/27/15 -0.03000% 0.02000% 0.01%

09/03/15 -0.03000% 0.02000% 0.01%

09/10/15 -0.03000% 0.02000% 0.01%

09/17/15 -0.03000% 0.02000% 0.01%

09/24/15 -0.03000% 0.02000% 0.01%

End Historical Basis Data

18

DERIVATIVE VALUATION AND GASB 53 COMPLIANCE REPORT APPENDIX

FOR THE PERIOD ENDING SEPTEMBER 30, 2015 HEDGING ALLOCATION

BROWARD COUNTY, FLORIDA

Appendix – Hedging Allocation

2008 Swap Hedging Allocation

Period Start Date Period End Date Swap Notional2008 Port

Bonds Principal

7/10/2008 9/1/2008 46,145,000

46,145,000

9/1/2008 9/1/2009 44,720,000

44,720,000

9/1/2009 9/1/2010 43,050,000

43,050,000

9/1/2010 9/1/2011 41,320,000

41,320,000

9/1/2011 9/1/2012 39,525,000

39,525,000

9/1/2012 9/1/2013 37,665,000

37,665,000

9/1/2013 9/1/2014 35,735,000

35,735,000

9/1/2014 9/1/2015 33,735,000

33,735,000

9/1/2015 9/1/2016 31,660,000

31,660,000

9/1/2016 9/1/2017 29,515,000

29,515,000

9/1/2017 9/1/2018 27,285,000

27,285,000

9/1/2018 9/1/2019 24,975,000

24,975,000

9/1/2019 9/1/2020 22,580,000

22,580,000

9/1/2020 9/1/2021 20,100,000

20,100,000

9/1/2021 9/1/2022 17,525,000

17,525,000

9/1/2022 9/1/2023 14,860,000

14,860,000

9/1/2023 9/1/2024 12,095,000

12,095,000

9/1/2024 9/1/2025 9,230,000

9,230,000

9/1/2025 9/1/2026 6,260,000

6,260,000

9/1/2026 9/1/2027 3,185,000

3,185,000

19

DERIVATIVE VALUATION AND GASB 53 COMPLIANCE REPORT EXHIBIT

FOR THE PERIOD ENDING SEPTEMBER 30, 2015 SUGGESTED JOURNAL ENTRIES

BROWARD COUNTY, FLORIDA

Exhibit – Suggested Journal Entries

Journal Entries for the Swap Fair Values as of 9/30/2015: Debit Credit

46.145MM Goldman

Deferred outflow on derivative instrument $ (903,967.74)

Derivative instrument - interest rate swap liabilities $ (903,967.74)

(To record the change in fair value from 9/30/14 to 9/30/15)

20


Recommended