132
Derivatives Fin 119 Spring 2009
| Date post: | 31-Dec-2015 |
| Category: |
Documents |
| Upload: | caren-campbell |
| View: | 226 times |
| Download: | 0 times |

Derivatives
Fin 119 Spring 2009

Derivatives
Basic DefinitionAny Asset whose value is based upon (or derived from) an underlying asset.The performance of the derivative is dependent upon the performance of the underlying asset.
Risk Management
Since a derivatives performance is based on an underlying asset they can often be used to decrease the risk associated with changes in the spot price of an asset.
Basic Types of Derivative Contracts
Forward ContractsAgreement between two parties to purchase or sell something at a later date at a price agreed upon today
Futures ContractSame idea as a forward, but the contract trades on an exchange and the counter party is not set.
OptionsBuying or selling the right but not obligation to purchase or sell something in the future at a price agreed upon today
SwapsExchange of Cash flow Streams based on a notional value.

Brief History
Organized Exchanges in USChicago Board of TradeEstablished in 1848 to bring farmers and merchants together. Futures Contracts were first traded on the CBOT1865. Developed the first standard contract Chicago Mercantile ExchangeStarted as the Chicago Produce Exchange in 1874 for trade in perishable agricultural products. In 1919 it became the Chicago Mercantile Exchange (CME). Introduced a contract for S&P 500 futures in 1982. NYMEX 1872 KCBOT 1876

Other US Exchanges
NYBOTCoffee Sugar and Cocca ExchangeNew York Futures Exchange
Minneapolis Grain ExchangePhiladelphia Board of Trade

Payoff on Forward Contracts
Long PositionAgreeing to buy a specified amount (The Contract Size) of a given commodity or asset at a set point in time in the future (The Delivery Date) at a set price (The Delivery Price)
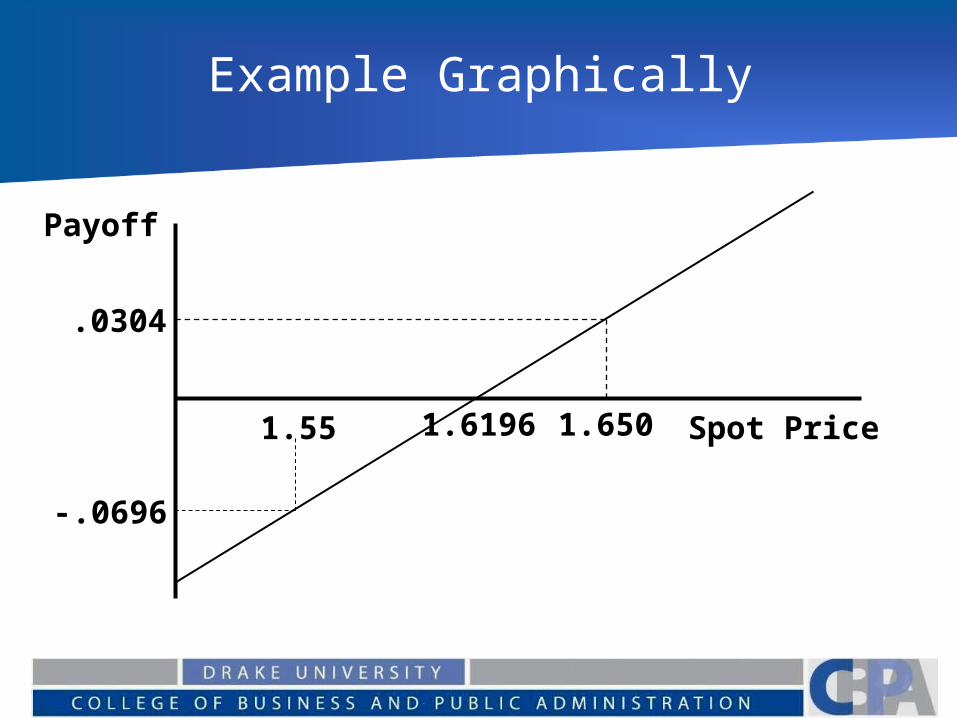
PayoffThe payoff will depend upon the spot price at the delivery date.Payoff = Spot Price – Delivery Price

Example
Assume you have agreed to buy €1,000,000 in 3 months at a rate of €1 = $1.6196
Spot Rate Spot – Delivery Price Payoff$1.65 $1.65-$1.6196=$0.0304$30,400
$1.6169 $1.6196-$1.6196=0 0$1.55 $1.55-$1.6196=$0.0696-$69,600
Example Graphically
Spot Price
Payoff
1.55 1.6196 1.650
.0304
-.0696

Payoff: Short Position
Agreeing to sell a specified amount (The Contract Size) of a given commodity or asset at a point of time in the future (The Delivery Date) at a set price (The Delivery Price).Payoff on Short position
Since the position is profitable when the price declines the payoff becomes:Payoff = The Delivery Price – The Spot Price
Long vs. Short
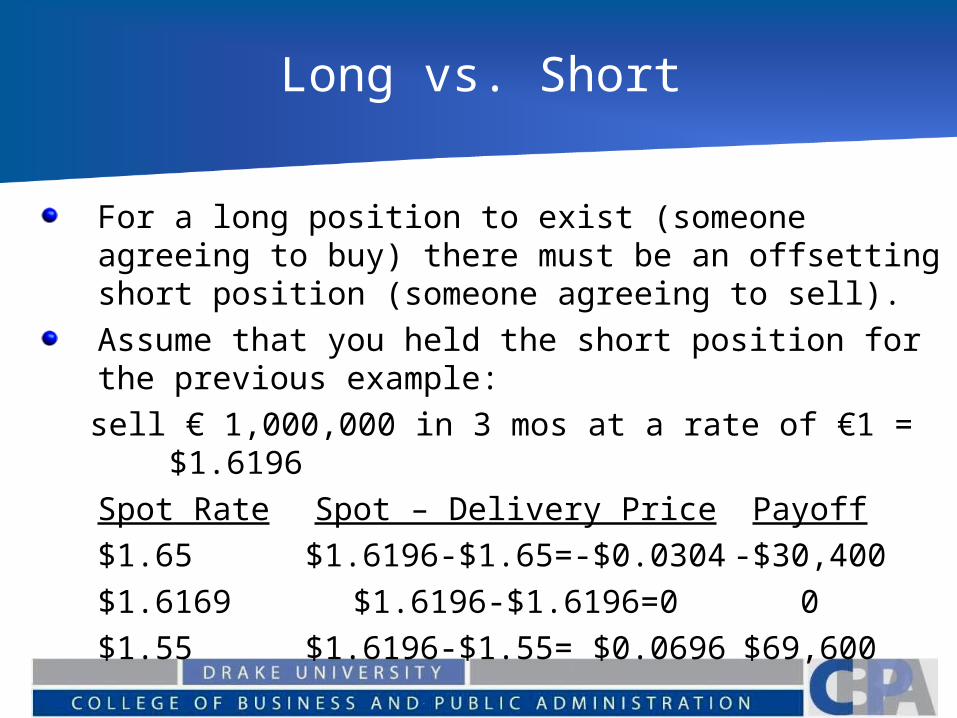
For a long position to exist (someone agreeing to buy) there must be an offsetting short position (someone agreeing to sell).Assume that you held the short position for the previous example:sell € 1,000,000 in 3 mos at a rate of €1 = $1.6196Spot Rate Spot – Delivery Price Payoff$1.65 $1.6196-$1.65=-$0.0304 -$30,400$1.6169 $1.6196-$1.6196=0 0$1.55 $1.6196-$1.55= $0.0696 $69,600

Example Graphically
Spot Price
Payoff
1.55 1.6196 1.650
.0304
-.0696

Contract Goals
The goal of the contract is to decrease risk, assume that you had to pay €1,000,000 in 3 months for the shipment of an input. You are afraid that the $ price will increase and you will pay a higher price. Similarly the other party may be afraid that the $ price will decrease (maybe they are receiving a payment in 3 months)
Determining the delivery price
The delivery price will be determined by the participants expectations about the future price and their willingness to enter into the contract. (Today’s spot price most likely does not equal the delivery price). What else should be considered?
They should both also consider the time value of money

Future and Forward contracts
Both Futures and Forward contracts are contracts entered into by two parties who agree to buy and sell a given commodity or asset (for example a T- Bill) at a specified point of time in the future at a set price.

Futures vs. Forwards
Future contracts are traded on an exchange, Forward contracts are privately negotiated over-the-counter arrangements between two parties.Both set a price to be paid in the future for a specified contract.Forward Contracts are subject to counter party default risk, The futures exchange attempts to limit or eliminate the amount of counter party default risk.
Other Forward Contract Risks
One goal of the negotiation is to specify exactly the type, quantity, and means of delivery of the underlying asset. The chance that an asset different than anticipated might be delivered should be eliminated by the contract.Futures contracts attempt to account for this problem via standardization of the contract.

Futures Contracts
Long Position: Agreeing to purchase a specified amount of a given commodity or asset at a point in time in the future at a set price (the futures price)Short Position: Agreeing to sell a specified amount of a given commodity or asset at a point of time in the future for a set price (the futures price).

Standardization of Futures Contracts
To promote confidence in the system and eliminate counter party default risk, future contracts are highly standardized.
Specifications of Futures Contract
The AssetThe Contract SizeDelivery ArrangementsDelivery MonthsPrice QuotesPrice LimitsPosition Limits
Contract Specifications
AssetQuality and type of asset are specified to guarantee specific product is delivered.
Contract SizeThe amount of asset that is to be delivered for one contract
Delivery ArrangementsMore important for commodities than financial assets. Specify how delivery occurs and location.

Contract Specifications
Delivery MonthsWhen delivery will occur (and during what part of the month delivery can occur)
Price QuotesContract must specify the units for the price quote (1/32 of a dollar etc) Also implicitly establishes the minimum fluctuation for the price of the contract.
Contract Specifications
Price LimitsDesigned to add stability to the market, limits on the maximum fluctuation in price that can occur during a trading day.
Position LimitsLimits the number of contracts that can be entered into by a speculator.
Speculator –attempting to profit from a movement in the market
Hedger – attempting to offset an underlying spot position.

Does Delivery need to take place?
No – most contracts will be closed out.Closing out a contract is simply taking the opposite (short if you are long or vice versa) position. The change in the futures price will be your gain or loss.With a futures contract your counter party does not remain the same. It does not matter who takes the opposite position. This is not the case for a forward contract.

Summary
Forward Contracts Futures ContractsPrivate contract between Traded on two parties an exchange
Not Standardized Standardized
Usually a single delivery date Range of delivery dates
Settled at the end of contract Settled daily
Delivery or final cash Contract is usually closed
settlement usually takes place out prior to maturity

Important Terminology
Open InterestThe number of contracts that are currently open (both a short and long position exist).What happens to open interest if a new long position is taken out?
It could IncreaseIt could decreaseIt might not change.The answer depends on whether both the long and short positions are new, or closing out, or one of each.

Margin Requirements
To limit counter party default risk, the futures exchange requires participants to place funds in a margin account when the contract is taken out.Some Terminology:
Initial Margin: The original amount deposited in the margin accountMaintenance margin: The amount that must remain in the margin accountMargin call – Notice that the margin account has dropped below the maintenance margin, more money must be added to the account

Margin Example
Example:An investor has taken a long position in gold (agreed to buy gold at some date in the future).Assume that the agreement is for 2 gold contracts each contract consists of 100 ounces of gold. The futures price is $400 per ounce. This implies that the participant would need 200*400 = $80,000 to purchase gold at the expiration of the contract.

Margin Example
If the futures price for gold decreases to $398, the investor would suffer a loss if the contract is closed out. The loss would total (400 - 398)200 = $400. The fear is that if at the expiration of the contract the price is 398, the participant will not honor the contract since it would result in a loss of $400.
Margin Example
To counteract this the investor is ask to put a sum of money into a margin account lets assume $2,000 per contract or $4000 total. When the futures price declines the loss of $400 is taken from the margin account of the investor and given to a participant that took a short position.

Margin Example
The value of the contract is marked to market each day, and the margin account is adjusted. The margin is effectively guaranteeing that the position is covered.If the level of the account falls below the maintenance margin the investor is required to put more funds into the account this is known as a margin call. The extra funds provided are the variation margin, if they are not provided the broker will close out the account.

Margin Account
Day
Futures Price
Daily Changes
Cumulative
Change
Margin Balanc
e
Margin Call
0 400 4000
1 398-2(200) = -
400-400 3600
2 395.5-2.5(200)=-
500-900 3100
3 394.5 -1(200)=-200 -1100 2,900 1100
4 395.5 (1)200=200 -900 4200

Note:
You can withdraw any amount above the initial marginMost accounts pay a money market rate of interestSome accounts allow deposit of securities, but valued at less than face value. (treasures valued at 90% other at 50%)

Role of Clearinghouse
The clearinghouse serves as an intermediary that guarantees the contract. The clearinghouse is an independent corporation whose shareholders are comprised of its member firms. Each member firm maintains a margin account (similar to the traders) with the clearinghouse. In essence the clearinghouse guarantees the long and the short trader that the other side will honor the contract

Patterns of Futures Prices
Basis = Spot Price – Futures PriceThe Basis moves toward zero as the spot price matures.This eliminates arbitrage possibilities.If futures is greater than spot, you could enter short in the futures market and make a profit by buying in the spot and then delivering in futures
Since everyone will attempt this demand for short positions increases and futures price decreases, also spot price would increase….

Other Patterns
The Futures Price over timeNormal Market: The futures price increase as the time to maturity increasesInverted Market: the futures price is a decreasing function of the time to maturity
Comparing the futures price to the expected future spot price.
Normal Backwardation: The futures price is below the expected future spot price.Contango: The futures price is above the expected futures price.

Theoretical Explanations of Backwardation
Keynes and Hicks-- Speculators will only enter the market if they expect to have a positive profit. If more speculators are holding a long position, it implies that the futures price is less than the expected spot price
A second explanation can be found by looking at the relationship between risk and return in the market. If thee is systematic risk involved with holding the security then the investor should be compensated for accepting the risk (nonsystematic risk can be diversified away).

Option Terminology
Call Option – the right to buy an asset at some point in the future for a designated price.
Put Option – the right to sell an asset at some point in the future at a given price

Review of Option Terminology
Expiration Date The last day the option can be exercised (American
Option) also called the strike date, maturity, and exercise date
Exercise Price The price specified in the contract
American Option Can be exercised at any time up to the expiration date
European Option Can be exercised only on the expiration date

Review of Option Terminology
Long position: Buying an option Long Call: Bought the right to buy the asset Long Put: Bought the right to sell the asset
Short Position: Writing (Selling) the optionShort Call: Agreed to sell the other party the right to buy the underlying asset, if the other party exercises the option you deliver the asset. Short Put: Agreed to buy the underlying asset from the other party if they decide to exercise the option.

Review of Terminology
In - the - money optionswhen the spot price of the underlying asset for a call (put) is greater (less) than the exercise price
Out - of - the - money optionswhen the spot price of the underlying asset for a call (put) is less (greater) than the exercise price
At - the - money optionswhen the exercise price and spot price are equal.
Interest Rate Options
Traded on Chicago Board of Options Exchange (CBOE)Interest rate Options are traded on 13 Week,5 year, 10 year and 30 year treasury securities
Call Option Profit
Call option – as the price of the asset increases the option is more profitable. Once the price is above the exercise price (strike price) the option will be exercisedIf the price of the underlying asset is below the exercise price it won’t be exercised – you only loose the cost of the option.The Profit earned is equal to the gain or loss on the option minus the initial cost.

Profit Diagram Call Option(Long Call Position)
Profit
Spot Price Cost
S
S-X-C
X

Call Option Intrinsic Value
The intrinsic value of a call option is equal to the current value of the underlying asset minus the exercise price if exercised or 0 if not exercised. In other words, it is the payoff to the investor at that point in time (ignoring the initial cost)
the intrinsic value is equal tomax(0, S-X)

Payoff Diagram Call Option
Payoff
Spot PriceS
S-X
X

Example: Naked Call Option
Assume that you can purchase a call option on an 8% coupon bond with a par value of $100 and 20 years to maturity. The option expires in one month and has an exercise price of $100.Assume that the option is currently at the money (the bond is selling at par) and selling for $3.What are the possible payoffs if you bought the bond and held it until maturity of the option?

Five possible results
The price of the bond at maturity of the option is $100. The buyer looses the entire purchase price, no reason to exercise.The price of the bond at maturity is less than $100 (the YTM is > 8%). The buyer looses the $3 option price and does not exercise the option.

Five Possible Results continued
The price of the bond at maturity is greater than $100, but less than $103. The buyer will exercise the option and recover a portion of the option cost.The price of the bond is equal to $103. The buyer will exercise the option and recover the cost of the option.The price of the bond is greater than $103. The buyer will make a profit of S-$100-$3.
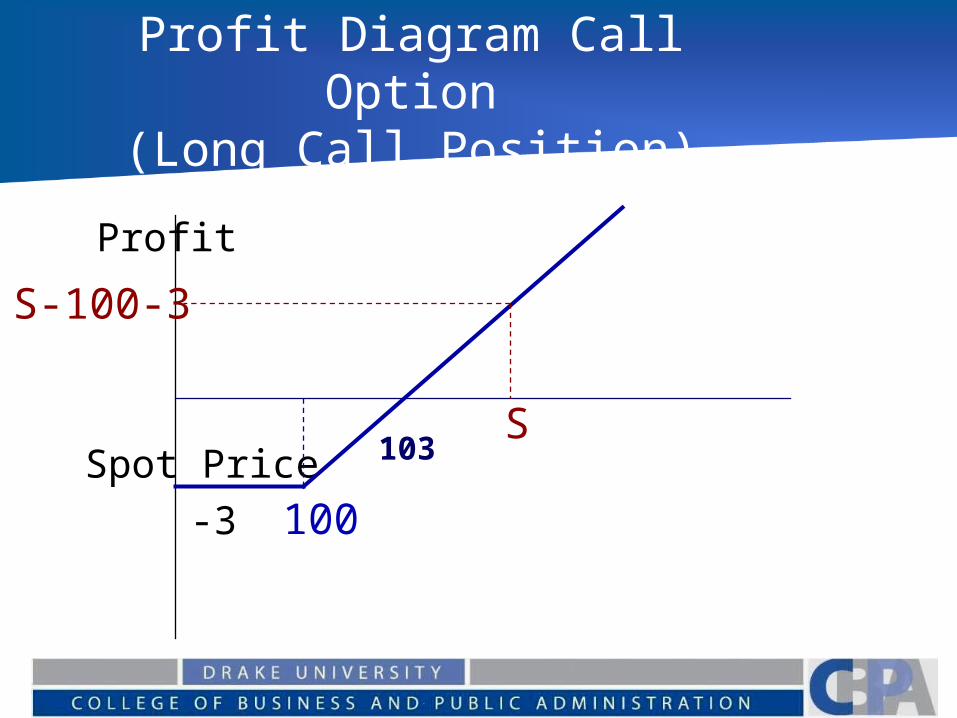
Profit Diagram Call Option(Long Call Position)
Profit
Spot Price -3
S
S-100-3
100
103

Price vs. Rate
Note buying a call on the price of the bond is equivalent to buying a put on the interest rate paid by the bond.As the rate decreases, the price increases because of the time value of money.
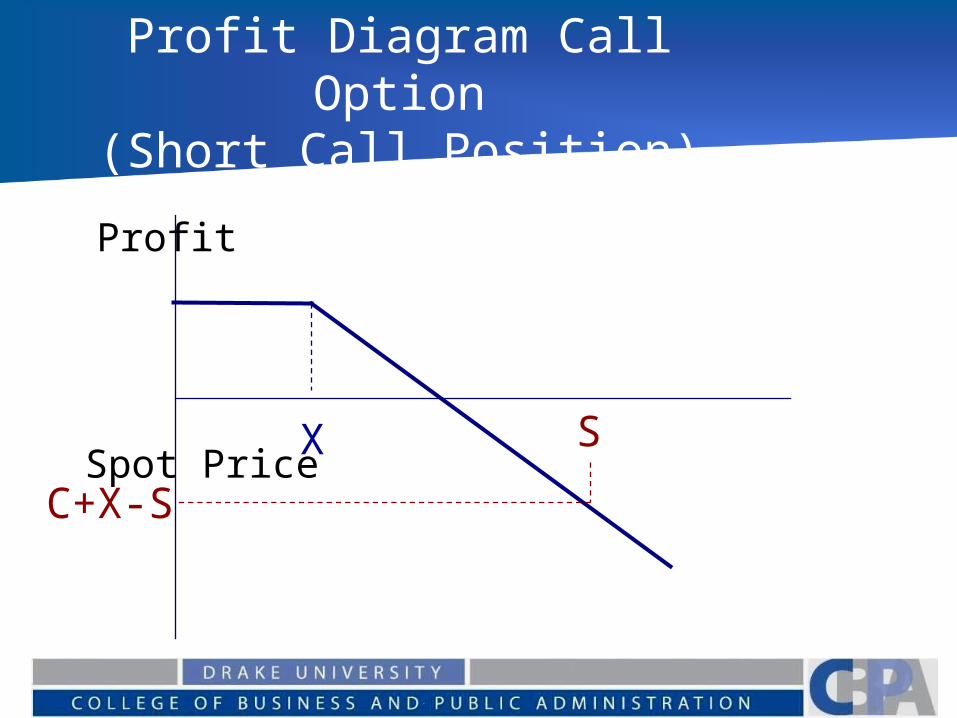
Profit Diagram Call Option(Short Call Position)
Profit
Spot Price S
C+X-S
X

Put option payoffs
The writer of the put option will profit if the option is not exercised or if it is exercised and the spot price is less than the exercise price plus cost of the option.In the previous example the writer will profit as long as the spot price is less than $103.What if the spot price is equal to $103?

Put Option Profits
Put option – as the price of the asset decreases the option is more profitable. Once the price is below the exercise price (strike price) the option will be exercisedIf the price of the underlying asset is above the exercise price it won’t be exercised – you only loose the cost of the option.
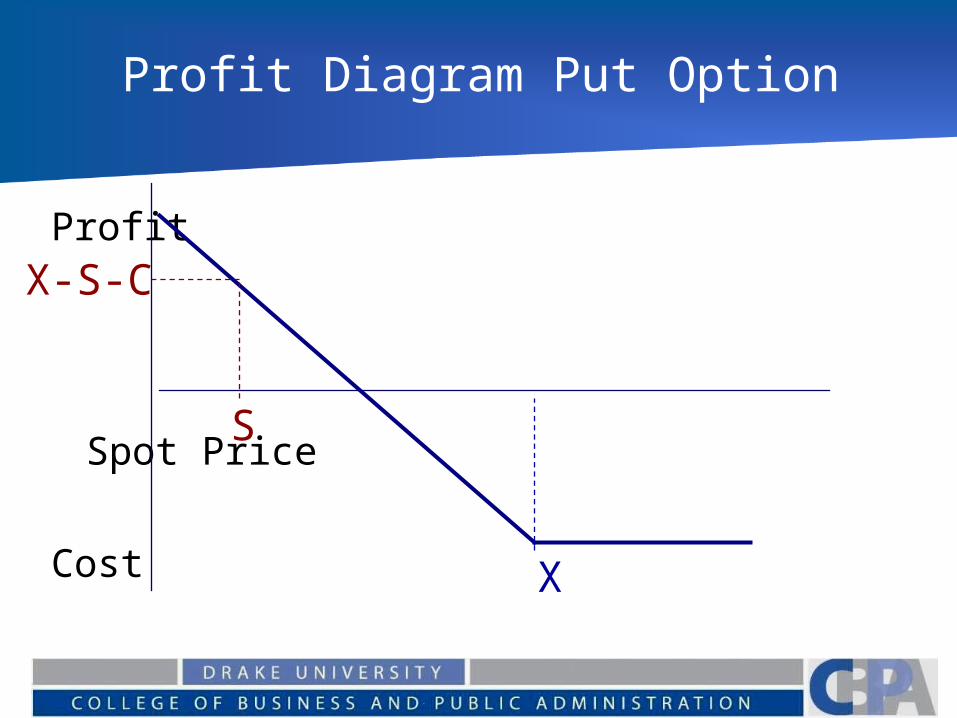
Profit Diagram Put Option
Profit
Spot Price
Cost X
S
X-S-C

Put Option Intrinsic Value
The intrinsic value of a put option is equal to exercise price minus the current value of the underlying asset if exercised or 0 if not exercised. In other words, it is the payoff to the investor at that point in time (ignoring the initial cost)
the intrinsic value is equal tomax(X-S, 0)
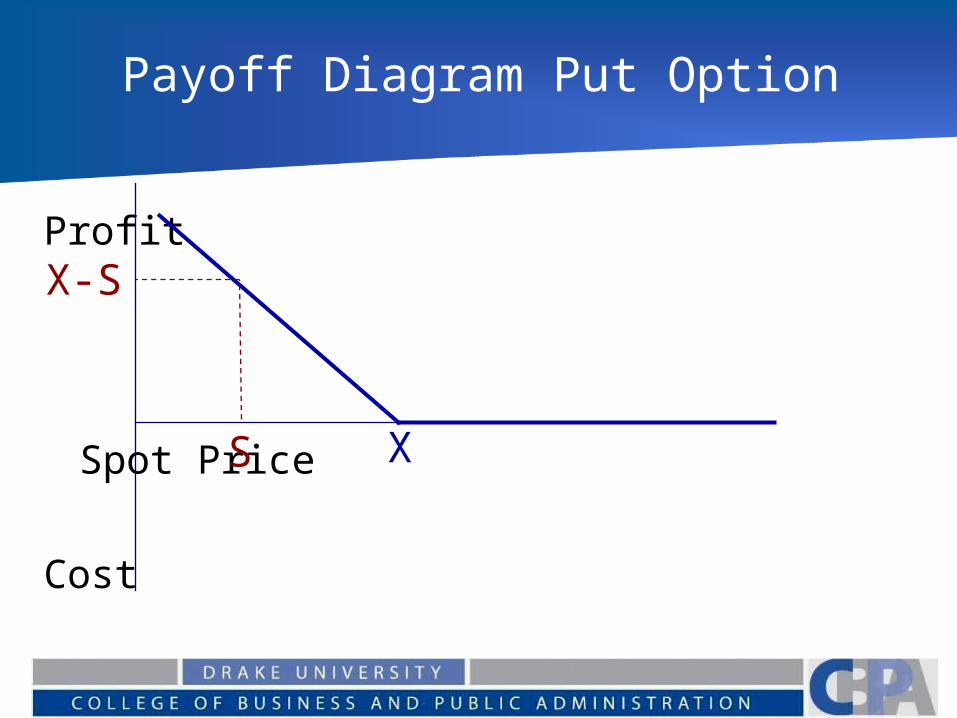
Payoff Diagram Put Option
Profit
Spot Price
Cost
XS
X-S

Profit Diagram Put OptionShort Put
Profit
Spot PriceXS
S-X+C

Pricing an Option
Arbitrage argumentsBlack Scholes Binomial Tree Models

PV and FV in continuous time
e = 2.71828 y = lnx x = ey
FV = PV (1+k)n for yearly compoundingFV = PV(1+k/m)nm for m compounding
periods per yearAs m increases this becomesFV = PVern =PVert let t =n rearranging for PV PV = FVe-rt

Black Scholes
The basic starting point for the actual pricing of an European option is the model developed by Fisher Black, Myron Scholes, and Robert Merton.
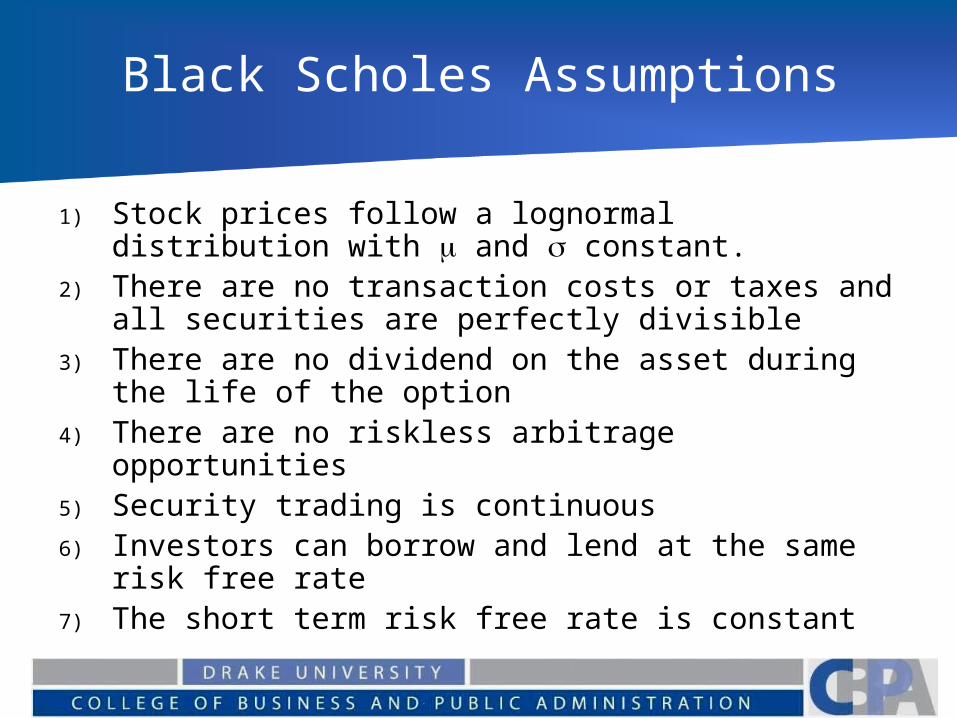
Black Scholes Assumptions
1) Stock prices follow a lognormal distribution with and constant.
2) There are no transaction costs or taxes and all securities are perfectly divisible
3) There are no dividend on the asset during the life of the option
4) There are no riskless arbitrage opportunities5) Security trading is continuous6) Investors can borrow and lend at the same risk
free rate7) The short term risk free rate is constant

Inputs you will need
S = Current value of underlying assetX = Exercise pricet = life until expiration of optionr = riskless rate2 = variance

Black Scholes
Value of Call Option = SN(d1)-Xe-rtN(d2) S = Current value of underlying
assetX = Exercise pricet = life until expiration of optionr = riskless rate2 = varianceN(d ) = the cumulative normal
distribution (the probability that a variable with a standard normal distribution will be less than d)

Black Scholes (Intuition)
Value of Call Option
SN(d1) - Xe-rt N(d2)The expected PV of cost Risk NeutralValue of S of investment Probability
ofif S > X S > X

Black Scholes
Value of Call Option = SN(d1)-Xe-
rtN(d2)
Where:
t
trXS
d
)2()ln(2
1
tdd 12

Payoff Diagram and Call Price
The payoff diagram is effectively the price (or value of the option) at the expiration of the contract. (the price should be the intrinsic value)At any given time, the current price is a function the amount of time remaining prior to expiration.The price or value will generally be above the intrinsic value for a call option.
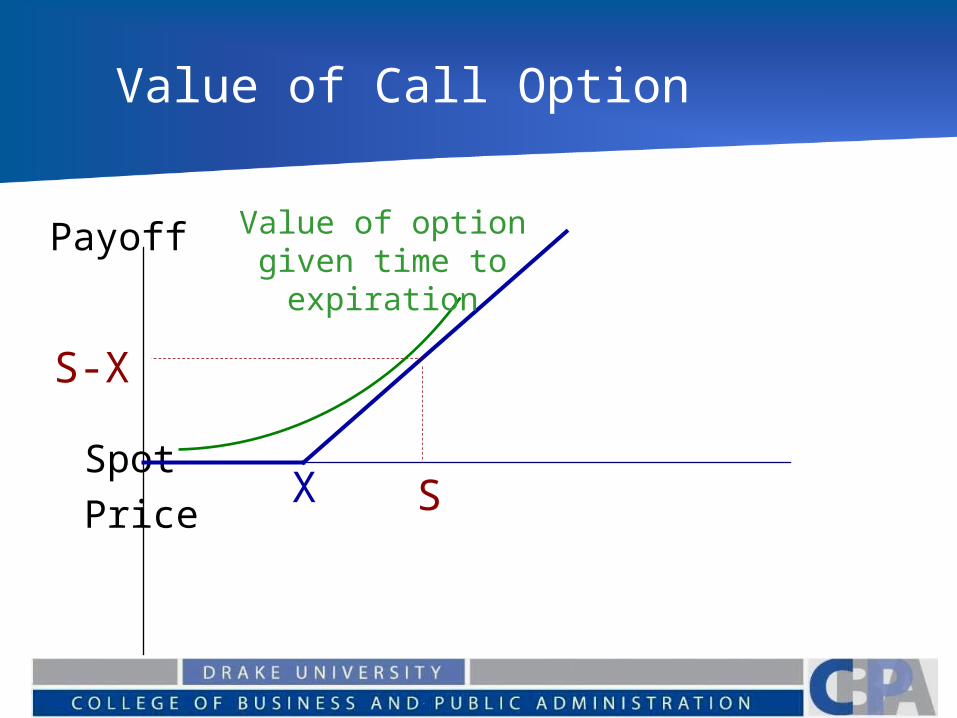
Value of Call Option
Payoff
Spot PriceS
S-X
X
Value of option given time to
expiration

Delta of an option
The delta of the option shows how the theoretical price of the option will change with a small change in the underlying asset.
bond underlying of pricein change
option call of pricein changedelta

Value of Call Option
Payoff
Spot PriceS
S-X
X
Valueof option
Delta is the slope of the tangent line at the given stock price
Delta of an option
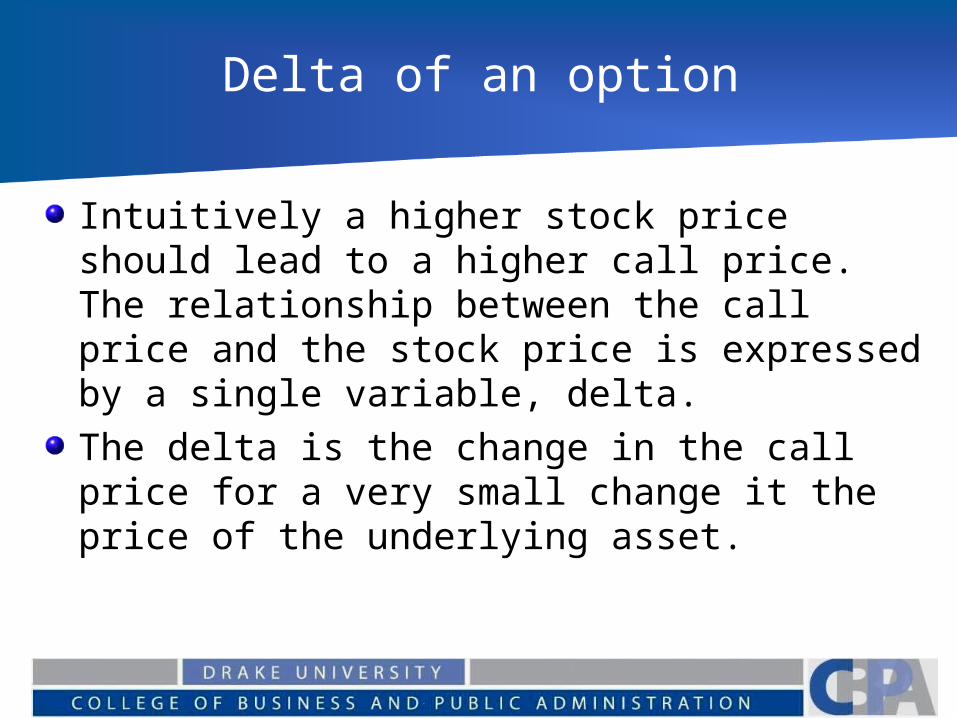
Intuitively a higher stock price should lead to a higher call price. The relationship between the call price and the stock price is expressed by a single variable, delta. The delta is the change in the call price for a very small change it the price of the underlying asset.

Delta
Delta can be found from the call price equation as:
Using delta hedging for a short position in a European call option would require keeping a long position of N(d1) shares at any given time. (and vice versa).
)( 1dNS
c
Delta explanation
Delta will be between 0 and 1.
A 1 cent change in the price of the underlying asset leads to a change of delta cents in the price of the option.
Delta
For deep in the money call options the delta will be close to 1. For deep out of the money call options the delta will be close to zero.
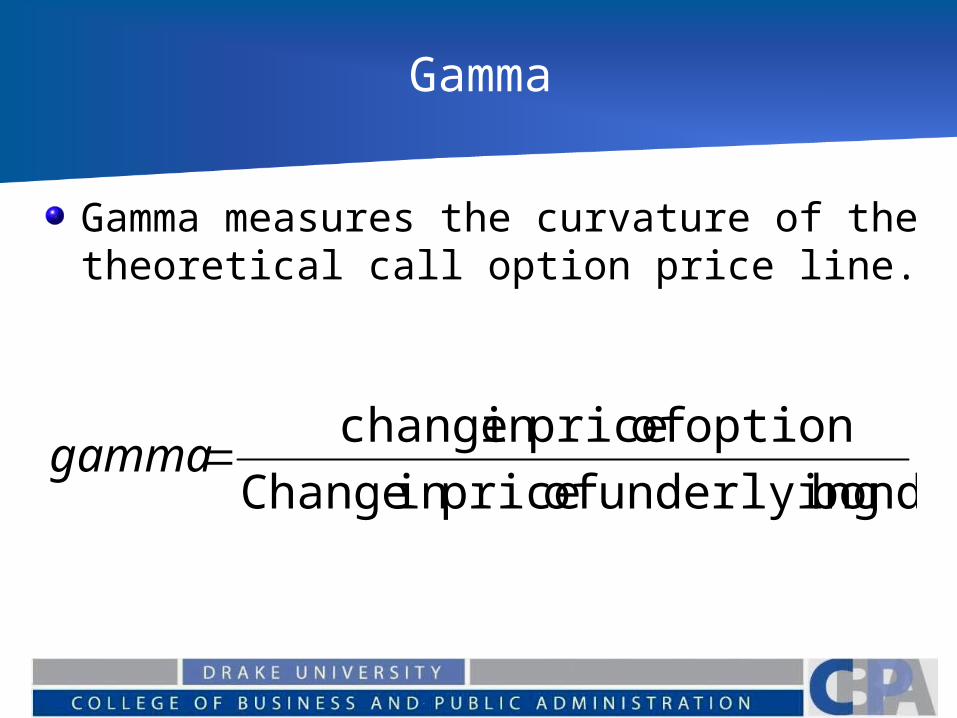
Gamma
Gamma measures the curvature of the theoretical call option price line.
bond underlying of pricein Change
option of pricein changegamma
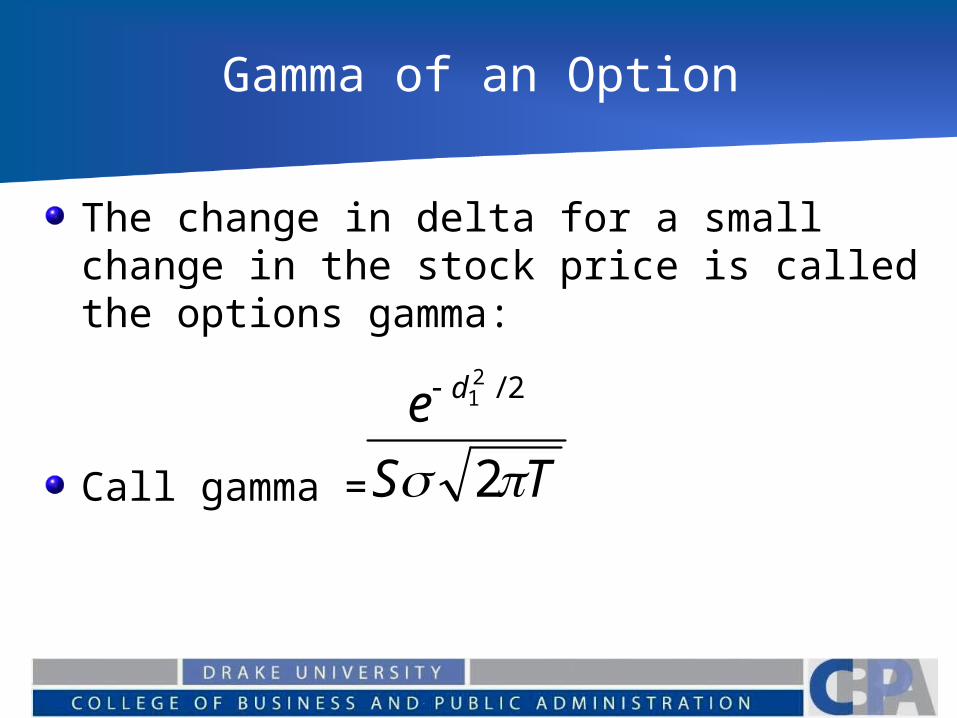
Gamma of an Option
The change in delta for a small change in the stock price is called the options gamma:
Call gamma = TS
e d
2
2/21

Other Measures
expiration toin time decrease
option of price ein th changetheta
expectedin Change
Priceoption in Changekappa

Combining Positions
A firm can use two or more option positions in combination to hedge a risk Allows you to create “synthetic positions”

Hedging
Assume you are afraid that the asset you own will decline in value.As the price declines you would like to have the loss offset with a gainBuying a put option will allow this to happen.

Profit Diagram Put Option
Profit
Spot Price
Cost X
S
X-S-C

Spot Position
You also owned the stock so you must consider the combined impact of the gain on the option and the value of the stock itself.
Diagramming the spot
The spot position could be represented by a straight line that represents the corresponding change in priceThe line will also slope up to the right. As the price increases there is improvement.
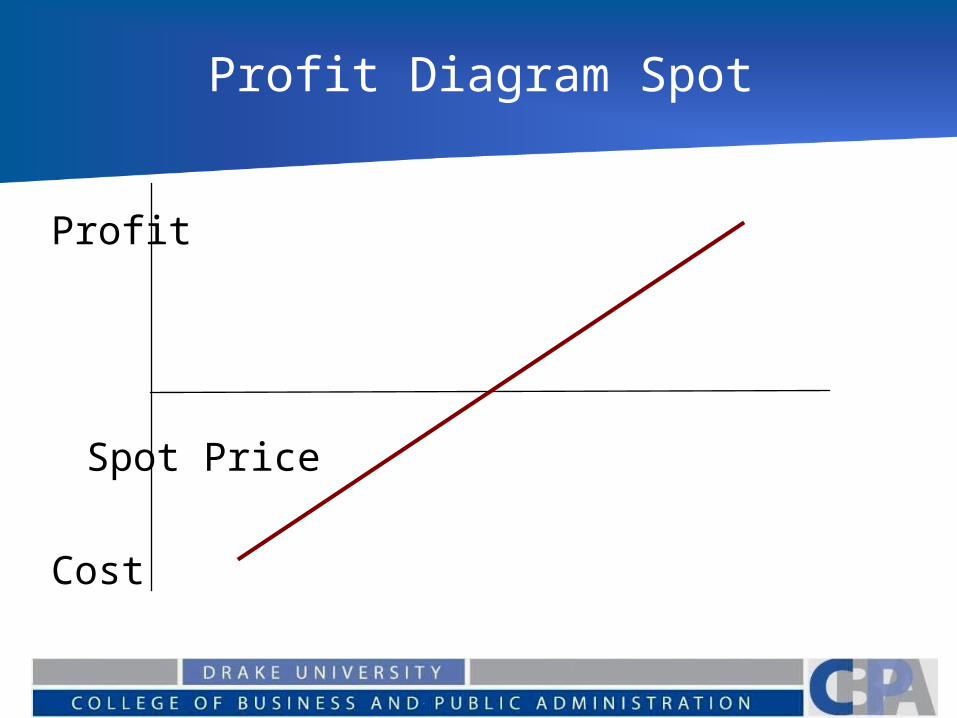
Profit Diagram Spot
Profit
Spot Price
Cost

Combined position
Assume the exercise price on the option is a little bit below the current price of the asset.What happens to the combined payoff of the spot position and the option?

Profit Diagram Put Option
XCombinedPosition

Other possibilities
By selling an option and buying another option you can offset the cost of the option.
This creates a spread which limits gains and losses.

Profit Diagram Put Options
Long Put
Short Put
Spot Price

Profit Diagram Bear Spread
Bear Spread
Spot price
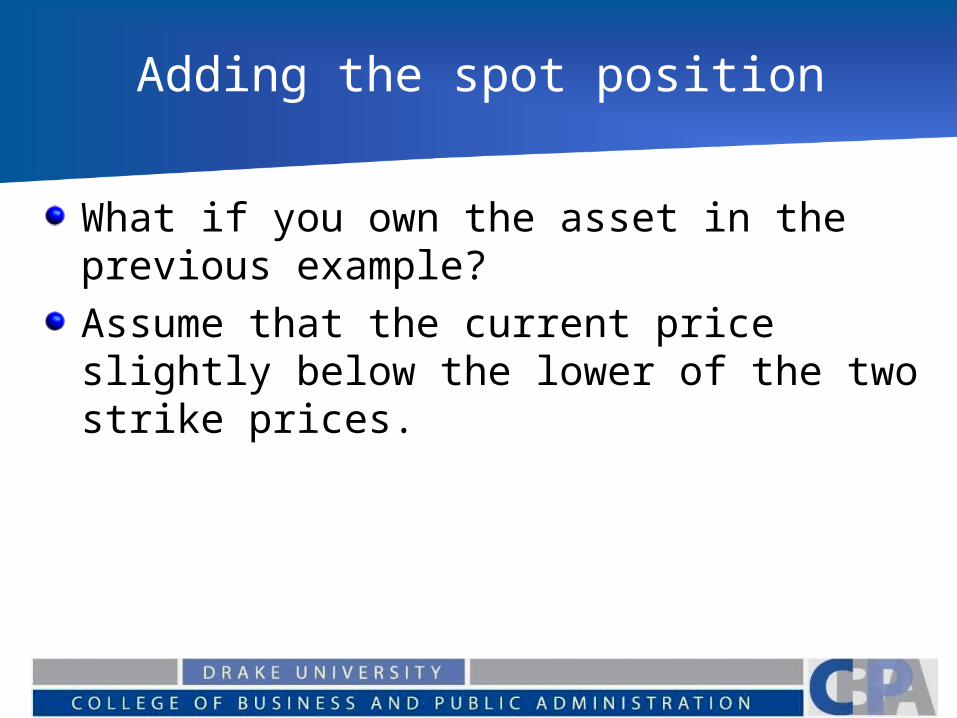
Adding the spot position
What if you own the asset in the previous example?Assume that the current price slightly below the lower of the two strike prices.

Profit Diagram Bear Spread
Bear Spread
Spot priceHedgedPosition
Another Strategy
To avoid the downside of the previous example you could combine a short call and a long put

Profit Diagram Call Option
Profit
Short Call
Long Put

Profit Diagram Costless Collar
Profit
Short Call
Long Put
Combined Profit

Combined with Spot
By using options selling at the same price the net cost is zero.At prices above the higher strike price (below the lower yield) the gain is offset by a loss in the option position.At prices below the lower strike price (above the higher yield) the loss is offset by gains in the option. You have limited both the gain and loss.Assume that the current price is exactly between the two strike prices

Profit DiagramCostless Collar (Fence)
Profit
Costless
Collar

Swaps Introduction
An agreement between two parties to exchange cash flows in the future.The agreement specifies the dates that the cash flows are to be paid and the way that they are to be calculated. A forward contract is an example of a simple swap. With a forward contract, the result is an exchange of cash flows at a single given date in the future. In the case of a swap the cash flows occur at several dates in the future. In other words, you can think of a swap as a portfolio of forward contracts.

Mechanics of Swaps
The most common used swap agreement is an exchange of cash flows based upon a fixed and floating rate. Often referred to a “plain vanilla” swap, the agreement consists of one party paying a fixed interest rate on a notional principal amount in exchange for the other party paying a floating rate on the same notional principal amount for a set period of time. In this case the currency of the agreement is the same for both parties.
Notional Principal
The term notional principal implies that the principal itself is not exchanged. If it was exchanged at the end of the swap, the exact same cash flows would result.

An Example
Company B agrees to pay A 5% per annum on a notional principal of $100 millionCompany A Agrees to pay B the 6 month LIBOR rate prevailing 6 months prior to each payment date, on $100 million. (generally the floating rate is set at the beginning of the period for which it is to be paid)

The Fixed Side
We assume that the exchange of cash flows should occur each six months (using a fixed rate of 5% compounded semi annually). Company B will pay:
($100M)(.025) = $2.5 Million
to Firm A each 6 months

Summary of Cash Flows for Firm B
Cash Flow Cash Flow NetDate LIBOR Received Paid Cash
Flow3-1-98 4.2%9-1-98 4.8% 2.10 2.5 -0.43-1-99 5.3% 2.40 2.5 -0.19-1-99 5.5% 2.65 2.5 0.153-1-00 5.6% 2.75 2.5 0.259-1-00 5.9% 2.80 2.5 0.303-1-01 6.4% 2.95 2.5 0.45

Swap Diagram
LIBORCompany A Company B
5%

Offsetting Spot Position
Company ABorrows (pays) 5.2%Pays LIBORReceives 5%Net LIBOR+.2%
Company BBorrows (pays) LIBOR+.8%Receives LIBORPays 5%Net 5.8%
Assume that A has a commitment to borrow at a fixed rate of 5.2% and that B has a commitment to borrow at a rate of LIBOR + .8%

Swap Diagram
Company A Company B
The swap in effect transforms a fixed rate liability or asset to a floating rate liability or asset (and vice versa) for the firms respectively.
5.2% LIBOR+.8%
LIBOR +.2%5%
LIBOR
5.8%

Role of Intermediary
Usually a financial intermediary works to establish the swap by bring the two parties together. The intermediary then earns .03 to .04% per annum in exchange for arranging the swap. The financial institution is actually entering into two offsetting swap transactions, one with each company.

Swap Diagram
Co A FI Co B
A pays LIBOR+.215%B pays 5.815%
The FI makes .03%
5.2% LIBOR+.8%
5.015%
LIBOR
4.985%
LIBOR
Role of the Intermediary
It is unlikely that a financial intermediary will be contacted by parties on both side of a swap at the same time.The intermediary must enter into the swap without the counter party. The intermediary then hedges the interest rate risk using interest rate instruments while waiting for a counter party to emerge. This practice is referred to as warehousing swaps.

Why enter into a swap?
The Comparative Advantage ArgumentFixed Floating
A 10% 6 mo LIBOR+.3B 11.2% 6 mo LIBOR +
1.0%
Difference between fixed rates = 1.2% Difference between floating rates = 0.7%
B Has an advantage in the floating rate.

Swap Diagram
Co A FI Co B
A pays LIBOR+.065% instead of LIBOR+.3%B pays 10.965% instead of 11.2%
The FI makes .03%
10% LIBOR+1%
9.965%
LIBOR
9.935%
LIBOR

Spread Differentials
Why do spread differentials exist?Differences in business lines, credit history, asset and liabilities, etc…

Why Enter Into A Swap?Managing Cash Flows
Assume that an insurance firm sold an annuity lasting 5 years and paying 5 Million each year.To offset the cash outflows they invest in a 10 year security that pays $6 million each year.The firm runs a reinvestment risk when they stop paying the cash outflows on the annuity – a combination of swaps could eliminate this risk (on board in class)

Valuation of Interest Rate Swaps
After the swap is entered into it can be valued as either:
A long position in one bond combined with a short position in another bond or A portfolio of forward rate agreements.

Relationship of Swaps to Bonds
In the examples above the same relationship could have been written asCompany B lent company A $100 million at the six month LIBOR rateCompany A lent company B $100 million at a fixed 5% per annum

Bond Valuation
Given the same floating rates as before the cash flow would be the same as in the swap example. The value of the swap would then be the difference between the value of the fixed rate bond and the floating rate bond.

Fixed portion
The value of either bond can be found by discounting the cash flows from the bond (as always). The fixed rate value is straight forward it is given as:
where NP is the notional principal and k is the fixed interest payment
nn
t
ttfix rNPrkB )1/()1/(
1

Floating rate valuation
The floating rate is based on the fact that it is a series of short term six months loans.Immediately after a payment date Bfl is equal to the notional principal Q. Allowing the time until the next payment to equal t1
where k* is the known next payment
11 )1/()1/( 1*
1tt
fl rkrQB

Current Swap Value
If the financial institution is paying fixed and receiving floating the value of the swap is
Vswap = Bfl-Bfix
The other party will have a value of Vswap = Bfix-Bfl

Example
Assume you previously entered into a swap with the following conditions:Pay 6 mo LIBOR & receive 8% on 100M
6 mo 10%12 mo 10.5% 18 mo 11%Bfix = 4/(1+.05)+4/(1+(.105/2))2
+104/(1+(.11/2))3 =96.00M
Bfloat = (100+5)/(1.05) = 100 =-100M -4 M
A better valuation
Relationship of Swap value to Forward Rte AgreementsSince the swap could be valued as a forward rate agreement (FRA) it is also possible to value the swap under the assumption that the forward rates are realized.
To do this you would need to:
Calculate the forward rates for each of the LIBOR rates that will determine swap cash flowsCalculate swap cash flows using the forward rates for the floating portion on the assumption that the LIBOR rates will equal the forward ratesSet the swap value equal to the present value of these cash flows.

Swap Rate
This works after you know the fixed rate.When entering into the swap the value of the swap should be 0.This implies that the PV of each of the two series of cash flows is equal. Each party is then willing to exchange the cash flows since they have the same value.The rate that makes the PV equal when used for the fixed payments is the swap rate.

Example
Assume that you are considering a swap where the party with the floating rate will pay the three month LIBOR on the $50 Million in principal.The parties will swap quarterly payments each quarter for the next year.Both the fixed and floating rates are to be paid on an actual/360 day basis.
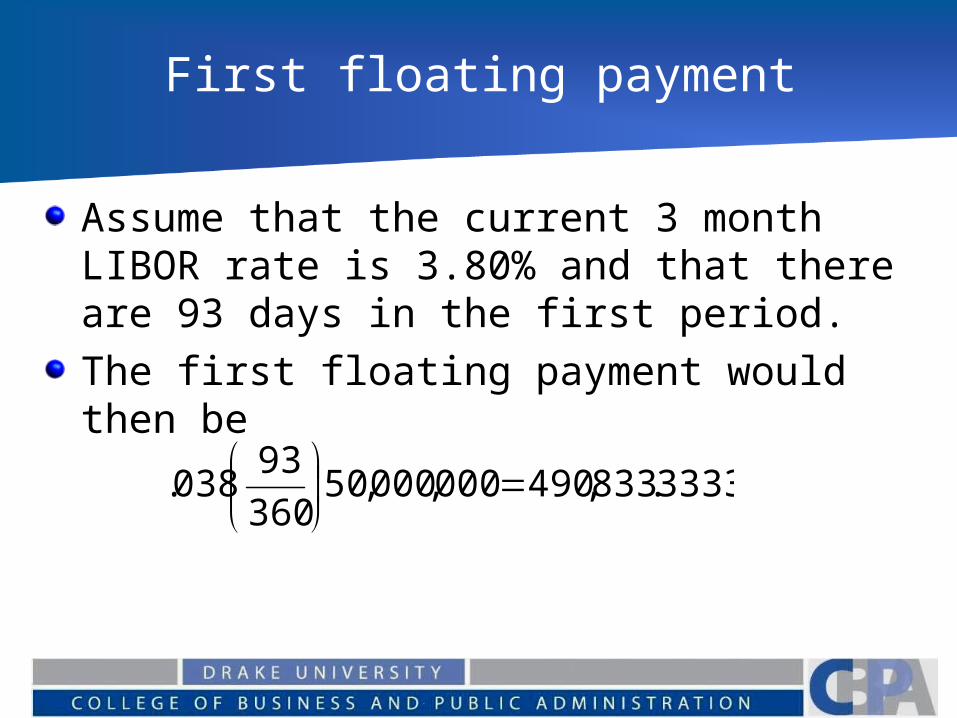
First floating payment
Assume that the current 3 month LIBOR rate is 3.80% and that there are 93 days in the first period.The first floating payment would then be
3333.833,490000,000,50360
93038.

Second floating payment
Assume that the three month futures price on the Eurodollar futures is 96.05 implying a forward rate of 100-96.05 = 3.95Given that there are 91 days in the period.The second floating payment would then be 1111.236,499000,000,50
360
910395.

Example Floating side
PeriodDay
CountFutures
PriceFwdRate
FloatingCash flow
91 3.80
1 93 96.05 3.95 490,833.3333
2 91 95.55 4.45 499,236.1111
3 90 95.28 4.72 556,250.0000
4 91 596,555.5555

PV of Floating cash flows
The PV of the floating cash flows is then calculated using the same forward rates.The first cash flow will have a PV of:
8263.061,486
36093
038.1
3333.833,490

PV of Floating cash flows
The PV of the floating cash flows is then calculated using the same forward rates.The second cash flow will have a PV of:
4412.495,489
36091
0395.136093
038.1
1111.236,499

Example Floating side
Period
DayCount
FwdRate
FloatingCash flow
PV of Floating CF
91 3.80
1 93 3.95490,833.333
3486,061.8263
2 91 4.45499,236.111
1489,495.4412
3 90 4.72556,250.000
0539,396.1423
4 91596,555.555
5525,668.5915

PV of floating
The total PV of the floating cash flows is then the sum of the four PV’s:
$2,040,622.0013

Swap rate
The fixed rate is then the rate that using the same procedure will cause the PV of the fixed cash flows to have a PV equal to the same amount.The fixed cash flows are discounted by the same rates as the floating rates.Note: the fixed cash flows are not the same each time due to the changes in the number of days in each period.The resulting rate is 4.1294686
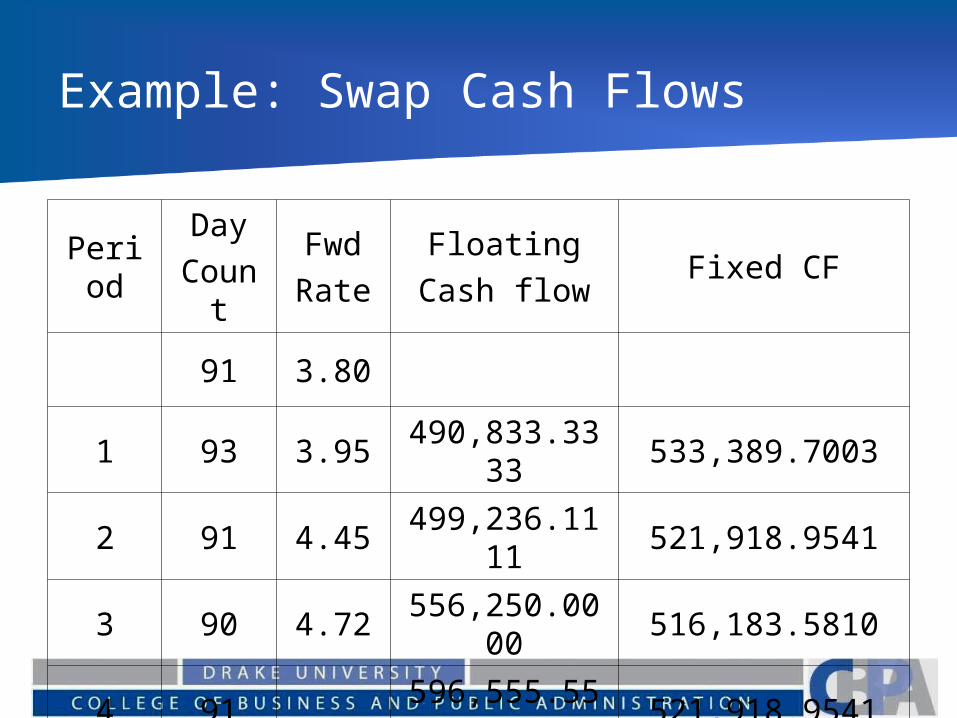
Example: Swap Cash Flows
Period
DayCount
FwdRate
FloatingCash flow
Fixed CF
91 3.80
1 93 3.95490,833.333
3533,389.7003
2 91 4.45499,236.111
1521,918.9541
3 90 4.72556,250.000
0516,183.5810
4 91596,555.555
5521,918.9541

Swap Spread
The swap spread would then be the difference between the swap rate and the on the run treasury of the same maturity.

Swap valuation revisited
The value of the swap will change over time.After the first payments are made, the futures prices and corresponding interest rates have likely changed. The actual second payment will be based upon the 3 month LIBOR at the end of the first period.Therefore the value of the swap is recalculated.


