Deriving the Optimal Amount of Risk Capital for P/L Insurance Companies utilizing ALM We present a model for P/L insurance companies based on Asset-Liability- Management (ALM) to determine the optimal level of risk capital. We show analytically for normal distributed claims that an overall optimum of the firm’s cash-flow and risk situation can be obtained when utilizing ALM optimization subject to a ruin probability constraint and generalize our findings to non-normal claim distributions using Monte Carlo Simulation. Our results illustrate the positive effect of ALM in comparison to pure asset-management, the possible reduction of required risk capital, and the enhancement in return on risk capital. Our theoretical approach can be used to derive practical recommendations for managerial decision making concerning minimizing risk capital, optimal asset (and liability) allocation, and maximizing the required return on capital. Keywords: asset-liability-management (ALM), internal risk model, portfolio optimization, risk capital JEL-classification: G11, G22, G32 Dr. Matthias Schmautz Dr. Niklas Lampenius [email protected][email protected]Munich Department of Accounting and Finance Germany University Hohenheim Schloss Osthof-Ost 70593 Stuttgart Germany
Transcript
Deriving the Optimal Amount of Risk Capital for P/L Insurance
Companies utilizing ALM
We present a model for P/L insurance companies based on Asset-Liability-Management (ALM) to determine the optimal level of risk capital. We show analytically for normal distributed claims that an overall optimum of the firm’s cash-flow and risk situation can be obtained when utilizing ALM optimization subject to a ruin probability constraint and generalize our findings to non-normal claim distributions using Monte Carlo Simulation. Our results illustrate the positive effect of ALM in comparison to pure asset-management, the possible reduction of required risk capital, and the enhancement in return on risk capital. Our theoretical approach can be used to derive practical recommendations for managerial decision making concerning minimizing risk capital, optimal asset (and liability) allocation, and maximizing the required return on capital.
Evidence of the usefulness of regulatory capital requirements for financial institutions based on
the VaR is presented by Cuoco and Liu (2006) who find that VaR based capital requirements
can be very effective not only in limiting portfolio risk but also in inducing financial institutions
to reveal the risk of their investments and to adequately support this risk with capital.
We decide to utilize the CVaR as risk measure when deriving an insurer’s surplus whilst
simultaneously capturing the dependencies within and between the asset and liability portfolios,
due to its property of being a coherent risk measure2 for normal as well as for non-normal
distributed risks. For evaluations of the quality of the VaR or CVaR as risk measure refer to
Artzner et al. (1997; , 1999), Acerbi and Tasche (2002), Alexander and Baptista (2004),
Alexander et al. (2007), Tasche (2002), or Yamai and Yoshiba (2005), to name but a few. For a
comprehensive overview on alternative quantile based risk measures to the VaR refer to Dowd
and Blake (2006) and for risk capital allocation using coherent risk measures based on one-sided
moments of very general distributions refer to Fischer (2003).
In general, when optimizing portfolios the utilization of tail value at risk measures leads to
solving a stochastic optimization problem where multiple algorithms have been proposed (Birge
& Louveaux, 2000; Ermoliev & Wets, 1988; Kall & Wallace, 1995).3 The utilization of tail value at
risk measures in portfolio management has been demonstrated by for instance Erik, Romeijn,
and Uryasev (2001) who apply the CVaR to a ALM problem of pension funds, or by Krokhmal
et al. (2002). Ferstl and Weissensteiner (2009) similarly apply a multi-stage stochastic linear
programming ALM to a pension scheme using a CVaR framework and Rockafellar and Uryasev
(2000) detail an approach to optimize a portfolio whilst minimizing the VaR and CVaR
simultaneously. An evaluation of the fundamental properties of the CVaR in the context of loss
2 With coherence being defined according to the axioms of Artzner et al. (1997; , 1999). 3 For particular applications in finance refer to Ziemba and Mulvey (1998) or Zenios (1996).
Risk capital and asset-liability-management
5
distributions has been provided by Rockafellar and Uryasev (2002) and a practical application of
credit risk mitigation is for instance detailed by Bucay and Rosen (1999) or Andersson et al.
(2001).
By implementing ALM in a context of absolute values and in establishing a direct relationship to
the required risk capital in the optimization procedure, we extend the works of Butsic (1994),
who has detailed the various implications of dependencies amongst assets and liabilities of
insurance companies in the context of ruin probability and risk capital. Further, we expand the
model by Li and Huang (1996), who determine the optimal composition of the insurance and
investment portfolio of a property-liability insurance company constrained by a risk-threshold
level to be defined by the insurer, by implementing a tail value at risk measure and establishing a
relationship to the required risk capital. Our works is also related to the model of Cummins and
Nye (1981), who apply mean-variance efficient portfolio theory to determine the efficient
frontier, where when applying the safety-first criterion the ruin probability is a consequence of
the selected product mix, i.e. the position on the efficient frontier. We extend their model by
illustrating the dependency of the level of risk capital on the asset allocation and show that an
optimal asset allocation exists that maximizes the return on risk capital whilst utilizing the
diversification effects of an ALM optimization. We include non-linear dependencies using
alternative claim distributions in our analysis and show that optimizing the asset allocation and
thereby defining the level of risk capital to meet the regulatory targets is of importance, not only
to satisfy the statutory requirements but also from a shareholder perspective.4 We thereby
elaborate on the research of Haugen and Kroncke (1970), Scheel et al. (1972), and Cummins and
Nye (1981) who mention in a side note that this optimization technique might be used to
maximize the value of equity.
Overall, we contribute to the existing literature by showing that an ALM optimization with direct
inclusion of risk capital in dependence on the total portfolio risk leads to an overall optimum of
the firm’s cash-flow and risk situation. I.e. the additional diversification effect of ALM in
comparison to pure asset-management allows for a reduction of required risk capital and the
maximization of return on capital. Furthermore, we show that for constrained efficient markets –
such conditions as provided by the regulatory requirements in the insurance industry – risk
management adds value to shareholders. We generalize our analytical findings for normal
4 A model and the consequent management of alternative loss distributions consisting of non-catastrophe and catastrophe losses with non-linear dependencies has been previously investigated by Eling and Toplek (2009) based on the model presented by Eling et al. (2008). We take a different approach by illustrating the effect of various distributions on the risk capital and propose an optimal ALM solution to maximize the return on capital considering a tail value at risk measure and establishing a relationship to the required risk capital.
Risk capital and asset-liability-management
6
distributed claims to different claim distributions using Monte Carlo simulation. The paper is
structured as follows. First, we integrate our research in the existing literature. Second, we derive
our model analytically, and third we generalize our findings to different claim distributions. A
discussion of the implications and further research concludes.
B. Asset-liability-management applied to an insurance context
Asset-liability-management (ALM), which in general is assigned a particular importance in the
insurance industry (Cummins & Nye, 1981; Kahane & Nye, 1975), allows for a systematic
management of risks induced through the assets as well as the liabilities of the insurer. ALM in
this context mainly serves the achievement of financial stability and thereby affects the quality of
the products, guarantees the compliance with regulatory requirements, and grants a risk adequate
return for equity holders.5 We focus on the particular aspect of managing assets and liabilities in a
portfolio context and view insurance companies as levered financial institutions holding financial
assets to ascertain the coverage of liabilities generated through the underwriting activity. This
allows for a separate evaluation of two distinct portfolios held by the insurer. On the liability-side
the insurer holds a portfolio consisting of different insurance lines, such as auto, fire, etc.,
generating premium income and claims. The pool of funds available for investment – on the
asset-side of the insurer - consists of the paid in premiums as well as of the risk capital supplied
by the owners.
It is reasonable to assume that both portfolios are risky and not independent. This proposition is
supported by empirical evidence regarding the correlation coefficients between assets and
liabilities (Butsic, 1994; Kahane & Nye, 1975), the correlation coefficients between insurance
lines and mutual funds (Haugen, 1971), the correlation coefficients between insurance profits and
stock market returns (Biger & Kahane, 1978), as well as the correlations between the various
insurance lines and the dependencies between loss and expense ratios for various lines of
property and liability insurance (Lambert Jr & Hofflander, 1966). For more recent data on
estimates for a property-liability insurance company refer to Li and Huang (1996) alternatively for
a plausible argument for the utilized correlation structure refer to the argument in Eling et al.
(2008, pp. 664-665). The stochastic nature of the asset and insurance portfolio in combination
with the existence of dependencies amongst the various positions allows for ALM according to
modern portfolio theory, where managing assets entails the utilization of diversification effects
through efficient asset allocation and managing liabilities offers additional diversification potential
5 For a comprehensive overview on various measures mentioned in the context of ALM refer to Lamm-Tennant (1989).
Risk capital and asset-liability-management
7
through utilizing the not perfect correlations of the claim distributions of various insurance lines.
Combining both effects results in an efficient portfolio for the insurer.
Utilizing this kind of risk-return optimization of the overall position of the composite insurer is
not an entirely new idea and was initially proposed by Michaelsen and Goshay (1967), Ferrari
(1967), and Haugen and Kroncke (1970), the later are subject to an important comment by Scheel
et al. (1972) clarifying some important issues regarding the relevance of dependencies amongst
the stochastic variables.6 Various alternative ALM optimization models were consequentially
developed, such as the models proposed by Kahane and Nye (1975), Quirin and Waters (1975),
Markle and Hofflander (1976), Kahane (1977a; , 1977b; , 1977c), Cummins and Nye (1981),
Butsic (1994) and Dus and Maurer (2001). Most recently simulative approaches not relevant for
our analytical model have increased in popularity, such as multistage stochastic programming
models to determine the optimal asset allocation strategy integrating equity exposure as a
function of risk capital (Carino et al., 1994), dynamical models utilized to simulate cash flows in
order to forecast assets, liabilities, and ruin probabilities for different scenarios (Eling &
Parnitzke, 2007), or the simulation of ALM utilizing a discrete model (Gerstner, Griebel, Holtz,
Goschnick, & Haep, 2008). Overall, it is well established that ignoring the dependencies of assets
and liabilities results in inefficient positions (Krouse, 1970; Pyle, 1971).
When applying the above mentioned models the resulting optimization most often reduces the
activity of the insurer to a few insurance lines only, implying the abandonment of the other lines.
Whereas, the asset portfolio in general is easily restructured, the modification of the activity in
existing insurance lines seems problematic. Arguments against an unconstrained modification of
the liability side are often based on marketing, market share, and cross-selling arguments; the
most prominent argument being that for competitive reasons most insurers must offer a full
range of coverage. A similar argument is posed by product complementarities, where, for
instance, in most cases auto liability and auto physical damage insurance are written as a package.
The financial results from the two insurance lines, however, are evaluated separately, where the
profitability of the two lines often differs. If the company decides that one of the lines is
undesirable, the cutbacks in that line will be complemented with cannibalization effects in the
other line. Furthermore, the costs associated with establishing any given line of business rules a
spontaneous withdrawal from any particular line except under the most severe circumstances out.
An abrupt increase in premium volume in any given line could lead to a compromising of the
company’s underwriting capacity and would most likely lead to the acceptance of substandard
6 It should be noted that for empirical testing of their propositions Haugen (1971) did not develop the entire efficiency frontier and Ferrari (1967) developed only the efficient insurance frontier.
Risk capital and asset-liability-management
8
business. In conclusion, an unrestricted ceteris paribus optimization of the contracting volume of
the various insurance lines is not realistic.
An improvement of this unrealistic optimization solution is a limitation of the possible ranges of
weights for the insurance lines during the optimization process, as has been proposed by various
authors (Cummins & Nye, 1981; Ferrari, 1967; Kahane & Nye, 1975). Although improving the
unconstrained models we are still of the opinion that adapting the activity in various insurance
lines to the optimal ALM solution is rarely possible in the short-run. Granted that it is possible to
restructure the insurance portfolio with some effort and financial commitment over a longer
period of time, it is still questionable whether the optimal structure at a particular point in time is
stable over time and still optimal at a later point. Considering the dependence of the optimal
solution on the correlation structure amongst assets, liabilities, and the market, the existence of
an inter-temporal optimum seems not plausible.
Additional criticism can be expressed regarding the assumption – common to all models – that
the return on premium income is independent of the quantity of the insurance contracts. This
proposition assumes that the pricing of insurance premiums is entirely market dependent, i.e. the
market pays only the actuarially fair premium, which disregards the possibility of an active pricing
policy of the insurer. Also, economies of scale as well as pooling effects due to higher insurance
volumes are ignored. Finally, all of the reported studies utilize relative measures, i.e. returns of the
asset portfolio and returns of the insurance portfolio. This approach has recently been criticized,
since evaluating risk utilizing relative measures is commonly questioned in discussions regarding
solvability and Solvency II. Here the concurrent opinion is that measurements utilizing an
absolute value are preferred (IAA, 2004). Ruin probability, if included in the models, serves only
as constraint truncating the efficient frontier.
We, in the following model the optimal ALM-mix for a 1-period insurance portfolio and an asset
portfolio utilizing absolute values when optimizing the portfolios to allow for the inclusion of an
absolute risk measure in the optimization process.
C. Model
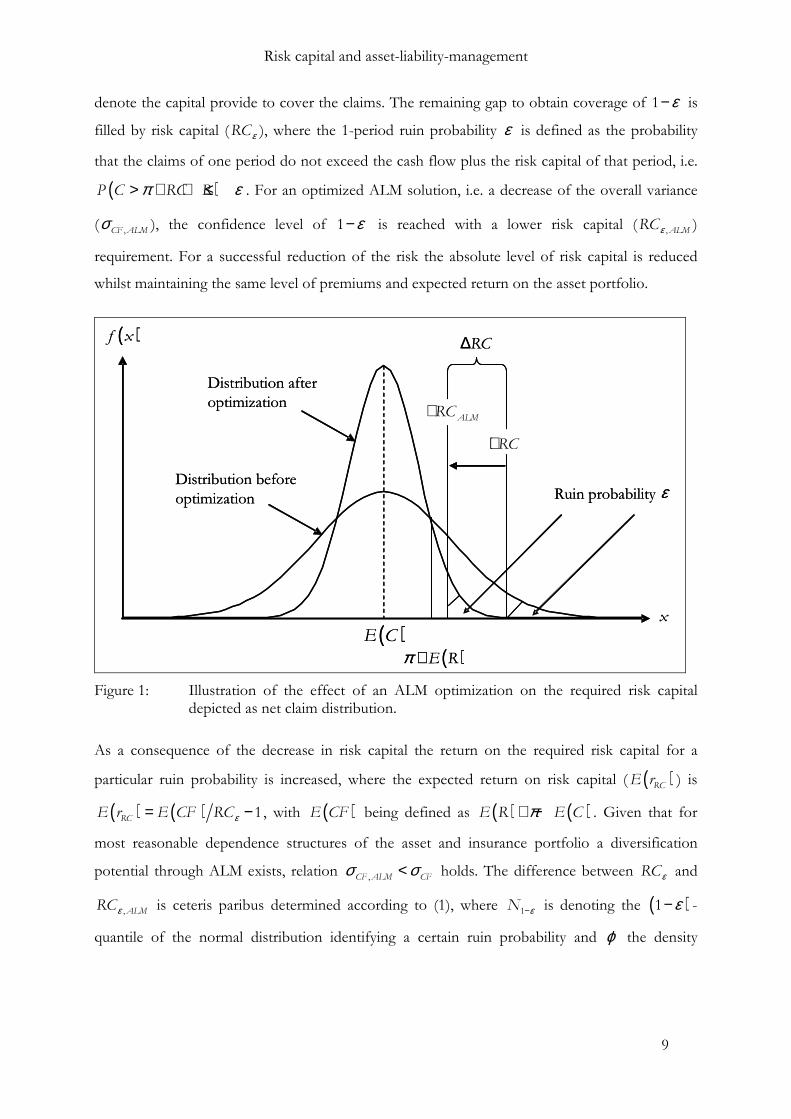
We initially illustrate the expected effects of ALM using normal distributed claims in Figure 1. In
the subsequent section the model is formulated for normal distributed asset returns and claims
and a linear dependency structure and extended to include the regulatory constraint of a
particular ruin probability. Figure 1 illustrates the claim distribution – before and after assessing
the full optimization potential – with the expected claim denoted as ( )E C . The aggregated
premiums (π ) and the expected cash flows from the asset portfolio ( ( )E R ), in total ( )E Rπ + ,
Risk capital and asset-liability-management
9
denote the capital provide to cover the claims. The remaining gap to obtain coverage of 1 ε− is
filled by risk capital ( εRC ), where the 1-period ruin probability ε is defined as the probability
that the claims of one period do not exceed the cash flow plus the risk capital of that period, i.e.
( )π ε> + + ≤P C RC R . For an optimized ALM solution, i.e. a decrease of the overall variance
( ,CF ALMσ ), the confidence level of 1 ε− is reached with a lower risk capital ( ε , ALMRC )
requirement. For a successful reduction of the risk the absolute level of risk capital is reduced
whilst maintaining the same level of premiums and expected return on the asset portfolio.
Distribution afteroptimization
Ruin probabilityDistribution beforeoptimization
( )E C
( )E Rπ +
( )f x
ε
RC∆
RC+
ALMRC+
x
Distribution afteroptimization
Ruin probabilityDistribution beforeoptimization
( )E C
( )E Rπ +
( )f x
ε
RC∆
RC+
ALMRC+
x
Figure 1: Illustration of the effect of an ALM optimization on the required risk capital depicted as net claim distribution.
As a consequence of the decrease in risk capital the return on the required risk capital for a
particular ruin probability is increased, where the expected return on risk capital ( ( )RCE r ) is
( ) ( ) 1RCE r E CF RCε= − , with ( )E CF being defined as ( ) ( )E R E Cπ+ − . Given that for
most reasonable dependence structures of the asset and insurance portfolio a diversification
potential through ALM exists, relation ,CF ALM CFσ σ< holds. The difference between RCε and
, ALMRCε is ceteris paribus determined according to (1), where 1N ε− is denoting the ( )1 ε− -
quantile of the normal distribution identifying a certain ruin probability and ϕ the density
Risk capital and asset-liability-management
10
function of the standard normal distribution.7 The reduction in risk capital consequently leads to
an increase in return on risk capital according to (2).
( ) ( )1
, ,ALM CF CF ALM
NRC RC
εε ε
ϕσ σ
ε−− = ⋅ − (1)
( ) ( ) ( ) ( ),
,
1 1RC ALM RC
ALM
E CF E CFE r E r
RC RCε ε
= − > = − (2)
This result is not surprising given the findings from modern portfolio theory, where for
correlated asset classes – irrespective whether they consist of assets, claims, or a combination of
both - diversification potential exists. We in the next section analytically implement a model
relaxing the ceteris paribus constraint. Moreover, we investigate – with a direct focus on the
minimum required risk capital – whether an optimal combination of assets and liabilities can be
achieved.
The model is derived analytically for the simplified state of normal distributed asset returns and
claims and a linear dependency structure between the asset return and the claim distributions.
Later on, we generalize the findings to various claim distributions and non-linear relations
utilizing Monte Carlo Simulation. For the model we assume that individuals are risk-avers and
apply the mean-variance criterion in selecting their portfolios.8 Markets are efficient, i.e.
transaction costs and taxes do not exist, and information is costless. The optimization model is
illustrated for a P/L insurer that holds a portfolio of insurance policies (from different insurance
lines) and has invested the proceeds from the contracts in various asset classes. Insurance
contracts mature in one period, the premiums are paid at the beginning of the period and are
available for investment in assets, where one dollar of premium in any insurance line generates
exactly one dollar of investible funds, as it is assumed by others (Kahane, 1978; Kahane & Nye,
1975). Insurance claims are paid at the end of the period. The equity capital corresponds to the
risk capital and other components that could according to regulatory statutes also be classified as
risk capital are ignored.
The assets available for investment in 0t are the aggregated premiums (π ) as well as the risk
capital (RCε ), which are proportionally invested in AN asset classes ( j ) at an expected rate of
7 This formulation corresponds to a part of the conditional value at risk, introduced at a later point. 8 Obviously this assumption is restrictive given the ignorance of the influence of higher moments of the
distribution and might be inconsistent with the commonly accepted axioms of behavior under uncertainty (Borch, 1969; Feldstein, 1969). On the other hand, studies have identified conditions under which the mean variance criterion does appear to be at least approximate valid (Merton, 1971; Samuelson, 1970).
Risk capital and asset-liability-management
11
return ( )jE r with the corresponding weights jw , where 1
1N
jjw
==∑ and jr follow a normal
distribution. The expected absolute return on the asset portfolio ( ( )E R )9 is then determined
according to (3) with ( )1 Nw w=w' ⋯ and ( ) ( )( )1 NE r E r=R' ⋯ .
( ) ( )E R RCε π= + ⋅ w'R (3)
The income generated through the asset portfolio is paid at the end of the period in 1t . The risk
of asset portfolio A is defined through the standard-deviation of returns ( 2
aσ ), which is a
composite measure of the weighted variances ( 2
aσ = w'Ωw ), with the variance-covariance-matrix
Ω defined according to (4). Here ,i jρ denotes the correlation between asset i and j .
2
1 2,1 2 1 ,1 1
2
1,2 1 2 2 ,2 2
2
1, 1 2, 2
N N
N N
N N N N N
σ ρ σ σ ρ σ σρ σ σ σ ρ σ σ
ρ σ σ ρ σ σ σ
⋅ ⋅ ⋅ ⋅ ⋅ ⋅ ⋅ ⋅ = ⋅ ⋅ ⋅ ⋅
Ω
⋯
⋯
⋮ ⋮ ⋱ ⋮
⋯
(4)
The variance of the asset portfolio 2
aσ expressed in absolute values ( 2Aσ ) is determined
according to (5).
( )22 2
A aRCεσ π σ= + ⋅ (5)
Insurance claims (C ) are for now considered to be normally distributed ( ( )( ), CC E C σΝ∼ )
and generate a cash drain at the end of the period. Given the assumed fixed mix of the insurance
portfolio and the premium in 0t , the risk of the insurance portfolio is solely determined through
the variance of the aggregated claims, i.e. 2
Cσ . For CN insurance lines – with a linear dependency
structure amongst lines ( ,Ci Cjρ ) and Ciσ expressed in absolute values – Cσ is determined
according to (6), with CΣ representing the variance-covariance-matrix of the claims expressed in
absolute values and ( )1C CNσ σ=c' ⋯ denoting the vector of the standard deviations of the
various claims.
9 In the following majuscules denote absolute values, minuscules denote relative values.
Risk capital and asset-liability-management
12
( )σρ ρ
ρ ρ σσ σ σ σ
ρ ρ σ
= =
⋯
⋯⋯
⋮ ⋮ ⋱ ⋮ ⋮
⋯
12, 1 , 1
1, 2 , 22 21 2
1, 2,
1
1
1
CC C CN C
C C CN C CC C C CN
C CN C CNCN
Cc'Σ c (6)
The expected company cash flow ( ( )E CF ) at the end of the period generated by the two
portfolios is then determined according to (7) where the relevant overall risk, i.e. the standard
deviation of the cash flow ( CFσ ), is a combination of the risk from the asset portfolio ( Aσ ) and
the insurance risk ( Cσ ).
( ) ( ) ( )E CF E R E Cπ= + − (7)
In absolute values CFσ can be expressed through (8) with ( )σ ′= 2CCΩ 0 and COV defined
according to (9), where ,i Cjρ denotes the correlation between asset class i and insurance line j .
( )( ) ( )2CF
RCRCε
πσ π
+ ⋅ = + ⋅
C
Ω COV ww' 1
COV Ω 1 , (8)
with
ρ σ σ ρ σ σ
ρ σ σ ρ σ σ
⋅ ⋅ ⋅ ⋅ = ⋅ ⋅ ⋅ ⋅
⋯
⋮ ⋱ ⋮
⋯
1, 1 1 1 , 1 1
1, 1 ,
C C N C N C
CN CN N CN N CN
COV (9)
Up to this point we used the RCε as a fixed input variable for the model, determining the
investment basis of the asset-portfolio. We in the following assume the risk capital not to be
fixed and focus on the determination of the required risk capital for a particular overall company
risk level. To ensure solvency for 1 ε− percent of all possible states the cash from premiums
(π ), the paid in risk capital (RCε ), and the cash flow generated through the asset portfolio
returns (R ) are of relevance. At this point the risk capital is the residual value that has to ensure
that the insurer is solvent for all instances except those excluded through the ruin probabilityε .
Applying the CVaR and assuming normal distributed risks allows for the formulation of (10),
where we interpret the CVaR as necessary RCε to maintain the predefined level of ruin
probability with 1N ε− denoting the ( )1 ε− -quantile of the normal distribution and ϕ denoting
the density function of the standard normal distribution.
Risk capital and asset-liability-management
13
( ) ( ) ( )1
CF
NCVaR E C E R RC
εε ε
ϕπ σ
ε−= − − + ⋅ = (10)
It should be noted that in equation (10) the risk capital appears on both sides of the equation,
given that the capital allocation to the asset portfolio depends partially on the level of RCε as
defined in (3). Solving for RCε is not straight forward. We derive (11) as the result after
substituting (3) and (8) in (10) with ( )1z N εϕ ε−= .
( ) ( ) ( )( ) ( ) .5
RCRC E C RC z RC
εε ε ε
ππ π π
+ = − − + + + ⋅ C
Ω COV ww'R w' 1
COV Ω 1(11)
Rearranging (11) results in (12), and provided that the function has two roots we are interested in
the minimum given that we intend to minimize the required εRC of the insurer. Interpreting (12)
as a function of w , i.e. ( )f w , the optimal asset-liability-mix is obtained by taking the derivative
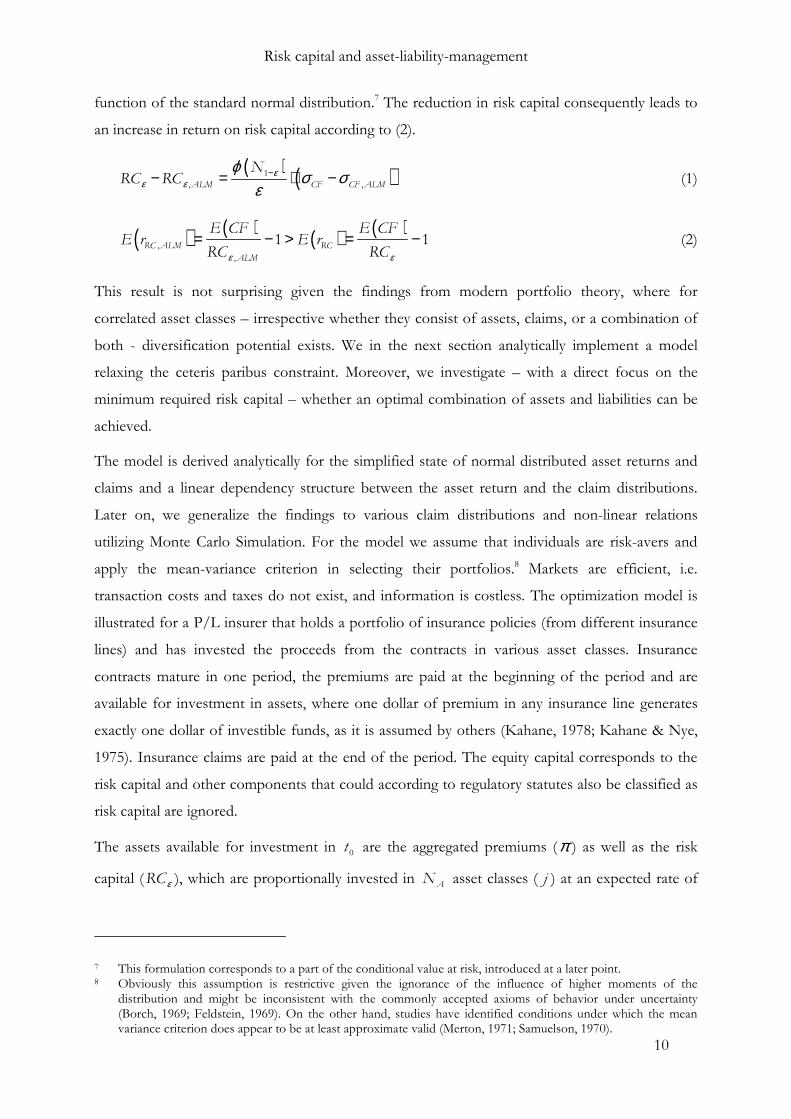
Figure 3: Risk capital, including the minimum, in dependence on the expected cash flow
( )E CF from the overall portfolio for asset-management and asset-liability-
management derived for alternative asset combinations.
In general, we highlight that applying ALM does decrease the necessary amount of RCε as
expected when considering diversification effects known from portfolio theory. In addition, we
find that for a given ruin probability ε an optimal asset allocation exists. Overall, our results
imply that when considering ALM in combination with a required level of ruin probability there
exists an optimal asset-liability mix that minimizes the required level of risk capital. This finding
11 Here the optimal weights are determined by solving (13) under the assumption that 0=COV .
Risk capital and asset-liability-management
16
has consequences for the return on capital given that for a particular asset combination the return
on capital can be maximized without inducing a change in the risk profile of the insurer, whilst
fulfilling the regulatory requirements of sustaining a particular level of ruin probability. In the
following we generalize the findings to more realistic distributions of claims using a simulative
approach.
D. Generalization of the findings to alternative claim distributions with a non-linear
dependency structure between the asset and the liability portfolio
Granted that claim distributions do not follow a normal distribution we apply the model results
in a simulative approach to different distributions. We do not enter the discussion which
distribution is most feasible given that depending on the problem, the distribution might be any
of a large number, including: normal, lognormal, t, log-t, elliptical, hyperbolic, Pareto, Pearson-
family, Johnson-family, etc. Alternatively, when dealing with extreme events, such as
catastrophes, large claims, ruin probabilities for solvent institutions, extreme mortality risks, etc.,
an extreme value method might be best suited, such as for instance a Weibull, Gumbel, or
Fréchet distribution or alternatively peaks-overthreshold theory commonly modeled utilizing a
generalized Pareto distribution (Dowd & Blake, 2006). Testing the validity of the results of our
model, we take a small selection of potential claim distributions into account and simulate the
Normal, Weibull, Gumbel, and the Beta distribution.
In addition, we follow the literature in that solely considering linear correlations is not
appropriate when modeling dependence structures between heavy-tailed and skewed insurance
risks and the asset portfolio. In a simulative approach we therefore assume the claim distribution
to be related to the asset portfolio through a rank correlation measure (Kendall’s tau), given that
rank correlations are invariant under monotonic transformations and thus not affected by the
marginal distributions (McNeil, Frey, & Embrechts, 2005, pp. 206-208). We, for comparative
reasons, utilize the numerical scenario, as detailed above and in Table 1, as setting and
parameterize the claim distributions in such a fashion that the first two moments are identical to
the scenario with normal distributed claims for all simulations. In reference to Table 1 we model
an expected claim of 240 with a standard deviation of 33.60 and the associated rank correlations
to the various asset classes as detailed in Table 1. We assume that assets are normal distributed
and that the claim distribution follows either a Normal, Weibull, Gumbel, or Beta distribution.
We implement a Weibull distribution with a shape parameter of 6, a scale parameter of 186.90,
and a location parameter of -413.39, resulting in a mean of -240.00, a standard deviation of 33.60
and a skewness and kurtosis of –.37 and 3.04 respectively. The Gumbel distribution is
implemented using a location parameter of 224.88µ = − and a scale parameter of 26.20s = ,
Risk capital and asset-liability-management
17
resulting in a mean of -240.00, a standard deviation of 33.60 and a skewness and kurtosis of -1.14
and 5.40 respectively. The beta distribution is implemented as a four parameter distribution with
two shape parameters 7α = and 2.5β = and two location parameters to alter the location and
scale of the distribution representing the minimum and maximum values of the distribution with
min 422.18= − and max 174.95= − , resulting in a mean of -240.00, a standard deviation of 33.60
and a skewness and kurtosis of -.6062 and 3.03 respectively.
We utilize Monte Carlo simulation to determine the optimal asset combination that ensures for a
particular claim distribution and a given RCε that the CVaRε does not exceed a ruin probability
of 0.01ε = . We implement this constraint by simulating 1,000,000 runs for the various asset and
the claim distributions for a particular predefined set of asset weights. We then evaluate the
resulting CF distribution and the CVaRε by slicing the resulting 1 percent tail distribution into
100 subsections and computing the mean. We apply this simulation to 15,625 permutations of
asset combinations, i.e. weights, and run this set of simulations for various levels of RCε , i.e. we
subsequently increase the level of RCε to be able to depict the relationship between RCε and
( )E CF as detailed in Figure 3 for alternative claim distributions. For each completed simulation
run we select the set of asset weights that minimizes the difference between the predefined RCε
and the CVaRε for further analysis. After having conducted the simulation for a feasible range
of RCε we obtain a scatter-plot of efficient combinations and aggregate the data as proxy for the
RCε -function applying a non-linear 2nd degree polynomial regression analysis, the resulting
functions are detailed in Table 2, including the minimum coordinates.
Granted that we base our analysis on the tail distribution of the CF distribution with 0.01ε =
the simulation runs need to be substantially high to obtain robust results. As a consequence there
is a trade-off between accuracy and time/CPU resources. We select a middling approach that, in
our opinion, provides for sufficient accuracy to illustrate the effect whilst keeping computations
at a reasonable level. To illustrate the accuracy of our simulative approach we depict the analytical
solution using normal distributed claims and the simulated solution for the same distribution in
Table 2 and Figure 4, where the deviation of the simulated result to the analytical solution is in
our opinion negligible. As illustrated in Figure 4, the evaluated relation holds for different
assumptions regarding the claim distribution. In general, an optimal asset portfolio exists for any
simulated distribution with varying degrees of consequences for the shareholders. As seems
obvious the need for an accurate determination of the optimal asset portfolio increases with the
curvature of the function, where for fairly flat structures the deviations from the minimum are
almost negligible and for large curvature the accuracy seems to be of crucial importance.
Risk capital and asset-liability-management
18
Determining the optimal asset mix seems particularly important for an assumed Gumbel claim
distribution, given that the risk capital is rather high and increases substantially when deviating
from the optimal asset mix. These findings imply that for business units that cover events that
often are approximated using a Gumbel distribution, such as catastrophes, large claims, ruin
probabilities for solvent institutions, extreme mortality risks, etc. our optimization technique is of
high relevance when attempting to minimize the risk capital.
Table 2: Estimated functions for the simulation of different claim distributions of the risk capital in dependence on the E(CF), including the minimum of the functions.
Estimated function of the risk capital Minimum of function at Assumed claim distribution for simulation runs
( )E CF RCε
Normal distribution (analytic solution)
30.25 58.34
Normal distribution (simulated solution)
( )( ) ( ) ( )2.1042 6.3459 155.25f E CF E CF E CF= ⋅ − ⋅ + 30.45 58.63
Weibull distribution ( )( ) ( ) ( )2.1241 7.8246 184.64f E CF E CF E CF= ⋅ − ⋅ + 31.52 61.30
Gumbel distribution ( )( ) ( ) ( )2.3574 20.062 376.98f E CF E CF E CF= ⋅ − ⋅ + 28.07 95.44
Beta distribution ( )( ) ( ) ( )2.1585 9.9257 218.80f E CF E CF E CF= ⋅ − ⋅ + 31.31 63.41
55
75
95
115
135
155
22 27 32 37 42
E(CF)
RC
-req
uir
emen
t (C
VaR
)
1-e
=9
9%
Normal distribution (simulated solution)Normal distribution (analytic solution)Weibull distributionBeta distributionGumbel distribution
55
60
65
70
75
80
85
22 27 32 37 42
E(CF)
RC
-req
uir
emen
t (C
VaR
)
1-e
=9
9%
Normal distribution (simulated solution)
Normal distribution (analytic solution)
Weibull distribution
Beta distribution
Figure 4: Illustration of the simulation results regarding the relation between ( )E CF and
RCε for 0.01ε = and a parameterization of the scenario according to Table 1.
The left graph includes and the right graph excludes the Gumbel distribution.
As illustrated above, for any of the tested distributions a minimum of required risk capital can be
determined, which maximizes the relation of cash-flow and capital, i.e. the return on capital. The
more skewed the underlying claim distribution, the more capital is necessary to fulfil the ruin
probability constraint. The overall result – the possibility to compute an optimal amount of
required capital – holds independent of the underlying distribution assumption, but the
Risk capital and asset-liability-management
19
implications regarding the severity of not reaching an optimal solution depend heavily on the
claim distribution.
E. Conclusion
Motivated by the recent discussion on the topics of risk-management and risk capital
requirements within Solvency II and the current financial market developments, we illustrate the
close relationship between capital employed and risk-management for an insurance company,
where the level of risk capital determines the company’s and the associated insurance products’
probability of default. We develop and evaluate an asset-liability-management model considering
regulatory requirements and the specific needs of insurance companies. The model focuses on
the management of assets and liabilities using modern portfolio theory and capitalizes on the
resulting diversification effects from the existing dependencies of the various positions. We
extend the existing literature through directly optimizing the level of required risk capital by
changing the asset-liability portfolio weights whilst utilizing a tail value at risk. This is achieved
through the usage of absolute values in the optimization model and the definition of the CVaR
as the determinant for the required risk capital. The optimization assumes a given level of ruin-
probability and the traditional mean-variance optimizing investor. We in addition define the
insurance portfolio to be fixed to incorporate the assumption that boldly restructuring insurance
lines is not realistic in the short-term context of ALM optimization procedures. Our optimized
solution provides the following results:
We show that an asset-management-only approach is inferior to an asset-liability-management
approach in terms of risk-(absolute) return performance. Moreover, as a result, the level of risk
capital – e.g. as required by regulators – can be reduced by capitalizing on the diversification
effects from the asset as well as from the liability portfolio without incurring a deterioration of
ruin probability. In addition, we find that when incorporating the CVaR as constraint, ensuring a
particular ruin probability, the optimization problem resolves to minimizing a quadratic function,
allowing for further optimization potential. Granted that at the minimum of the function the risk
capital is minimized, we find that from a managerial perspective the asset portfolio should be
optimized to achieve the minimum risk capital and in consequence to increase the return on risk
capital for equity holders. We confirm our results by applying the model to more realistic claim
distributions (Weibull, Gumbel, and Beta) utilizing a Monte Carlo simulation. Our findings
indicate that, particularly when dealing with skewed claim distributions, the risk capital changes
substantially when deviating from the optimal asset mix. Overall, for any of the distributions
under investigation an optimal combination of capital, risk and cash-flow can be derived,
resulting in the highest possible return on capital for a given predetermined ruin probability. The
Risk capital and asset-liability-management
20
provided findings are of relevance for managerial decision making, given that shareholders prefer
a minimum of risk capital, i.e. tied up capital, to run operations.
Risk capital and asset-liability-management
21
F. Literature
Acerbi, C., & Tasche, D. (2002). On the coherence of expected shortfall. Journal of Banking & Finance, 26(7), 1487-1503.
Alexander, G. J., & Baptista, A. M. (2004). A Comparison of VaR and CVaR Constraints on Portfolio Selection with the Mean-Variance Model. Management Science, 50(9), 1261-1273.
Alexander, G. J., Baptista, A. M., & Yan, S. (2007). Mean-variance portfolio selection with 'at-risk' constraints and discrete distributions. Journal of Banking & Finance, 31(12), 3761-3781.
Andersson, F., Mausser, H., Rosen, D., & Uryasev, S. (2001). Credit risk optimization with conditional Value-At-Risk criterion. Mathematical Programming, Series B 89, 273-291.
Artzner, P., Delbaen, F., Eber, J.-M., & Heath, D. (1999). Coherent measures of risk. Mathematical Finance, 9(3), 203228.
Biger, N., & Kahane, Y. (1978). Risk considerations in insurance ratemaking. Journal of Risk & Insurance, 45(1), 121-132.
Birge, J. R., & Louveaux, F. (2000). Introduction to stochastic programming (2 ed.). New York, NY: Springer.
Bloomer, J. (2005). Developments in international financial reporting standards and other financial reporting issues. Geneva Papers on Risk & Insurance - Issues & Practice, 30(1), 101-107.
Borch, K. (1969). A note on uncertainty and indifference curves. Review of Economic Studies, 36(105), 1-4.
Bucay, N., & Rosen, D. (1999). Credit risk of an international bond portfolio: A case study. ALGO Research Quarterly, 2(1), 9-29.
Butsic, R. P. (1994). Solvency measurement for property-liability risk-based capital applications. Journal of Risk & Insurance, 61(4), 656-690.
Carino, D. R., Kent, T., Myers, D. H., Stacey, C., Sylvanus, M., Turner, A. L., et al. (1994). The Russel-Yasuda Kasai model: An asset/ liability model for a Japanese insurance company using multistage stochastic programming. Interfaces, 24(1), 29-49.
Cramér, H. (1930). On the mathematical theory of risk. In Skandias-Festskrift (pp. 7-84). Stockholm: Försäkringsaktiebolaget.
Cummins, J. D., & Nye, D. J. (1981). Portfolio optimization models for property-liability insurance companies: An analysis and some extensions. Management Science, 27(4), 414-430.
Cummins, J. D., & Sommer, D. W. (1996). Capital and risk in property-liability insurance markets. Journal of Banking & Finance, 20(6), 1069-1092.
Cuoco, D., & Liu, H. (2006). An analysis of VaR-based capital requirements. Journal of Financial Intermediation, 15(3), 362-394.
Dowd, K., & Blake, D. (2006). After VaR: The theory, estimation, and insurance applications of quantile-based risk measures. Journal of Risk and Insurance, 73(2), 193-229.
Dus, I., & Maurer, R. (2001). Integrated asset liability modelling for property casuality insurance: A portfolio theoretical approach (pp. 1-15): Johann Wolfgang Goethe-Universität Frankfurt am Main: Fachbereich Wirtschaftswissenschaften.
Eling, M., & Parnitzke, T. (2007). Dynamic financial analysis: Classification, conception, and implementation. Risk Management and Insurance Review, 10(1), 33-50.
Eling, M., Schmeiser, H., & Parnitzke, T. (2008). Management strategies and dynamic financial analysis. Variance, 2(1), 52-70.
Eling, M., Schmeiser, H., & Schmit, J. T. (2007). The solvency II process: Overview and critical analysis. Risk Management & Insurance Review, 10(1), 69-85.
Eling, M., & Toplek, D. (2009). Modeling and management of nonlinear dependencies - Copulas in dynamic financial analysis. Journal of Risk & Insurance, 76(3), 651-681.
Risk capital and asset-liability-management
22
Erik, B., Romeijn, E. H., & Uryasev, S. (2001). Asset/Liability management for pension funds using CVaR constraints. Journal of Risk Finance, 3(1), 57-71.
Ermoliev, Y., & Wets, R. J. B. (Eds.). (1988). Numerical techniques for stochastic optimization: Springer. Feldstein, M. S. (1969). Mean-variance analysis in the theory of liquidity preference and portfolio
selection. Review of Economic Studies, 36(105), 5-12. Ferrari, J. R. (1967). A theoretical portfolio selection approach for insuring property and liability lines. Paper
presented at the Proceedings of the Casualty Actuarial Society. Ferstl, R., & Weissensteiner, A. (2009). Asset-liability management under time-varying investment
opportunities. SSRN eLibrary, from http://ssrn.com/paper=1399609 Fischer, T. (2003). Risk capital allocation by coherent risk measures based on one-sided
moments. Insurance: Mathematics & Economics, 32(1), 135-146. Gerstner, T., Griebel, M., Holtz, M., Goschnick, R., & Haep, M. (2008). A general asset-liability
management model for the efficient simulation of portfolios of life insurance policies. Insurance: Mathematics & Economics, 42(2), 704-716.
Haugen, R. A. (1971). Insurance risk under alternative investment and financing strategies. Journal of Risk & Insurance, 38(1), 71-80.
Haugen, R. A., & Kroncke, C. O. (1970). A portfolio approach to optimizing the structure of capital claims and assets of a stock insurance company. Journal of Risk & Insurance, 37(1), 41-48.
IAA. (2004). A global framework for insurer solvency assessment. Ottawa: International Actuarial Association (IAA).
Kahane, Y. (1977a). Capital adequacy and the regulation of financial intermediaries. Journal of Banking & Finance, 1(2/3), 207-218.
Kahane, Y. (1977b). Determination of the product mix and the business policy of an insurance company - A portfolio approach. Management Science, 23(10), 1060-1069.
Kahane, Y. (1977c). Insurance exposure and investment risks: A comment on the use of chance-constrained programming. Operations Research, 25(2), 330-337.
Kahane, Y. (1978). Generation of investable funds and the portfolio behavior on the non-life insurers. Journal of Risk & Insurance, 45(1), 65-77.
Kahane, Y., & Nye, D. (1975). A portfolio approach to the property-liability insurance industry. Journal of Risk & Insurance, 42(4), 579-598.
Kall, P., & Wallace, S. W. (1995). Stochastic programming: John Wiley & Sons. Krokhmal, P., Palmquist, J., & Uryasev, S. (2002). Portfolio optimization with conditional value-
at-risk objective and constraints. Journal of Risk, 4(2), 11-27. Krouse, C. G. (1970). Portfolio balancing corporate assets and liabilities with special application
to insurance management. Journal of Financial & Quantitative Analysis, 5(1), 77-104. Lambert Jr, E. W., & Hofflander, A. E. (1966). Impact of new multiple line underwriting on
investment portfolios of property-liability insurers. Journal of Risk & Insurance, 33(2), 209-223.
Lamm-Tennant, J. (1989). Asset/liability management for the life insurer: Situation analysis and strategy formulation. Journal of Risk & Insurance, 56(3), 501-517.
Li, S. X., & Huang, Z. (1996). Determination of the portfolio selection for a property-liability insurance company. European Journal of Operational Research, 88(2), 257-268.
Markle, J. L., & Hofflander, A. E. (1976). A quadratic programming model of the non-life insurer. Journal of Risk & Insurance, 43(1), 99-120.
McNeil, A. J., Frey, R., & Embrechts, P. (2005). Quantitative risk management: Concepts, techniques and tools. Princeton, NJ: Princeton University Press.
Merton, R. C. (1971). Optimum consumption and portfolio rules in a continuous-time model. Journal of Economic Theory, 3(4), 373-413.
Meyer, L. (2005). Insurance and international financial reporting standards. Geneva Papers on Risk & Insurance - Issues & Practice, 30(1), 114-120.
Risk capital and asset-liability-management
23
Michaelsen, J. B., & Goshay, R. C. (1967). Portfolio selection in financial intermediaries: A new approach. Journal of Financial & Quantitative Analysis, 2(2), 166-199.
Pyle, D. H. (1971). On the theory of financial intermediation. Journal of Finance, 26(3), 737-747. Quirin, G. D., & Waters, W. R. (1975). Market efficiency and the cost of capital: The strange case
of fire and casualtity insurance companies. Journal of Finance, 30(2), 427-445. Rockafellar, R. T., & Uryasev, S. (2000). Optimization of conditional value-at-risk Journal of Risk,
2(3), 21-41. Rockafellar, R. T., & Uryasev, S. (2002). Conditional value-at-risk for general loss distributions.
Journal of Banking & Finance, 26(7), 1443-1471. Roy, A. D. (1952). Safety first and the holding of assets. Econometrica, 20(3), 431-449. Samuelson, P. A. (1970). The fundamental approximation theorem of portfolio analysis in terms
of means, variances and higher moments. Review of Economic Studies, 37(112), 537-542. Scheel, W. C., Belth, J. M., & Rejda, G. (1972). Optimizing the structure of capital claims and
assets of a stock insurance company: Comment. Journal of Risk & Insurance, 39(2), 305-310.
Tasche, D. (2002). Expected shortfall and beyond. Journal of Banking & Finance, 26(7), 1519-1533. von Bomhard, N. (2005). Risk and capital management in insurance companies. Geneva Papers on
Risk & Insurance - Issues & Practice, 30(1), 52-59. Wakker, P. P., Thaler, R. H., & Tversky, A. (1997). Probabilistic insurance. Journal of Risk and
Uncertainty, 15, 7-28. Yamai, Y., & Yoshiba, T. (2005). Value-at-risk versus expected shortfall: A practical perspective.
Journal of Banking & Finance, 29(4), 997-1015. Zenios, S. A. (Ed.). (1996). Financial optimization: Cambridge University Press. Ziemba, W. T., & Mulvey, J. M. (Eds.). (1998). Worldwide asset and liability modeling. Cambridge