Foundation for Water Research Allen House, The Listons, Liston Road, Marlow, Bucks SL7 1FD, U.K. Tele: +44(0)1628 891589 Fax: +44(0)1628 472711 E-mail: [email protected] Home page: www.fwr.org
Apart from any fair dealing for the purposes of research or private study, or criticism or review, as permitted under the UK Copyright, Designs and Patents Act (1998), no part of this publication may be reproduced, stored or transmitted in any form or by any means, without the prior permission in writing of FWR.
Disclaimer
Whilst every effort has been made to ensure accuracy FWR will not accept responsibility for any loss or damage suffered by any person acting or refraining from acting upon any material contained in this publication.
Appropriate professional advice should be sought when making important decisions to ensure the information is correct, up-to-date and applicable to specific circumstances.
This review is one of a series of Reviews Of Current Knowledge (ROCKs)produced by FWR. They focus on topics related to water supply, wastewater disposal and water environments, which may be the subject ofdebate and inquiry. The objective of each review is to produce concise,independent scientific and technical information on the subject tofacilitate a wider understanding of the issues involved and to promoteinformed opinion about them.
Review of Current Knowledge
1
“The best of things is water” Ancient Greek saying Quoted by Artistotle in “Rhetoric, Book 1"
DESALINATON for WATER SUPPLY
Reverse osmosis tubes inside the Beckton desalination plant from the tidal Thames
3 How is the solids/salt content of brackish and sea waters reduced?
7
Thermal processes 8 Membrane processes 8 Other processes 9 Pre-treatment of feed water to desalination plants 9 Post-treatment of the produced desalination water
10
4 What is the range of concentrations to which different desalination processes can be applied?
11
5 How long has desalination technology been around ?
8 What is the cost of water produced by desalination?
24
9 Summary
27
Bibliography
28
Other useful sources of information
29
References 29
Review of Current Knowledge
3
1 Introduction Without fresh water no society can function. Of all the water in the world a mere 1% is fresh water available for the needs of all plant, animal and human life. Around 97% of the water in the world is in the oceans (where, of course, it sustains a wide range of plant and animal life) and approximately 2% of the water is in ice stored in glaciers and in polar ice. The over-exploitation of existing fresh water supplies is becoming a problem in many parts of the world. There are many causes, the principal ones being population growth, demands for higher living standards, growth of both agriculture and industry, and climate change. Agriculture is a major user of water resources, especially in countries which already suffer from increasing water shortages such as Israel, Greece, Spain, Southern Europe in general and the Middle East and Australia. In Southern Europe, agriculture accounts for more than half of total national abstraction, rising to more than 80% in some countries. (European Environment Agency, 2010). Each European uses, on average, 100-200 litres of tap water a day, but if the amount of water embedded in products (virtual water) such as food, paper, and clothes is included, water use is often 10 to 20 times higher. As noted above, water shortages and drought are already affecting countries around the world from Australia, China, Syria, Iraq, Sri Lanka to the USA and even the UK. Water for agriculture currently accounts for 70% of all water use and over 90% in some countries such as India. (The Royal Academy of Engineering, 2010). It is estimated that by 2030 two-thirds of the world’s population will be suffering from water shortages (HSBC Optimised Global Water Index, 2008). In the United States water shortages in a number of States have resulted in long-term plans being prepared for an increase in the use of the desalination of seawater to supply drinking water (Royal Academy of Engineering, 2010). In Sydney, Australia, the rate of water usage is rising because of the growing population and the present rate of usage now outstrips the rate of water supply to reservoirs, a situation which has been seriously exacerbated by periods of drought. As a consequence the city has installed one of the world’s largest desalination plants (opened in January 2010) which takes sea-water from Botany Bay and supplies high-quality drinking water to about 1.5m residents (Sydney Water, 2000). The cost of the water is about double that from reservoirs, but has the advantage of security. Perth also has a large desalination plant and another large one in Melbourne will be operational by the end of 2011.
Review of Current Knowledge
4
A survey of businesses in 25 countries around the world found that 40% are adversely affected by drought, water shortages, flooding, poor quality, and increased prices. More than 50% said that risks to their business from water shortages are "current or near term” (Yale, 2010). Water shortages are forecast to increase, especially in urban areas where the demand for water is growing. Even in the UK potential problems with shortages in the water supply are starting to appear. For example, Thames Water (which is one of the companies supplying London with drinking water) is already using over half its available rainfall and is having to develop alternative sources of water supply. In June 2010 the company opened a major water desalination plant in Beckton, East London (Jowit, 2010). Figure 1 below shows just how serious the problem of world-wide demand for water could be in the next few decades (Pomeranz, 2004).
Figure 1: Forecast worldwide demand for water. The problem of increasing demand for water and the consequential shortage can be tackled in a number of ways including:-
● reduction in leakage and wastage of water during distribution and use; ● increased recycling of water by both industrial and domestic users; ● improving the efficiency of water usage (e.g. low-flush and waterless
toilets); ● the transfer of water from areas rich in water resources to areas of
need.
Review of Current Knowledge
5
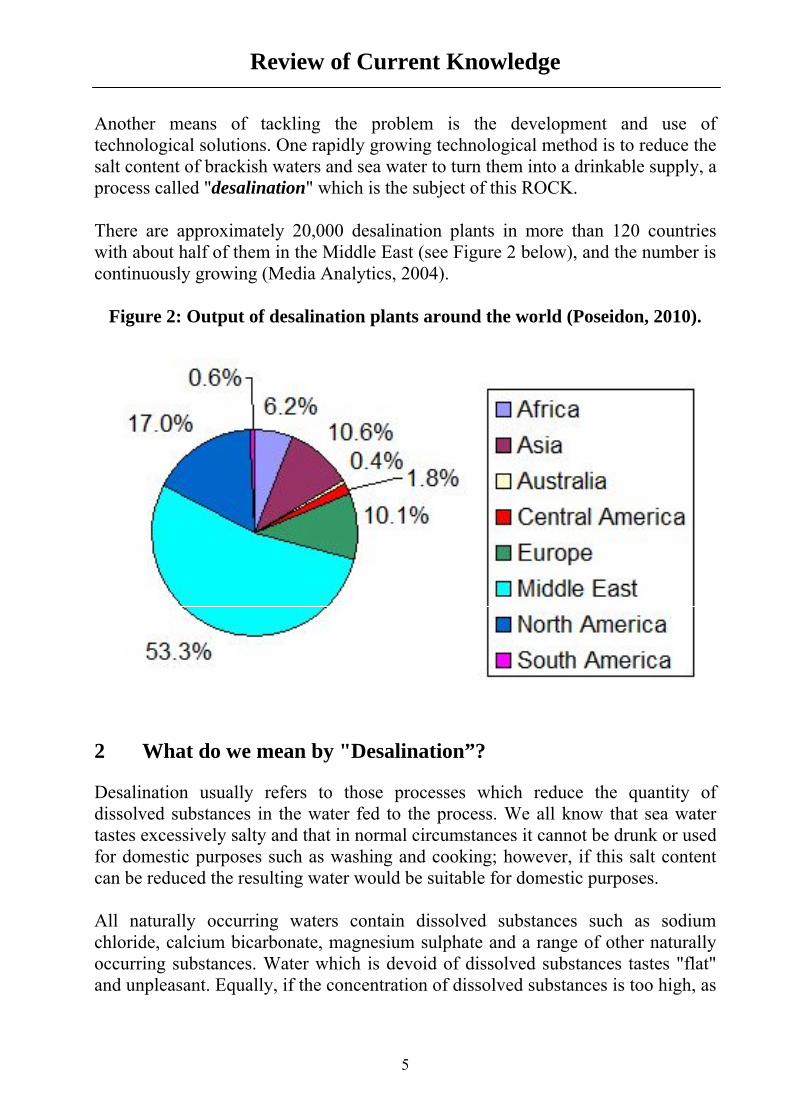
Another means of tackling the problem is the development and use of technological solutions. One rapidly growing technological method is to reduce the salt content of brackish waters and sea water to turn them into a drinkable supply, a process called "desalination" which is the subject of this ROCK. There are approximately 20,000 desalination plants in more than 120 countries with about half of them in the Middle East (see Figure 2 below), and the number is continuously growing (Media Analytics, 2004).
Figure 2: Output of desalination plants around the world (Poseidon, 2010).
2 What do we mean by "Desalination”? Desalination usually refers to those processes which reduce the quantity of dissolved substances in the water fed to the process. We all know that sea water tastes excessively salty and that in normal circumstances it cannot be drunk or used for domestic purposes such as washing and cooking; however, if this salt content can be reduced the resulting water would be suitable for domestic purposes. All naturally occurring waters contain dissolved substances such as sodium chloride, calcium bicarbonate, magnesium sulphate and a range of other naturally occurring substances. Water which is devoid of dissolved substances tastes "flat" and unpleasant. Equally, if the concentration of dissolved substances is too high, as
Review of Current Knowledge
6
in sea water for example, the water will taste unpleasant. For normal drinking water supplies there has to be a balance between these two extremes. Table 1 below shows the palatability of water with different concentrations of dissolved solids expressed as milligrams per litre (mg/l) which is the same as parts per million (ppm).
Table 1: The palatability of water according to its concentration of total dissolved solids (WHO, 1984)
Palatability Dissolved Solids (mg/l)
Excellent less than 300 mg/l
Good between 300 and 600 mg/l
Fair between 600 and 900 mg/l
Poor between 900 and 1,200 mg/l
Unacceptable greater than 1,200 mg/l The quality of drinking water in the UK is set by the various Water Supply (Water Quality) Regulations (see references). “Unacceptable” water can be categorised further as shown in Table 2 below.
Table 2: The classification of water according to its concentration of dissolved solids (National Research Council, 2004).
Description Total Dissolved Solids (mg/l)
Potable water <1,000
Mildly brackish waters 1,000 to 5,000
Moderately brackish waters
5,000 to 15,000
Heavily brackish waters 15,000 to 35,000
Average sea water 35,000
Review of Current Knowledge
7
Some seas and evaporative lakes can show wide variability in total dissolved solids, for example, the Arabian Gulf has an average TDS of 48,000 mg/l and Mono Lake in California has a dissolved solids content of 100,000 mg/l (National Research Council, 2004). The salinity of the Dead Sea reaches 250,000 mg/litre, a level approximately seven times as high as that of the ocean, whereas the surface salinity of the Arctic Ocean (ie the top 50 metres) can be as low as 20,000 mg/l (Johnson & Polyakov, 2001). Water produced by desalination processes may be used directly (e.g., for make-up water in power plant boilers) or it may be mixed with water containing some dissolved solids and used for drinking water, irrigation, or other purposes. Desalinated water is usually purer than the standards specified for drinking water so if the water is intended for municipal use it may be mixed with water that contains higher levels of total dissolved solids. Pure desalination water is acidic and is thus corrosive so it has to be given additional treatment to produce a non-corrosive mildly alkaline water before being pumped to supply. Desalinated water supplied as drinking water in the UK must conform to the statutory requirements for drinking water (see Water Supply Regulations in the references). 3 How is the solids/salt content of brackish and sea waters
reduced? When the arctic and antarctic seas freeze over in winter the ice which forms on the surface is essentially fresh water. The freezing process expels the salts from the water so that melting this ice will produce fresh water; this gives us one way in which fresh water can be produced from sea water, a technique known as “Freeze Desalination”. This process requires the use of heat-energy (which is first removed to form ice and then added to melt the ice) and is one of a group of processes termed “Thermal Desalination”. All desalination processes use chemical engineering technology in which a stream of saline water is fed to the process equipment, energy in the form of heat, water pressure or electricity is applied, and two outlet streams are produced, a stream of desalinated (fresh) water and a stream of concentrated brine which must be disposed of. This is shown below.
Review of Current Knowledge
8
There are two main groups of processes which can be used to reduce the concentration of dissolved solids in brackish or sea water; Thermal processes and Membrane processes. Thermal processes The simplest example of a thermal process is distillation. Saline water is heated to generate steam from the sea water which is then condensed to form water with a low concentration of dissolved salts. This condensed water can then be used for domestic and industrial purposes or for irrigation. Several methods of distillation are currently used for desalination:
● Multi-stage flash evaporation/distillation (MSF) ● Multiple-effect evaporation/distillation (MED) also known as long-
tube vertical distillation (LTV) ● Vapour compression distillation (VCD) ● Low temperature thermal desalination (LTTD) ● Solar desalination
A couple of additional thermal process currently being developed are: ● Membrane distillation (by Takenaka Corp. in Japan) ● Vapour reheat flash distillation
There are three thermal processes which use thermal energy to freeze and then melt the ice formed in the freezing stage:-
● Vacuum freezing ● Secondary refrigerant freezing ● Clathrate or hydrate formation process (not strictly a freezing process)
Membrane processes There are three membrane processes in current use:
Other processes Other desalination processes which are available include:
● Ion exchange (IEX) ● Thermally regenerated IEX (Sirotherm, Bolto 1984; Chandra, 2009) ● Capacitive deionisation using IEX membranes (qv. Voltea) ● Solar thermal ionic desalination (qv. Saltworks Technologies Inc) ● Solar desalination
Other thermal ion exchange processes not listed above are the subject of a number of patent applications in the USA. Some of the IEX processes listed above are still in the demonstration stage and not yet widely used and are therefore not examined any further in this report although the latter four hold out the promise of low-energy low-cost desalination. Pre-treatment of feed water to desalination plants The water fed to a desalination plant will generally contain other impurities in addition to dissolved solids such as silt, algae, bacteria and other forms of small plant and animal life. A particularly important form of impurity are the so-called Transparent Exopolymer Particles (or TEP) which were only identified relatively recently (Alldredge, 1993). TEPs are formed from dissolved polymers exuded by phytoplankton and bacteria and are found in the sea and fresh water in concentrations of 28 to 5000 particles per millilitre and vary in size from 2-200 micro-metres (ie 0.002 to 0.2 millimetres). They exist in many different forms from amorphous blobs, clouds, sheets, filaments or clumps and sometimes recognisable as debris from broken plankton (Berman, 2005). TEPs can be an important source of nutrition for micro-organisms including bacteria. These impurities, and particularly TEPs, can have an adverse effect on desalination processes by fouling surfaces and blocking membranes. This can be particularly deleterious in the case of reverse osmosis (RO) by allowing biofilms (ie films of bacteria) to develop on the surfaces of membranes resulting in a reduction of the flowrates (or flux rates). This can reduce the effective life of the membranes and cause an increase in operating costs. It is therefore necessary to include a pre-treatment stage in desalination plants as shown in Figure 3 below.
Review of Current Knowledge
10
Figure 3: Simplified flow-diagram of the desalination process.
Pre-treatment will typically consist of some form of coagulation process which makes the particulate impurities, especially TEPs, agglomerate into larger particles which can be removed, for example by filtration. Post-treatment of the produced desalinated water Thermal desalination processes produce water with a very low dissolved content; in effect, they produce distilled water. As noted above, water devoid of dissolved substances tastes "flat" and insipid, so if the water is to be used for drinking purposes some dissolved solids and air must be added back to the desalinated water. This is usually done by blending a proportion of the feed water with the desalinated water (see Figure 3 above), aerating the water and adding some chemicals to reduce its corrosivity. Disinfection will be required before the water can be put into the water mains supply network.
Product Water
Review of Current Knowledge
11
other1%
MSF27% RO
59%
ED4%
VC4%
MED5%
Membrane processes reduce the salt content of water but do not reduce it to the low levels achieved by distillation processes so re-blending of the product water with the higher-salinity feed-water is generally not required, although some form of post-treatment may still be necessary such as re-aeration and corrosion control and, of course, disinfection.
Figure 4: Percentage of world desalinated water production from the different processes (based on Cooley et al, 2006 & Awerbuch 2009)
4 What is the range of concentrations to which different
desalination processes can be applied? Sea water is shown in Table 2 as having an average dissolved solids concentration of 35,000 mg/l (3.5%), but this can vary quite considerably as shown in Table 3 below.
Table 3: Different salinities in seawaters
Sea Approximate Salinity in mg/l
Red Sea 40,000 Mediterranean Sea
38,000
Average seawater 35,000 Black Sea 18,000 Baltic Sea 8,000
Review of Current Knowledge
12
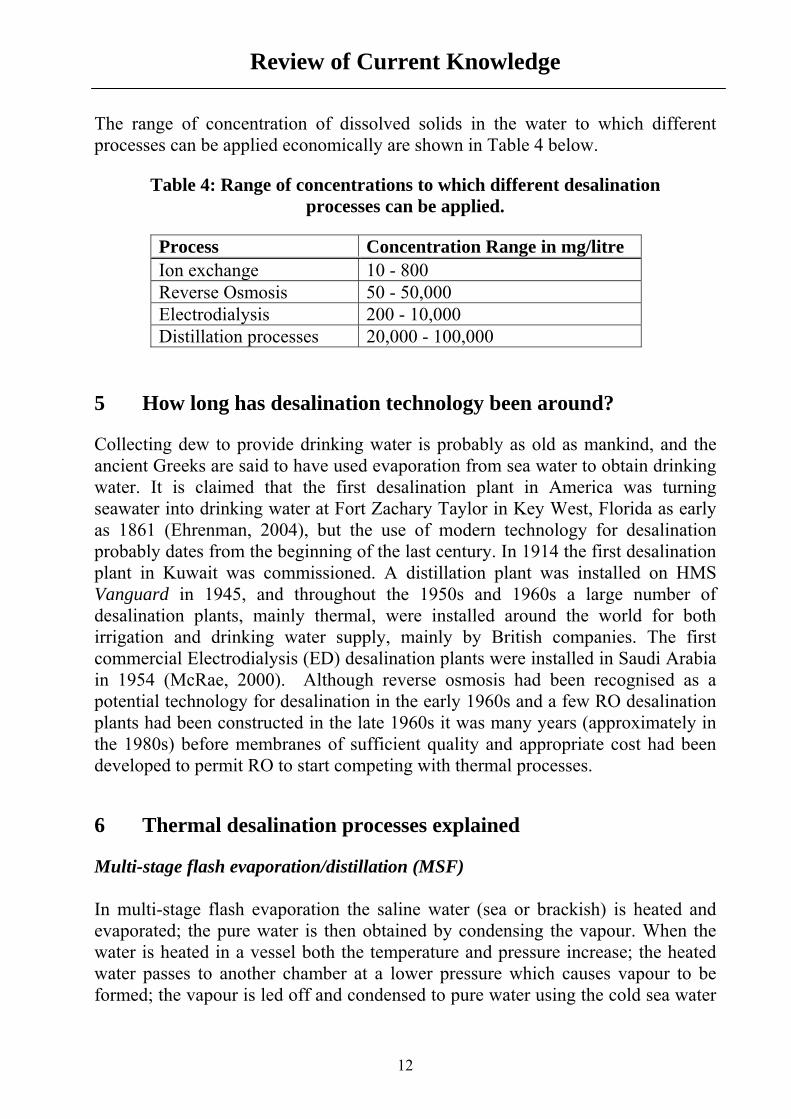
The range of concentration of dissolved solids in the water to which different processes can be applied economically are shown in Table 4 below.
Table 4: Range of concentrations to which different desalination processes can be applied.
Process Concentration Range in mg/litre Ion exchange 10 - 800 Reverse Osmosis 50 - 50,000 Electrodialysis 200 - 10,000 Distillation processes 20,000 - 100,000
5 How long has desalination technology been around? Collecting dew to provide drinking water is probably as old as mankind, and the ancient Greeks are said to have used evaporation from sea water to obtain drinking water. It is claimed that the first desalination plant in America was turning seawater into drinking water at Fort Zachary Taylor in Key West, Florida as early as 1861 (Ehrenman, 2004), but the use of modern technology for desalination probably dates from the beginning of the last century. In 1914 the first desalination plant in Kuwait was commissioned. A distillation plant was installed on HMS Vanguard in 1945, and throughout the 1950s and 1960s a large number of desalination plants, mainly thermal, were installed around the world for both irrigation and drinking water supply, mainly by British companies. The first commercial Electrodialysis (ED) desalination plants were installed in Saudi Arabia in 1954 (McRae, 2000). Although reverse osmosis had been recognised as a potential technology for desalination in the early 1960s and a few RO desalination plants had been constructed in the late 1960s it was many years (approximately in the 1980s) before membranes of sufficient quality and appropriate cost had been developed to permit RO to start competing with thermal processes. 6 Thermal desalination processes explained Multi-stage flash evaporation/distillation (MSF) In multi-stage flash evaporation the saline water (sea or brackish) is heated and evaporated; the pure water is then obtained by condensing the vapour. When the water is heated in a vessel both the temperature and pressure increase; the heated water passes to another chamber at a lower pressure which causes vapour to be formed; the vapour is led off and condensed to pure water using the cold sea water
Review of Current Knowledge
13
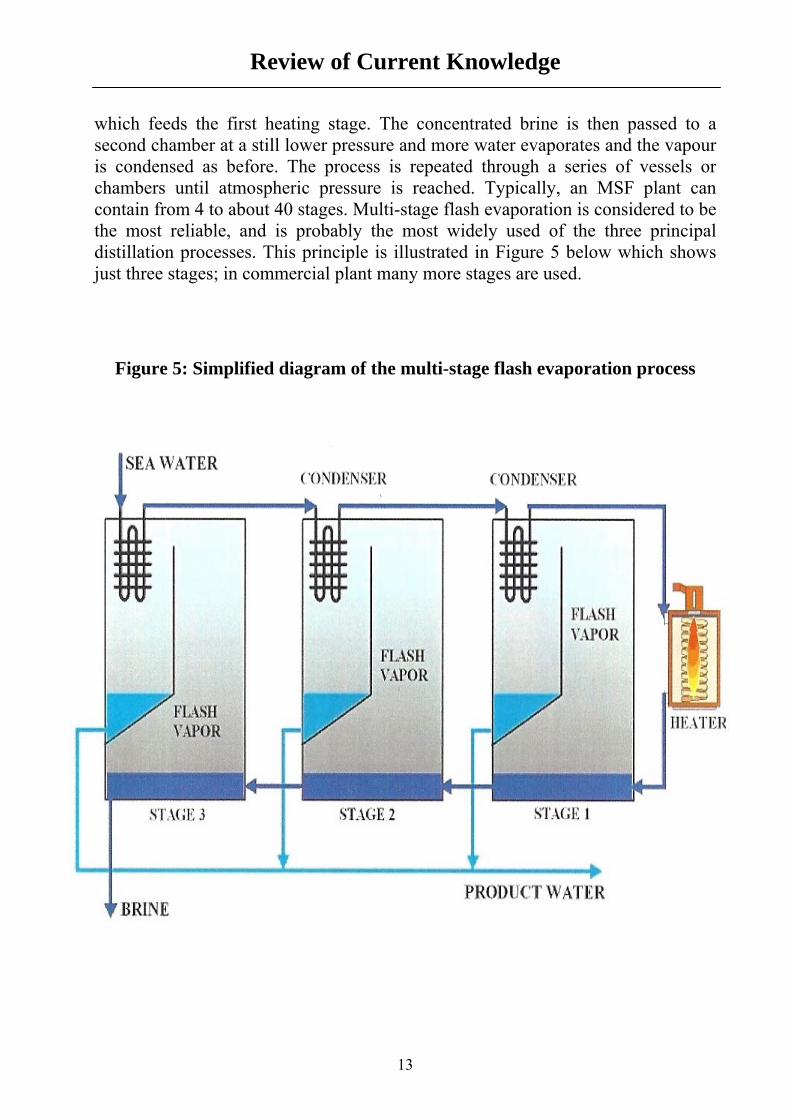
which feeds the first heating stage. The concentrated brine is then passed to a second chamber at a still lower pressure and more water evaporates and the vapour is condensed as before. The process is repeated through a series of vessels or chambers until atmospheric pressure is reached. Typically, an MSF plant can contain from 4 to about 40 stages. Multi-stage flash evaporation is considered to be the most reliable, and is probably the most widely used of the three principal distillation processes. This principle is illustrated in Figure 5 below which shows just three stages; in commercial plant many more stages are used.
Figure 5: Simplified diagram of the multi-stage flash evaporation process
Review of Current Knowledge
14
Multiple-effect evaporation/distillation (MED) Multiple-effect distillation (MED) is also known as long-tube vertical distillation (LTV) and is in principle similar to multi-stage flash evaporation, except that steam is used to heat up the seawater in the first stage and the resulting vapour is used in subsequent stages to evaporate the water, and the seawater/brine is used to cool and condense the vapour in each successive stage so that the temperature gradually falls across each stage of the process. As in multi-stage flash evaporation, many stages are used in commercial plants. The MED process is used for what, at the time it began operating, was the largest desalination plant in the world in Jubail, Saudi Arabia, producing over 800,000 m3/day. The plant began operating in April 2009. The principle of Multiple-effect distillation is shown in the Figure 6 below.
Figure 6: Simplified diagram of the multiple-effect distillation process
Review of Current Knowledge
15
Vapour compression distillation (VCD) Steam is generated from the seawater using a source of heat and the vapour is then compressed using a compressor. As a result of this compression the temperature and pressure of the steam is increased – i.e. the work done in compressing the vapour is changed into heat1 (you notice this effect when pumping up a bicycle tyre and the pump warms up). The incoming seawater is used to cool the compressed steam which then condenses into distilled (fresh) water and at the same time the seawater is heated further producing more steam. The principle is illustrated in Figure 7 below. Vapour compression distillation is usually used where the requirement for desalinated fresh water is relatively small such as in small communities, ships or in holiday resorts. In Australia in 2002 VCD was the second most commonly used process for desalination after reverse osmosis accounting for about 18% of Australia's national desalination capacity (URS Australia, 2002). However, since then there has been a rapid growth in the use of reverse osmosis, mainly for the large plants which are coming on line.
Figure 7: Diagram of vapour phase compression desalination
1 Conservation of energy requires that the amount of work done in producing the heat must be equal to the amount of heat-energy generated.
Review of Current Knowledge
16
Solar desalination Solar distillation has been around for many years and was originally a simple technology suitable only for small outputs. Heat from the sun warms the seawater in a glass-covered tank causing some to evaporate. The vapour is condensed on a glass cover and the resultant fresh water is collected as shown in the diagram in Figure 8 below. This is a low-cost system and is not suitable for large-scale production of water. Problems can arise from the growth of algae on the underside of the glass cover, and good sealing is required otherwise the vapour and heat can escape reducing the effectiveness of the system. A well-maintained solar still produces about 8 litres for every square metre of glass, so the area required for about 4 people would be 130-260 square metres. An Australian development of this system which is reliable and effective uses pipes, but at the present time is prohibitively expensive (URS, 2002).
Figure 8: Diagram of a solar distillation system
Review of Current Knowledge
17
However, in recent years, there has been considerable development in large-scale solar systems for power generation, both thermal and photovoltaic. Thermal power stations offer an opportunity for solar desalination but, despite extensive R&D in Australia, the USA and Spain, where a pilot plant is producing 72 m3/day, (Blanco et al, 2008), there are no large-scale plants yet in operation. Concern over global warming has generated considerable interest in the use of solar energy (now frequently referred to as concentrated solar power or CSP) for desalination processes, either directly, as in the case of solar distillation, or using humidification (Qu, 2009). In recent years there has been rapid growth in the use of solar energy in desalination generally, for example the use of photovoltaic cells to generate electricity for RO plants and in the use of solar energy for the so-called multiple-effect humidification (MEH) process. A MEH pilot-plant has been installed in Jeddah, Saudi Arabia, which successfully produces 5m3/day of desalinated water (Müller-Holst, 2007). Vacuum freeze desalination (VFD) As previously described, when saline water freezes, the salts dissolved in the water are excluded from the ice which is formed. Cooled saline water is sprayed into a vacuum chamber at a pressure of about 0.004 atmospheres. Some of the water flashes off as vapour removing more heat from the water causing ice to form. The ice floats on the brine and is washed with fresh water, melted and the fresh water (which is less dense than the brine) flows out of the washer-melter as shown in the diagram in Figure 9. In theory, freeze desalination has a lower energy requirement than other thermal processes and little susceptibility to the scaling problems which can affect distillation processes. Although a few small plants have been built in the last 40 years the process has not yet been commercially developed (URS Australia, 2002)
Review of Current Knowledge
18
Figure 9: Schematic diagram of vacuum freeze desalination
Secondary refrigerant freezing (SRF) In this variant of freeze desalination a liquid hydrocarbon refrigerant such as butane, which will not mix with water, is vaporised when in direct contact with the saline water thus producing a slurry of ice in brine. The vaporised refrigerant is taken off, compressed and cooled in the melter and recycled to the freezer/crystalliser, and the slurry of ice is taken off, washed and passed to the melter. The advantage claimed for secondary refrigerant freeze desalination is an even lower energy requirement than for freeze desalination, and low susceptibility to scaling and corrosion. The SRF process was considered by the Water Resources Board as a possible method for supplementing water supplies in England and Wales in the 1970s but despite some development work it never achieved commercialisation.
Review of Current Knowledge
19
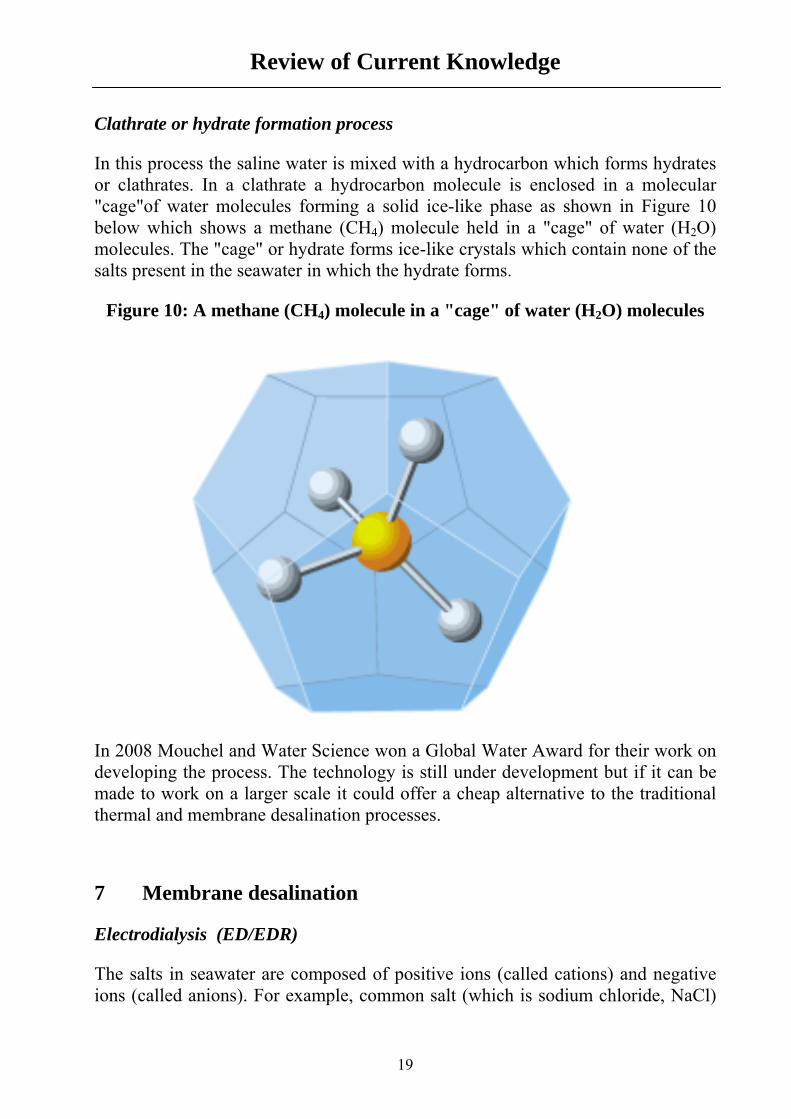
Clathrate or hydrate formation process In this process the saline water is mixed with a hydrocarbon which forms hydrates or clathrates. In a clathrate a hydrocarbon molecule is enclosed in a molecular "cage"of water molecules forming a solid ice-like phase as shown in Figure 10 below which shows a methane (CH4) molecule held in a "cage" of water (H2O) molecules. The "cage" or hydrate forms ice-like crystals which contain none of the salts present in the seawater in which the hydrate forms.
Figure 10: A methane (CH4) molecule in a "cage" of water (H2O) molecules
In 2008 Mouchel and Water Science won a Global Water Award for their work on developing the process. The technology is still under development but if it can be made to work on a larger scale it could offer a cheap alternative to the traditional thermal and membrane desalination processes. 7 Membrane desalination Electrodialysis (ED/EDR) The salts in seawater are composed of positive ions (called cations) and negative ions (called anions). For example, common salt (which is sodium chloride, NaCl)
Review of Current Knowledge
20
dissolves in water to produce positively charged sodium ions and negatively charged chloride ions. Thus:- NaCl = Na+ + Cl-
Electrodialysis uses a stack of ion-exchange membranes which are selective to positive and negative ions. Under the influence of a direct electrical current (DC) the positive sodium ions pass through a cation membrane and the negative chloride ions pass through an anion membrane as shown in Figure 11. The incoming saline water is thus converted into two streams, one of concentrated brine and one of desalinated (fresh) water. Industrial electrodialysis plants consist of stacks of hundreds of membranes. Fouling of the ion exchange membranes can occur and this can be partly overcome by reversing the direction of the DC current; this process is known as electrodialysis reversal or EDR. ED was the first membrane desalination process to achieve commercial success. One of the earliest commercial units in the world was installed in Tobruk in Libya in 1959 by the British Company William Boby Ltd. The plant had an output of 55m3/day and was a technical and economic success. Although ED is still used today it has been overtaken by reverse osmosis (RO) as the preferred membrane desalination process.
Figure 11: Diagram of an electrodialysis cell
Review of Current Knowledge
21
Reverse osmosis (RO) Osmosis is the process in which water passes through a semi-permeable membrane from a low-concentration solution into a high-concentration solution. It is a process which occurs in plant and animal tissue including the human body (e.g. the secretion and absorption of water in the small intestine). If a pressure is applied to the high-concentration side of the membrane the reverse process occurs, namely water diffuses through the semi-permeable membrane from the high-concentration solution into the low-concentration solution, i.e. reverse osmosis. This is shown in the diagram in Figure 12 below.
Figure 12: Osmosis and Reverse Osmosis
Review of Current Knowledge
22
As seawater is pumped under pressure across the surface of the membrane, water molecules diffuse through the membrane leaving a concentrated brine solution on the feed-side of the membrane and fresh water on the low-pressure product side. The brine solution is rejected as wastewater and can be in the region of 10% to 50% of the feed water depending on the salinity and pressure of the feed water. RO membranes are manufactured from modern plastic materials in either sheets or hollow fibres. In a modern RO plant the membranes are grouped together in modules which are linked together according to the size of plant required. RO plants use four alternative configurations of membrane, namely tubular, flat plate, spiral-wound, and hollow fibre. Reverse osmosis is becoming the most widely used method for the desalination of brackish and sea waters. The graph in Figure 13 below shows the cumulative growth in capacity of desalination plant for thermal and membrane processes (most of which are now RO systems).
Figure 13: Graph showing the cumulative growth of thermal and membrane desalination capacity
(National Research Council, 2008)
Review of Current Knowledge
23
RO plants vary from small domestic units for use either in the home or on small ships to large industrial and municipal units for supplying communities with a potable water supply. The largest RO desalination plant in the world has been built in Hadera in Israel. The plant, which came on line in May 2010, has a capacity of 127 million m³ of desalinated water per year (348,000m³/day) and is part of a network of large-scale RO seawater desalination plants along the Mediterranean coast of Israel. RO is an inherently energy-intensive process requiring in the region of 5-25 kWh/m³ for the desalination of seawater (Ravilious, 2010, Schäfer et al, 2004). Pre-treatment is an essential part of any RO desalination plant since membranes are prone to fouling from suspended particles and micro-organisms in the feed water. A particular problem is caused by the Transparent Exopolymer Particles (TEPs) (see the section on pre-treatment). Forward osmosis(FO) Figure 12 shows how a high-concentration solution (e.g. brine) will draw water through a semi-permeable membrane. It is possible to draw water through a membrane from brine by placing a sugar solution on the other side of the membrane so that normal or forward osmosis occurs thus diluting the sugar solution but leaving the salt on the other side of the membrane. The sugar solution can then be drunk. This is the method used by the army and in natural disasters when drinking water supply is a problem. In a commercial unit the sugar solution is replaced with a strong solution of ammonium carbonate and water is drawn from the salt-solution into the ammonium carbonate solution. The ammonium carbonate solution is then heated which drives off the ammonium carbonate as ammonia gas and carbon dioxide gas leaving pure water behind. The gases are recovered and recycled (McCutcheona et al, 2004) . The principle of the forward osmosis process is illustrated in Figure 14.
Review of Current Knowledge
24
Figure 14: Schematic diagram of the forward osmosis process
(Semiat, 2008)
8 What is the cost of water produced by desalination? It is not possible to give a definitive answer to this important question since the costs are made up of a number of factors as shown in Table 5 and Figure 15 below. The single largest cost factor in both thermal and membrane desalination is energy, and the cost of this varies considerably between countries and even within the UK. Alternative sources of energy have been proposed which will affect the costs of energy, for example linking desalination plants with wind and solar power. An experimental wind-powered RO unit was installed in France as early as 1982 (Carvalho, 2003). An on-shore prototype using wind-power has been operating successfully on the German island of Rügen in the Baltic Sea since 1995 producing a maximum of 15 m3/hr of potable water from a 300kW wind turbine (Garcia-Rodriguez, 2004). Two modular RO pilot plants were installed on the Island of Syros, Greece, in 1997 using a 500kW wind generator linked to a RO unit with 8
Review of Current Knowledge
25
membranes producing between 60 and 900 m³/day of potable water. A wind power unit came into operation in late 2004 which is intended to provide power for a seawater desalination plant in the United Arab Emirates (Sawahel, 2004). The power plant generates 850 kilowatts of electricity to power a seawater desalination operation. In Gulf countries most power plants are co-generation power desalting plants (CPDP) which simultaneously generate power and produce fresh water by desalination of seawater (Almulla et al, 2005). Professor Ian Fells has pointed out (2005) that combined nuclear power and desalination plants could be used to overcome the growing water shortages in the UK, and the principle of using a range of alternative primary energy generating sources linked to desalination is being looked at in the USA (Bureau of Reclamation, 1995). The data on the split of the operating costs for desalination plants varies considerably. This is to be expected since there are very different costs for power, labour, capital, chemicals, etc. in different countries. Table 5 gives the range of costs reported in the literature.
Table 5: The percentage split of operating costs for reverse osmosis plants
Labour 1 - 10
Membranes 5 - 14
Chemicals
2.5 - 8
Maintenance 5 - 8
Electricity 23 - 44
Capital/amortisation 14 - 52
Review of Current Knowledge
26
Figure 15: Breakdown of the costs in thermal desalination
(National Research Council, 2004) The cost of desalinated water in pence per m3 depends on the process used, local costs of power, labour etc. so it not possible to give precise values. However, most of the processes used are becoming mature and there is a strong and growing international market. Furthermore there is growing pressure on scarce water resources so that the cost of water from conventional sources is increasing and as a consequence the cost of desalinated water is starting to compete with the cost of water from the established sources. In the UK tap water costs 57 - 168 pence per m3 depending on the source and the costs of treatment and pumping (OFWAT, 2011 etc.). On average, distribution accounts for 15% of costs (6p to 19p per m³) and treatment accounts for 13% of costs (OFWAT, 2002). Costs for desalinated water are equally varied. A recent estimate for the cost of desalinated water in California gave 105-157 pence per m³ (Scher, 2010) which, with distribution costs, would be in the range of 110-180 pence per m³. In the first issue of this ROCK in 2006 the cost of desalinated water was estimated as varying between 89p and 237p
Review of Current Knowledge
27
per m³ excluding distribution (National Research Council, 2004) which gave a cost for desalinated water including distribution as roughly 95p to 256p per m³. This indicates that in the last half-decade the cost of producing desalinated water has fallen significantly, although any rise in the cost of oil is likely to change that differential in the short-term until alternative (renewable) energy sources for use in desalination systems are better developed. 9 Summary Water scarcity is increasing around the world including Europe and even in the UK. Existing water resources are already under stress, and the situation is getting worse. Alternative sources of fresh water are urgently required in many countries around the world especially in Australia, parts of the USA and Middle East and North African (MENA) countries. Solutions to this problem include:- ● the export and transport of water between countries and regions; ● the more efficient and economical use of water; ● increased recycling; ● the desalination of brackish waters and seawater. Many different technologies are available for desalination, the principal ones being variants of distillation and reverse osmosis (RO), and both of these will continue to be used although RO has become the preferred technology. Desalination requires power and the use of alternative methods such as the conjunctive use of power generation, solar energy and wind-generators will become more widely used. The cost of producing potable water by desalination is still higher than the cost of producing potable water from conventional resources where they exist. However, the costs of desalination are approaching those of conventional water and the significant growth in the world-wide production of desalinated water will unquestionably continue, especially in areas where droughts are common (e.g. Australia) and conventional sources are fully utilised or non-existent and brackish or seawater is abundant (e.g. Australia & MENA countries).
Bibliography Desalination. The International Journal on the Science and Technology of Desalting and Water Purification, pub. by Elsevier. ISSN: 0011-9164 Desalination: a national perspective by the National Research Council. Committee on Advancing Desalination Technology, National Academies Press (U.S.A) 2008 ISBN (PDF) 0-309-11924-5; ISBN (Book) 0-309-11923-5. Fundamentals of Salt Water Desalination by H.T. El-Dessouky, H.M. Ettouney Pub. Elsevier, 2002. Hardbound, ISBN: 0-444-50810-4. Water Desalination. United States Army, University Press of the Pacific. Paperback Pub. March 18, 2005. ISBN 1-4102-2163-6. Desalination and Water Purification Technology Roadmap - A Report of the Executive Committee (Roadmap). January 2003. By The U.S. Bureau of Reclamation and Sandia National Laboratories. Available from the National Technical Information Service, Operations Division, 5285 Port Royal Road, Springfield, Virginia 22161 or as a download from the internet at http://www.usbr.gov/pmts/water/media/pdfs/roadmapreport.pdf
Review of Current Knowledge
29
Introduction to Desalination Technologies in Australia. Summary of a detailed report entitled “Introduction to desalination in Australia with particular reference to NAP priority regions.” Available on the website at: http://www.environment.gov.au/water/publications/urban/desalination-summary.html Desalination Markets 2005-2015: A Global Assessment & Forecast. A Report by Global Water Intelligence, 1.4.2004. ISBN: 0-9547705-0-1 Available from Research and Markets Ltd., Guinness Centre, Taylors Lane, Dublin 8, Ireland. Chapter 8: Desalination in Water: Sustainable management of a scarce resource. Ed. Mohamed El_Ashry, Najib Saab & Bashar Zeitoon. (2010). Pub. Arab Forum for Environment and Development (AFED). See http://www.afedonline.org/Report2010/main.asp Other useful sources of information The European Desalination Society, Science Park of Abruzzo Via Antica Arischia, 1 -L'Aquila 67100, Italy. Tel. +39 0862 319954 Fax +39 0862 3475 213 http://www.edsoc.com/ The Desalination Directory, Science Park of Abruzzo Via Antica Arischia, 1 -L'Aquila 67100, Italy. http://www.desline.com/ International Desalination Association (IDA), POB 387, 7 Central Street, Topsfield, A 01983 USA. Tel. +1 978 887 0410 Fax. +1 978 887 0411 http://www.idadesal.org/ The Online Desalination Directory http://www.desline.com References Alldredge, A.L., Passow, U. & Logan, B. E. (1993) The abundance and significance of a class of large, transparent organic particles in the ocean. Deep-Sea Res. 40, 1131-1140. Almulla, A., Hamad, A. & Gadalla, M. (2005) Integrating hybrid systems with existing thermal desalination plants. Desalination, 174(2), 171-192. Awerbuch L, (2009) Future Directions in Integration of Desalination, Energy and the Environment. International Desalination Association Seminar, Boston, Feb. 23rd, 2009.
Review of Current Knowledge
30
Berman, T. & Holenberg, M. (2005) Don't fall foul of biofilm through high TEP levels. Filtration & Separation, May. 30-32. Blanco, J., Alarcón, D., Gernjak, W., Guillén, E., Farré, M.J. and Malato, S. (2008) Solar desalination - Recent research activities of Plataforma Solar de Almeria. In the conference Atelier Mediterraneen sur les nouvelles technologies de recyclage des eaux, 28 Apr - 1 May 2008, Agadir, Morocco. Bolto, B.A. (1984) Development of Desalination in Australia. Desalination. 50, p 103-114, October-November. Burgen, S. (2010) Spain overtakes US with world's biggest solar power station. Guardian. 13 July 2010. Bureau of Reclamation, US Department of the Interior (1995) The Water Treatment Technology Program Newsletter - No. 1 - Spring 1995. http://www.usbr.gov/pmts/water/newsletter/Water/1995spr.html Carvalho, P.C.M. & Riffel, D.B. (2003) Analysis of the Use of Wind Powered Reverse Osmosis Sea Water Desalination Plants in the Northeast Region, Brazil. RIO 3 - World Climate & Energy Event, 1-5 December 2003, Rio de Janeiro, Brazil 287 Chanda M., Arumugom Pillay S., Sarkar A., Modak J.M. (2009) A thermally regenerable composite sorbent of crosslinked poly(acrylic acid) and ethoxylated polyethyleneimine for water desalination by the Sirotherm process. J. App. Polymer Science. 111(6), p. 2741-2750, January. Article first published online: 3 Dec. 2008. DOI: 10.1002 Cooley, H., Gleick P.H., Wolff G. (2006) Desalination with a grain of salt: a California perspective. ISBN No. 1-893790-13-4 Ehrenman, G. (2004) From sea to sink: with supplies of water under stress, the prospect of rendering saltwater drinkable is growing more appealing and more affordable. Mechanical Engineering Magazine On-Line. Oct. 2004 issue. http://www.memagazine.org/backissues/membersonly/oct04/features/fromsea/fromsea.html European Environment Agency, (2010) The European environment – state and outlook 2010. Water resources: quantity and flows. see http://www.eea.europa.eu/soer/europe/water-resources-quantity-and-flows/
Review of Current Knowledge
31
Fells, I. (2005) Energy Solutions. Letter in The Times, 14th June 2005. Garcia-Rodriguez, L. (2004) Desalination by Wind Power. Wind Engineering, 28(4),453-463. HSBC Optimised Global Water Index, 2008. http://www.hsbcnet.com/treasury/attachments/structured-products/optimised-indices/water_brochure.pdf Johnson, M.A. & Polyakov, I.V., (2001) The Laptev Sea as a source for recent Arctic Ocean salinity changes, Geophys. Res. Lett., 28, 2017-2020. see website http://research.iarc.uaf.edu/~igor/research/nansen/index.php Jowit, J. (2010) Thames Water opens first large-scale desalination plant in UK www.guardian.co.uk, 2nd June 2010. McCutcheona, J.R., McGinnisb, R.L. & Elimelecha, M. (2005) A novel ammonia-carbon dioxide forward (direct) osmosis desalination process. Desalination 174, pages 1–11. McRae,W. (2000) Electroseparations, Electrodialysis, in Kirk-Othmer Encyclopedia of Chemical Technology, pub. John Wiley & Sons, Inc. Media Analytics Ltd. (2004) Desalination Markets 2005-2015: A Global Assessment & Forecast. A Report by Global Water Intelligence, 1.4.2004. ISBN: 0-9547705-0-1 Available from Research and Markets Ltd., Guinness Centre, Taylors Lane, Dublin 8, Ireland. Price: Euro 1,220.00. Müller-Holst, H. (2007) Solar Thermal Desalination Using the Multiple Effect Humidification (MEH)-method, in Solar Desalination for the 21st Century, ed. L. Rizzuti et al., pp 215–225. Pub. Springer. National Research Council, (2004) Review of the desalination and water purification road map. pub. National Academy of Sciences, ISBN 0-309-09157-8. See also the website at http://www.nap.edu/catalog/10912.html National Research Council (2008) Desalination: A National Perspective. The Committee on Advancing Desalination Technology. ISBN-10: 0-309-11923-5. See also the website at http://www.nap.edu/openbook.php?record_id=12184&page=72
Review of Current Knowledge
32
OFWAT, (2002) International comparison of water and sewerage service; 2000-01 report. http://www.ofwat.gov.uk/legacy/aptrix/ofwat/publish.nsf/AttachmentsByTitle/publication_list_old.pdf/$FILE/publication_list_old.pdf OFWAT, (2011) Cost of water in England. http://www.ofwat.gov.uk/consumerissues/chargesbills/householdcharges/metered/water see websites for Scottish Water and Northern Ireland Water for costs in Scotland and N. Ireland. Qu, W., (2009) Report for Project 2008HI231B: "Experimental Study of Humidification-Dehumidification (HDH) Seawater Desalination Driven by Solar Energy". http://water.usgs.gov/wrri/08grants/2008HI231B.html Ravilious, Kate (2010) Add salt as required: the recipe for fresh water. New Scientist, 207 (2773), 14 August, pages 39-41. Royal Academy of Engineering, (2010) Global Water Security - an engineering perspective. April 2010. ISBN 1-903496-55-1 Saltworks Technologies Inc., (2009) A fresh way to take the salt out of seawater: Cheaper desalination, The Economist, Oct 29th 2009 http://www.economist.com/node/14743791?story_id=14743791 and http://www.saltworkstech.com/ Sawahel, W. (2004) Gulf's first wind power plant is opened; Wind power could be used to provide drinking water in coastal parts of the Middle East. SciDev. Net http://www.scidev.net/content/news/eng/gulfs-first-wind-power-plant-is-opened.cfm Schäfer, A.I., Remy, C. & Richards, B.S. (2004) Performance of a small solar-powered hybrid membrane system for remote communities under varying feedwater salinities. Water Science & Technology: Water Supply, 4, 5-6, pages 233-243. Scher, E. (2010) Desalination to Dramatically Increase the Cost of Water. Op Ed News.com http://www.opednews.com/articles/Desalination-to-Dramatical-by-Eddie-Scher-100324-217.html
Review of Current Knowledge
33
Semiat, R. & Hassan, D. (2008) Energy Issues in Desalination Processes. First UK-Israeli Workshop and Research Event on the Application of Membrane Technology in Water Treatment and Desalination, St Hilda's College, Oxford, June 2008. Sydney Water, 2009 “Desalination” Fact Sheet. The Private Water Supplies Regulations 2009 SI 2009 No. 310100.0 The Water Supply (Water Quality) Regulations 1989 SI 1989 No. 1147. The Water Supply (Water Quality) Regulations 2000 SI 2000 No. 3184. The Water Supply (Water Quality) (Scotland) Regulations 2001 SI 2001 No. 207. The Water Supply (Water Quality) Regulations 2000 (Amendment) Regulations 2007 SI2007 No. 2734 The Water Supply Regulations 2010 SI 2010 No. 991 The Water Supply (Miscellaneous Amendments) (England and Wales) Regulations 2010 SI 2010 No. 996 URS Australia, (2002) Summary Report: Introduction to desalination in Technologies in Australia. A report prepared for Agriculture, Fisheries & Forestry - Australia. http://www.environment.gov.au/water/publications/urban/pubs/desalination-summary.pdf Yale Environment 360, (2010) Strain on Water Supplies Already Affecting Businesses Globally. http://e360.yale.edu/content/digest.msp?id=2685