22
Describing the Enterprise Architectural Space
| Date post: | 28-May-2018 |
| Category: |
Documents |
| Upload: | duongtuyen |
| View: | 219 times |
| Download: | 0 times |

Describing the EnterpriseArchitectural Space

Information in this document, including URL and other Internet Web sitereferences, is subject to change without notice. Unless otherwise noted, theexample companies, organizations, products, domain names, e-mail addresses,logos, people, places, and events depicted herein are fictitious, and no associationwith any real company, organization, product, domain name, e-mail address, logo,person, place, or event is intended or should be inferred. Complying with allapplicable copyright laws is the responsibility of the user. Without limiting therights under copyright, no part of this document may be reproduced, stored in orintroduced into a retrieval system, or transmitted in any form or by any means(electronic, mechanical, photocopying, recording, or otherwise), or for anypurpose, without the express written permission of Microsoft Corporation.
Microsoft may have patents, patent applications, trademarks, copyrights, or otherintellectual property rights covering subject matter in this document. Except asexpressly provided in any written license agreement from Microsoft, the furnishingof this document does not give you any license to these patents, trademarks,copyrights, or other intellectual property.
© 2004 Microsoft Corporation. All rights reserved.
Microsoft, MS-DOS, Windows, Windows NT, Windows Server, and BizTalk are eitherregistered trademarks or trademarks of Microsoft Corporation in the UnitedStates and/or other countries.
The names of actual companies and products mentioned herein may be thetrademarks of their respective owners.
Contents
Describing the Enterprise Architectural Space 1Introduction . . . . . . . . . . . . . . . . . . . . . . . . . . . . . . . . . . . . . . . . . . . . . . . . . . . . . . . . 1Enterprise Architectural Space Organizing Table . . . . . . . . . . . . . . . . . . . . . . . . . . . . . . 2
Architectural Viewpoints and Roles (Rows of the Organizing Table) . . . . . . . . . . . . . . 3Architectural Space Interrogatives (Columns of the Organizing Table) . . . . . . . . . . . . . 6Combining the Viewpoints, Roles, and Interrogatives into the
Organizing Table . . . . . . . . . . . . . . . . . . . . . . . . . . . . . . . . . . . . . . . . . . . . . . . . . 6Using the Organizing Table . . . . . . . . . . . . . . . . . . . . . . . . . . . . . . . . . . . . . . . . . . . . . . 8
Using the Table to Organize Patterns . . . . . . . . . . . . . . . . . . . . . . . . . . . . . . . . . . . . 8Adding Patterns to the Organizing Table . . . . . . . . . . . . . . . . . . . . . . . . . . . . . . . . . 12Modifying the Table . . . . . . . . . . . . . . . . . . . . . . . . . . . . . . . . . . . . . . . . . . . . . . . . 12
Summary . . . . . . . . . . . . . . . . . . . . . . . . . . . . . . . . . . . . . . . . . . . . . . . . . . . . . . . . . 13Community . . . . . . . . . . . . . . . . . . . . . . . . . . . . . . . . . . . . . . . . . . . . . . . . . . . . . . . . 14References . . . . . . . . . . . . . . . . . . . . . . . . . . . . . . . . . . . . . . . . . . . . . . . . . . . . . . . . 14Contributors . . . . . . . . . . . . . . . . . . . . . . . . . . . . . . . . . . . . . . . . . . . . . . . . . . . . . . . 14Key to Pattern Names in Figure 4 . . . . . . . . . . . . . . . . . . . . . . . . . . . . . . . . . . . . . . . . 14


Describing the EnterpriseArchitectural Space
Authors: David Trowbridge, Ward Cunningham, Matt Evans, Larry Brader,Microsoft Platform Architecture Guidance; Paul Slater, Wadeware.
Microsoft Corporation
June 2004
Summary: This document presents an organizing table that describes the enterprisearchitectural space, shows relationships among artifacts in the space, and demon-strates how different roles in your enterprise view enterprise architecture. Thisdocument also demonstrates how pattern authors can use the organizing table toorganize existing patterns and to identify areas where patterns are not currentlydocumented.
IntroductionEffective organization is critical to help us gain a full understanding of the complexworld surrounding us. Standard and consistent organizing systems are used every-where, from the Periodic Table of the Elements and the Biological Classification ofOrganisms, to the Dewey Decimal system in libraries. Such systems are also plenti-ful in the world of Information Technology. For example, the DNS system helpsorganize computers globally in a meaningful way, and file systems provide a direc-tory structure to organize files in storage.
Enterprise-level software and system architecture are ripe for a similar organizingsystem. If you ask any group of technologists to describe the architecture of asystem, you are likely to hear contradicting descriptions. Each person often has hisor her own view of the system, which is accurate but different from the view ofother technologists looking at the same system. A consolidated and consistent viewof enterprise software-intensive systems could help technologists gain a sharedunderstanding of the enterprise architectural space that is more complete andaccurate.

Describing the Enterprise Architectural Space2
This document presents an organizing table that the Microsoft patterns & practicesteam has used in pattern development for the past two years on releases such asEnterprise Solution Patterns Using Microsoft .NET. This paper exposes the earlythinking about a dynamic way to organize and consume patterns. The authorsanticipate that the structure of the organizing table will be refined over time and thatthe table will prove to be useful in many other efforts.
Enterprise Architectural Space Organizing TableAs enterprises respond to specific business initiatives, they produce many artifactsthat capture architectural decisions, including: plans, notes, models, scripts, andcode. Different roles in your enterprise use these artifacts to view the enterprisearchitecture in different ways. The potential for reuse increases if you have ameaningful way of organizing these artifacts.
Organizing the artifacts is a complex task, particularly as the enterprise andtechnologies change. Examining the space for all stable elements and cross-correlat-ing all the relationships between elements would result in a multi-dimensional tablethat is not easy to display. A two-dimensional table allows you to analyze enterprisesoftware-intensive systems in an intuitive way.
The Enterprise Architectural Space Organizing Table is such a two-dimensional tablethat captures and organizes business artifacts according to the decisions thatproduce them. The organizing table defines architectural viewpoints as rows, andinterrogatives as columns. Figure 1 shows the basic structure of the organizing table.The particular rows and columns are discussed later in this paper.
Views
Interrogatives
Focus on an Information Space
Figure 1Organizing table structure
As you will see later, the choice of rows for this organizing table provides a particu-lar focus on the enterprise information space. The organizing table is intended to:

Describing the Enterprise Architectural Space 3
● Provide a comprehensive view of the architecture space. The description isdesigned to organize architectural elements and demonstrate the relationshipsbetween them.
● Be specific to enterprise software intensive systems. You may choose to extendthe description to meet the needs of your enterprise.
The organizing table builds on four key pieces of work: The Zachman Frameworkfor Enterprise Architecture [Zach], IEEE 1471 [IEEE], Andersen Consulting’sEnterprise Information Architecture [Andersen], and test-driven development. Likethe Zachman Framework, this table uses interrogatives as columns and roles asrows. This table, however, shows a higher degree of granularity in the rows and ahigher degree of specificity in the artifacts contained in each cell. Also, based on theprinciples of test-driven development, this table includes an additional column thatidentifies the test of success for every row. Ideally, for any given row, the artifactscontained in the Test column should trace to the artifacts contained in the Purposecolumn for validation.
The organizing table groups rows together in levels of architecture, which shows theinfluence of the Enterprise Information Architecture framework. This grouping ofrows exposes the overall alignment and traceability between business andtechnology. Within each row are discrete viewpoints, which are influenced by theIEEE 1471 architectural standard description. Together, these elements produce ahighly granular map of the enterprise space that is organized by viewpoints andinterrogatives.
One of the main strengths of the organizing table is that you can use it to store manydifferent kinds of artifacts. By extracting, distilling, and abstracting the informationcontained in the traditional artifacts associated with enterprise software-intensivesystems, you can produce patterns, practices, and guidance for your enterprise. Youcan then store these patterns in the organizing table. For more information aboutstoring patterns in the table, see “Using the Table to Organize Patterns,” later in thispaper.
Architectural Viewpoints and Roles (Rows of the Organizing Table)The organizing table divides enterprise architecture into five broad enterpriseviewpoints. These views appear in the table as rows, which are organized fromgeneral to specific as you scan them from top to bottom. The viewpoints are:● Business architecture● Integration architecture● Application architecture● Operational architecture● Development Architecture

Describing the Enterprise Architectural Space4
Although the viewpoints are a useful means of broadly categorizing architecturalartifacts, the organizing table goes one step further by dividing the viewpointsaccording to specific roles that correspond to individuals with a particular skill set.As mentioned earlier, this additional detail allows you to trace the alignment ofartifacts across the table.
Note: It is likely that the individuals in your enterprise do not map directly to the roles definedhere. In a large enterprise, a role listed here might be assigned to a team (for example,architecture team). Conversely, one person may be responsible for many roles in a smallerenterprise. Nonetheless, most enterprise systems are viewed from the perspective of each ofthese roles at some point in time, and these roles can influence how you think about architec-tures as a whole.
The following paragraphs examine the viewpoints and the roles they contain inmore detail.
Business Architecture ViewpointThe business architecture viewpoint provides a basis for the other architecturalviewpoints. Enterprise software exists to provide business value to your enterpriseand must align with your business objectives. Without a well-defined businessarchitecture in place, any attempts at enterprise architectures are likely to involvereactive, improvised technology decisions.
The business architecture viewpoint consists of the following roles:● CEO● General Manager● Process Owner● Process Worker
Integration Architecture ViewpointThe integration architecture viewpoint is concerned with integrating systems thatrun in the enterprise inside and outside of the firewall. A simple enterprise mayneed only a few independent applications to run their business, but many enter-prises need to integrate their applications both inside and outside the firewall.Inside the firewall, classic enterprise application integration (EAI) approaches areused to integrate systems at the data, function, API, and presentation levels. Often amessage broker architecture is developed to perform intelligent routing, transforma-tion, and business rule processing. Outside of the firewall, enterprises are connectingwith other enterprises to create extended enterprise networks of trading partnersthat have cross-enterprise integration needs. This is the domain of business-to-business (B2B) integration servers (BizTalk) and Web services interoperabilityframeworks, which are designed to integrate multiple businesses at the processlevel.
Describing the Enterprise Architectural Space 5
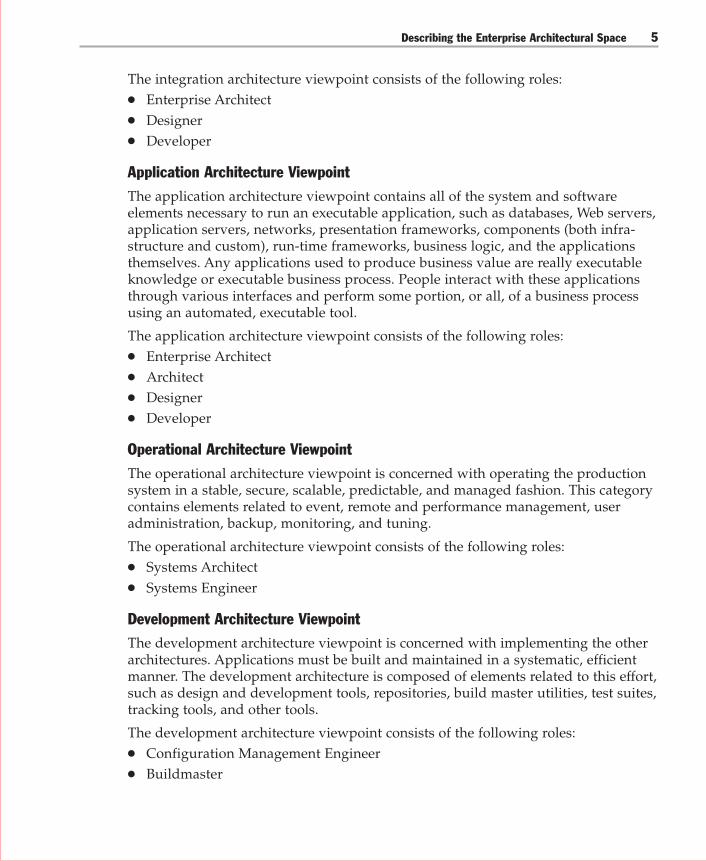
The integration architecture viewpoint consists of the following roles:● Enterprise Architect● Designer● Developer
Application Architecture ViewpointThe application architecture viewpoint contains all of the system and softwareelements necessary to run an executable application, such as databases, Web servers,application servers, networks, presentation frameworks, components (both infra-structure and custom), run-time frameworks, business logic, and the applicationsthemselves. Any applications used to produce business value are really executableknowledge or executable business process. People interact with these applicationsthrough various interfaces and perform some portion, or all, of a business processusing an automated, executable tool.
The application architecture viewpoint consists of the following roles:● Enterprise Architect● Architect● Designer● Developer
Operational Architecture ViewpointThe operational architecture viewpoint is concerned with operating the productionsystem in a stable, secure, scalable, predictable, and managed fashion. This categorycontains elements related to event, remote and performance management, useradministration, backup, monitoring, and tuning.
The operational architecture viewpoint consists of the following roles:● Systems Architect● Systems Engineer
Development Architecture ViewpointThe development architecture viewpoint is concerned with implementing the otherarchitectures. Applications must be built and maintained in a systematic, efficientmanner. The development architecture is composed of elements related to this effort,such as design and development tools, repositories, build master utilities, test suites,tracking tools, and other tools.
The development architecture viewpoint consists of the following roles:● Configuration Management Engineer● Buildmaster
Describing the Enterprise Architectural Space6
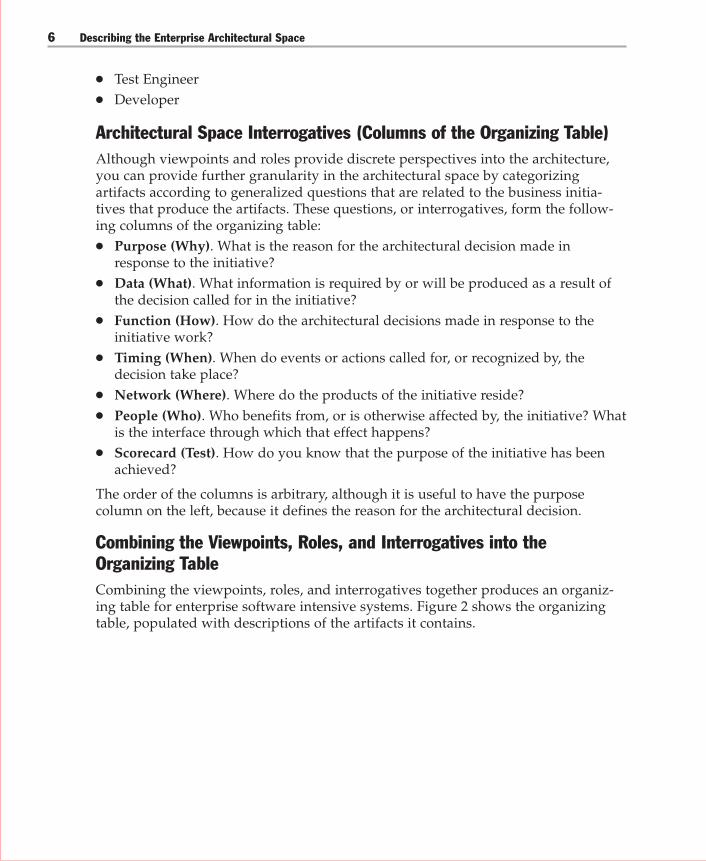
● Test Engineer● Developer
Architectural Space Interrogatives (Columns of the Organizing Table)Although viewpoints and roles provide discrete perspectives into the architecture,you can provide further granularity in the architectural space by categorizingartifacts according to generalized questions that are related to the business initia-tives that produce the artifacts. These questions, or interrogatives, form the follow-ing columns of the organizing table:● Purpose (Why). What is the reason for the architectural decision made in
response to the initiative?● Data (What). What information is required by or will be produced as a result of
the decision called for in the initiative?● Function (How). How do the architectural decisions made in response to the
initiative work?● Timing (When). When do events or actions called for, or recognized by, the
decision take place?● Network (Where). Where do the products of the initiative reside?● People (Who). Who benefits from, or is otherwise affected by, the initiative? What
is the interface through which that effect happens?● Scorecard (Test). How do you know that the purpose of the initiative has been
achieved?
The order of the columns is arbitrary, although it is useful to have the purposecolumn on the left, because it defines the reason for the architectural decision.
Combining the Viewpoints, Roles, and Interrogatives into theOrganizing TableCombining the viewpoints, roles, and interrogatives together produces an organiz-ing table for enterprise software intensive systems. Figure 2 shows the organizingtable, populated with descriptions of the artifacts it contains.

Describing the Enterprise Architectural Space 7
* Non-Functional Requirements
-Build quality and quantity
metrics
-Reports
Source code, compile
time dependencies, test
data, results,
Compilers, build tools,
system admin tools, test
tools
Operational metrics
- Directory
Implementation
- Backup and recovery
Batch files, scripts, utilities
-Performance against
SLA’s
- Operational metrics
-Directory Design
-Data storage design
-Monitoring and tuning
-Remote management
Activity metricsSpecific data inputs,
processing and outputs
Task and activity based
process models
%Utilization
Defect Rates
Cycle Times
Step Count
Process control
dashboard
Application process
models
P&L
DSOOperational dashboard
Business unit process
models
Balanced scorecard
EVA, ROE, ROA
Enterprise level
dashboard
Enterprise process
models
Development process,
events and schedule
Fault management and
recovery
Event management
Activity specific events ,
collaborations and state
transitions
Process schedule, events,
collaborations and state
transitions
Business unit master
schedule
Business events and
cycles
Development team,
system admin team,
configuration mgmt team
Development, test, and
staging environment
locations and accounts
User administration- Detailed network models
- Network monitoring
Users, roles, permissions,
security requirements
High level network models
Traffic analysis
Specific roles, accounts,
passwords and
permissions
Activitiy specific devices
and locations
Process level actors with
roles and permissions
Communication links and
devices needed for
process automation
Business unit org chart
with roles, security
permissions and skill sets
Business unit logistic
network
(nodes and links)
Organizational unitsLocations where the
enterprise operates
Asset management
metrics-Repository
-Dependency mapsBatch files, scripts, utilities
-Restore known
configurations
-Promote code
Users, roles, permissions,
security requirements
Logical and physical
device information
-Quality and predictability
metrics
-Reports
-Test Cases
-Test Data
-Repository
Automated test suites
- integration
- acceptance
- performance
Test plan with schedule
and test cases
Development team,
buildmaster, Config mgmt
team, QA mgmt
Test environment
-Software development
efficiency and
effectiveness
-Reports
- Repository
- Test Data
- IDE
- Bug Tracking Tools
- Debugging Tools
- Test Tools
- Modeling tools
-Iteration plan with
schedule and features
- Integration schedule
Users, roles and
permissions
Development environment
including integration
machine(s)
Buildmaster
Config
Mgmt Engineer
System
Engineer
Systems
Architect
Process Worker
Process Owner
General Mgr
CEO
Test Engineer
Developer
-Build quality and quantity
metrics
-Reports
Non functional
requirements - detailed
level
Non functional
requirements - high level
-Activity objectives
Process control objectives
Operational goals and
objectives
- Strategic scope
- Economic intent
- Change impact analysis
- Rollbacks
- Asset retention
-Quality and predictability
metrics
-Reports
-Software development
efficiency and
effectiveness
-Reports
Business
Architecture
Operational
Architecture
Development
Architecture
A
D
C
B
O
N
M
L
P
Q
Scorecard
(Test)
Data
(What)
Function
(How)
2 3 74
Timing
(When)
People
(Who)
Network
(Where)
65
ViewpointsPurpose
(Why)
1
Unit Tests
User Adoption
Database instances ,
stored procs, etc.
Source code
Implemetation units,
Executables
J1 realizations
Integration tests
Interfaces defined
Reuse
Tables, indexes, views,
queries
Design level classes,
component, subsystem
and
QoS
I1 realizations
Acceptance tests
App SLA metrics
Reuse
Application level data
models
Application level
-Domain models
-Analysis model
-H1 realizations
-Cross application
integration test
-SLA metrics
-Reuse
- Enterprise data models
- Data distribution
strategies
Enterprise level domain
model and logical
services
Executable
(vertical / horizontal
slices)
Design level collaboration
models
(sequence and
interaction)
Analysis level
collaboration
model
Enterprise level
collaboration models
(sequence and
interaction)
Intuitive, easy to use
executable interface
relevant to user needs
-Processes allocated to
processors
- Production environ
- NFR* met
Visual designs, wire
frames, site maps
Design level system
architecture
- addresses
-subnets
-processors
Information architecture,
interaction maps, story
boards, security
requirements
Application level system
archtecture
- Nodes, devices
- Links and segments
- Processors
Enterprise level user
profiles including
demographics,
psychographics,
technographics
Enterprise level system
architecture
-Nodes
-Links
-Locations
Developer
Designer
Architect
Enterprise
Architect
- Abbreviated use case
descriptions
- Implement interfaces
System level use cases
Mechanisms
NFR*
Application level use
cases
Mechanisms
NFR
Enterprise level use cases
Process refactorings
NFR*
Application
Architecture
H
K
J
I
EE integration tests
- Reuse
- Transaction metrics
XML Schemas, Half
Maps,ETL, Batch feeds
Design level service,
component, and
subsystem models
- EE acceptance test
- Performance against
SLAs
- Onboarding costs
Enterprise level data flows
and replication strategies
EAI (API, method, data,
user interface)
- B2B integration
-Global (GXA)
- Message broker
Design level collaboration
models
Define business process
models
-BPEL4WS
-Rosetta PIPs
Roles, permissions,
security requirements
- Integration NFR* met
Partners. customers,
suppliers, system actors
-URI’s for all trading
partners
-Integration servers and
firewalls
Designer
Enterprise
Architect
System level use cases
- Extended enterprise use
cases
- EAI use cases
Integration
ArchitectureF
E
Unit tests, system tests
Profiles, database
instances,
stored procs
XLANG, source code,
scripts, batch files,
executables
XLANG
Executable vertical and
horizontal slices
Users mapped to roles
within organizations
Process mapped to
processors, links,
protocols
Developer
Abbreviated use case
descriptions
Implement interfacesG
ENTERPRISE ARCHITECTURAL SPACE ORGANIZING TABLE
Figure 2Enterprise Architectural Space Organizing Table
Note: For a larger version of this table, see the Organizing Table .pdf file.
Describing the Enterprise Architectural Space8
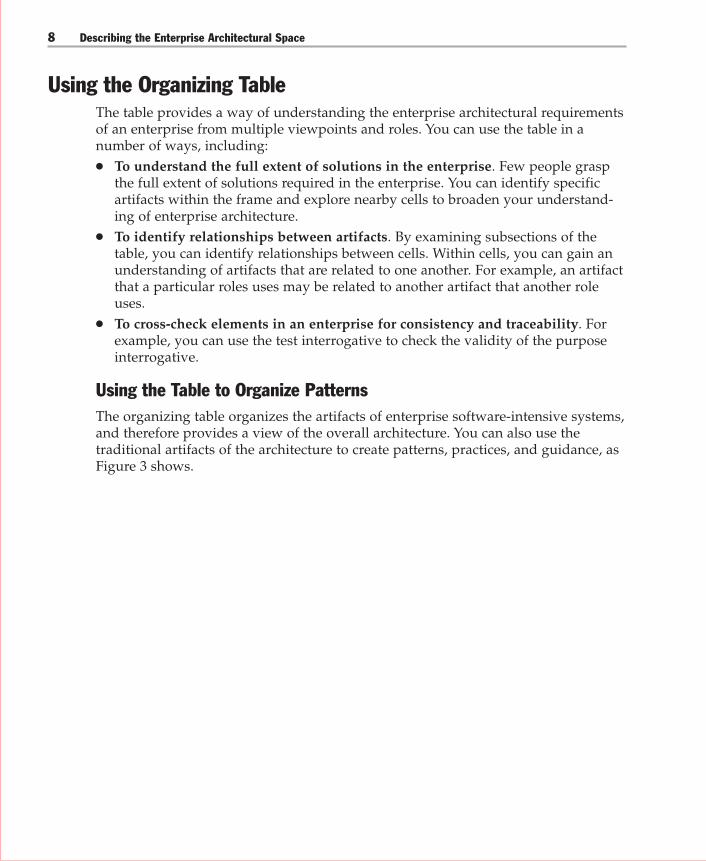
Using the Organizing TableThe table provides a way of understanding the enterprise architectural requirementsof an enterprise from multiple viewpoints and roles. You can use the table in anumber of ways, including:● To understand the full extent of solutions in the enterprise. Few people grasp
the full extent of solutions required in the enterprise. You can identify specificartifacts within the frame and explore nearby cells to broaden your understand-ing of enterprise architecture.
● To identify relationships between artifacts. By examining subsections of thetable, you can identify relationships between cells. Within cells, you can gain anunderstanding of artifacts that are related to one another. For example, an artifactthat a particular roles uses may be related to another artifact that another roleuses.
● To cross-check elements in an enterprise for consistency and traceability. Forexample, you can use the test interrogative to check the validity of the purposeinterrogative.
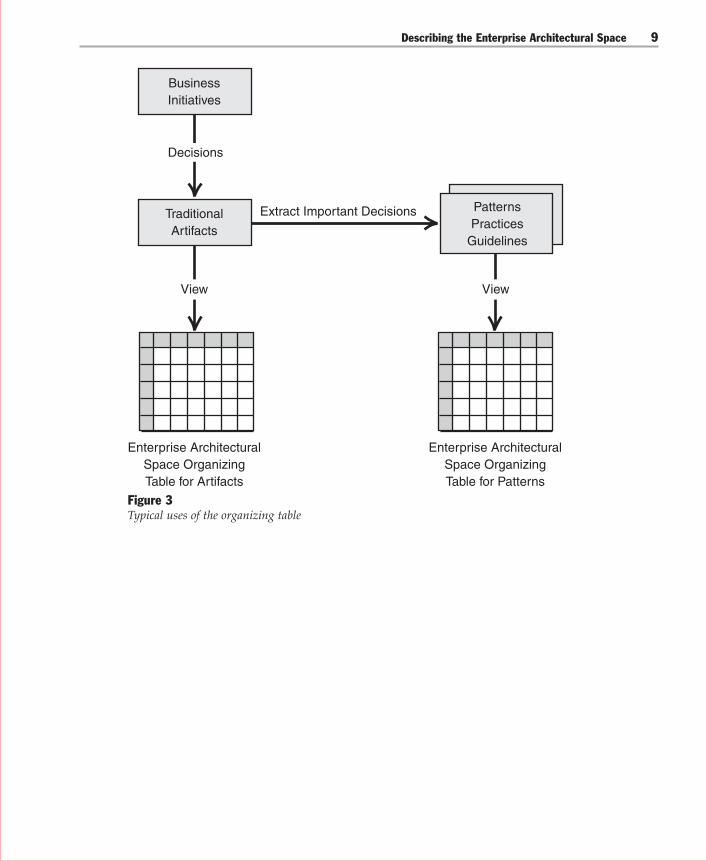
Using the Table to Organize PatternsThe organizing table organizes the artifacts of enterprise software-intensive systems,and therefore provides a view of the overall architecture. You can also use thetraditional artifacts of the architecture to create patterns, practices, and guidance, asFigure 3 shows.
Describing the Enterprise Architectural Space 9
BusinessInitiatives
Extract Important DecisionsTraditionalArtifacts
Enterprise ArchitecturalSpace OrganizingTable for Artifacts
Enterprise ArchitecturalSpace OrganizingTable for Patterns
PatternsPractices
Guidelines
Decisions
View View
Figure 3Typical uses of the organizing table

Describing the Enterprise Architectural Space10
As the figure shows, you can extract important decisions and distill them intopatterns, practices, and guidance that capture the collective learning of the enter-prise. Placing this new learning in the organizing table provides particular benefitsto pattern authors. As a pattern author, you can use the table in a number of ways,including:● To understand the context of patterns throughout the enterprise. You can
identify specific patterns within the frame and explore nearby cells to broadenyour understanding of the enterprise architecture.
● To identify areas of the table that do not contain patterns. Areas of the tablethat do not currently contain patterns may reveal areas that the patterns commu-nity has not yet addressed.
● To identify relationships between patterns. By examining subsections of thetable, you can identify relationships between cells and patterns within the cells.For example, a pattern that a particular role uses may be related to anotherpattern that another role uses.
● To move toward a more granular and consistent classification of patterns,according to their different characteristics and uses.
The Microsoft patterns & practices team uses the organizing table to categorizeexisting patterns and to identify areas where new patterns are emerging. Figure 4shows the organizing table, with recent Microsoft patterns releases plotted on it.Each pattern appears as a number. To see patterns these numbers refer to, and thepublications in which they appear, see “Key to Pattern Names in Figure 4” at theend of this paper.

Describing the Enterprise Architectural Space 11
Buildmaster
ConfigMgmt
Engineer
SystemEngineer
SystemsArchitect
ProcessWorker
ProcessOwner
GeneralManager
CEO
Business
Architecture
Operational
Architecture
Development
Architecture
ScorecardData Function Timing PeopleNetworkPurpose
Developer
Designer
Architect
EnterpriseArchitect
Application
Architecture
Designer
EnterpriseArchitect
IntegrationArchitecture
Developer
82 84 89 90 91 92 93
7965 66 67 68 69 81 85 86 87 88
52 94 95 96 97 99 100 101 102 103 105 107 109
8070 71 72 73 74 75
76 77 78 83 98 104 106 108 110 110
14 15 47 16 17 18 34
2 4 6 8 10 12 19 22 25 27 29 35 36 37 38 39 40 41 42 43 44 46 48 49 50 51 55 56 57 59 60 61 62 63
3 5 7 9 11 13 20 21 23 24 26 28 30 45 53 54 64
31 32 33 58
Figure 4Microsoft patterns releases plotted on the organizing table

Describing the Enterprise Architectural Space12
Adding Patterns to the Organizing TableIn the future, the authors of this paper want to add patterns from key pattern au-thors. By sharing the organizing table with the broader patterns community, webelieve we can provide an extensive and more coherent view of all available pat-terns. By combining efforts, the patterns community can increase pattern usage andbetter meet the needs of developers and architects who use them.
You can contribute to this effort, by adding your own existing patterns to the orga-nizing table.
� To add patterns to the organizing table1. Examine the problem and context of the pattern.2. Locate the most likely row and column where the pattern belongs.3. Read the contents of this and nearby cells and place the pattern in the cell with
the best match.
Modifying the TableIn some cases, you will find it useful to modify the table, to meet your specificneeds. For example, you may choose to increase the granularity of the table byadding additional rows or columns to more precisely define artifacts or patterns.Members of the patterns & practices team have themselves modified the table in thisway in certain publications. For example, Enterprise Solution Patterns introduced adeployment column, as shown in the following subsection of the organizing table.

Describing the Enterprise Architectural Space 13
Design
Implementation
Architecture
Database Application Deployment Infrastructure
Figure 5Enterprise Solution Patterns Organizing Table
This organizing table, which Enterprise Solution Patterns refers to as the PatternFrame, is a subset of the Application Architecture row from the Enterprise Architec-tural Space Organizing Table. The Deployment column in Figure 5 added granular-ity to the Network column from the organizing table in Figure 2.
If you compare the Pattern Frame to the organizing table more carefully, you willnotice that the column names were relabeled. The authors of Enterprise SolutionPatterns customized the column names for the audience and to account for theconstraints that they placed on this subset of the organizing table.
SummaryA comprehensive description of enterprise architecture artifacts helps you to reasonand communicate about enterprise architectures. By using an organizing tablecontaining viewpoints, roles, and interrogatives, you can help workers within yourenterprise to understand the scope of enterprise software-intensive systems andimprove business and technology alignment. You can also organize patterns, prac-tices, and guidelines derived from these artifacts in the table. Organizing themallows you to categorize them, identify relationships between them, and determineareas where new patterns and practices may be appropriate.

Describing the Enterprise Architectural Space14
CommunityQuestions? Comments? Suggestions? The authors of this paper urge you to join theEnterprise Architecture Space community on the Channel 9 Web site(http://channel9.msdn.com/wiki/default.aspx/Channel9.EnterpriseArchitecturalSpace). Youcan use this community forum to provide feedback on this paper and to contributeto the Enterprise Architecture Space Organizing Table.
References[Andersen] Andersen Consulting, Goodyear, Mark. Enterprise System Architectures:Building Client/Server and Web-based Systems. CRC Press, 2000.
[IEEE] IEEE-Std-1471-2000, Recommended Practice for Architectural Description ofSoftware-Intensive Systems.
[Zachman] Zachman, John. The Zachman Institiute for Framework Advancement,http://www.zifa.com.
ContributorsMany thanks to the following reviewers who provided invaluable assistance andfeedback: Wojtek Kozaczynski, Microsoft Platform Architecture Guidance; PhilTeale, Microsoft Corporation; Harry Pierson, Microsoft Developer and PlatformEvangelism Architecture Strategy Team; Richard Sears, Sears and Associates; BillMcDonald, Ascentium Corporation; Blaine Wastell, Ascentium Corporation; UnitedKingdom Architect Council – Patterns Working Group.
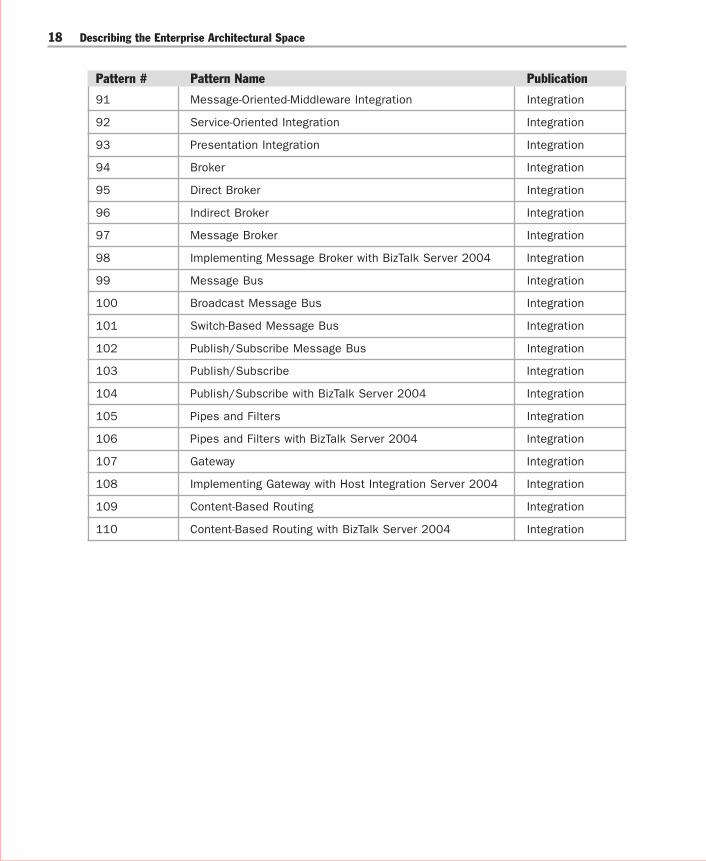
Key to Pattern Names in Figure 4The following table shows the patterns that Figure 4 refers to by number. The tableindicates the names of the patterns, and the patterns & practices publications inwhich they appear — Enterprise Solution Patterns Using Microsoft .NET (ESP), DataPatterns (Data), or Integration Patterns (Integration).
Table 1: Key to Pattern Names in Figure 4
Pattern # Pattern Name Publication
2 Model-View-Controller ESP
3 Implementing Model-View-Controller in ASP.NET ESP
4 Page Controller ESP
5 Implementing Page Controller in ASP.NET ESP

Describing the Enterprise Architectural Space 15
(continued)
6 Front Controller ESP
7 Implementing Front Controller in ASP.NETUsing HTTP Handler ESP
8 Intercepting Filter ESP
9 Implementing Intercepting Filter in ASP.NET ESPUsing HTTP Module
10 Page Cache ESP
11 Implementing Page Cache in ASP.NET ESPUsing Absolute Expiration
12 Observer ESP
13 Implementing Observer in .NET ESP
14 Layered Application ESP
15 Three-Layered Services Application ESP
16 Tiered Distribution ESP
17 Three-Tiered Distribution ESP
18 Deployment Plan ESP
19 Broker ESP
20 Implementing Broker with .NET Remoting ESPUsing Server-Activated Objects
21 Implementing Broker with .NET Remoting ESPUsing Client-Activated Objects
22 Data Transfer Object ESP
23 Implementing Data Transfer Object in .NET with a DataSet ESP
24 Implementing Data Transfer Object in .NET ESPwith a Typed DataSet
25 Singleton ESP
26 Implementing Singleton in C# ESP
27 Service Interface ESP
28 Implementing Service Interface in .NET ESP
29 Service Gateway ESP
30 Implementing Service Gateway in .NET ESP
31 Server Clustering ESP
Pattern # Pattern Name Publication

Describing the Enterprise Architectural Space16
32 Load-Balanced Cluster ESP
33 Failover Cluster ESP
34 Four-Tiered Distribution ESP
35 Abstract Factory ESP
36 Adapter ESP
37 Application Controller ESP
38 Assembler ESP
39 Bound Data Control ESP
40 Bridge ESP
41 Command(s) ESP
42 Decorator ESP
43 Facade ESP
44 Gateway ESP
45 Implementing Data Transfer Object in .NET ESPwith Serialized Objects
46 Layer Supertype ESP
47 Layers ESP
48 Mapper ESP
49 Mediator ESP
50 MonoState ESP
51 Observer ESP
52 Naming Service ESP
53 Page Data Caching ESP
54 Page Fragment Caching ESP
55 Presentation-Abstraction-Controller ESP
56 Proxy ESP
57 Remote Facade ESP
58 Server Farm ESP
59 Special Case ESP
60 Strategy ESP
61 Table Data Gateway ESP
Pattern # Pattern Name Publication

Describing the Enterprise Architectural Space 17
62 Table Module ESP
63 Template Method ESP
64 Utility Component ESP
65 Maintain Data Copies Data
66 Application-Managed Data Copies Data
67 Move Copy of Data Data
68 Data Replication Data
69 Extract-Transform-Load (ETL) Data
70 Master-Master Replication Data
71 Master-Slave Replication Data
72 Master-Master Row-Level Synchronization Data
73 Master-Slave Snapshot Replication Data
74 Capture Transaction Details Data
75 Master-Slave Transactional Incremental Replication Data
76 Implementing Master-Master Row-Level DataSynchronization Using SQL Server
77 Implementing Master-Slave Snapshot Replication DataUsing SQL Server
78 Implementing Master-Slave Transactional Incremental DataReplication Using SQL Server
79 Topologies for Data Copies Data
80 Master-Slave Cascading Replication Data
81 Entity Aggregation Integration
82 Process Integration Integration
83 Implementing Process Integration with BizTalk Server 2004 Integration
84 Portal Integration Integration
85 Data Integration Integration
86 Shared Database Integration
87 Maintain Data Copies Integration
88 File Transfer Integration
89 Functional Integration Integration
90 Distributed Object Integration Integration
Pattern # Pattern Name Publication
(continued)
Describing the Enterprise Architectural Space18
91 Message-Oriented-Middleware Integration Integration
92 Service-Oriented Integration Integration
93 Presentation Integration Integration
94 Broker Integration
95 Direct Broker Integration
96 Indirect Broker Integration
97 Message Broker Integration
98 Implementing Message Broker with BizTalk Server 2004 Integration
99 Message Bus Integration
100 Broadcast Message Bus Integration
101 Switch-Based Message Bus Integration
102 Publish/Subscribe Message Bus Integration
103 Publish/Subscribe Integration
104 Publish/Subscribe with BizTalk Server 2004 Integration
105 Pipes and Filters Integration
106 Pipes and Filters with BizTalk Server 2004 Integration
107 Gateway Integration
108 Implementing Gateway with Host Integration Server 2004 Integration
109 Content-Based Routing Integration
110 Content-Based Routing with BizTalk Server 2004 Integration
Pattern # Pattern Name Publication


