EUROPEAN COMMISSION 7th EURATOM FRAMEWORK PROGRAMME 2007-2013 THEME [Fission-2011-2.3.1] [R&D activities in support of the implementation of the Strategic Research Agenda of SNE-TP] SILER Seismic-Initiated events risk mitigation in LEad-cooled Reactors Grant Agreement N°: 295485 Deliverable title: Description of the design of seismic isolator Work Pakage Deliverable number Lead contractor Date WP2 D 2.2 14/12/2012 Responsible person details name: telephone: email: Starting date Due date Actual date Delay* Nature Description of the activities: The document is divided into two parts, one addressed to the seismic isolation system design of the ELSY reactor, the other addressed to the seismic isolation system design of the MYRRAH reactor. In the first part a simplified Finite Element model of the ELSY reactor nuclear island is developed, than the design procedure for the sizing of the isolators, HDRB and LRB type is reported. Linear and non-linear model of the isolators are implemented into the ABAQUS code and the results of the numerical analysis, aimed to check the dynamic behaviour of the isolation system, are shown. In the second part of this document the preliminary analyses carried out for the design of the seismic isolator to be used in the MYRRAH reactor are reported. Focus is on the definition of the parameters that characterize two different types of seismic isolating devices (namely High Damping Rubber Bearings – HDRBs- and Lead Rubber Bearings – LRBs) and on the Finite Element dynamic calculations made. SIGNATURES Author: A. Dusi, Numeria A. Poggianti, ENEA WP Leader; J. Gallego, EA Coordinator: M. Forni, ENEA
Transcript
EUROPEAN COMMISSION 7th EURATOM FRAMEWORK PROGRAMME 2007-2013
THEME [Fission-2011-2.3.1] [R&D activities in support of the implementation
of the Strategic Research Agenda of SNE-TP]
SILER Seismic-Initiated events risk mitigation
in LEad-cooled Reactors
Grant Agreement N°: 295485
Deliverable title: Description of the design of seismic isolator
Work
Pakage Deliverable
number Lead contractor Date
WP2 D 2.2 14/12/2012
Responsible person details name: telephone: email:
Starting date Due date Actual date Delay* Nature
Description of the activities: The document is divided into two parts, one addressed to the seismic isolation system design of the ELSY reactor, the other addressed to the seismic isolation system design of the MYRRAH reactor.
In the first part a simplified Finite Element model of the ELSY reactor nuclear island is developed, than the design procedure for the sizing of the isolators, HDRB and LRB type is reported. Linear and non-linear model of the isolators are implemented into the ABAQUS code and the results of the numerical analysis, aimed to check the dynamic behaviour of the isolation system, are shown.
In the second part of this document the preliminary analyses carried out for the design of the seismic isolator to be used in the MYRRAH reactor are reported. Focus is on the definition of the parameters that characterize two different types of seismic isolating devices (namely High Damping Rubber Bearings – HDRBs- and Lead Rubber Bearings – LRBs) and on the Finite Element dynamic calculations made.
SIGNATURES Author: A. Dusi, Numeria A. Poggianti, ENEA
WP Leader; J. Gallego, EA Coordinator: M. Forni, ENEA
Centro Ricerche Bologna
Sigla di identificazione
UTSISM – P10A - 001
Distrib.
R
Pag. di
1 19 Titolo
SILER Project
“Seismic-Initiated events risk mitigation in LEad-cooled Reactors” Description of the design of seismic isolator for ELSY reactor
This document includes the first part of the D2.2 deliverable of the SILER Project: “Description of the design of seismic isolator: Description of the models of the isolators developed for addressing the analyses of the whole isolated model.”
Deliverable D2.2 – Part 1
Note
Copia n. In carico a:
FIRMA
0 EMISSIONE 13/12/2012 NOME A. Poggianti M. Forni M. Forni
FIRMA REV. DESCRIZIONE DATA REDAZIONE CONVALIDA APPROVAZIONE
This document reports the activities performed in the framework of the Task 2.2 of the SILER project n° 295485.
The task is aimed to design the seismic isolation system of the nuclear islands of the reactor ELSY and of the MYRRAH reactor. The document is divided into two parts, one addressed to the seismic isolation system design of the ELSY reactor, the other addressed to the seismic isolation system design of the MYRRAH reactor.
2 ELSY nuclear island seismic isolation system design
This part of the document contains a description of the simplified Finite Element Model of the buildings of the nuclear islands that are positioned on a common basement, the design procedure for the sizing of the isolators and the results of the numerical analysis performed using ABAQUS code [1].
ABAQUS is a suite of powerful engineering simulation programs, based on the finite element method that can solve problems ranging from relatively simple linear analyses to the most challenging nonlinear simulations. ABAQUS contains an extensive library of elements that can model virtually any geometry. It has an equally extensive list of material models that can simulate the behaviour of most typical engineering materials including metals, rubber, polymers, composites, reinforced concrete, crushable and resilient foams, and geotechnical materials such as soils and rock. Designed as a general-purpose simulation tool, ABAQUS can be used to study more than just structural (stress/displacement) problems.
ABAQUS offers a wide range of capabilities for simulation of linear and nonlinear applications. Problems with multiple components are modelled by associating the geometry defining each component with the appropriate material models and specifying component interactions. In a nonlinear analysis ABAQUS automatically chooses appropriate load increments and convergence tolerances and continually adjusts them during the analysis to ensure that an accurate solution is obtained efficiently.
A complete ABAQUS analysis usually consists of three distinct stages: pre-processing, simulation, and post-processing:
In order to simulate possible seismic actions has been applied to the model two set of time histories created by EA (EMPRESARIOS AGRUPADOS INTERNATIONAL).
The ELSY nuclear island includes some buildings. All the buildings lie on a common foundation and the isolation system is positioned between the common foundation and a sub-foundation directly connected to the ground. The total mass is 1.36x10⁸ kg included the common basement.
A complete description of the geometry and layout, weights and position of the centre of gravity of each building is reported in [2].
The gap between the common basement and the sub-foundation must be enough large to allow inspection, maintenance and possible replacement of the isolators.
Each isolators is equipped with two steel plates (see fig. 2.3 and 2.4) used to rigidly connect the isolator with the above and below structures.
2.1 Finite Element Model
This model is aimed to reproduce the general layout and dimensions of the buildings, their masses and centres of gravity (CoG).
Centro Ricerche Bologna
Sigla di identificazione
UTSISM – P10A - 001
Rev.
0
Distrib.
R
Pag. di
4 20
For the purposes of this study it is only necessary to check the global behaviour of the buildings; this is the reason why a detailed model of the internal part of the buildings was not considered: the mass assigned to each floor and the internal distribution of the masses inside each building was not taken into account. Each building was considered as a box with the proper shape, the total mass and the CoG position of the real one. The internal structure, roughly modelled has only the aim to obtain the mass and the CoG position wanted.
The position of the different buildings on the common base was maintained in order to reproduce the real distribution of the masses over the basement. This distribution is taken into account when the position of the isolators is studied, with the scope of obtaining the condition of the centre of gravity (almost) coincident with the centre of stiffness of the isolation system. This statement avoids that the point of application of the inertia forces would be at a certain distance from the point of application of the elastic forces of the isolation system, thus creating a torsion moment along the vertical axis. This moment, applied to the whole structure can causes larger displacement in the isolators positioned along the perimeter of the basement.
The model created can’t be used to obtain data on the real buildings behaviour such as natural frequency or stress distribution, but just to reproduce their displacement at the base level.
The model was created using shell elements for the walls, the water was considered as a solid mass (sloshing was not considered), the vessel was modelled using solid elements; also the common basement was modelled using solid elements, see figure 2.1 and 2.2.
Figure 2.1 – Nuclear island assembly – global view
Centro Ricerche Bologna
Sigla di identificazione
UTSISM – P10A - 001
Rev.
0
Distrib.
R
Pag. di
5 20
Figure 2.2 – Nuclear island assembly – cut view - brown: solid elements
The position of the CoG computed with the Abaqus model is compared, in the table 2.1 below, with the one given in [2] Appendix G.
Doc. No. 092-260-F-C-00101 ABAQUS
XC m 0.15 0.38
YC m 0.013 0.0
ZC m 17.68 16.79
Table – 2.1: Comparison between the simplified FEM by ENEAand the one built by EA
2.2 Seismic input
The time-histories, selected and prepared by EA, used for the analyses are 2 set of 3 terns of artificial accelerograms, reported in [2].
The first tern of accelerograms was selected to be spectrum compatible with the RG 1.60 extended to the east coast. This type of spectra is to be used for hard soils. The second one was selected to be compatible with the Eurocode 8 [4] EC8 type 1 soil type E elastic spectrum (type 1). This type of spectra is to be used for soft soils.
The maximum PGA considered was 0.3g in DBE conditions.
2.3 Numerical analyses procedure
Abaqus [1] offers several methods for performing dynamic analysis of problems in which inertia effects are considered. Direct integration of the system must be used when nonlinear dynamic response is being studied. Modal methods are usually chosen for linear analyses because in direct-integration dynamics the global equations of motion of the system must be
Centro Ricerche Bologna
Sigla di identificazione
UTSISM – P10A - 001
Rev.
0
Distrib.
R
Pag. di
6 20
integrated through time, which makes direct-integration methods significantly more expensive than modal methods.
2.4 Isolator design
Two different types of elastomeric isolators were designed to protect the nuclear island.
Elastomeric isolators are very stiff in the vertical direction and can support the dead load with negligible creep effects during the whole life of the structure. In addition, they are flexible in the horizontal direction and elastic up to very high deformation (hyperelasticity), providing the needed stiffness and restoring force
The first one selected is a “High Damping Rubber Bearing” (HDRB), well-known and largely used for civil applications in buildings. A typical example of HDRB manufactured by the company “FIP Industriale” is shown in figure 2.3.
Elastomeric isolators are made up of alternating layers of steel laminates and hot-vulcanized rubber, due to the type of the rubber compound, commonly the damping reaches 10%-15%. The shear modulus G ranges from 0.4 to 1.4 MPa.
The second one is a “Lead Rubber Bearing” (LBR), an elastomeric isolator with a lead core.
They differ from the elastomeric isolators by the presence of a central lead core, which has the function of dissipating energy by the lead yielding and by the elastomeric compound used, which generally is of the low damping type see figure 2.4.
They are characterised by a bi-linear force-displacement constitutive law affording a higher energy dissipation than the one offered by elastomeric isolators, since their equivalent viscous damping can reach up to 30 % (courtesy of FIP Industriale).
These devices, due to their low horizontal stiffness, guarantee the increase of the fundamental period of vibration of the structure, and thus the de-coupling of the horizontal movement of the structure from the ground motion. Their high vertical stiffness limits their deflection under load.
2.5 Definition of the HDRB isolator
The first step of the seismic isolation system design was to set the isolation frequency. It is chosen as a compromise between the reduction of the acceleration of the structure1 and the displacement2. Entering in the design spectra with the wanted acceleration, it is possible to compute the maximum displacement at that acceleration. Of course the spectra are defined for a single degree of freedom oscillator, but the isolated structure behaves in a very similar way, being the structure over the isolators much more rigid, in the horizontal direction, than the isolation system. Anyway, using the simplified finite element model of the structure, it is possible to make some quick parametric analysis in order to compute isolator deformation and the structure the displacement.
If the displacement at the isolation period is not compatible with the plant characteristic, it can be changed, playing with the isolation period and the isolation system damping (if the damping increases the displacement decreases).
Once set the isolation frequency, the total stiffness of the isolation system is calculated with the following formula:
1 the low the frequency is, the low the acceleration transmitted from the soil to the structure is 2 the low the frequency is, the high the displaement of the structure above the isolators is
Centro Ricerche Bologna
Sigla di identificazione
UTSISM – P10A - 001
Rev.
0
Distrib.
R
Pag. di
7 20
K= M x 4 x π2 x f2
where:
K = global stiffness
M = total mass of the structure
f = isolation frequency
The isolation period is, of course, T = 1/f
Figure 2.3 – HDRB courtesy of FIP Industriale
Figure 2.4 – LRRB courtesy of FIP Industriale
Once defined the total horizontal stiffness, it is possible to compute the global isolator area using the formula: K = G A /Te
Centro Ricerche Bologna
Sigla di identificazione
UTSISM – P10A - 001
Rev.
0
Distrib.
R
Pag. di
8 20
where G is the rubber shear modulus, A the area, Te the rubber height.
For this application a hard rubber compound is considered (G=1.4MPa).
Taking onto account a design displacement of 250 mm at 100% of rubber shear strain we impose Te = 250mm obtaining the total area. This area represents the total surface of rubber necessary to reach the wanted total stiffness, taking into account the G modulus of the rubber compound.
The total area must be shared among the isolators installed. The total number of isolator must be a compromise considering that the much larger the isolators are, the more difficult to manufacture them is, but smaller isolators lead to a large number of them, with consequent increasing of installing cost.
The isolators must be positioned in such a way to minimize the distance between the CoG position and the centre of stiffness (CoS) position. After some considerations the final layout chosen is a square grid with two possible solutions: uniform grid 17x17 for a total of 289 isolators and uniform grid 15x15 for a total of 225 isolators.
The distance between the centres of two isolators, evaluated considering the total area of the common basement and the number of isolators, is 4.38m for the 17x17 and 5.0m for the 15x15, thus the free space between adjacent isolators seems to be enough to allow inspection and maintenance.
Some preliminary linear parametric analyses, using modal analysis method and a 10% damping applied to the modes introduced by the isolator system, were performed to define the reference isolation period, using the 17x17 layout.
In the vertical direction the isolator is modelled with a linear spring whose stiffness was estimated from the FIP catalogue data. The results are summarized in the table 2.2 below. The total displacement reported takes into account an accidental eccentricity of 5% and it is computed considering the module of the vector obtained combining the two horizontal components.
Time history U1 (m) U2 (m) U max (m) Period
RG t1 0.205 0.173 0.224 1.5
RG t2 0.181 0.179 0.222 1.5
RG t3 0.203 0.183 0.226 1.5
RG t1 0.266 0.208 0.303 1.8
RG t2 0.249 0.200 0.284 1.8
RG t3 0.238 0.193 0.297 1.8
RG t1 0.261 0.238 0.318 2.0
RG t2 0.260 0.279 0.340 2.0
RG t3 0.260 0.219 0.327 2.0
Table – 2.2 – Maximum displacement (module) including eccentricity – modal analysis
Considering that this method, in general, overestimates the displacement, the target period in the design analyses will be 1.8s.
Centro Ricerche Bologna
Sigla di identificazione
UTSISM – P10A - 001
Rev.
0
Distrib.
R
Pag. di
9 20
2.6 Bilinear model
A more realistic model for the HDRB isolator can be developed using the FEMA 356 [3] code. This code indicates a bilinear model for the isolator behaviour and it is possible to implement it into ABAQUS Code.
The bilinear model of the isolator uses an elastic plastic truss which parameters are computed as follows (see also figure 2.5). This model is very similar to the one of FEMA 356 [3].
Keff = stiffness as in paragrph 2.5,
β = 0.1, damping
D = design displacement
Hysteretic cycle area:
2 ,
but also
2 ∗ 2
Fig. 2.5: Bilinear model data
From this formula it is possible to compute the value of the Q parameter, which is a function of D.
2
If Dy, the elastic displacement of the isolator, is taken as 5% of total rubber thickness it is:
∗
/
Centro Ricerche Bologna
Sigla di identificazione
UTSISM – P10A - 001
Rev.
0
Distrib.
R
Pag. di
10 20
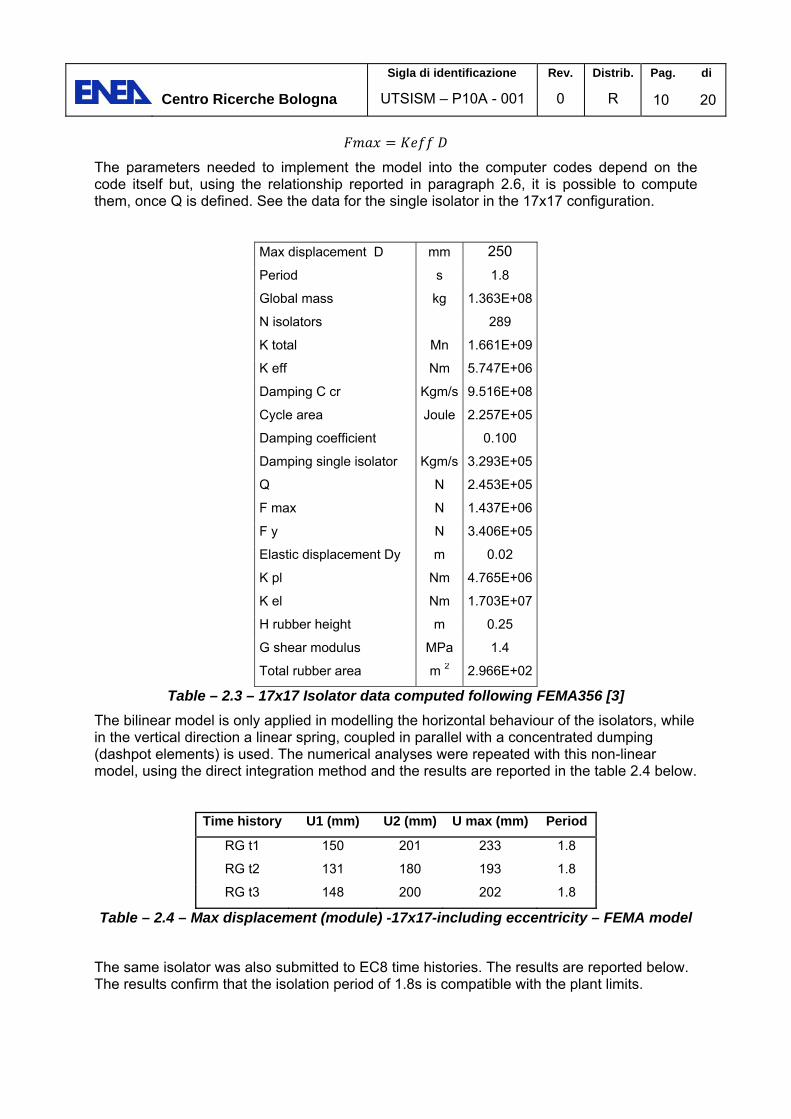
The parameters needed to implement the model into the computer codes depend on the code itself but, using the relationship reported in paragraph 2.6, it is possible to compute them, once Q is defined. See the data for the single isolator in the 17x17 configuration.
Max displacement D mm 250
Period s 1.8
Global mass kg 1.363E+08
N isolators 289
K total Mn 1.661E+09
K eff Nm 5.747E+06
Damping C cr Kgm/s 9.516E+08
Cycle area Joule 2.257E+05
Damping coefficient 0.100
Damping single isolator Kgm/s 3.293E+05
Q N 2.453E+05
F max N 1.437E+06
F y N 3.406E+05
Elastic displacement Dy m 0.02
K pl Nm 4.765E+06
K el Nm 1.703E+07
H rubber height m 0.25
G shear modulus MPa 1.4
Total rubber area m 2 2.966E+02
Table – 2.3 – 17x17 Isolator data computed following FEMA356 [3]
The bilinear model is only applied in modelling the horizontal behaviour of the isolators, while in the vertical direction a linear spring, coupled in parallel with a concentrated dumping (dashpot elements) is used. The numerical analyses were repeated with this non-linear model, using the direct integration method and the results are reported in the table 2.4 below.
Time history U1 (mm) U2 (mm) U max (mm) Period
RG t1 150 201 233 1.8
RG t2 131 180 193 1.8
RG t3 148 200 202 1.8
Table – 2.4 – Max displacement (module) -17x17-including eccentricity – FEMA model
The same isolator was also submitted to EC8 time histories. The results are reported below. The results confirm that the isolation period of 1.8s is compatible with the plant limits.
Centro Ricerche Bologna
Sigla di identificazione
UTSISM – P10A - 001
Rev.
0
Distrib.
R
Pag. di
11 20
Time history U1 (mm) U2 (mm) U max (mm) Period
EC8 t1 115 200 205 1.8
EC8 t2 178 143 197 1.8
EC8 t3 227 151 246 1.8
Table – 2.5 – Max displacement (module) -17x17-including eccentricity – FEMA model
Once defined the isolation period, the total stiffness is known (1.66 x10³ kN/mm) and approximately the rubber height of the isolators.
With these data FIP Industriale designed two isolators one for the 17x17 configuration and one for the 15x15.
In detail the two reference HDRB isolators will be:
SI-H 1150/252 Ke = 5.77 kN/mm for the 17x17 layout
SI-H 1350/256 Ke = 7.83 kN/mm for the 15x15 layout
For the 17x17 layout the value given by FIP is practically identical with the one used in the analyses, thus no further investigations are necessary.
The vertical loads computed are (the minus means traction on the isolator):
Time history RG T1 RG T2 RG T3
Total MAX (N) 1.48E+07 1.36E+07 1.49E+07
Total MIN (N) ‐4.28E+05 ‐2.66E+05 ‐3.67E+05
Seismic MAX (N) 7.04E+06 5.30E+06 6.66E+06
Seismic MIN (N) ‐5.97E+06 ‐6.81E+06 ‐6.65E+06
Dead weight MAX (N) 8.34E+06 8.34E+06 8.34E+06
Dead weight MIN (N) 1.46E+06 1.46E+06 1.46E+06
Time history EC8 T1 EC8 T2 EC8 T3
Total MAX (N) 1.47E+07 1.54E+07 1.59E+07
Total MIN (N) ‐5.80E+05 ‐8.59E+05 ‐8.93E+05
Seismic MAX (N) 6.58E+06 7.11E+06 7.61E+06
Seismic MIN (N) ‐7.52E+06 ‐7.39E+06 ‐7.28E+06
Dead weight MAX (N) 8.34E+06 8.34E+06 8.34E+06
Dead weight MIN (N) 1.46E+06 1.46E+06 1.46E+06
Table – 2.6 – Vertical loads for the 17x17 configuration
For the 15x15 configuration numerical analyses were performed in order to check if the maximum displacement and the vertical loads are compatible with the plant and isolators characteristic. As first step a linear analysis was performed, just to have a comparison with
Centro Ricerche Bologna
Sigla di identificazione
UTSISM – P10A - 001
Rev.
0
Distrib.
R
Pag. di
12 20
the other methodologies and then a bilinear model, again following the FEMA 356 procedure was implemented in ABAQUS.
Max displacement D mm 250
Period s 1.75
Global mass kg 1.363E+08
N isolators 225
K total Mn 1.762E+09
K eff Nm 7.830E+06
Damping C cr Kgm/s 9.801E+08
Cycle area Joule 3.075E+05
Damping coefficient 0.100
Damping single isolator Kgm/s 4.356E+05
Q N 3.345E+05
F max N 1.958E+06
F y N 4.654E+05
Elastic displacement Dy m 0.020
K pl Nm 6.493E+06
K el Nm 2.308E+07
H rubber height m 0.256
G shear modulus MPa 1.4
Total rubber area m 2 3.171E+02
Table – 2.7 – 15x15 Isolator data computed following FEMA356 [3]
The results are reported in the tables below.
Time history U1 (mm) U2 (mm) U max (mm)
RG t1 198 245 263
RG t2 191 228 271
RG t3 199 206 263
Table – 2.8 – Max displacement (module)-15x15- including eccentricity – Linear model
Centro Ricerche Bologna
Sigla di identificazione
UTSISM – P10A - 001
Rev.
0
Distrib.
R
Pag. di
13 20
Time history U1 (mm) U2 (mm) U max (mm)
RG t1 143 194 220
RG t2 121 163 176
RG t3 138 195 196
EC8 t1 107 182 190
EC8 t2 181 138 186
EC8 t3 223 144 251
Table – 2.9 – Max displacement (module)-15x15- including eccentricity – FEMA model
Time history RG T1 RG T2 RG T3
Total MAX (N) 1.99E+07 1.82E+07 2.04E+07
Total MIN (N) ‐6.24E+05 ‐4.26E+05 ‐5.75E+05
Seismic MAX (N) 9.41E+06 7.02E+06 9.14E+06
Seismic MIN (N) ‐8.12E+06 ‐8.95E+06 ‐8.79E+06
Dead weight MAX (N) 1.13E+07 1.13E+07 1.13E+07
Dead weight MIN (N) 1.73E+06 1.73E+06 1.73E+06
Time history EC8 T1 EC8 T2 EC8 T3
Total MAX (N) 2.02E+07 2.02E+07 2.14E+07
Total MIN (N) ‐7.80E+05 ‐1.20E+06 ‐1.30E+06
Seismic MAX (N) 8.97E+06 9.23E+06 1.01E+07
Seismic MIN (N) ‐9.64E+06 ‐1.02E+07 ‐1.01E+07
Dead weight MAX (N) 1.13E+07 1.13E+07 1.13E+07
Dead weight MIN (N) 1.73E+06 1.73E+06 1.73E+06
Table – 2.10 – Vertical loads for the 15x15 configuration
It is also possible a different lay-out of the isolators in the 15x15 configuration obtained concentrating the isolators near the centre of the basement in order to better distributing the dead weight of the structure.
As an example, a possible solution is indicated in the figure 2.6 below. In this case the minimum distance between two isolator centres is 3.8m.
Centro Ricerche Bologna
Sigla di identificazione
UTSISM – P10A - 001
Rev.
0
Distrib.
R
Pag. di
14 20
Figure 2.6 – 15x15 alternative layout
With this configuration the results are summarized in the table below, only for the RG time histories. It is evident the reduction of the vertical loads without a strong increasing of the displacement.
Time history U1 (mm) U2 (mm) U max (mm)
RG t1 141 199 224
RG t2 129 168 182
RG t3 146 197 199
Table – 2.11 – Max displacement (module) -15x15 alternative layout- including eccentricity – FEMA model
Time history RG T1 RG T2 RG T3
Total MAX (N) 1.86E+07 1.79E+07 1.96E+07
Total MIN (N) ‐6.65E+05 ‐6.43E+05 ‐3.49E+05
Seismic MAX (N) 8.88E+06 7.69E+06 9.40E+06
Seismic MIN (N) ‐9.27E+06 ‐9.36E+06 ‐8.75E+06
Dead weight MAX (N) 1.02E+07 1.02E+07 1.02E+07
Dead weight MIN (N) 2.42E+06 2.42E+06 2.42E+06
Table – 2.12 – Vertical loads for the 15x15 configuration alternative layout
Centro Ricerche Bologna
Sigla di identificazione
UTSISM – P10A - 001
Rev.
0
Distrib.
R
Pag. di
15 20
2.7 Definition of the LRB isolator
An alternative solution to the use of HDRB isolator is the use of a LRB one (see figure 2.4). This type, due to its lead core, is able to reach larger damping coefficient (up to 20-30%), so it can be used when the spectrum characteristics cause larger displacements. For this reason this isolator was designed to be used in case of soft soils, thus the reference time histories are the ones compatible with the Eurocode 8 for soil type E, see paragraph 4.
Due to the strongly non-linear behaviour of this type of isolator, only a bi-linear model can be used in the numerical analyses. Following the same procedure as for the HDRB isolator, taking into account a 20% damping coefficient, maintaining a maximum allowable displacement of 250 mm and choosing a target period of 2.5 s, the LRB isolator was designed and a bi-linear model of the isolator behaviour was implemented into the ABAQUS code.
Max displacement D mm 250
Period s 2.5
Global mass kg 1.363E+08
N isolators 289
K total Mn 8.609E+08
K eff Nm 2.979E+06
Damping C cr Kgm/s 6.851E+08
Cycle area Joule 2.340E+05
Damping coefficient 0.2
Damping single isolator Kgm/s 4.741E+05
Q N 2.543E+05
F max N 7.448E+05
F y N 2.936E+05
Elastic displacement Dy m 0.02
K pl Nm 1.962E+06
K el Nm 1.468E+07
H rubber height m 0.25
G shear modulus MPa 1.4
Table – 2.13 – 17x17 LRB Isolator data – bilinear model
Centro Ricerche Bologna
Sigla di identificazione
UTSISM – P10A - 001
Rev.
0
Distrib.
R
Pag. di
16 20
Max displacement D mm 250
Period s 2.5
Global mass kg 1.363E+08
N isolators 225
K total Mn 8.609E+08
K eff Nm 3.826E+06
Damping C cr Kgm/s 6.851E+08
Cycle area Joule 3.005E+05
Damping coefficient 0.2
Damping single isolator Kgm/s 6.090E+05
Q N 3.267E+05
F max N 9.566E+05
F y N 3.771E+05
Elastic displacement Dy m 0.02
K pl Nm 2.520E+06
K el Nm 1.885E+07
H rubber height m 0.25
G shear modulus MPa 1.4
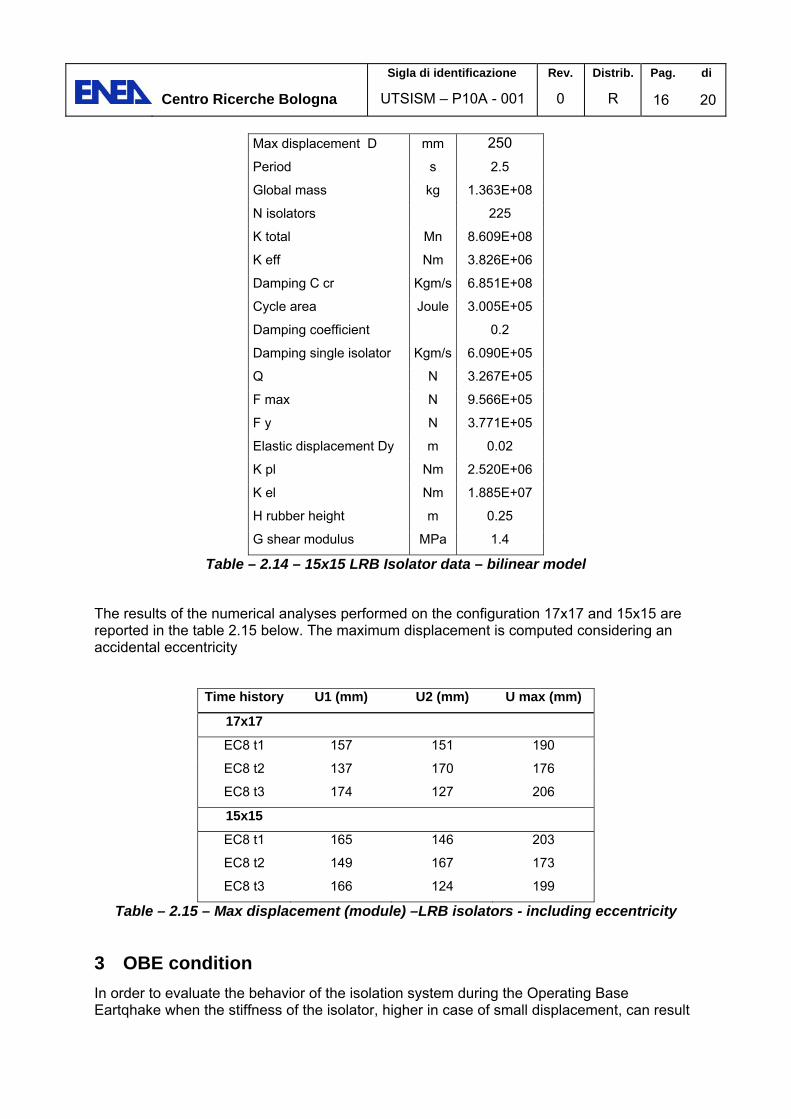
Table – 2.14 – 15x15 LRB Isolator data – bilinear model
The results of the numerical analyses performed on the configuration 17x17 and 15x15 are reported in the table 2.15 below. The maximum displacement is computed considering an accidental eccentricity
Time history U1 (mm) U2 (mm) U max (mm)
17x17
EC8 t1 157 151 190
EC8 t2 137 170 176
EC8 t3 174 127 206
15x15
EC8 t1 165 146 203
EC8 t2 149 167 173
EC8 t3 166 124 199
Table – 2.15 – Max displacement (module) –LRB isolators - including eccentricity
3 OBE condition
In order to evaluate the behavior of the isolation system during the Operating Base Eartqhake when the stiffness of the isolator, higher in case of small displacement, can result
Centro Ricerche Bologna
Sigla di identificazione
UTSISM – P10A - 001
Rev.
0
Distrib.
R
Pag. di
17 20
in a too much rigid behavior, thus generating stresses on the structure similar to the ones of the Design Base Earthquake even if the peak ground acceleration is much lower.
For these analises it was considered a PGA 1/3 of the DBE PGA.
The results obtained, using the HDRB SI-H 1350/256 in the 15x15 layout, are shown in the table below.
Time history U1 (mm) U2 (mm) U max (mm)
OBE RG t1 54 47 61
OBE RG t2 48 55 64
OBE RG t3 59 50 70
Table – 3.1 – Max displacement (module)-15x15- including eccentricity – FEMA model
4 Further alternative layout Reviewing the results, a possible alternative layout comes out. Due to the fact that the maximum displacement for the DBE condition are well below the limit of 250 mm it is possible to reduce the total stiffness of the isolation system thus increasing the displacement and decreasing the acceleration transmitted to the structure. The proposal is to maintain the isolator designed for the 15x15 configuration but reducing to a 14x14 grid the isolator’s layout. In this way the isolation period is 1.87s. A summary of the results obtained with this configuration are shown in the tables below.
Time history U1 (mm) U2 (mm) U max (mm)
RG t1 169 207 249
RG t2 154 200 218
RG t3 155 198 200
EC8 t1 137 222 232
EC8 t2 172 160 208
EC8 t3 228 155 238
Table – 4.1 – Max displacement (module)-14x14 - including eccentricity – FEMA model
Time history RG T1 RG T2 RG T3
Total MAX (N) 2.244E+07 2.121E+07 2.27E+07
Total MIN (N) ‐5.51E+05 ‐5.23E+05 ‐3.76E+05
Seismic MAX (N) 9.95E+06 8.69E+06 1.06E+07
Seismic MIN (N) ‐9.07E+06 ‐9.86E+06 ‐9.74E+06
Dead weight MAX (N) 1.26E+07 1.26E+07 1.26E+07
Dead weight MIN (N) 2.03E+06 2.03E+06 2.03E+06
Table – 4.2 – Vertical loads for the 14x14 configuration alternative layout
Centro Ricerche Bologna
Sigla di identificazione
UTSISM – P10A - 001
Rev.
0
Distrib.
R
Pag. di
18 20
Time history U1 (mm) U2 (mm) U max (mm)
OBE RG t1 60 52 66
OBE RG t2 54 62 72
OBE RG t3 60 63 70
Table – 4.3 – Max displacement (module)-14x14 - including eccentricity – FEMA model
5 Conclusions
Summarising the work done, we can say that several possibilities were evaluated, all of them appear compatible with the displacement limits defined by the plant designer. Thus it will be possible to have some flexibility in defining the final characteristic of the isolation system.
In detail two types of isolators were considered HDRB and LRB.
For the HDRB type two possible alternatives were designed: SI-H 1150/252, SI-H 1350/256.
The first one was included in a solution that foresees a regular grid 17x17 for a total of 289 isolators under the common basement, thus giving an isolation period of 1.80s. In this case The DBE condition was considered and the RG and EC8 time histories applied.
The second one is considered, at present, the reference solution and it was included in a 15x15 regular grid layout (225 isolators, isolation period 1.75s). For this configuration RG and EC8 time histories in DBE condition were considered. The OBE condition RG time histories were also applied in order to check if the displacement computed in OBE condition is not too small to avoid a too rigid answer of the isolation system to a low level earthquake.
Considering that some problem can arise from the vertical loads distribution on the isolators, due to the distribution of the masses, concentrated in the central part where the reactor building is, an alternative layout, with the isolators distributed not regularly but more concentrated near the centre of the structure, was considered. In this case only the DBE RG time histories were considered in order to compare the advantages in the vertical loads distribution.
Finally a 14x14 layout including 195 isolators SI-H 1350/256 was evaluated. This configuration increases a little the isolation period, up to 1.87s, and the displacement, without overcoming the limit of 250 mm, and it is less costly than the previous one.
If higher damping is necessary, due to the soil characteristic or to the design spectrum it is possible to use LRB isolators.
A configuration with a regular grid 17x17 was considered and only EC8 time histories, generated for a soft soil, applied (in case of rigid soil usually high level of damping is not requested). In this case the isolator characteristic are only estimated and if necessary, when FIP Industriale will design a real isolator based on the request outlined in this report, new analyses will be performed.
At the end of this work it is worth noting that the presence of the isolation system doesn’t affect significantly the vertical acceleration and the model doesn’t include a good simulation the vertical stiffness of the structure over the foundation, thus the effect of the vertical acceleration must be evaluated with a more detailed model, simulating the real building structure and their internals.
Centro Ricerche Bologna
Sigla di identificazione
UTSISM – P10A - 001
Rev.
0
Distrib.
R
Pag. di
19 20
As a conclusion we can say that the large amount of analyses performed, studying different isolators and different layouts coupled with different time histories has generated a lot of information that could be useful when the isolation system design will be finalized.
Centro Ricerche Bologna
Sigla di identificazione
UTSISM – P10A - 001
Rev.
0
Distrib.
R
Pag. di
20 20
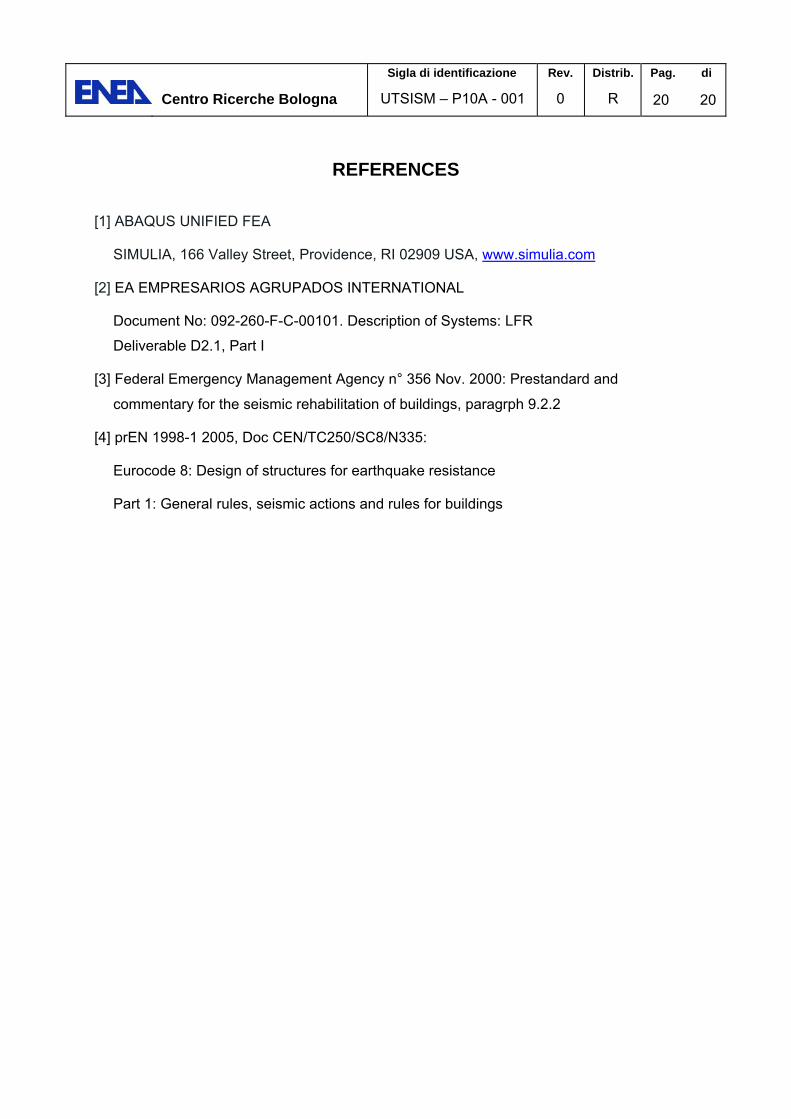
REFERENCES
[1] ABAQUS UNIFIED FEA
SIMULIA, 166 Valley Street, Providence, RI 02909 USA, www.simulia.com
[2] EA EMPRESARIOS AGRUPADOS INTERNATIONAL
Document No: 092-260-F-C-00101. Description of Systems: LFR
Deliverable D2.1, Part I
[3] Federal Emergency Management Agency n° 356 Nov. 2000: Prestandard and
commentary for the seismic rehabilitation of buildings, paragrph 9.2.2
[4] prEN 1998-1 2005, Doc CEN/TC250/SC8/N335:
Eurocode 8: Design of structures for earthquake resistance
Part 1: General rules, seismic actions and rules for buildings
TITLE SILER: Seismic-Initiated events risk mitigation in LEad-cooled Reactors
DOC Deliverable 2.2 – Part 2DATE 12 September 2012REV. 00
DOC. NO: N2012‐295485‐ DELIVERABLE D2.2. – PART 2 REV: 00
PAGE 2/24
INDICE 1 Foreword .................................................................................................................................... 3 2 The Accelerator Driven System technology: MYRRHA nuclear island ...................................... 4
2.1 Description of the reactor building ...................................................................................... 4 3 The MYRRHA reactor building seismic isolation system design ............................................... 6
4 Design of the HDRB-based isolation system ........................................................................... 16 4.1 Preliminary analyses ........................................................................................................ 16 4.2 Final analyses ................................................................................................................... 17
5 Design of the LRB-based isolation system .............................................................................. 20 5.1 Preliminary analyses ........................................................................................................ 20 5.2 Final analyses ................................................................................................................... 20
6 Preliminar non linear analyses ................................................................................................. 22 7 References .............................................................................................................................. 24
DOC. NO: N2012‐295485‐ DELIVERABLE D2.2. – PART 2 REV: 00
PAGE 3/24
1. Foreword
The SILER project aims at studying the risk associated with events triggered by earthquakes on Generation IV Heavy Liquid Metal Cooled reactors, addressing the subsequent mitigation measures and focusing on seismic isolation strategies and devices
In this document the preliminary analyses carried out for the design of the seismic isolator to be used in the MYRRAH reactor are reported. Focus is on the definition of the parameters that characterize two different types of seismic isolating devices (namely High Damping Rubber Bearings – HDRBs- and Lead Rubber Bearings – LRBs) and on the Finite Element dynamic calculations made.
The report is the contractual deliverable D2.2 – Part 2 of the EC project n. 295485 “SILER: Seismic-Initiated events risk mitigation in LEad-cooled Reactors”.
DOC. NO: N2012‐295485‐ DELIVERABLE D2.2. – PART 2 REV: 00
PAGE 4/24
2. The Accelerator Driven System technology: MYRRHA nuclear island
An accelerator driven system (ADS) is typically made of two main buildings or facilities in terms of layout: the reactor building, housing the Reactor Vessel with the target, and the LINAC Accelerator. While the reactor building is located at the end of the beam so that the beam aligns with the target within the reactor vessel, the accelerator building, the associated RF workshop and the lab are placed at the beginning of the beam. Adjacent to the reactor building, other facilities are present, among which are the heat, ventilation and air conditioning system (HVAC) chimney, the waste building and the spent fuel building. The rest of buildings of the facility are totally independent of the Reactor building and the beam tunnel from the structural point of view.
In the framework of the activities foreseen in the SILER project, based on preliminary results obtained and on discussions amongst the project partners, it has been agreed that focus has to be placed on the seismic isolation of the MYRRHA reactor building as a whole. Seismic isolation solution for the reactor vessel will be analyzed in a simplified way after having developed the solution for the reactor building.
Description of the reactor building
The reactor building is a rectangular box-type structure, formed by shear walls, whose plan dimensions are 90 x 49 m.
The next figure show a plan view of the MYRRHA (Multi-purpose Hybrid Research Reactor for High-tech Applications) reactor building.
Fig.1 MYRRHA reactor building plan view
The reactor vessel has an outer diameter of about 8.14 m and a high of 11.2 m.
DOC. NO: N2012‐295485‐ DELIVERABLE D2.2. – PART 2 REV: 00
PAGE 5/24
Fig.2 MYRRHA reactor vessel – 3D view
In the following, geometry, structural layout, materials and loads are taken from the SILER Deliverable D2.1, Part B “Description of Systems: ADS”, issued on July 11, 2012 by Empresarios Agrupados Internacional, S.A. (document n. 092-260-F-C-00102 – rev. 2) and its appendixes.
Detailed information on the MYRRHA facility can be found in the aforesaid document; the following figure reports, for sake of completeness, a cross section of the MYRRHA reactor building, as used in the FE modeling described hereinafter.
Fig.3 MYRRHA reactor building – typical cross section
DOC. NO: N2012‐295485‐ DELIVERABLE D2.2. – PART 2 REV: 00
PAGE 6/24
3. The MYRRHA reactor building seismic isolation system design
In the following, a description of the Finite Element Models, the design procedure for the definition of the isolators characteristics along with the results of the seismic analysis carried out are reported.
It is worthwhile recalling that two different types of elastomeric isolators have been designed to protect the MYRRHA reactor building. These are: High Damping Rubber Bearing (HDRB) and Lead Rubber Bearing (LRB).
Elastomeric isolators are very stiff in the vertical direction and can support the dead load with negligible creep effects during the whole life of the structure. In addition, they are flexible in the horizontal direction and elastic up to very high deformation (hyperelasticity), providing the needed stiffness and restoring force.
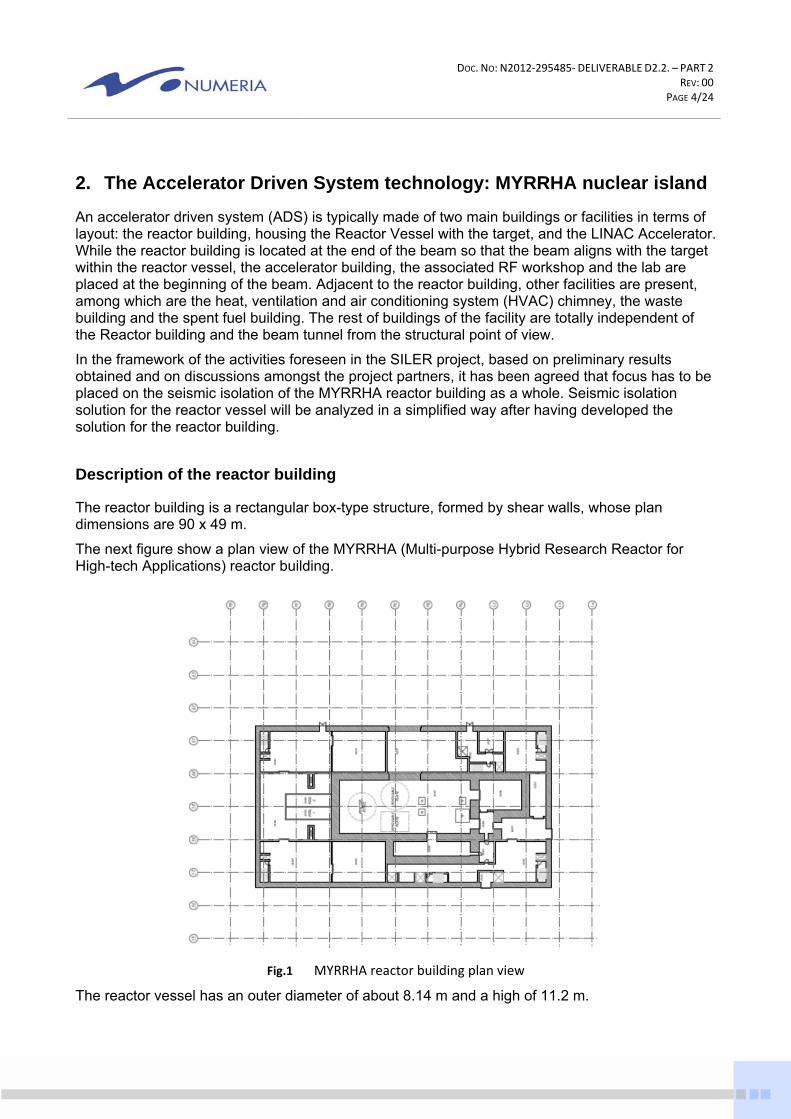
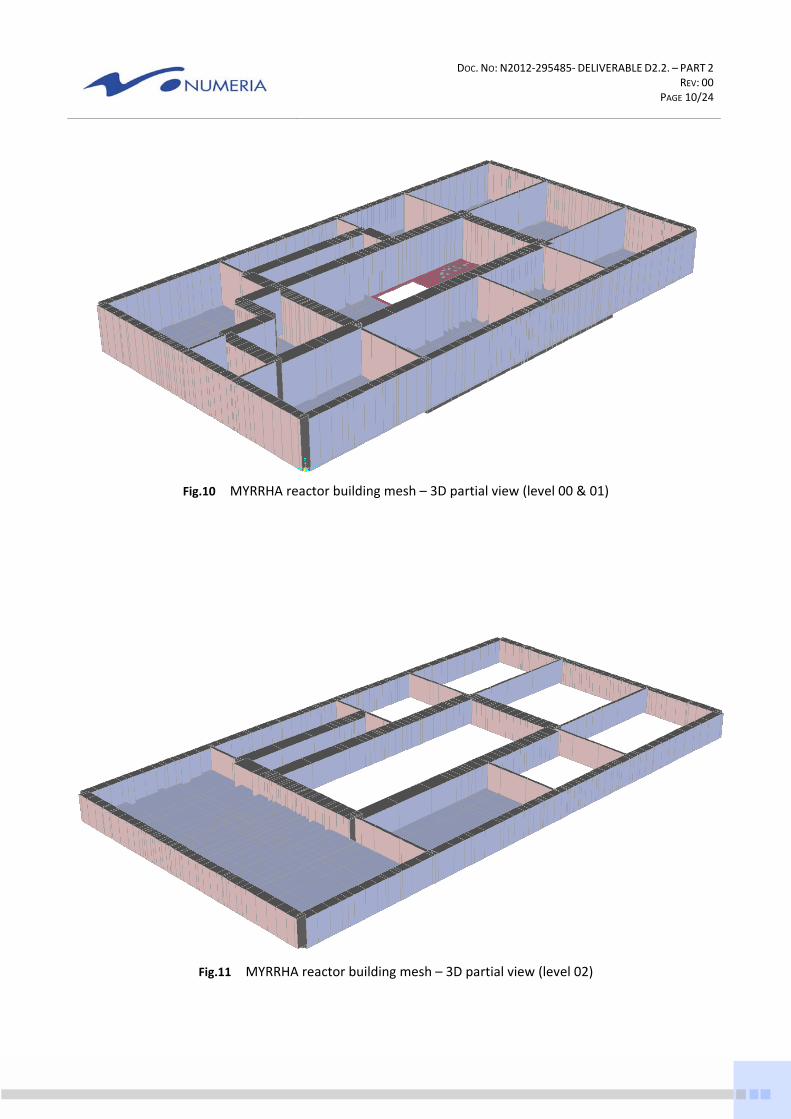
Finite Element modelling
As previously stated, according to the indications given by the project coordinator, activities have been concentrated, in this phase, on the base isolation of the whole reactor building.
Based on the data received, different Finite Element (FE) models have been first implemented in the SAP2000 NonLinear and MIDAS/Gen codes with the aim of carrying out “sensitivity” analyses and to define the “optimal” modeling for the foreseen seismic isolation system design.
The following figures show some view of the FE mesh that has been used for the analyses that lead to the definition of the base isolation system; in the figures, reference is made to the section levels as indicated in the drawings distributed in Deliverable D2.1, Part B.
DOC. NO: N2012‐295485‐ DELIVERABLE D2.2. – PART 2 REV: 00
PAGE 7/24
Fig.4 MYRRHA reactor building mesh – 3D view
DOC. NO: N2012‐295485‐ DELIVERABLE D2.2. – PART 2 REV: 00
PAGE 8/24
Fig.5 MYRRHA reactor building mesh – longitudinal cross section
Fig.7 MYRRHA reactor building mesh – 3D partial view (level 93)
DOC. NO: N2012‐295485‐ DELIVERABLE D2.2. – PART 2 REV: 00
PAGE 9/24
Fig.8 MYRRHA reactor building mesh – 3D partial view (level 92)
Fig.9 MYRRHA reactor building mesh – 3D partial view (level 91)
DOC. NO: N2012‐295485‐ DELIVERABLE D2.2. – PART 2 REV: 00
PAGE 10/24
Fig.10 MYRRHA reactor building mesh – 3D partial view (level 00 & 01)
Fig.11 MYRRHA reactor building mesh – 3D partial view (level 02)
DOC. NO: N2012‐295485‐ DELIVERABLE D2.2. – PART 2 REV: 00
PAGE 11/24
Fig.12 MYRRHA reactor building mesh – 3D partial view (level 03)
Fig.13 MYRRHA reactor building mesh – 3D partial view (level 04)
DOC. NO: N2012‐295485‐ DELIVERABLE D2.2. – PART 2 REV: 00
PAGE 12/24
Fig.14 MYRRHA reactor building mesh – 3D partial view (level 05 & 06)
DOC. NO: N2012‐295485‐ DELIVERABLE D2.2. – PART 2 REV: 00
PAGE 13/24
Seismic input
According to the indications given in the contractual document [1], seismic input is defined by two types of spectra, depending on the type of soil considered. The analysis must be carried out based on these spectra.
For hard soils the seismic input is the spectra defined in the RG 1.60 [2] extended to Central and Eastern USA, while for soft soils the elastic spectrum is defined according to EN 1998-1 [3] for spectrum type 1, soil type E.
For each type of soil, and therefore for each type of spectrum, terns of artificial spectrum-compatible time-histories have been developed by Empresarios Agrupados Internacional and are reported in [1], Appendix F.
The PGA considered is 0.3g in DBE conditions.
Furthermore, being available, for the MYRRHA site, information on the specific site soil conditions, an additional tern of artificial time histories has also been generated by Empresarios Agrupados
DOC. NO: N2012‐295485‐ DELIVERABLE D2.2. – PART 2 REV: 00
PAGE 15/24
Internacional (see [1], Appendix H). At present, this specific site seismic input has not been considered in the analyses carried out for the definition of the seismic isolation system; it will, however, be used in the subsequent re-analysis phase of the isolated MYRRHA solutions.
During this subsequent phase, extensive non linear dynamic analyses will be carried considering, for the seismic isolating devices, the actual parameters that will be provided by the manufacturer based on the experimental tests on the devices themselves.
Dynamic analyses
For the preliminary dimensioning of the base isolation systems and for the definition of the devices characteristics to be given to the manufacturer (e.g. partner FIP Industriale), FE seismic analyses have been carried out using response spectrum method.
Only after having optimized the base isolation layout, for either the HRDB and LRB alternatives, non linear calculations (direct integration of the equation of motion) have been made in order to verify the results obtained with the linear approach.
According to the Eurocodes, in the application of the response spectrum method, the elastic spectrum shall be reduced in the range of periods T 0,8 Tis, being Tis the isolated period, by assuming the suitable value of the reduction coefficient corresponding to the effective damping esi of the isolating system (i.e., in the analyses carried out, esi = 10% for HDRB and esi = 25% for LRB).
The seismic masses have been obtained from the applied loads by means of the following coefficients:
- dead loads and permanent loads (DEAD) x 1,0; - floor live loads (LIVE) x 1,0.
The “isolated” mass Misol was found, from FE calculations, to be equal to 230.989,5 ton.
For the analysis and the design of the building in the base isolated configuration, reference has been made to the relevant European standards and codes. A 5% mass eccentricity has been taken into account in the analyses carried out.
The isolating system has been modelled, according to its mechanical characteristics, considering a linear visco-elastic behaviour. In the FE model, the stiffness of each device of the isolating system have been taken as the secant stiffness referred to the total design displacement for the considered limit state. The total effective stiffness of the system Kesi, has been evaluated as the sum of the effective stiffness values of the single devices. The energy dissipated by the isolating system has been represented through its effective damping esi, evaluated with reference to the energy dissipated by the system in a cycle whose frequency is in the range of the natural frequencies of the considered modes.
Several analyses have been carried out for each type of devices (i.e. for HDRB and LRB) to be adopted for the MYRRHA seismic protection, with the most unfavourable extreme values of the model parameters, in relation to the quantities to check and consistent with the magnitude of the deformations undergone by the different devices.
DOC. NO: N2012‐295485‐ DELIVERABLE D2.2. – PART 2 REV: 00
PAGE 16/24
4. Design of the HDRB-based isolation system
A series of analyses has been carried out in order to find the optimal configuration of the isolation system, considering a target isolation period of 2 sec.
Preliminary analyses
Preliminary calculations, based on an equivalent single-degree-of-freedom (SDOF) showed that the target isolation period, Tis 2,0 sec, could have been achieved, while respecting the limitations posed on the maximum displacements, with an isolation system having an overall stiffness:
Kesi= Misol x 4 x π2 / Tis
2 = 2.279.775 kN/m
where:
Kesi = global stiffness
Misol = total isolated mass of the structure
Tis = isolation period
Then, a series of response spectrum analyses have been carried out in order to find the optimal base isolation layout; bearings types and locations were chosen so as to have a good coincidence of the centre of mass with the centre of stiffness, according to the iterative scheme reported in the following figure.
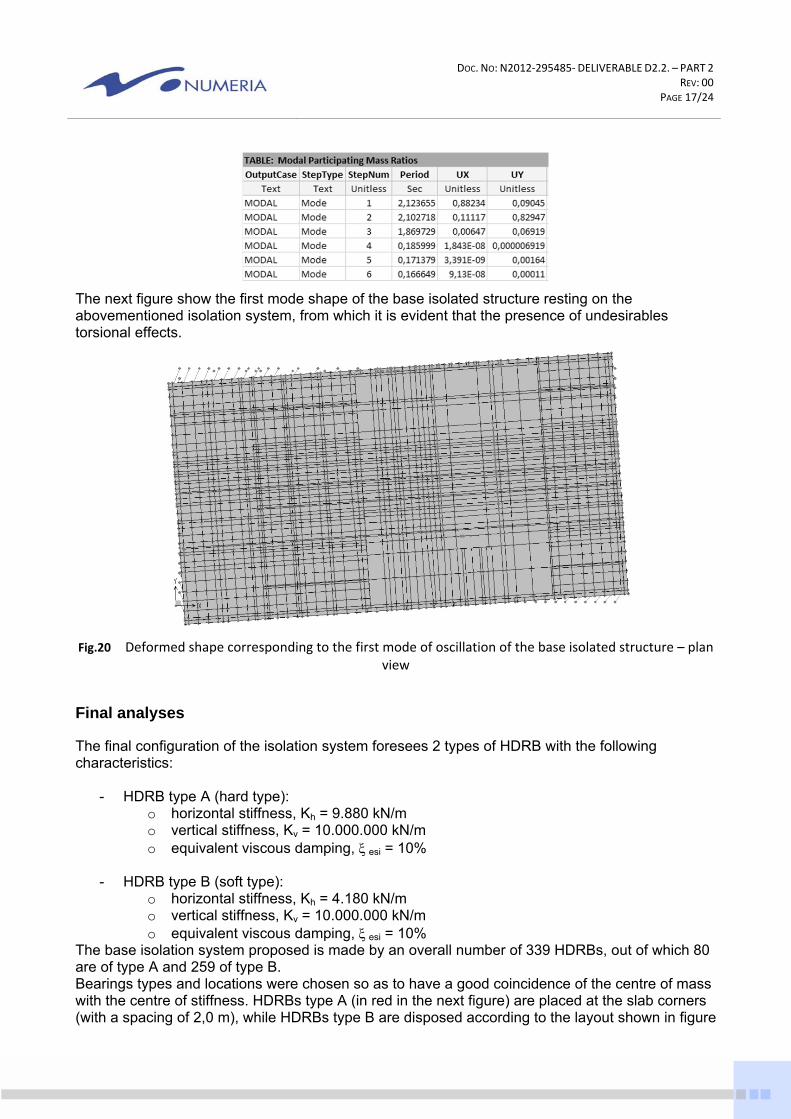
As an example of the iterative design procedure adopted, by resorting to only one type of HDRB placed at an equal spacing of 4 m under the reactor building base slab, the results obtained from the FE model give the following results in terms of dynamic response of the isolated structure:
DOC. NO: N2012‐295485‐ DELIVERABLE D2.2. – PART 2 REV: 00
PAGE 17/24
The next figure show the first mode shape of the base isolated structure resting on the abovementioned isolation system, from which it is evident that the presence of undesirables torsional effects.
Fig.20 Deformed shape corresponding to the first mode of oscillation of the base isolated structure – plan view
Final analyses
The final configuration of the isolation system foresees 2 types of HDRB with the following characteristics:
- HDRB type A (hard type): o horizontal stiffness, Kh = 9.880 kN/m o vertical stiffness, Kv = 10.000.000 kN/m o equivalent viscous damping, esi = 10%
- HDRB type B (soft type):
o horizontal stiffness, Kh = 4.180 kN/m o vertical stiffness, Kv = 10.000.000 kN/m o equivalent viscous damping, esi = 10%
The base isolation system proposed is made by an overall number of 339 HDRBs, out of which 80 are of type A and 259 of type B. Bearings types and locations were chosen so as to have a good coincidence of the centre of mass with the centre of stiffness. HDRBs type A (in red in the next figure) are placed at the slab corners (with a spacing of 2,0 m), while HDRBs type B are disposed according to the layout shown in figure
DOC. NO: N2012‐295485‐ DELIVERABLE D2.2. – PART 2 REV: 00
PAGE 18/24
21 at an equal spacing of 4,0 m. Spacing has been defined taking into account construction procedure as well as seismic isolators maintenance and replacing.
Fig.21 HDRB layout – plan view
The FE analyses showed a substantial coincidence of the centre of mass and the centre of stiffness. The following tables summarize the dynamic characteristics of the MYRRHA base isolated reactor building in the proposed configuration.
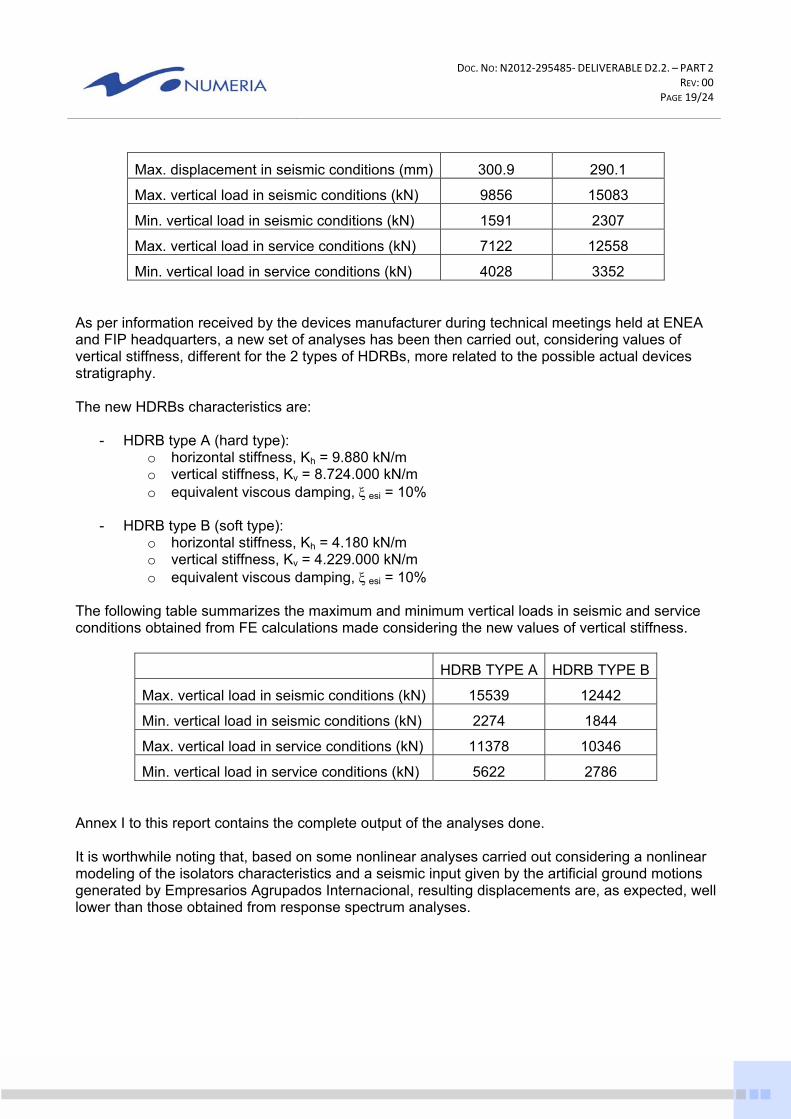
The adoption of the base isolation system, as previously described, gave rise to an isolated period of 2,20 s. The following table summarizes the maximum displacements as well as the maximum and minimum vertical loads in seismic and service conditions. Results reported are obtained from response spectrum analyses.
HDRB TYPE A HDRB TYPE B
DOC. NO: N2012‐295485‐ DELIVERABLE D2.2. – PART 2 REV: 00
PAGE 19/24
Max. displacement in seismic conditions (mm) 300.9 290.1
Max. vertical load in seismic conditions (kN) 9856 15083
Min. vertical load in seismic conditions (kN) 1591 2307
Max. vertical load in service conditions (kN) 7122 12558
Min. vertical load in service conditions (kN) 4028 3352 As per information received by the devices manufacturer during technical meetings held at ENEA and FIP headquarters, a new set of analyses has been then carried out, considering values of vertical stiffness, different for the 2 types of HDRBs, more related to the possible actual devices stratigraphy. The new HDRBs characteristics are:
- HDRB type A (hard type): o horizontal stiffness, Kh = 9.880 kN/m o vertical stiffness, Kv = 8.724.000 kN/m o equivalent viscous damping, esi = 10%
- HDRB type B (soft type):
o horizontal stiffness, Kh = 4.180 kN/m o vertical stiffness, Kv = 4.229.000 kN/m o equivalent viscous damping, esi = 10%
The following table summarizes the maximum and minimum vertical loads in seismic and service conditions obtained from FE calculations made considering the new values of vertical stiffness.
HDRB TYPE A HDRB TYPE B
Max. vertical load in seismic conditions (kN) 15539 12442
Min. vertical load in seismic conditions (kN) 2274 1844
Max. vertical load in service conditions (kN) 11378 10346
Min. vertical load in service conditions (kN) 5622 2786 Annex I to this report contains the complete output of the analyses done. It is worthwhile noting that, based on some nonlinear analyses carried out considering a nonlinear modeling of the isolators characteristics and a seismic input given by the artificial ground motions generated by Empresarios Agrupados Internacional, resulting displacements are, as expected, well lower than those obtained from response spectrum analyses.
DOC. NO: N2012‐295485‐ DELIVERABLE D2.2. – PART 2 REV: 00
PAGE 20/24
5. Design of the LRB-based isolation system
The approach adopted for the design of the seismic isolation system made of LRB is, from the methodological point of view, similar to the one used for HDRB.
Also for this case, a series of analyses has been carried out in order to find the optimal configuration of the isolation system, considering a target isolation period of approximately 2 sec.
Preliminary analyses
Preliminary calculations, based on an equivalent single-degree-of-freedom (SDOF) showed that the target isolation period, Tis 2,0 sec, could have been achieved, while respecting the limitations posed on the maximum displacements, with an isolation system having an overall stiffness:
Kesi= Misol x 4 x π2 / Tis
2 = 2.279.775 kN/m
where:
Kesi = global stiffness
Misol = total isolated mass of the structure
Tis = isolation period
A series of modal analyses have been carried out in order to find the optimal base isolation layout; bearings types and locations were chosen so as to have a good coincidence of the centre of mass with the centre of stiffness, according to the iterative scheme reported in the previous chapter.
Final analyses
The final configuration of the isolation system making use of LRB foresees 2 types of HDRB with the following characteristics:
- LRB type A (hard type): o horizontal stiffness, Kh = 15.000 kN/m o vertical stiffness, Kv = 15.000.000 kN/m o equivalent viscous damping, esi = 25%
- LRB type B (soft type):
o horizontal stiffness, Kh = 4.500 kN/m o vertical stiffness, Kv = 4.330.000 kN/m o equivalent viscous damping, esi = 25%
The base isolation system proposed is made by an overall number of 339 LRBs, out of which 80 are of type A and 259 of type B. Bearings types and locations were chosen so as to have a good coincidence of the centre of mass with the centre of stiffness. Isolation layout is the same as the one shown in figure 21: LRBs type A (in red in the figure) are placed at the slab corners (with a spacing of 2,0 m), while LRBs type B are disposed at an equal spacing of 4,0 m.
DOC. NO: N2012‐295485‐ DELIVERABLE D2.2. – PART 2 REV: 00
PAGE 21/24
The FE analyses showed a substantial coincidence of the centre of mass and the centre of stiffness. The following tables summarize the dynamic characteristics of the MYRRHA base isolated reactor building in the proposed LRB - based configuration.
The adoption of the base isolation system, as previously described, gave rise to an isolated period of 1,97 s. The following table summarizes the maximum displacements as well as the maximum and minimum vertical loads in seismic and service conditions. Results reported are obtained from response spectrum analyses.
LRB TYPE A LRB TYPE B
Max. displacement in seismic conditions (mm) 216 207
Max. vertical load in seismic conditions (kN) 20123 11878
Min. vertical load in seismic conditions (kN) 2516 1427
Max. vertical load in service conditions (kN) 15259 10245
Min. vertical load in service conditions (kN) 6043 1983 Annex I to this report contains the complete output of the analyses done. It is worthwhile noting that again, based on some nonlinear analyses carried out considering a nonlinear modeling of the isolators characteristics and a seismic input given by the artificial ground motions generated by Empresarios Agrupados Internacional, resulting displacements are, as expected, well lower than those obtained from response spectrum analyses.
DOC. NO: N2012‐295485‐ DELIVERABLE D2.2. – PART 2 REV: 00
PAGE 22/24
6. Preliminar non linear analyses
As previously said, extensive non linear dynamic analyses are foreseen when the actual parameters of the seismic isolating devices will be provided by the manufacturer based on its design and on the experimental tests carried out on the devices themselves.
However, meanwhile waiting for the devices manufacturer input, some preliminary nonlinear analyses, carried out considering nonlinear modeling of the isolators characteristics and using as seismic input the terns of accelerograms given in [1], have been made.
The main goal of these analyses is to check the validity of the data so far obtain and assess their accuracy with a more sophisticated and complete approach.
As far as the modeling of the HDRBs and LRBs behaviour is concerned, analysis in either SAP2000 and MIDAS codes have been made considering a plastic Wen, a user modified plastic Wen and a modified FEMA 356 [4] bilinear models.
Fig.22 HDRB plastic WEN model
Fig.23 HDRB and LRB user modified plastic WEN model
DOC. NO: N2012‐295485‐ DELIVERABLE D2.2. – PART 2 REV: 00
PAGE 23/24
Fig.24 HDRB and LRB user modified FEMA 356 bilinear model
Isolating devices resulting displacements are, as expected, well lower than those obtained from response spectrum analyses.
DOC. NO: N2012‐295485‐ DELIVERABLE D2.2. – PART 2 REV: 00
PAGE 24/24
7. References
[1] Empresarios Agrupados Internacional, S.A. - Deliverable D2.1, Part B “Description of Systems: ADS”; Empresarios Agrupados Internacional document n. 092-260-F-C-00102 – rev. 2, July 11 2012.
[2] USNRC RG 1.60. Design Response Spectra for Seismic Design of Nuclear Power Plants. [3] EN 1998-1:2004 Eurocode 8 – Design of structures for earthquake resistance. Part 1: General rules, seismic actions and rules for buildings.
[4] Federal Emergency Management Agency n° 356 Nov. 2000: Prestandard and commentary for the seismic rehabilitation of buildings, paragraph 9.2.2.