United States Department of Agriculture Animal and Plant Health Inspection Service Veterinary Services Centers for Epidemiology and Animal Health Center for Animal Health Information and Analysis August 2011 D D e e s s c c r r i i p p t t i i v v e e A A n n a a l l y y s s i i s s R R e e p p o o r r t t o o f f W W i i l l d d M M a a m m m m a a l l I I m m p p o o r r t t s s t t o o t t h h e e U U n n i i t t e e d d S S t t a a t t e e s s ( ( 2 2 0 0 0 0 4 4 – – 2 2 0 0 0 0 9 9 ) )
Transcript
United States Department of Agriculture Animal and Plant Health Inspection Service Veterinary Services Centers for Epidemiology and Animal Health Center for Animal Health Information and Analysis August 2011
Questions or comments on data analysis, contact: Dr. Mary Ann Bjornsen (970) 494-7310: E-mail: [email protected]
Bibliographic citation for this report: USDA. 2011. Descriptive analysis report of wild mammal imports to the United States (2004–2009).
USDA:APHIS:VS:CEAH:Center for Animal Information and Analysis. Fort Collins, CO. August 2011. 14 pages.
Abstract: Regulatory authority over the importation of wild mammals is currently divided among several Federal agencies including the U.S. Department of Agriculture’s Animal and Plant Health Inspection Service Veterinary Services (USDA:APHIS:VS), the U.S. Fish and Wildlife Service (FWS), and the Centers for Disease Control and Prevention (CDC). In a 2010 report to the U.S. Senate Committee on Homeland Security and Governmental Affairs, the U.S. Governmental Accountability Office found that because each of the agencies is focused on different aspects of live animal imports, no single entity has comprehensive responsibility for the zoonotic and animal disease risks posed by live animal imports (GAO 2010).
This report presents a summary of wild mammal import data collected by the U.S. Fish and Wildlife Service from 2004 to 2009. Mammals were specifically chosen because of (1) the frequency and severity of zoonoses introduced by mammals and (2) the frequent interaction between wild mammals and humans (Pavlin 2009). Many emerging infectious diseases in humans are caused by zoonotic pathogens that originate in wildlife, for example the emergence of Nipah virus in Malaysia, SARS in China, and monkeypox in the United States (Jones 2008; Pavilin 2009). The wild mammal trade grew substantially during the six-year period from 2004 to 2009, with number of mammals and corresponding shipments doubling over that time period. From this summary, emerging trends by taxonomic classes, exporting country and port of entry have been identified. Areas of potential investigation for emerging infectious diseases, where more detailed analysis may be necessary, include parasites potentially carried by the animal, country of origin, regulatory safeguards, intended use of the animal after importation, and level of contact with other animals and people once released into the United States.
The U.S. Department of Agriculture (USDA) prohibits discrimination in all its programs and activities on the basis of race, color, national origin, age, disability, and where applicable, sex, marital status, familial status, parental status, religion, sexual orientation, genetic information, political beliefs, reprisal, or because all or part of an individual's income is derived from any public assistance program. (Not all prohibited bases apply to all programs.) Persons with disabilities who require alternative means for communication of program information (Braille, large print, audiotape, etc.) should contact USDA's TARGET Center at (202) 720-2600 (voice and TDD).
To file a complaint of discrimination, write USDA, Director, Office of Civil Rights, 1400 Independence Avenue, SW, Washington, DC 20250-9410 or call (800) 795-3272 or (202) 720-6382 (TDD). USDA is an equal opportunity provider and employer.
Mention of companies or commercial products does not imply recommendation or endorsement by the U.S. Department of Agriculture over others not mentioned. USDA neither guarantees nor warrants the standard of any product mentioned. Product names are mentioned solely to report factually on available data and to provide specific information.
*USDA:APHIS:VS:Centers for Epidemiology and Animal Health Center for Animal Health Information and Analysis 2150B Center Avenue, MS 2W4, Fort Collins, CO 80526
Acknowledgements We would like to thank Ms. Camilla Kristensen of USDA:APHIS:VS:CEAH who published the report for 2004–2008; the U.S. Fish and Wildlife Service, Office of Law Enforcement for providing the data used in this report; and Ms. Circee Peters for her help with this project.
[This page intentionally left blank.]
DESCRIPTIVE ANALYSIS REPORT OF WILD MAMMAL IMPORTS TO THE UNITED STATES (2004–2009)
1
DESCRIPTIVE ANALYSIS REPORT OF WILD MAMMAL IMPORTS TO THE UNITED STATES (2004–2009)
INTRODUCTION In the past 70 years, zoonotic pathogens have caused the majority of emerging infectious diseases, and the majority of these zoonotic pathogens originated in wildlife. Examples include the emergence of Nipah virus in Malaysia, SARS in China, and monkeypox in the United States (Jones 2008; Pavlin 2009). The number of emerging infectious disease outbreaks caused by pathogens originating in wildlife has increased significantly during this same 70-year period (Jones 2008). These trends emphasize that a comprehensive plan to protect the United States from emerging diseases should include research into identifying the risks of wildlife-human interaction and targeting surveillance efforts on activities that result in wildlife-human contact.
The United States is among the world’s largest wildlife importers (Defenders of Wildlife 2007). Multiple Federal agencies including the United States Department of Agriculture, Animal and Plant Health Inspection Service, Veterinary Services, U.S. Fish and Wildlife Service (FWS), and the Centers for Disease Control and Prevention currently have regulatory authority over wildlife imports to the United States (CFR Title 50 Part 14). The combined regulations of these agencies cannot address all potential animal and public health risks. This is due to gaps in regulations, differing program priorities, and roles and responsibilities of each agency. Gaps in wild animal import rules, especially those for exotic animals frequently imported for the pet business, can leave the United States vulnerable to disease incursions (GAO 2010).
This report presents a summary of wild mammal import data collected by the FWS from 2004 to 2009. Mammals were specifically chosen because of the frequent interaction between wild mammals and humans and the frequency and severity of zoonoses introduced by mammals (Pavlin 2009).
DATA The data used for this analysis are declared wildlife imports to the United States from 2004 to 2009 as recorded in the Office of Law Enforcement (OLE) Law Enforcement Management Information System (LEMIS) database. LEMIS data originate from USFWS Form 3-177, U.S. Fish and Wildlife Service Declaration for Importation or Exportation of Fish or Wildlife (FWS 2010). This form is used to declare all wildlife species entering the United States at ports of entry. Wildlife is broadly defined in this report as live animals that are either captured from the wild, raised or bred in captivity for legal export to the United States, and may include native, non-native (exotic) species, or laboratory animals. Although the LEMIS data do not routinely undergo rigorous validation by FWS, the Centers for Epidemiology and Animal Health (CEAH) has reviewed the data and worked with FWS to correct data entry error. Occasional changes in taxonomic classifications may also be a source of error in these data. Where such changes were identified, the data have been updated accordingly. Any minor inaccuracies that may remain do not significantly affect general trends, findings, and conclusions of this report.
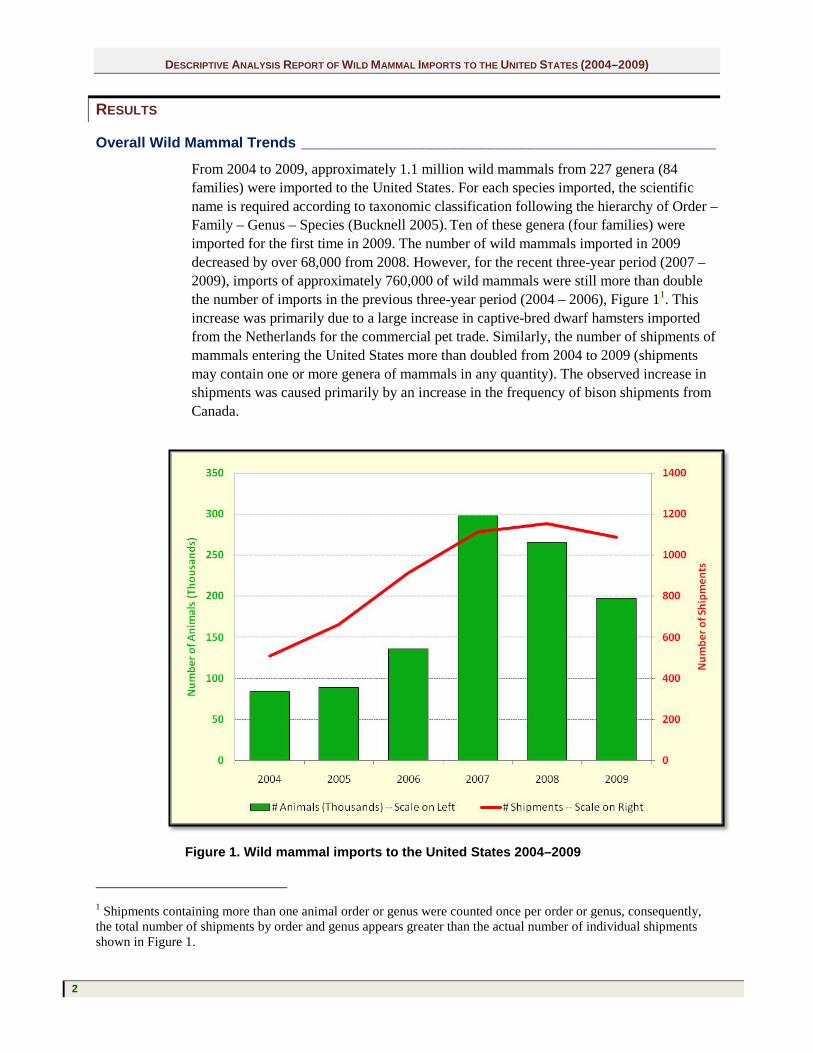
From 2004 to 2009, approximately 1.1 million wild mammals from 227 genera (84 families) were imported to the United States. For each species imported, the scientific name is required according to taxonomic classification following the hierarchy of Order – Family – Genus – Species (Bucknell 2005). Ten of these genera (four families) were imported for the first time in 2009. The number of wild mammals imported in 2009 decreased by over 68,000 from 2008. However, for the recent three-year period (2007 – 2009), imports of approximately 760,000 of wild mammals were still more than double the number of imports in the previous three-year period (2004 – 2006), Figure 11. This increase was primarily due to a large increase in captive-bred dwarf hamsters imported from the Netherlands for the commercial pet trade. Similarly, the number of shipments of mammals entering the United States more than doubled from 2004 to 2009 (shipments may contain one or more genera of mammals in any quantity). The observed increase in shipments was caused primarily by an increase in the frequency of bison shipments from Canada.
1 Shipments containing more than one animal order or genus were counted once per order or genus, consequently, the total number of shipments by order and genus appears greater than the actual number of individual shipments shown in Figure 1.
Figure 1. Wild mammal imports to the United States 2004–2009
DESCRIPTIVE ANALYSIS REPORT OF WILD MAMMAL IMPORTS TO THE UNITED STATES (2004–2009)
3
0
25,000
50,000
75,000
100,000
125,000
150,000
175,000
200,000
225,000
250,000
2004 2005 2006 2007 2008 2009
Num
ber o
f Ani
mal
s
Rodentia
Primates
Artiodactyla
Others
Trends by Order ______________________________________________________________
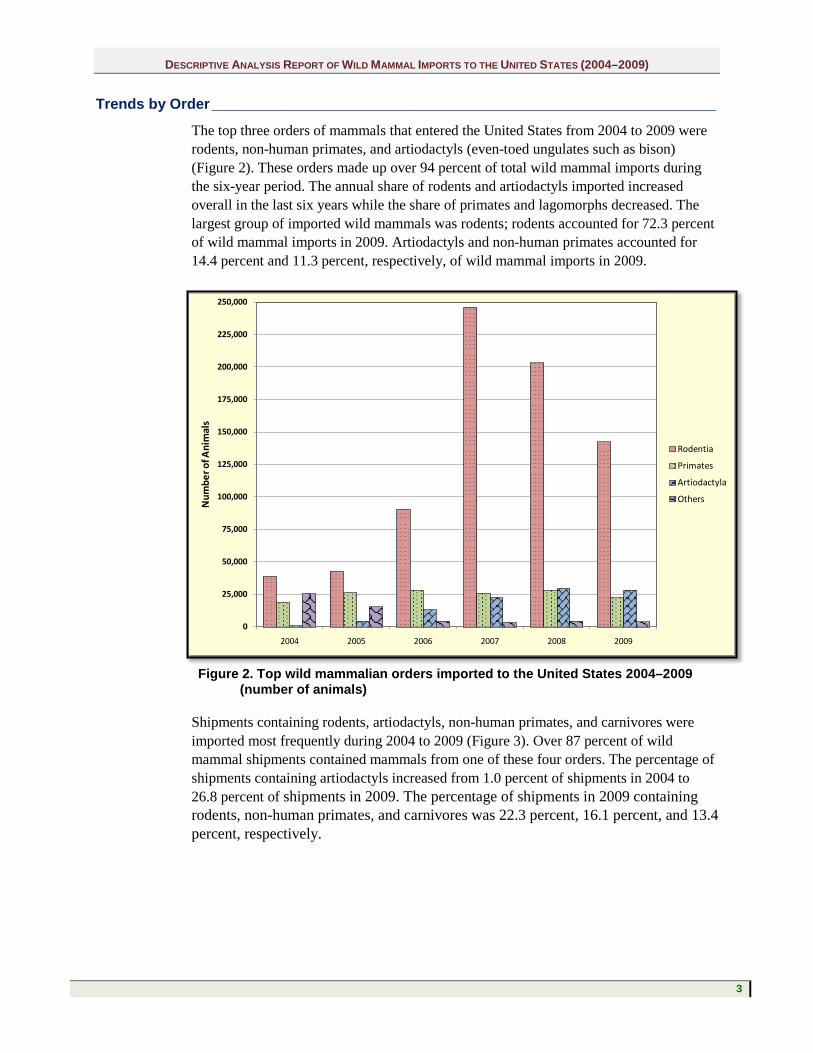
The top three orders of mammals that entered the United States from 2004 to 2009 were rodents, non-human primates, and artiodactyls (even-toed ungulates such as bison) (Figure 2). These orders made up over 94 percent of total wild mammal imports during the six-year period. The annual share of rodents and artiodactyls imported increased overall in the last six years while the share of primates and lagomorphs decreased. The largest group of imported wild mammals was rodents; rodents accounted for 72.3 percent of wild mammal imports in 2009. Artiodactyls and non-human primates accounted for 14.4 percent and 11.3 percent, respectively, of wild mammal imports in 2009.
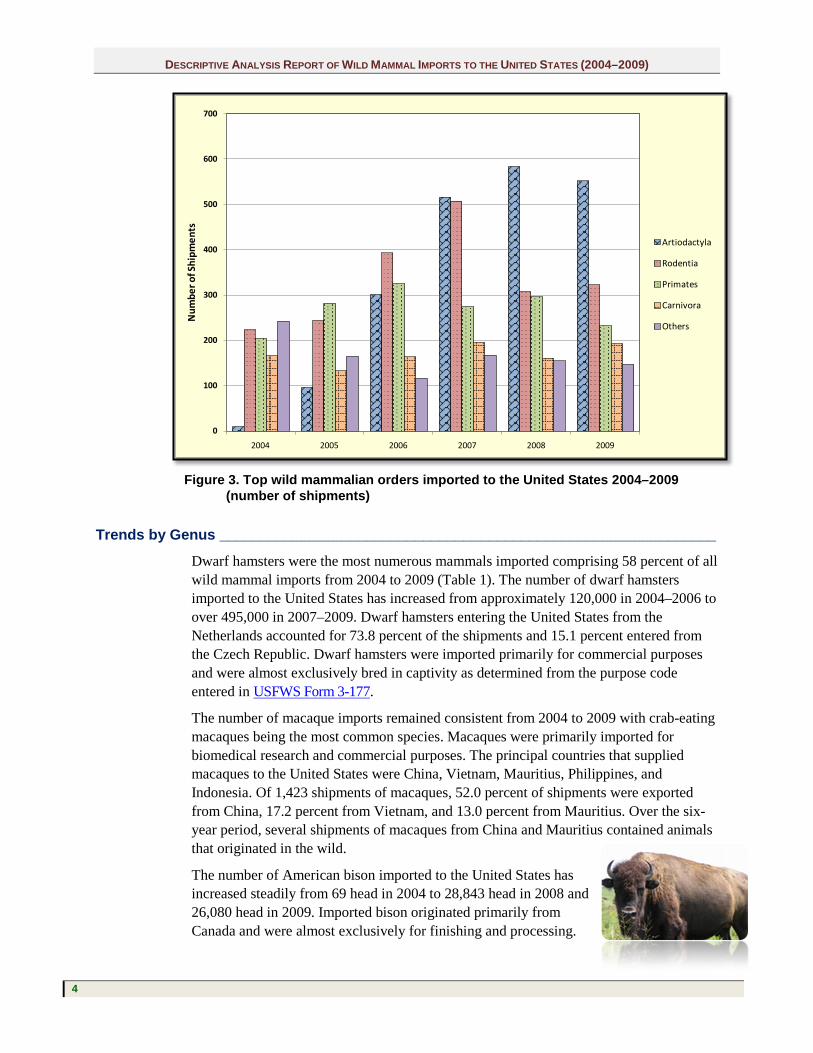
Shipments containing rodents, artiodactyls, non-human primates, and carnivores were imported most frequently during 2004 to 2009 (Figure 3). Over 87 percent of wild mammal shipments contained mammals from one of these four orders. The percentage of shipments containing artiodactyls increased from 1.0 percent of shipments in 2004 to 26.8 percent of shipments in 2009. The percentage of shipments in 2009 containing rodents, non-human primates, and carnivores was 22.3 percent, 16.1 percent, and 13.4 percent, respectively.
Figure 2. Top wild mammalian orders imported to the United States 2004–2009 (number of animals)
DESCRIPTIVE ANALYSIS REPORT OF WILD MAMMAL IMPORTS TO THE UNITED STATES (2004–2009)
4
Trends by Genus _____________________________________________________________
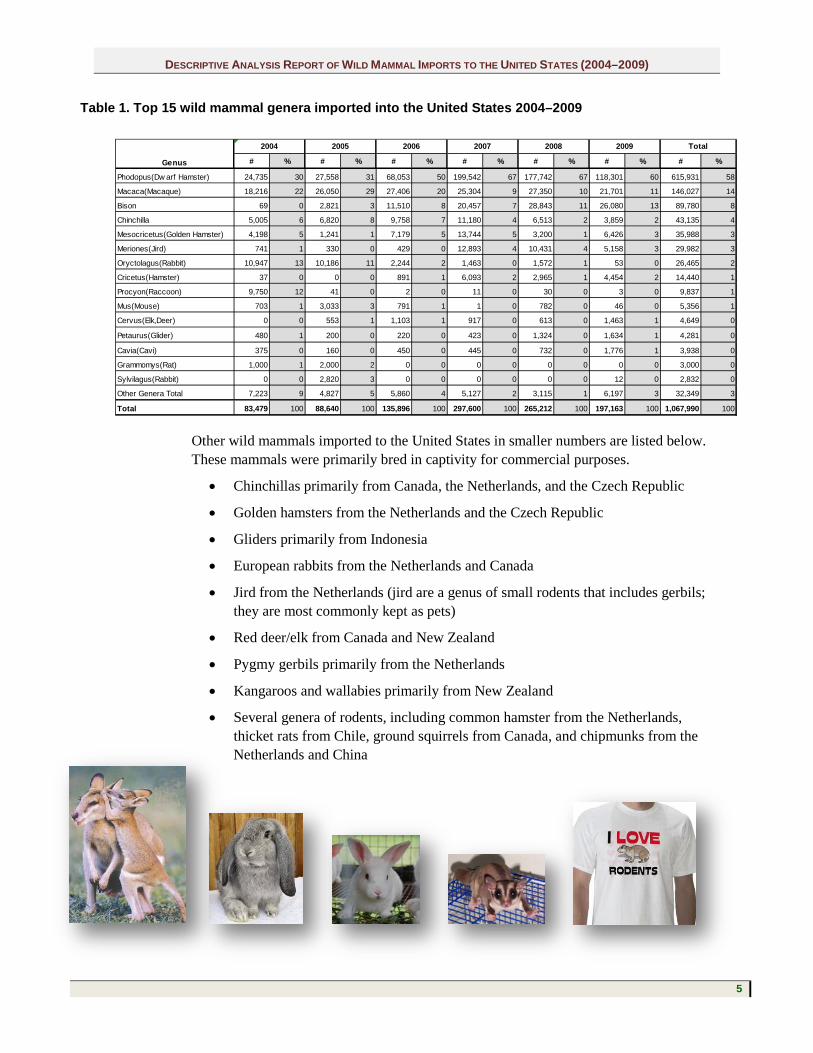
Dwarf hamsters were the most numerous mammals imported comprising 58 percent of all wild mammal imports from 2004 to 2009 (Table 1). The number of dwarf hamsters imported to the United States has increased from approximately 120,000 in 2004–2006 to over 495,000 in 2007–2009. Dwarf hamsters entering the United States from the Netherlands accounted for 73.8 percent of the shipments and 15.1 percent entered from the Czech Republic. Dwarf hamsters were imported primarily for commercial purposes and were almost exclusively bred in captivity as determined from the purpose code entered in USFWS Form 3-177.
The number of macaque imports remained consistent from 2004 to 2009 with crab-eating macaques being the most common species. Macaques were primarily imported for biomedical research and commercial purposes. The principal countries that supplied macaques to the United States were China, Vietnam, Mauritius, Philippines, and Indonesia. Of 1,423 shipments of macaques, 52.0 percent of shipments were exported from China, 17.2 percent from Vietnam, and 13.0 percent from Mauritius. Over the six-year period, several shipments of macaques from China and Mauritius contained animals that originated in the wild.
The number of American bison imported to the United States has increased steadily from 69 head in 2004 to 28,843 head in 2008 and 26,080 head in 2009. Imported bison originated primarily from Canada and were almost exclusively for finishing and processing.
0
100
200
300
400
500
600
700
2004 2005 2006 2007 2008 2009
Num
ber o
f Shi
pmen
ts
Artiodactyla
Rodentia
Primates
Carnivora
Others
Figure 3. Top wild mammalian orders imported to the United States 2004–2009 (number of shipments)
DESCRIPTIVE ANALYSIS REPORT OF WILD MAMMAL IMPORTS TO THE UNITED STATES (2004–2009)
5
Other wild mammals imported to the United States in smaller numbers are listed below. These mammals were primarily bred in captivity for commercial purposes.
• Chinchillas primarily from Canada, the Netherlands, and the Czech Republic
• Golden hamsters from the Netherlands and the Czech Republic
• Gliders primarily from Indonesia
• European rabbits from the Netherlands and Canada
• Jird from the Netherlands (jird are a genus of small rodents that includes gerbils; they are most commonly kept as pets)
• Red deer/elk from Canada and New Zealand
• Pygmy gerbils primarily from the Netherlands
• Kangaroos and wallabies primarily from New Zealand
• Several genera of rodents, including common hamster from the Netherlands, thicket rats from Chile, ground squirrels from Canada, and chipmunks from the Netherlands and China
Table 1. Top 15 wild mammal genera imported into the United States 2004–2009
DESCRIPTIVE ANALYSIS REPORT OF WILD MAMMAL IMPORTS TO THE UNITED STATES (2004–2009)
6
Trends by Exporting Country ___________________________________________________
From 2004 to 2009, 89 countries exported wild mammals to the United States. Table 2 shows the top ten countries by number of animals and shipments; these countries supplied over 97 percent of U.S. imports of wild mammals during the same period. The principal imports from these countries were rodents from the Netherlands and Czech Republic; bison, rabbits, and chinchilla from Canada; and macaques from China, Mauritius, Vietnam, and Indonesia. Four countries accounted for over 90 percent of wild mammal imports during this period: Netherlands (57.9 percent), Canada (14.6 percent), the Czech Republic (9.7 percent), and China (7.8 percent). The greatest number of wild mammal shipments arrived from Canada. Of those shipments, 54.3 percent of those shipments were bison imported to the United States for finishing and processing.
Trends by Port of Entry ________________________________________________________
Ten U.S. ports received over 95 percent of the total number of imported wild mammals and over 78 percent of wild mammal shipments from 2004 to 2009 (Table 3). Dallas/Fort Worth, TX received the greatest number of imported animals during this period, while Los Angeles, CA and Portal, ND received the greatest number of shipments. The number of animals arriving at Dallas/Fort Worth increased sharply in the six-year period from less than 23,000 in 2004 to more than 200,000 in 2008. This number declined to approximately 135,000 animals in 2009.
The increase in the number of rodents is primarily the result of the size of dwarf hamster shipments from the Netherlands. Animals per shipment increased from 25 animals in 2004 to 6,600 in 2009. Shipments entering through Los Angeles, CA were primarily macaques, rodents and gliders, and those entering through Portal, ND were almost exclusively bison and red deer/elk. In addition, a variety of large mammals including elephants, zebras, and large carnivores entered through the Canadian border ports of Blaine and Sumas (WA), Buffalo and Champlain (NY), Calais and Houlton (ME), Detroit and Port Huron (MI), Dunseith (ND), and Sweetgrass (MT).
Table 2. Top 10 countries exporting wild mammals to the United States 2004–2009
DESCRIPTIVE ANALYSIS REPORT OF WILD MAMMAL IMPORTS TO THE UNITED STATES (2004–2009)
7
DISCUSSION The wild mammal trade grew substantially during the six-year period from 2004 to 2009, with 1.1 million wild mammals imported as part of 5,438 shipments. The 197,163 mammals and 1,088 shipments imported in 2009 represent twice as many of the imported mammals compared to 2004.
The continual increase in the number of imported mammals has raised concerns about the risk these imported animals present to both animal and human health in the United States and globally. According to a report released in November 2010 by the United States General Accountability Office (GAO) to the Committee on Homeland Security and Governmental Affairs on Live Animal Imports, the following animal families have been found to harbor zoonoses (GAO-11-9).
• Mice, rats, and gerbils have been found to harbor 21 zoonoses.
• Bovines have been found to harbor 15 zoonoses.
• Primates have been found to harbor 13 zoonoses.
• Chinchillas have been found to harbor 2 zoonoses.
The total number of mammals and mammal shipments increased through 2007; much of this increase was due to the demand for hamsters, specifically dwarf hamsters. Imports of dwarf hamsters increased nine-fold when the number in 2007 was compared to the number in 2004. The surge in popularity of dwarf hamsters in 2007 may be attributable to their small size, cosmetic appearance, longer lifespan, and affordability (Abrahamsen 2011).
The number of mammal imports decreased during 2008 and 2009 when compared to 2007. When this decrease was evaluated based on the taxonomical order, the order in which the greatest decrease took place was Rodentia. One explanation for the decrease in imports of rodents for the commercial pet trade may be the economic recession in the United States.
Table 3. Top 10 ports of entry for wild mammals to the United States 2004–2009
DESCRIPTIVE ANALYSIS REPORT OF WILD MAMMAL IMPORTS TO THE UNITED STATES (2004–2009)
8
Rodents of unusual size.
The primary purposes for which primates are imported are research and exhibition. Primate research activities and exhibitions, unlike the demand for pet rodents, may be less sensitive to changes in the strength of the economy, so the demand for primates would not be expected to decrease as sharply as the demand for pet rodents.
The number of mammals of the order Artiodactyla continually increased during 2004 to 2008. Many of these Artiodactyla are bison from Canada; while bison are susceptible to diseases that affect both animals and humans, they are slaughtered shortly after entry into the United States. Thus, the risk of disease transmission from bison may be mitigated due to the expected prompt slaughter
(USDA : APHIS: VS 2010).
CONCLUSION This report provides a descriptive summary of live wild mammal imports to the United States from 2004 to 2009. Mammal imports are analyzed by taxonomic groups (order - genus - species), country of origin, and port of entry. This summary identifies emerging trends for the six-year period. Areas of potential investigation for emerging infectious diseases, where more detailed analysis may be necessary, should include:
• infectious diseases and parasites potentially carried by the animal,
• country of origin,
• regulatory safeguards,
• intended use of the animal after importation,
• taxonomic relationship, and
• level of contact with other animals and people.
As reported in a recent GAO report, current institutional controls and U.S. import regulations mitigate some of the risks of disease transmission from wildlife entering the United States (GAO 2010). However, these controls and regulations do not eliminate the risk of disease transmission from imported animals. The sheer size of the U.S. wildlife trade industry indicates the need for improved interagency collaboration and clear roles and responsibilities for involved agencies in order to mitigate potential risks to the United States from imported wildlife.
DESCRIPTIVE ANALYSIS REPORT OF WILD MAMMAL IMPORTS TO THE UNITED STATES (2004–2009)
9
REFERENCES Abrahamsen, L. 2011. Interview by R. Johnson, DVM. Imports of dwarf hamsters.
USDA:APHIS:VS:Centers for Epidemiology and Animal Health:Center for Animal Health Information and Analysis; Fort Collins, CO. Personal Communication: 2011, June 8.
Bucknell. 2005. Bucknell University’s online database of Wilson and Reeder’s Mammal Species of the World, 3rd ed.; available at http://www.bucknell.edu/msw3/.
Defenders of Wildlife. 2007. Broken screens: the regulation of live animal imports in the United States. Washington, D.C.; The Defenders of Wildlife [cited 2008Feb20]; available at http://www.defenders.org/resources/publications/programs_and_policy/international_conservation/broken_screens/broken_screens_report.pdf.
GAO. 2010. Report to the Committee on Homeland Security and Governmental Affairs. Live animal imports: Agencies need better collaboration to reduce the risk of animal-related diseases. GAO-11-9 (Washington, D.C.; Nov. 8, 2010); available at http://www.gao.gov/new.items/d119.pdf.
Jones, K., Patel, N., Levy, M., Storeygard, A., Balk, D., Gittleman, J., Daszak, P. 2008. Global trends in emerging infectious diseases. Nature. Vol. 451: 990-994.
Pavlin, B., Schloegel, L., Daszak, P. 2009. Risk of importing zoonotic diseases through wildlife trade, United States. Emerging Infectious Diseases. Vol. 15, No. 11.
USDA:APHIS:Veterinary Services. Potential risks from increased U.S. bison imports from Canada, 2004-2008. March 2010.
USFWS Form 3-177, U.S. Fish and Wildlife Service Declaration for Importation or Exportation of Fish or Wildlife form (Revised 03/10), O.M.B. No. 1018-0012, Expiration Date: 03/31/2013; available at http://www.fws.gov/le/pdffiles/3-177-1.pdf.


![NIPAH VIRUS OUTBREAK SILIGURI [JAN 31 – FEB 23,2001]](https://static.documents.pub/doc/80x56/568165e2550346895dd901de/nipah-virus-outbreak-siliguri-jan-31-feb-232001.jpg)

