39
Descriptive Descriptive Statistics Statistics Summer Program Summer Program Brian Healy Brian Healy
Descriptive StatisticsDescriptive Statistics
Summer ProgramSummer Program
Brian HealyBrian Healy
What have learned so farWhat have learned so far
What is biostatisticsWhat is biostatistics Role of biostatisticianRole of biostatistician How to input data into RHow to input data into R Simple R functionsSimple R functions
What are we doing today?What are we doing today?
Types of data Types of data Summary statisticsSummary statistics Measures of central tendencyMeasures of central tendency TablesTables GraphsGraphs How to do all of these things in RHow to do all of these things in R

Big pictureBig picture When we want to initially describe a data set When we want to initially describe a data set
or summarize a large data set using a or summarize a large data set using a graphs or tables, we have several things we graphs or tables, we have several things we can use.can use.– Summary statistics- a single number or set of Summary statistics- a single number or set of
numbers that describe the entire data setnumbers that describe the entire data set– Frequency table- a table showing the number of Frequency table- a table showing the number of
members in each of a set of specific groupsmembers in each of a set of specific groups– Graphs – a picture showing characteristics of the Graphs – a picture showing characteristics of the
data, usually focusing on one or more aspect of data, usually focusing on one or more aspect of the data setthe data set
The best way to use these different methods The best way to use these different methods depends on the type of data you havedepends on the type of data you have

Tables and graphsTables and graphs
The most important part of any The most important part of any scientific paper or presentation are the scientific paper or presentation are the graphs and tables because these are graphs and tables because these are the things people are most likely to the things people are most likely to pay attention to and remember. Also pay attention to and remember. Also these allow a large amount of data to these allow a large amount of data to be summarized in a small space.be summarized in a small space.
Statistical papers are somewhat Statistical papers are somewhat differentdifferent

Types of dataTypes of data The first thing to notice about a variable is what The first thing to notice about a variable is what
kind of variable is it.kind of variable is it. NominalNominal: Blond hair=1, Brown hair=2, Red hair=3: Blond hair=1, Brown hair=2, Red hair=3
– Definition: Values fall into unordered classesDefinition: Values fall into unordered classes– Dichotomous: Only 2 outcomes (male and female)Dichotomous: Only 2 outcomes (male and female)
OrdinalOrdinal: Mild=1, Moderate=2, Severe=3: Mild=1, Moderate=2, Severe=3– Definition: Values fall into ordered classes, but Definition: Values fall into ordered classes, but
magnitude has no meaningmagnitude has no meaning DiscreteDiscrete: Number of deaths in states in USA: Number of deaths in states in USA
– Definition: Takes on specific values and the magnitiude Definition: Takes on specific values and the magnitiude and order are importantand order are important
– Often considered continuous in analyses, but Often considered continuous in analyses, but conclusions can be misleadingconclusions can be misleading
ContinuousContinuous: Height and weight: Height and weight– Definition: Any value is possibleDefinition: Any value is possible
Summary statisticsSummary statistics
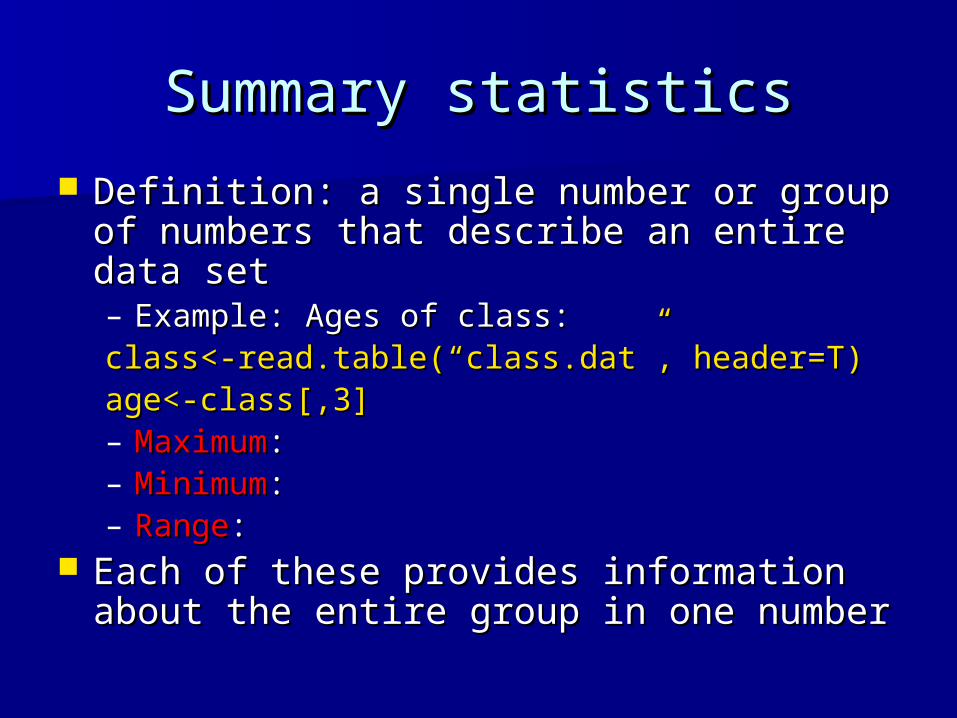
Definition: a single number or group of Definition: a single number or group of numbers that describe an entire data setnumbers that describe an entire data set– Example: Ages of class: Example: Ages of class: class<-read.table(“class.dat”, header=T)class<-read.table(“class.dat”, header=T)age<-class[,3]age<-class[,3]– MaximumMaximum::– MinimumMinimum::– RangeRange: :
Each of these provides information about Each of these provides information about the entire group in one numberthe entire group in one number

Measures of locationMeasures of location
Measures of the location of a distribution Measures of the location of a distribution (measure of central tendency)(measure of central tendency)– MeanMean: :
– MedianMedian: the middle value: the middle value– ModeMode: the most common value: the most common value
Example: Ages of classExample: Ages of class– Mean:Mean:– Median:Median:– Mode:Mode:
n
iixn
x1
1

What happens if we have What happens if we have outliers?outliers?
Each of measure of central tendency Each of measure of central tendency is appropriate in certain is appropriate in certain circumstancescircumstances
OutlierOutlier: an extreme observation: an extreme observation– May be important to understand the full May be important to understand the full
picture: rare toxicitypicture: rare toxicity– May be error in data entry or other May be error in data entry or other
reason and better ignoredreason and better ignored– Mean: very sensitiveMean: very sensitive– Median: less sensitive, more Median: less sensitive, more robustrobust

Computing summary stats Computing summary stats in Rin R
Question: What is the average high Question: What is the average high temperature in Boston in August?temperature in Boston in August?
data<-c(89, 77, 54, 80, 87, 92, 93, 83, 86)data<-c(89, 77, 54, 80, 87, 92, 93, 83, 86) mean(data)mean(data) median(data)median(data) Which better describes the data?Which better describes the data? What are explanations for the outlier? What are explanations for the outlier?
Should we include this data point?Should we include this data point?
What about the mean and What about the mean and median of ordinal and nominal median of ordinal and nominal
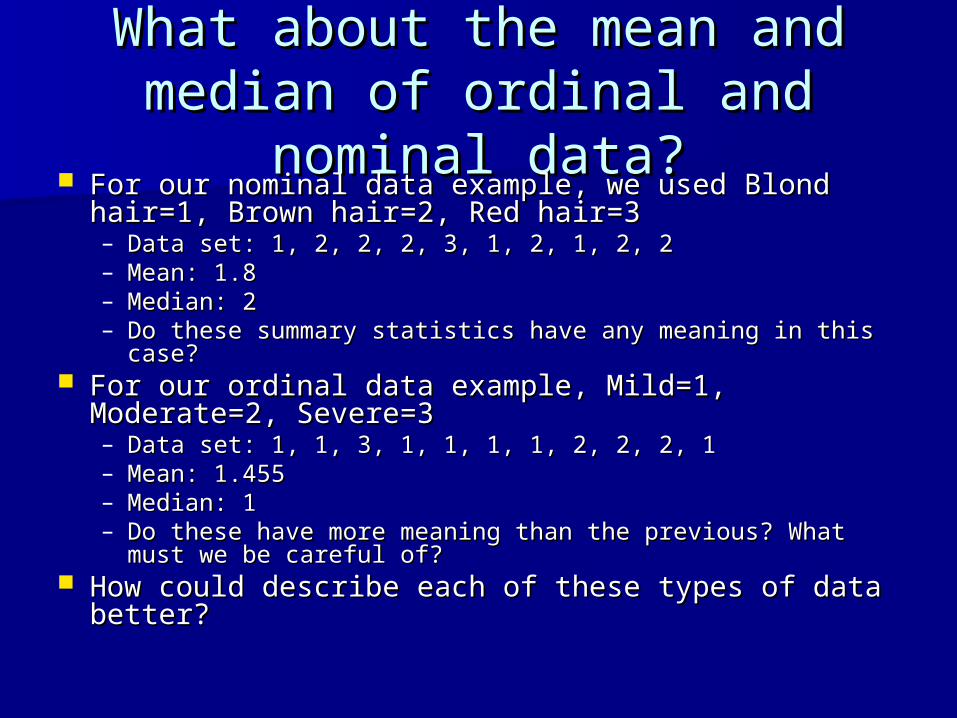
data?data? For our nominal data example, we used Blond For our nominal data example, we used Blond
hair=1, Brown hair=2, Red hair=3hair=1, Brown hair=2, Red hair=3– Data set: 1, 2, 2, 2, 3, 1, 2, 1, 2, 2Data set: 1, 2, 2, 2, 3, 1, 2, 1, 2, 2– Mean: 1.8Mean: 1.8– Median: 2Median: 2– Do these summary statistics have any meaning in this case?Do these summary statistics have any meaning in this case?
For our ordinal data example, Mild=1, Moderate=2, For our ordinal data example, Mild=1, Moderate=2, Severe=3Severe=3– Data set: 1, 1, 3, 1, 1, 1, 1, 2, 2, 2, 1Data set: 1, 1, 3, 1, 1, 1, 1, 2, 2, 2, 1– Mean: 1.455Mean: 1.455– Median: 1Median: 1– Do these have more meaning than the previous? What must Do these have more meaning than the previous? What must
we be careful of?we be careful of? How could describe each of these types of data How could describe each of these types of data
better?better?
Measures of spreadMeasures of spread
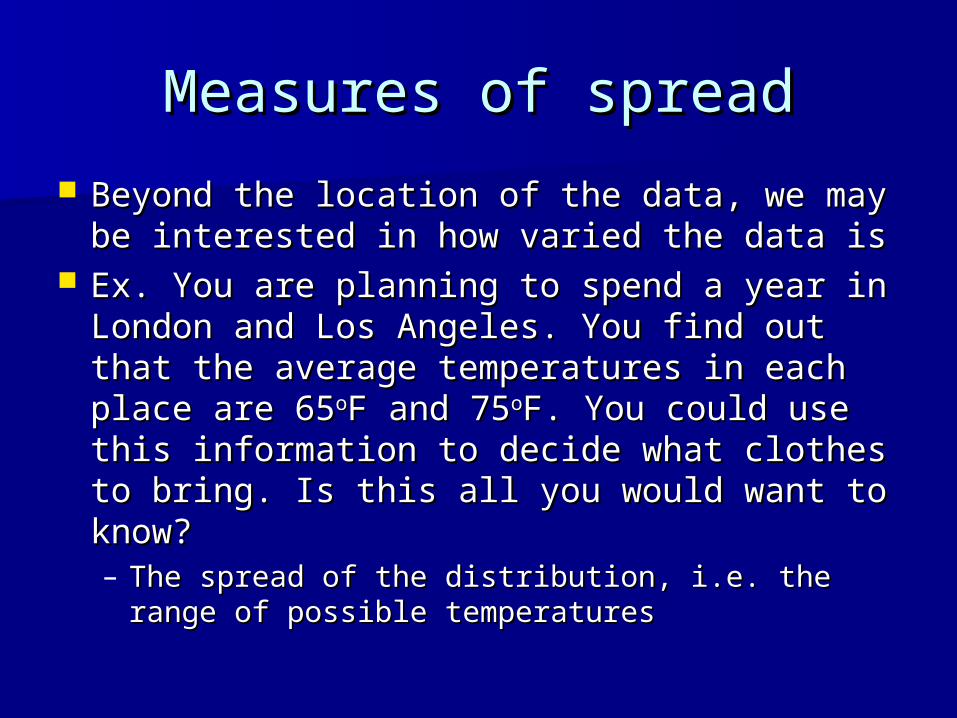
Beyond the location of the data, we may Beyond the location of the data, we may be interested in how varied the data isbe interested in how varied the data is
Ex. You are planning to spend a year in Ex. You are planning to spend a year in London and Los Angeles. You find out that London and Los Angeles. You find out that the average temperatures in each place the average temperatures in each place are 65are 65ooF and 75F and 75ooF. You could use this F. You could use this information to decide what clothes to information to decide what clothes to bring. Is this all you would want to know? bring. Is this all you would want to know? – The spread of the distribution, i.e. the range of The spread of the distribution, i.e. the range of
possible temperatures possible temperatures
Measures of spreadMeasures of spread
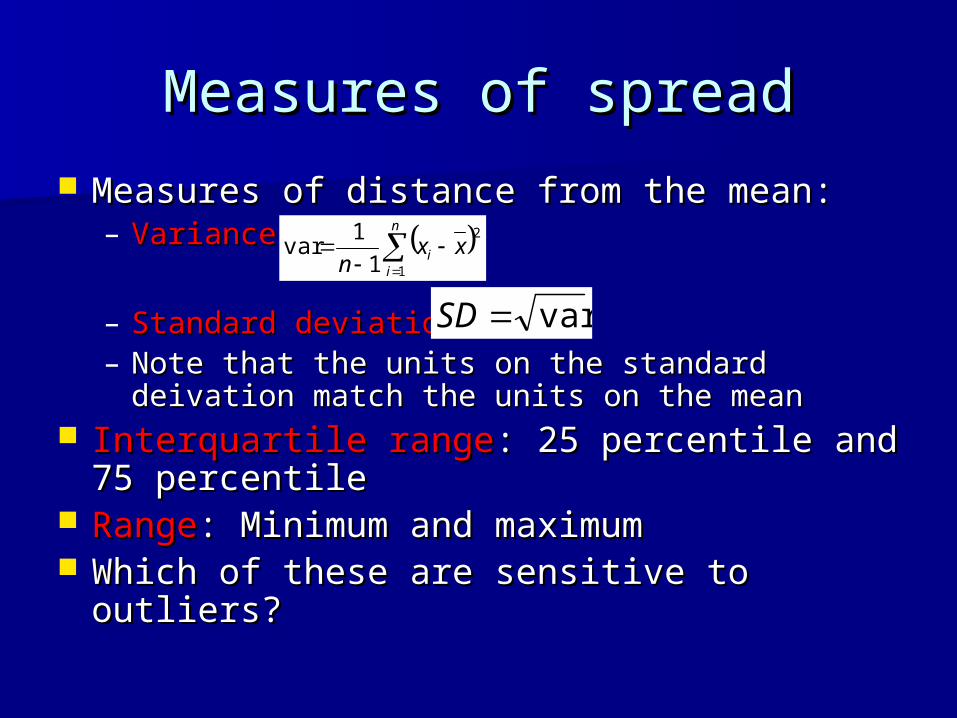
Measures of distance from the mean:Measures of distance from the mean:– VarianceVariance::
– Standard deviationStandard deviation: : – Note that the units on the standard deivation Note that the units on the standard deivation
match the units on the meanmatch the units on the mean Interquartile rangeInterquartile range: 25 percentile and 75 : 25 percentile and 75
percentilepercentile RangeRange: Minimum and maximum: Minimum and maximum Which of these are sensitive to outliers? Which of these are sensitive to outliers?
varSD
n
ii xx
n 1
2
1
1var

Computing measures of spread Computing measures of spread in Rin R
Let’s look at the spread in the heights of Let’s look at the spread in the heights of the classthe class
height<-c(63,64,66,64,64,67,68,67,63,71)height<-c(63,64,66,64,64,67,68,67,63,71) var(height)var(height) sd(height)sd(height) IQR(height)IQR(height) range(height)range(height) What is the difference in the output for IQR What is the difference in the output for IQR
and range?and range? To find any quantile, use To find any quantile, use quantile(height, quantile(height,
0.75)0.75)
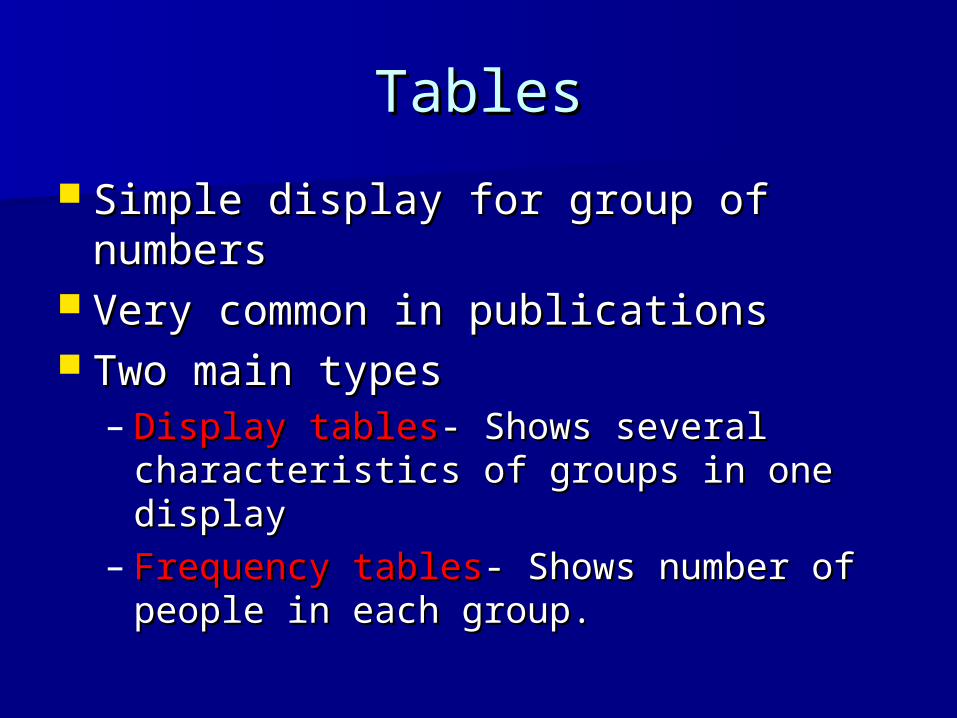
TablesTables
Simple display for group of numbersSimple display for group of numbers Very common in publicationsVery common in publications Two main typesTwo main types
– Display tablesDisplay tables- Shows several - Shows several characteristics of groups in one display characteristics of groups in one display
– Frequency tablesFrequency tables- Shows number of - Shows number of people in each group. people in each group.
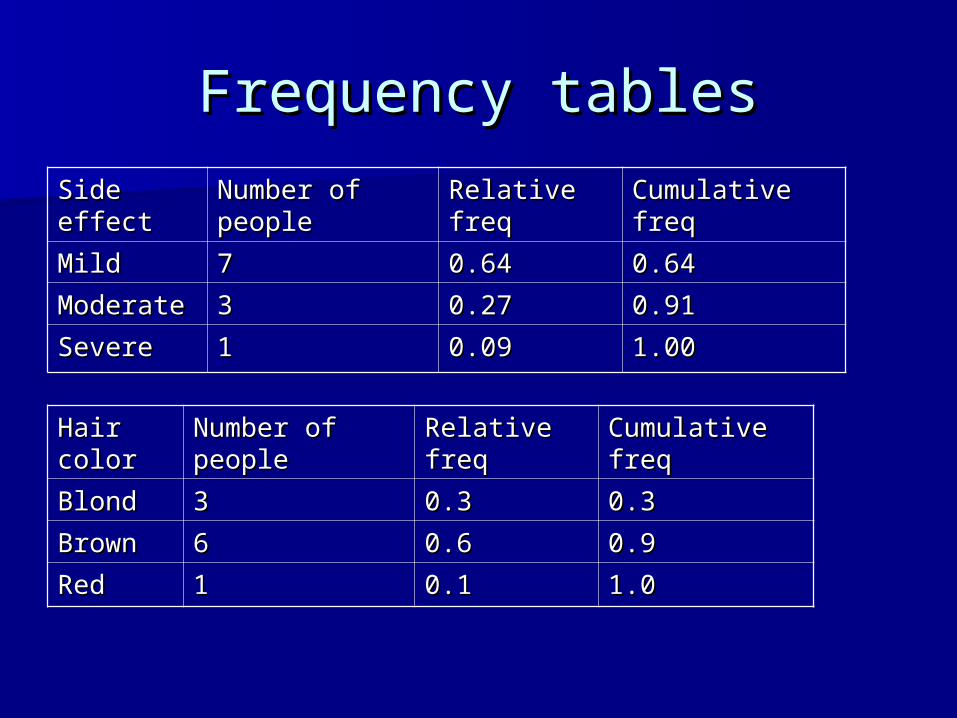
Frequency tablesFrequency tables
Hair Hair colorcolor
Number of Number of peoplepeople
Relative Relative freqfreq
Cumulative Cumulative freqfreq
BlondBlond 33 0.30.3 0.30.3
BrownBrown 66 0.60.6 0.90.9
RedRed 11 0.10.1 1.01.0
Side Side effecteffect
Number of Number of peoplepeople
Relative Relative freqfreq
Cumulative Cumulative freqfreq
MildMild 77 0.640.64 0.640.64
ModerateModerate 33 0.270.27 0.910.91
SevereSevere 11 0.090.09 1.001.00
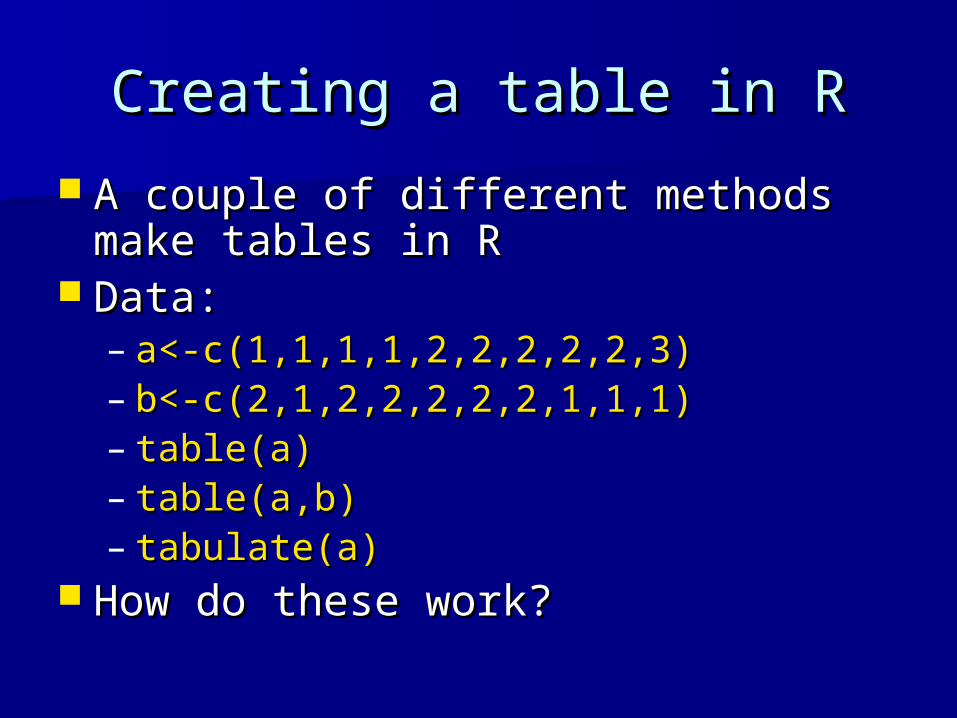
Creating a table in RCreating a table in R
A couple of different methods make A couple of different methods make tables in Rtables in R
Data:Data:– a<-c(1,1,1,1,2,2,2,2,2,3)a<-c(1,1,1,1,2,2,2,2,2,3)– b<-c(2,1,2,2,2,2,2,1,1,1)b<-c(2,1,2,2,2,2,2,1,1,1)– table(a)table(a)– table(a,b)table(a,b)– tabulate(a)tabulate(a)
How do these work?How do these work?
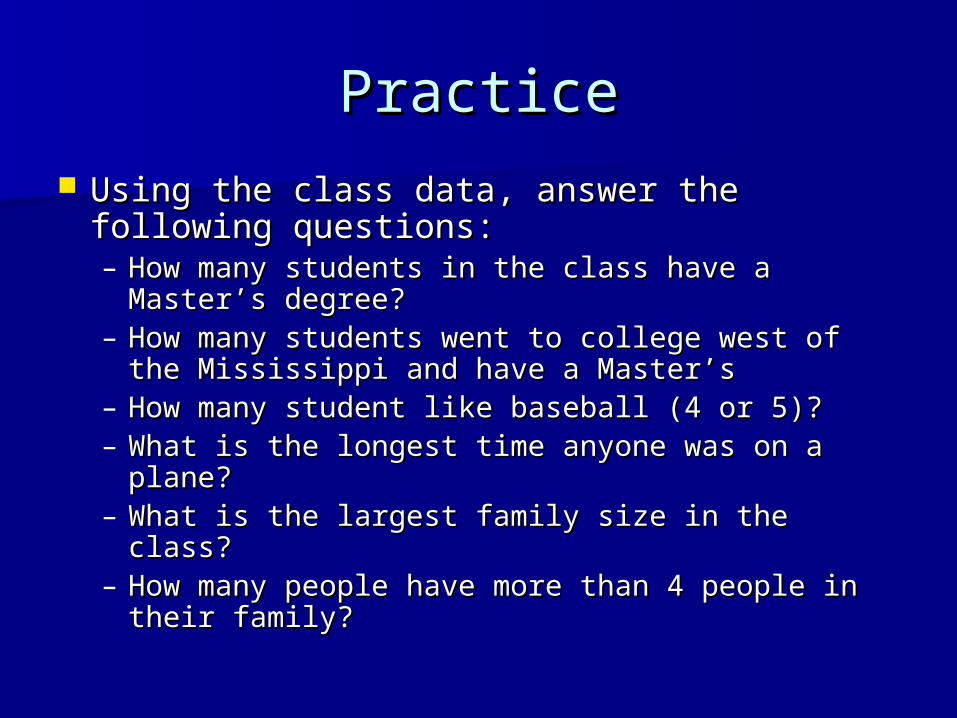
PracticePractice
Using the class data, answer the following Using the class data, answer the following questions:questions:– How many students in the class have a How many students in the class have a
Master’s degree?Master’s degree?– How many students went to college west of the How many students went to college west of the
Mississippi and have a Master’sMississippi and have a Master’s– How many student like baseball (4 or 5)?How many student like baseball (4 or 5)?– What is the longest time anyone was on a What is the longest time anyone was on a
plane?plane?– What is the largest family size in the class?What is the largest family size in the class?– How many people have more than 4 people in How many people have more than 4 people in
their family?their family?

Grouped dataGrouped data
Another time you use Another time you use frequency tables is frequency tables is when you collect when you collect sensitive data that sensitive data that people may not be people may not be willing to give you the willing to give you the exact values, but will exact values, but will provide a range, like provide a range, like income.income.
With data such as this, With data such as this, how could we find the how could we find the mean?mean?
IncomeIncome Number Number of peopleof people
$10,000-$10,000-$29,999$29,999
1515
$30,000-$30,000-$49,999$49,999
3535
$50,000-$50,000-$69,999$69,999
6060
Over Over $70,000$70,000
4444

Grouped meanGrouped mean
Since we do not have the specific data Since we do not have the specific data points, we cannot calculate the exact points, we cannot calculate the exact meanmean
We can use the groups to estimate the We can use the groups to estimate the mean using the grouped meanmean using the grouped mean
groups
jj
groups
jjj
n
mn
x
1
1
• where nj is the number of people in each group and mj is the midpoint of the group
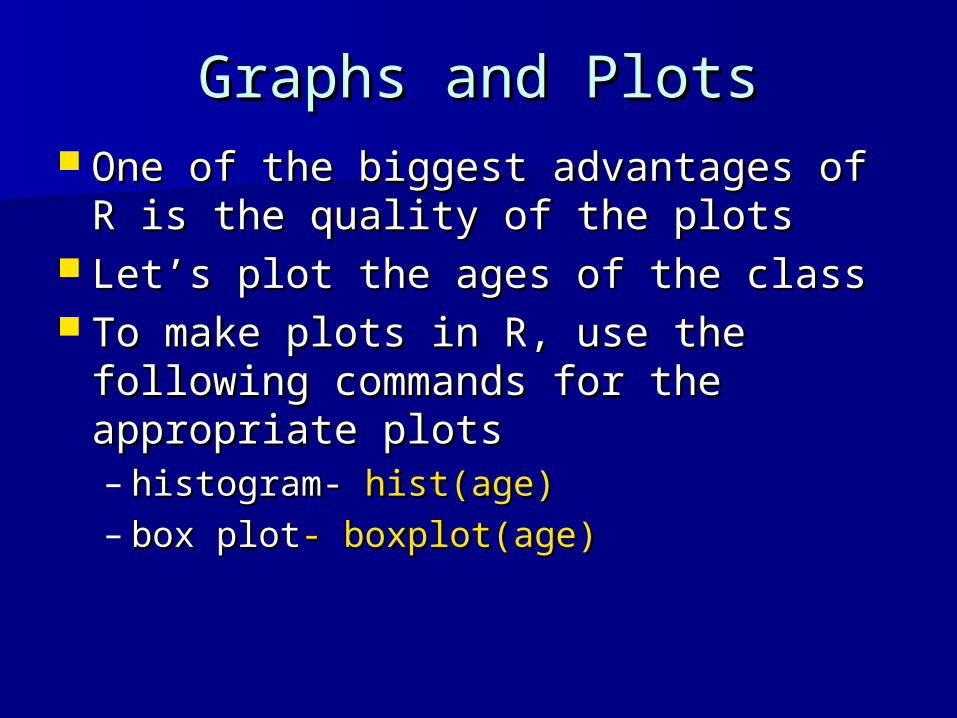
Graphs and PlotsGraphs and Plots One of the biggest advantages of R is One of the biggest advantages of R is
the quality of the plotsthe quality of the plots Let’s plot the ages of the classLet’s plot the ages of the class To make plots in R, use the following To make plots in R, use the following
commands for the appropriate plots commands for the appropriate plots – histogram- histogram- hist(age)hist(age)– box plotbox plot- boxplot(age)- boxplot(age)
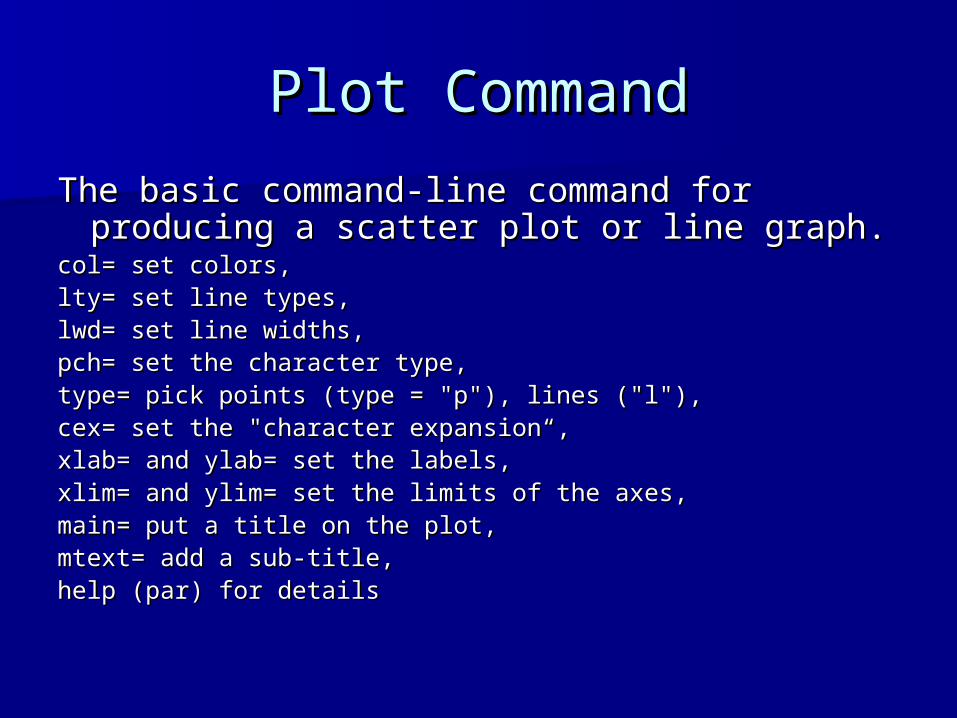
Plot CommandPlot Command
The basic command-line command for The basic command-line command for producing a scatter plot or line graph.producing a scatter plot or line graph.
col= set colors, col= set colors, lty= set line types, lty= set line types, lwd= set line widths, lwd= set line widths, pch= set the character type, pch= set the character type, type= pick points (type = "p"), lines ("l"), type= pick points (type = "p"), lines ("l"), cex= set the "character expansion“, cex= set the "character expansion“, xlab= and ylab= set the labels, xlab= and ylab= set the labels, xlim= and ylim= set the limits of the axes,xlim= and ylim= set the limits of the axes,main= put a title on the plot, main= put a title on the plot, mtext= add a sub-title,mtext= add a sub-title,help (par) for detailshelp (par) for details

One-Dimensional PlotsOne-Dimensional Plots
barplot(height) #simple form barplot(height) #simple form barplot(height, width, names, space=.2, barplot(height, width, names, space=.2,
inside=TRUE, beside=FALSE, horiz=FALSE, inside=TRUE, beside=FALSE, horiz=FALSE, legend, angle, density, col, blocks=TRUE) legend, angle, density, col, blocks=TRUE)
boxplot(..., range, width, varwidth=FALSE, boxplot(..., range, width, varwidth=FALSE, notch=FALSE, names, plot=TRUE) notch=FALSE, names, plot=TRUE)
hist(x, nclass, breaks, plot=TRUE, angle, hist(x, nclass, breaks, plot=TRUE, angle, density, col, inside) density, col, inside)
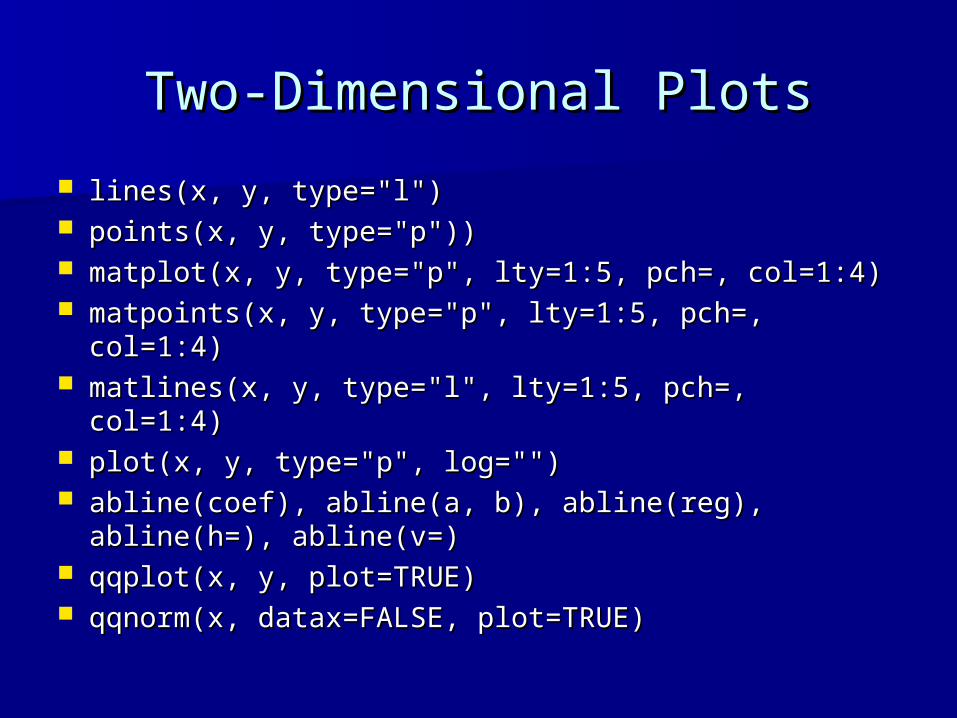
Two-Dimensional PlotsTwo-Dimensional Plots
lines(x, y, type="l") lines(x, y, type="l") points(x, y, type="p")) points(x, y, type="p")) matplot(x, y, type="p", lty=1:5, pch=, col=1:4) matplot(x, y, type="p", lty=1:5, pch=, col=1:4) matpoints(x, y, type="p", lty=1:5, pch=, col=1:4) matpoints(x, y, type="p", lty=1:5, pch=, col=1:4) matlines(x, y, type="l", lty=1:5, pch=, col=1:4) matlines(x, y, type="l", lty=1:5, pch=, col=1:4) plot(x, y, type="p", log="") plot(x, y, type="p", log="") abline(coef), abline(a, b), abline(reg), abline(h=), abline(coef), abline(a, b), abline(reg), abline(h=),
abline(v=) abline(v=) qqplot(x, y, plot=TRUE) qqplot(x, y, plot=TRUE) qqnorm(x, datax=FALSE, plot=TRUE) qqnorm(x, datax=FALSE, plot=TRUE)
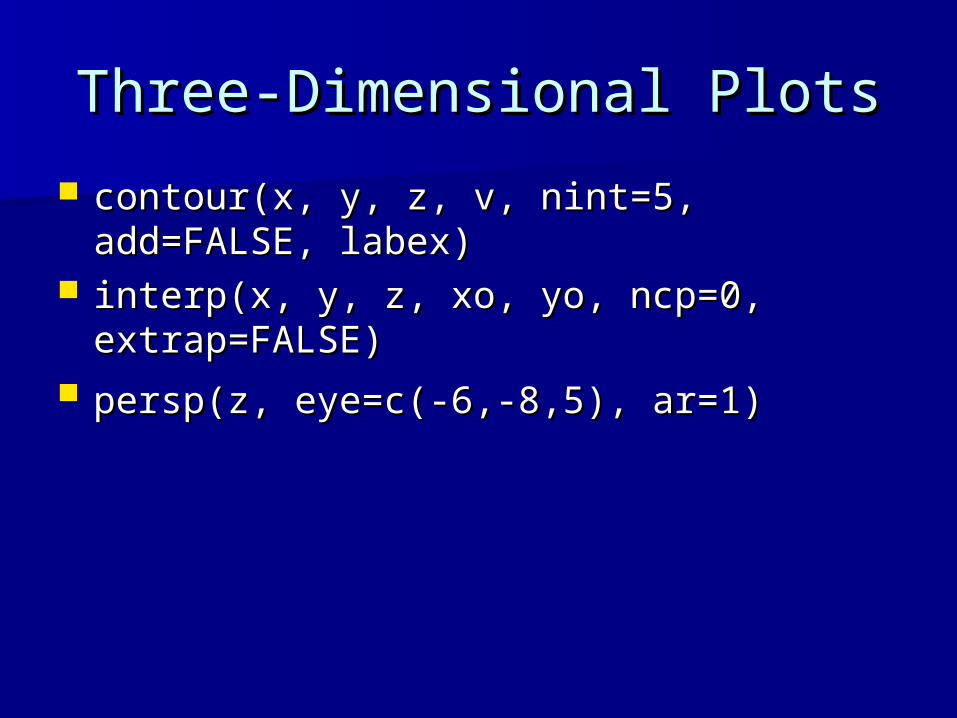
Three-Dimensional PlotsThree-Dimensional Plots
contour(x, y, z, v, nint=5, add=FALSE, contour(x, y, z, v, nint=5, add=FALSE, labex) labex)
interp(x, y, z, xo, yo, ncp=0, interp(x, y, z, xo, yo, ncp=0, extrap=FALSE) extrap=FALSE)
persp(z, eye=c(-6,-8,5), ar=1)persp(z, eye=c(-6,-8,5), ar=1)

Multiple Plots Per PageMultiple Plots Per Page
par(mfrow=c(nrow, ncol), oma=c(0, 0, 4, 0)) par(mfrow=c(nrow, ncol), oma=c(0, 0, 4, 0)) – mfrow=c(m,n) : subsequent figures will be drawn mfrow=c(m,n) : subsequent figures will be drawn
row-by-row in an m by n matrix on the page. row-by-row in an m by n matrix on the page. – oma=c(xbot,xlef,xtop,xrig):outer margin lines of oma=c(xbot,xlef,xtop,xrig):outer margin lines of
text. text. mtext(side=3, line=0, cex=2, outer=T, "This mtext(side=3, line=0, cex=2, outer=T, "This
is an Overall Title For the Page")is an Overall Title For the Page") Try this code on your ownTry this code on your own
– par(mfrow=c(2,1))par(mfrow=c(2,1))– hist(age)hist(age)– plot(class[,3],class[,4])plot(class[,3],class[,4])

Output to a postscript fileOutput to a postscript file
Often we want to output an R graph Often we want to output an R graph to a postscript file to place it into a to a postscript file to place it into a Latex file or other documentLatex file or other document
To do this, we use the following codeTo do this, we use the following code– postscript(“graph1.ps”)postscript(“graph1.ps”) – This opens a – This opens a
postscript file in the home directorypostscript file in the home directory– hist(age)hist(age) – This plots a graph into the – This plots a graph into the
filefile– dev.off()dev.off() – This closes the postscript file – This closes the postscript file
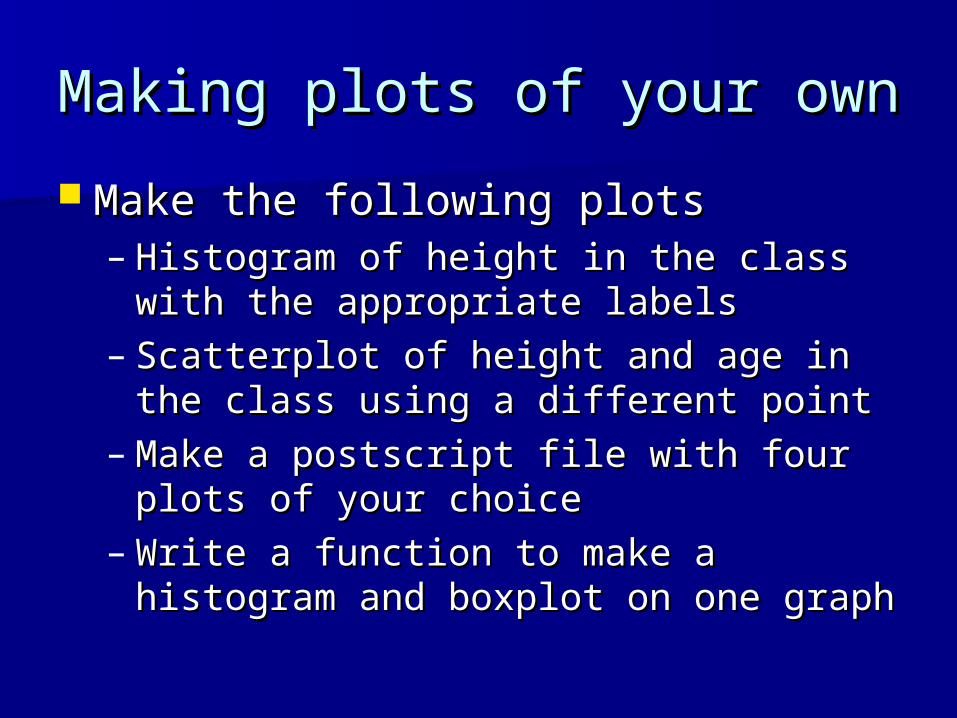
Making plots of your ownMaking plots of your own
Make the following plotsMake the following plots– Histogram of height in the class with the Histogram of height in the class with the
appropriate labelsappropriate labels– Scatterplot of height and age in the Scatterplot of height and age in the
class using a different pointclass using a different point– Make a postscript file with four plots of Make a postscript file with four plots of
your choiceyour choice– Write a function to make a histogram Write a function to make a histogram
and boxplot on one graphand boxplot on one graph
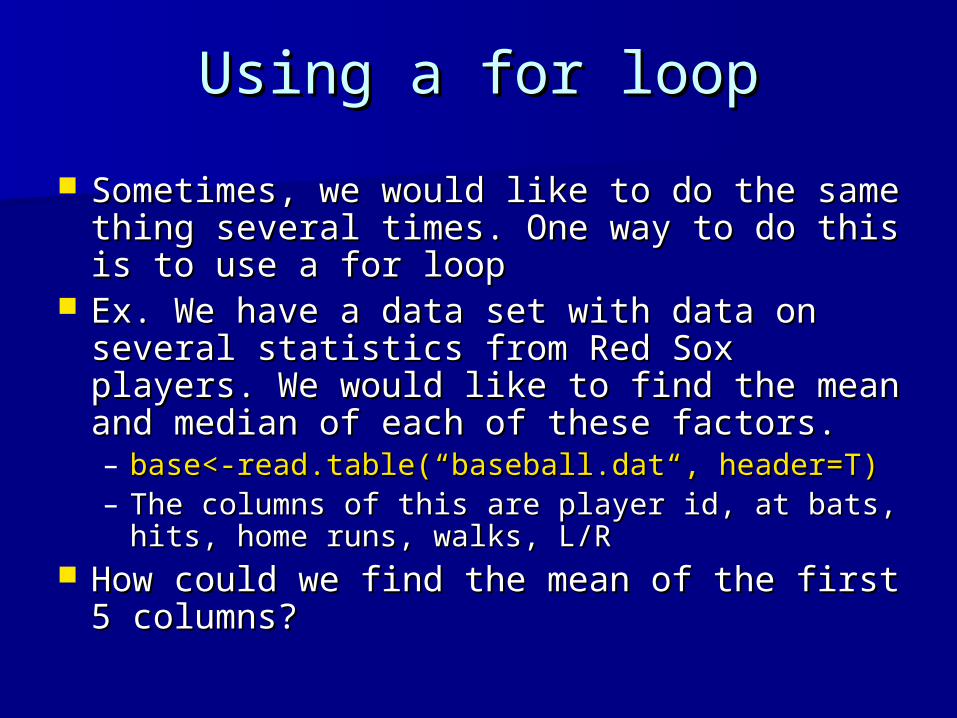
Using a for loopUsing a for loop
Sometimes, we would like to do the same Sometimes, we would like to do the same thing several times. One way to do this is thing several times. One way to do this is to use a for loopto use a for loop
Ex. We have a data set with data on Ex. We have a data set with data on several statistics from Red Sox players. several statistics from Red Sox players. We would like to find the mean and We would like to find the mean and median of each of these factors.median of each of these factors.– base<-read.table(“baseball.dat“, header=T)base<-read.table(“baseball.dat“, header=T)– The columns of this are player id, at bats, hits, The columns of this are player id, at bats, hits,
home runs, walks, L/Rhome runs, walks, L/R How could we find the mean of the first 5 How could we find the mean of the first 5
columns?columns?
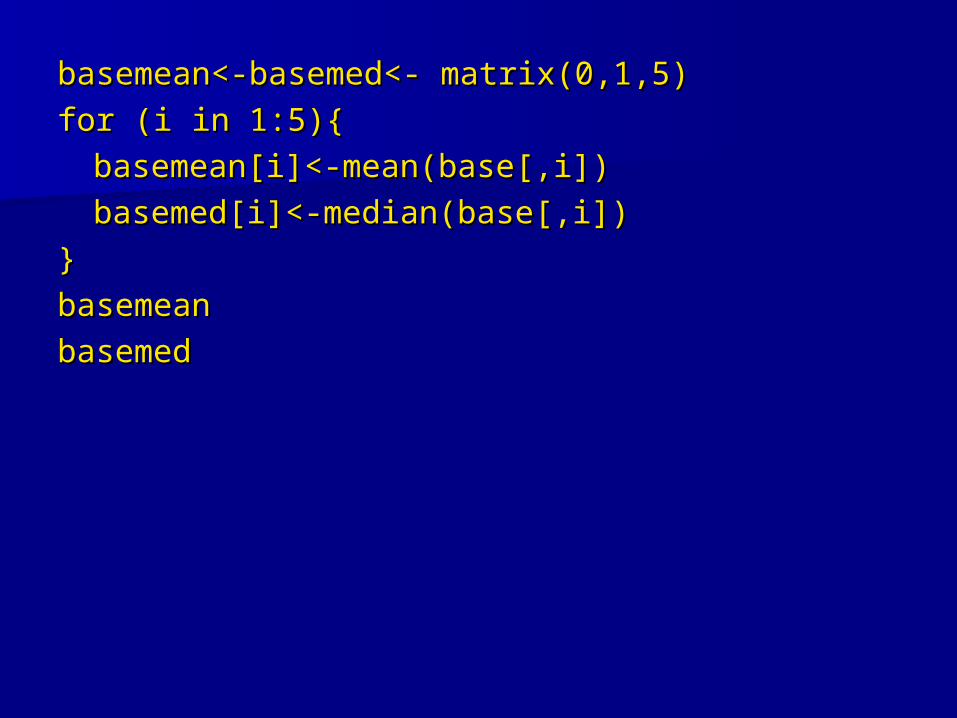
basemean<-basemed<- matrix(0,1,5)basemean<-basemed<- matrix(0,1,5)
for (i in 1:5){for (i in 1:5){
basemean[i]<-mean(base[,i])basemean[i]<-mean(base[,i])
basemed[i]<-median(base[,i])basemed[i]<-median(base[,i])
}}
basemeanbasemean
basemedbasemed
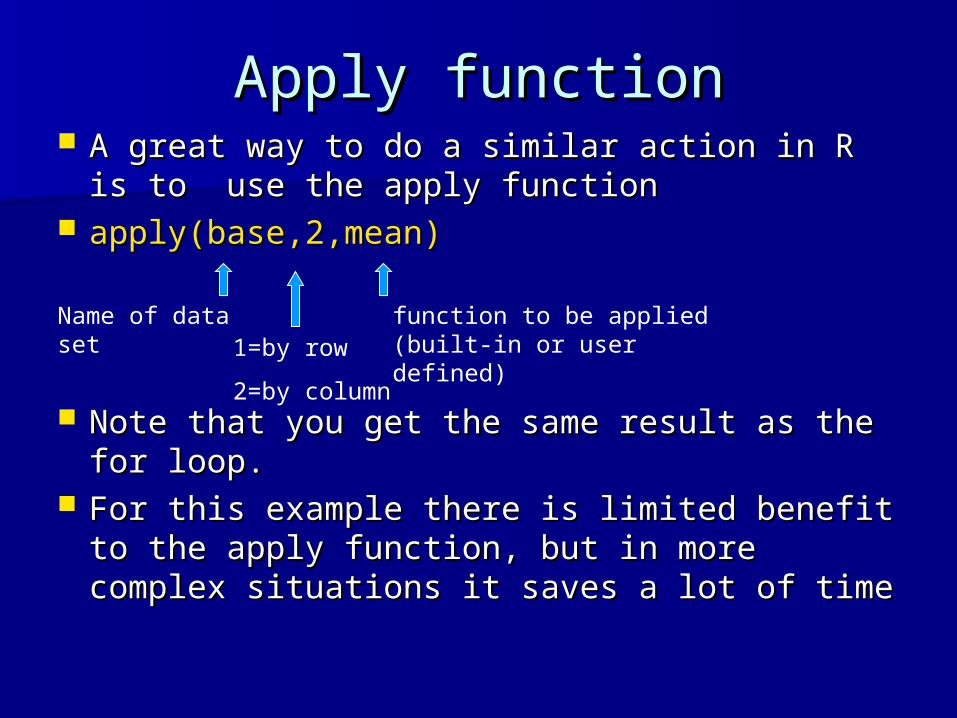
Apply functionApply function A great way to do a similar action in R is to A great way to do a similar action in R is to
use the apply functionuse the apply function apply(base,2,mean)apply(base,2,mean)
Note that you get the same result as the for Note that you get the same result as the for loop.loop.
For this example there is limited benefit to For this example there is limited benefit to the apply function, but in more complex the apply function, but in more complex situations it saves a lot of timesituations it saves a lot of time
Name of data set1=by row
2=by column
function to be applied (built-in or user defined)
Using conditionalsUsing conditionals
Now, we would like to find the total Now, we would like to find the total number of at bats and walks by left-number of at bats and walks by left-handed batters. Remember for left-handed batters. Remember for left-handed batters LH is 1.handed batters LH is 1.
We could do this using a for loop and We could do this using a for loop and if statements. Try this yourself.if statements. Try this yourself.
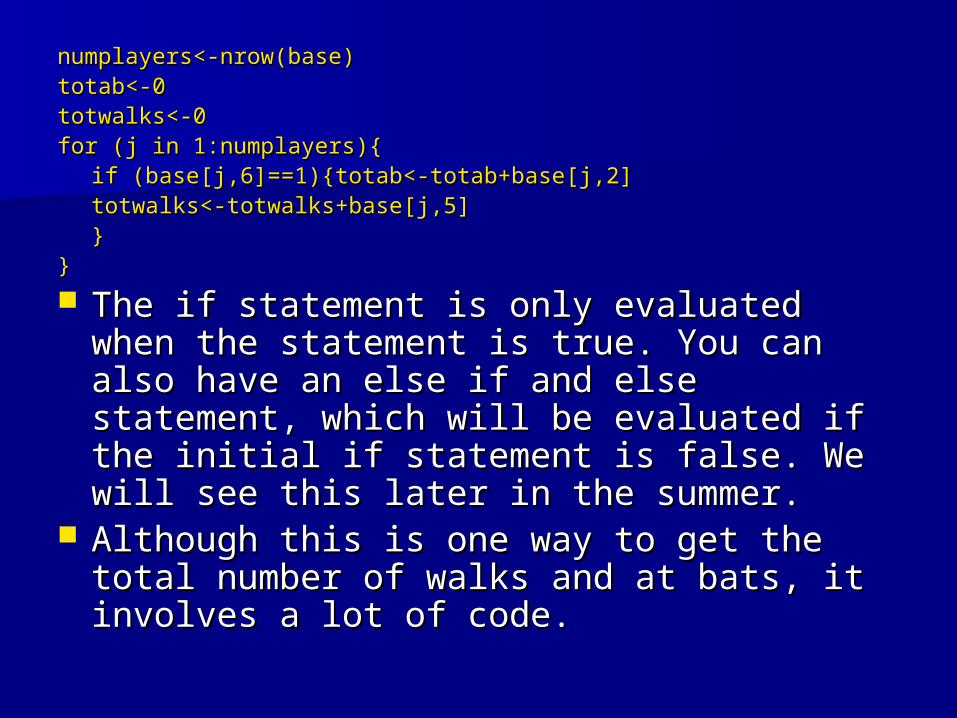
numplayers<-nrow(base)numplayers<-nrow(base)totab<-0totab<-0totwalks<-0totwalks<-0for (j in 1:numplayers){for (j in 1:numplayers){
if (base[j,6]==1){totab<-totab+base[j,2]if (base[j,6]==1){totab<-totab+base[j,2]totwalks<-totwalks+base[j,5]totwalks<-totwalks+base[j,5]
}}}}
The if statement is only evaluated when The if statement is only evaluated when the statement is true. You can also have the statement is true. You can also have an an else ifelse if and and elseelse statement, which will statement, which will be evaluated if the initial be evaluated if the initial ifif statement is statement is false. We will see this later in the summer.false. We will see this later in the summer.
Although this is one way to get the total Although this is one way to get the total number of walks and at bats, it involves a number of walks and at bats, it involves a lot of code. lot of code.
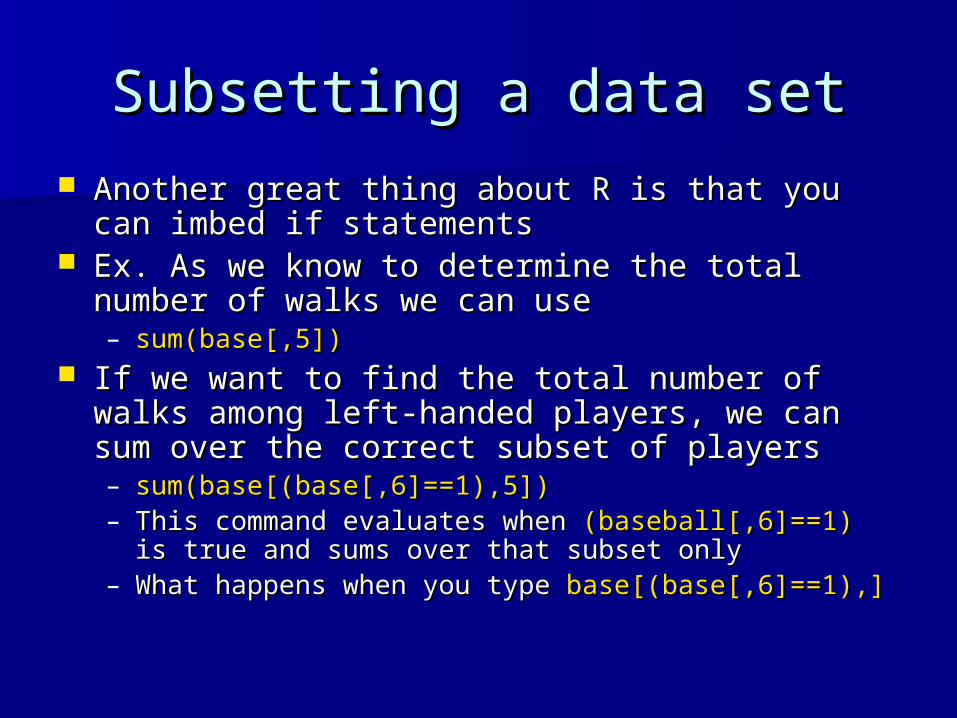
Subsetting a data setSubsetting a data set Another great thing about R is that you can Another great thing about R is that you can
imbed imbed ifif statements statements Ex. As we know to determine the total number of Ex. As we know to determine the total number of
walks we can usewalks we can use– sum(base[,5])sum(base[,5])
If we want to find the total number of walks If we want to find the total number of walks among left-handed players, we can sum over the among left-handed players, we can sum over the correct subset of playerscorrect subset of players– sum(base[(base[,6]==1),5])sum(base[(base[,6]==1),5])– This command evaluates when This command evaluates when (baseball[,6]==1)(baseball[,6]==1) is true is true
and sums over that subset onlyand sums over that subset only– What happens when you type What happens when you type base[(base[,6]==1),]base[(base[,6]==1),]
PracticePractice
Make a histogram of the hits by Make a histogram of the hits by batters with more than 400 at bats.batters with more than 400 at bats.
Find the minimum number of at bats Find the minimum number of at bats by a right-handed batterby a right-handed batter

More on R functionsMore on R functions Yesterday, we briefly mentioned that you Yesterday, we briefly mentioned that you
could write your own functions in R. This is could write your own functions in R. This is one of the most valuable aspects of R.one of the most valuable aspects of R.
Let’s look at this function. What does it do?Let’s look at this function. What does it do?fun<-function(x, y){fun<-function(x, y){
mx<-mean(x); maxx<-max(x)mx<-mean(x); maxx<-max(x)my<-mean(y); maxy<-max(y)my<-mean(y); maxy<-max(y)if (maxx>maxy){list(group=1, if (maxx>maxy){list(group=1,
mean=mx)}mean=mx)}else {list(group=2, mean=my)}else {list(group=2, mean=my)}
}}

pp<-c(2,3,3,3,2,10)pp<-c(2,3,3,3,2,10) ppp<-c(8,7,6,8,6,5,6,7,8,7,7,9)ppp<-c(8,7,6,8,6,5,6,7,8,7,7,9) fun(pp,ppp)fun(pp,ppp)$group$group[1] 1[1] 1
$mean$mean[1] 3.833333[1] 3.833333 Now, try to write functions to do the following Now, try to write functions to do the following
things.things.– Take a vector input and find the mean of all of the Take a vector input and find the mean of all of the
values except the minimum and maximumvalues except the minimum and maximum– Take a vector input and output a graph with a histogram Take a vector input and output a graph with a histogram
and boxplotand boxplot– Take a matrix input. Find the mean and median of each Take a matrix input. Find the mean and median of each
column. Output the mean, median and column number column. Output the mean, median and column number as a list for the column with the highest medianas a list for the column with the highest median

Possible answersPossible answers fun2<-function(x){fun2<-function(x){
s<-sum(x)-min(x)-max(x)s<-sum(x)-min(x)-max(x)n<-length(x)-2n<-length(x)-2list(mean=s/n)list(mean=s/n)
}} fun3<-function(x){fun3<-function(x){
par(mfrow=c(2,1))par(mfrow=c(2,1))hist(x); boxplot(x)hist(x); boxplot(x)
}} fun4<-function(x){fun4<-function(x){
meds<-apply(x,2,median)meds<-apply(x,2,median)mns<-apply(x,2,mean)mns<-apply(x,2,mean)n<-c(1:ncol(x))n<-c(1:ncol(x))maxmed<-max(meds)maxmed<-max(meds)nn<-n[(meds==maxmed)]nn<-n[(meds==maxmed)]list(column=nn, mean=mns[nn], median=meds[nn])list(column=nn, mean=mns[nn], median=meds[nn])
}}


