DESERT PAVEMENT MORPHOLOGY AND DYNAMICS, BIG BEND NATIONAL PARK, TEXAS A Thesis by COURTNEY MICHELLE HARMON Submitted to the Office of Graduate Studies of Texas A&M University in partial fulfillment of the requirements for the degree of MASTER OF SCIENCE December 2006 Major Subject: Geography
Transcript
DESERT PAVEMENT MORPHOLOGY AND DYNAMICS,
BIG BEND NATIONAL PARK, TEXAS
A Thesis
by
COURTNEY MICHELLE HARMON
Submitted to the Office of Graduate Studies of Texas A&M University
in partial fulfillment of the requirements for the degree of
MASTER OF SCIENCE
December 2006
Major Subject: Geography
DESERT PAVEMENT MORPHOLOGY AND DYNAMICS,
BIG BEND NATIONAL PARK, TEXAS
A Thesis
by
COURTNEY MICHELLE HARMON
Submitted to the Office of Graduate Studies of Texas A&M University
in partial fulfillment of the requirements for the degree of
MASTER OF SCIENCE
Approved by: Chair of Committee, Vatche P. Tchakerian Committee Members, Michael R. Waters Andrew Hajash, Jr. Head of Department, Douglas J. Sherman
December 2006
Major Subject: Geography
iii
ABSTRACT
Desert Pavement Morphology and Dynamics,
Big Bend National Park, Texas. (December 2006)
Courtney Michelle Harmon, B.S., Texas A&M University
Chair of Advisory Committee: Dr. Vatche P. Tchakerian
Desert pavements consist of a one- to two-layer thick surface armory of stones
overlying finer, virtually stone-free material which often adopts the appearance of a
meticulously tiled mosaic. They cover half of the arid land surface in North America and
are usually concentrated on low-sloping alluvial fans and desert piedmont surfaces.
McFadden et al. (1987) suggested the accretionary mantle model of desert pavement
formation, following research on pavements atop the Cima volcanic complex in the
Mojave Desert. However, the wide-spread applicability of this model to diverse
lithologies and geomorphic environments remains to be seen. No research has been
conducted on desert pavement at Big Bend National Park (BBNP), Texas, despite the
occurrence of well-developed pavements in the park and surrounding regions of the
Chihuahuan Desert. This research highlights three diverse desert pavement sites at
BBNP through a detailed geomorphic assessment including location of desert pavement
distribution, classification into surface mosaic units, examination of sediment and soil
characteristics, and determination of lithology of the pavement clasts.
At each BBNP study area, values for desert pavement clast size, sorting, and
percent ground cover were compared to the parameters set forth in Wood et al. (2002) to
iv
classify the desert pavements into surface mosaics based on degree of development.
Sediment analysis and soil profile photographs were used to characterize the surface
sediments and subsurface soil horizons. To determine geologic origin, dominant
lithologies of the pavement clasts were compared to outcrop and bedrock samples and to
published geologic maps of BBNP.
Desert pavements in this study differ significantly in surface texture, soil
characteristics, geologic origin, and degree of development compared to the typical
pavements of the Mojave Desert used in much of the fundamental research. Results
indicate that the desert pavements at BBNP may not have been derived from bedrock
and evolved in-situ, as suggested by the accretionary mantle model. Primarily, a
combination of fluvial processes and weathering appears more influential to desert
pavements in the semi-arid environment of BBNP. This study presents a new perspective
on desert pavement geomorphology in Big Bend National Park and serves as a baseline
for continued research.
v
ACKNOWLEDGEMENTS I extend great appreciation to:
Dr. Tchakerian for sparking my interest in this research and for being a constant source
of advice, guidance, and knowledge;
Dr. Hajash and Dr. Waters for their input and service on my committee;
The Department of Geography for encouraging my conference presentations,
professional development, and international excursions;
The National Park Service, Big Bend National Park, George Bush Presidential Library
Foundation, and the Texas A&M Soil Characterization Lab for funding and supporting
my field research;
Joni and Kirk for patiently teaching me GIS;
Paul for fun and fieldwork in Big Bend;
Jean for braving freezing temperatures and hungry javelina, and for being a tremendous
friend;
And finally, my Geography graduate student colleagues for camaraderie and countless
memories along the way.
vi
ABSTRACT………………………...……………………………………… ACKNOWLEDGEMENTS…………………..…………………….……… TABLE OF CONTENTS…………………………...……………………… LIST OF FIGURES………………..……………………………………..… LIST OF TABLES……………………………………………………….… INTRODUCTION……………………………………………………..........
2.1 General Description of Desert Pavements …………..……... 2.2 Geomorphology………………………….............................. 2.3 Disturbance and Recovery………...……………………....... 2.4 Desert Pavement Formation ……………………………….. 2.5 Desert Pavement Classification……..………………………
REGIONAL SETTING…………………………………...………………...
3.1 Geology and Geomorphology……………..…..…………… 3.2 Modern Climate…………………………………..…………
RESEARCH DESIGN AND METHODS………………………….……….
4.1 Study Areas………………………………....……………… 4.2 Field Sampling……………………………………………… 4.3 Determining Desert Pavement Classification………………. 4.4 Determining Geologic Composition………………………... 4.5 Determining Sediment and Soil Analysis…………………...
TABLE OF CONTENTSPage iii v vi viii x 1 1 3 5 6 6 7 8 10 16 19 19 22 27 27 31 32 32 33
vii
RESULTS……………………………………………………....…………...
5.1 Desert Pavement Classification ……………………………. 5.2 Geologic Composition……………………………………… 5.3 Sediment and Soil Analysis………………………………… 5.4 Vegetation and Slope………………………………………..
DISCUSSION……………………………………………..………………...
6.1 Desert Pavement Distribution in Big Bend National Park…. 6.2 Surface Mosaic Classification System……………………... 6.3 Geologic Composition of Desert Pavement………………... 6.4 Sediment and Soil Characteristics………………………….. 6.5 Evaluation of Accretionary Mantle Model…………………. 6.6 Comparison to Desert Pavements in the Mojave Desert……
1 Climate variations throughout Big Bend National Park………….. 2 Clast cover, clast size, and clast sorting for each sample site…….
3 Surface mosaic classification considering three parameters
individually and the resulting classification………………………
4 Geologic composition of desert pavement clasts………………… 5 Analysis of sediment 2 cm beneath desert pavement…………….. 6 Chemical composition of surface and subsurface sediments……..
7 Sediment analysis data from surface and subsurface samples……
LIST OF TABLES
Page 25 36 37 40 45 46 92
1
INTRODUCTION
1.1 Section Introduction
Desert pavements (a type of stone pavement) consist of a one- to two-layer thick
surface of armory stones overlying finer, virtually stone-free material which often
appears as a meticulously tiled mosaic (Fig. 1). They cover more than half of the arid
land surface in North America (Evenari, 1985), and are usually concentrated on low-
sloping alluvial fans and desert piedmont surfaces. Desert pavement plays a key role in
many arid land ecosystem processes including vegetation distribution, topography,
hydrology, and pedology (Cooke et al., 1993). Their vast distribution and noted
geomorphic influence in drylands justify desert pavements as a topic of particular
importance in desert research.
Most of the major studies on desert pavement geomorphology during the past
twenty years have taken place in the Mojave Desert of California (Wells et al., 1985;
McFadden et al., 1987; Anderson et al., 1994; Wood et al., 2002; 2005). Numerous
explanations have been offered for desert pavement formation including deflation,
fluvial processes, upward migration of stones, and concentration by weathering (Cooke
et al., 1993). Current literature favors the accretionary mantle model of desert pavement
formation, developed on basaltic rocks in the Cima volcanic field of the eastern Mojave
Desert in California (McFadden et al., 1987). However, the wide-spread applicability of
this model to diverse lithologies and geomorphic environments remains to be fully seen.
This thesis follows the style of Journal of Arid Environments.
2
Fig. 1. Landscape and close-up views of desert pavement, BBNP, Texas.
3
No major geomorphic studies on desert pavements have been conducted in the
Chihuahuan Desert of North America.
The Chihuahuan Desert is the largest desert in North America (518,000 km2)
with one-fourth located in western Texas and the remainder in northern Mexico (Laity,
2002). Big Bend National Park (BBNP) shown in Fig. 2 includes the largest protected
area of the Chihuahuan Desert in the United States, over 3,000 km2 (National Park
Service, 2006). Furthermore, the National Park Service (2006) has deemed BBNP one of
the least researched (and visited) of all the national parks in the United States. A
thorough literature review and consultation with park scientists reveals that no studies
have been conducted on desert pavement at BBNP, Texas, despite the occurrence of
well-developed pavements in the park and in the adjacent regions of the Chihuahuan
Desert.
1.2 Purpose Statement
The purpose of this thesis is to describe the morphology and dynamics of the
desert pavements in BBNP. Also, this study will evaluate the various hypotheses of
desert pavement formation in yet another geographic and geomorphic setting. This study
also serves as a baseline for continued studies on local desert pavement distribution,
anthropogenic disturbance and recovery, effect on geomorphic processes, and large-scale
surficial mapping projects at BBNP.
4
Fig. 2. Location of Big Bend National Park. The star marks the center of BBNP, which encompasses more than 3,000 km2 of the Chihuahuan Desert in western Texas, USA. (Modified from Tchakerian, 1997).
5
1.3 Objectives
The primary objectives of this study are to:
1) locate, describe, and classify the morphology of desert pavement fields. Detailed
textural description and surficial mapping will comprise the initial steps toward
understanding many aspects of desert pavement including its development, hydrologic
response, and role in the larger ecosystem (Higgitt and Allison, 1999; Wood et al.,
2002);
2) determine the lithology of the desert pavement clasts. Correlating the dominant
geologic composition of the pavement clasts with local lithology will establish the
source rock from which the pavement was likely derived;
3) describe the sediments and the subsurface soil horizons that lie immediately beneath
the desert pavement; and
4) evaluate the applicability of the accretionary mantle model of desert pavement
formation, developed in the Mojave Desert, to those of the Chihuahuan Desert at BBNP.
6
BACKGROUND
2.1 General Description of Desert Pavements
Desert pavements (stone pavements) consist of a one- to two-layer thick surface
of armory stones, ranging in size from boulders to fine gravels, overlying finer, virtually
stone-free material (Mabbutt, 1977). They are common in sparsely vegetated areas of
arid lands atop mantles of weathered debris, alluvial fans, and topographically level soil
surfaces on desert piedmonts, and have a millennial time scale of formation. On a well-
developed stone pavement, the clasts can touch and even overlap neighboring clasts to
form the appearance of a meticulously tiled mosaic, and the individual stones are
sometimes covered in rock varnish (Cooke and Warren, 1973). Without identifying
desert pavement by name, Hume (1925, p 62) described the Egyptian Desert as “a plain
of bare rock fragments shimmering in the sunlight.”
Stone pavements in the southwestern United States are commonly referred to as
desert pavements, a term specific to North America which is used to describe very
smooth, flat, pebble-sized pavements that develop on the lower sections of alluvial fan
surfaces. This study will use the term desert pavement. Like many other geomorphic
features, stone pavements have taken on several local names throughout the world, such
as stony mantles or gibber plains in Australia, hammada or reg in North Africa and the
Middle East, and gobis in central Asia (Mabbutt, 1977; Tchakerian, 1999b).
7
2.2 Geomorphology
Desert pavements play an integral role in many arid land ecosystem processes.
The coarse layer of stones that mantles the surface is an erosional barrier that promotes
surface stability much like vegetation does, and protects the desert soil horizons below.
Desert pavements act as a storage area for aeolian sediments (both dust and sand) in
transit, and also impact desert surface overland flow and infiltration by increasing runoff
and decreasing infiltration in areas of well-developed desert pavements. Because desert
pavements recover slowly after being disturbed, they preserve a long record of the
processes that have been acting upon the surface. They are particularly susceptible to
destruction by human impact and off-road vehicles which remove the protective
armoring, leaving the newly exposed soil susceptible to accelerated wind and water
erosion (Cooke et al., 1993; Tchakerian, 1999b).
Al-Farraj and Harvey (2000) used morphological differences in desert pavement
to correlate terraces and alluvial fans in Oman and U.A.E. and to estimate their relative
ages. Using a simple index of desert pavement development – including clast fracturing
and angularity, size, sorting, packing, and surface texture – the limestone clasts of these
desert pavements were classified. The authors found that the weakly-developed
pavements were located atop the youngest terrace and fan surfaces, while the well-
developed pavements corresponded to the highest terraces and oldest fan surfaces.
Haff (2001) suggests that desert pavement holds an even more important role as
an indicator of subtle environmental changes, which he refers to as an ‘environmental
canary.’ Pavement stones are often only loosely cemented to the underlying matrix or to
8
each other, and a simple footstep can dislodge them. The longevity of these surfaces is
dependent upon a stable local environment away from disruptive anthropogenic forces.
Therefore, an abundance of newly overturned varnished pavement clasts, as observed by
Haff in Death Valley National Park, may provide evidence for recent environmental
changes in deserts. Haff (2001) concludes that the high number of overturned stones in
Death Valley National Park is rare on the millennial time scale of desert pavement
formation, and this phenomena is largely the result of increased animal traffic and
foraging and heightened bioturbation of vegetation in response to recent intense El Niño
precipitation. Studying the response of desert pavements to climatic and biologic
perturbations could shed light on the role of desert pavement surfaces as indicators of
broader environmental change.
Rock coatings cover many bare rock desert surfaces, and their presence infers
long-term stability (Watson and Nash, 1997). The three most common coatings are rock
varnish, silica glaze, and iron films. Rock varnish is a thin (less than 100 μm) chemical
deposit containing clay minerals, manganese, and iron oxide that darkens the surface of
some desert rocks (Dorn, 2004). Although controversial, rock varnish has been used for
relative and absolute dating of desert surfaces.
2.3 Disturbance and Recovery
Although desert pavements are often regarded as stable geomorphic landforms,
their surfaces have dynamic, not static, stability, punctuated by periods of disturbance
and recovery (Haff and Werner, 1996). Numerous studies have investigated the impacts
9
of military maneuvers on desert pavement surfaces, most notably by Belnap and Warren
(2002), El-Baz (1992), and Kade and Warren (2002). El-Baz (1992) concluded that
desert pavement disruption in Kuwait, as a result of Gulf War I military maneuvers,
exposed the desert soil beneath pavements to wind and soil erosion for many centuries to
come.
Additionally, a study by Belnap and Warren (2002) showed that, 55 years after
desert pavement disturbance by General George S. Patton’s military vehicles during
training operations, the impact was still visible especially in areas of mature pavements
in the Mojave Desert. Kade and Warren (2002) also point out that tent-city construction
and the foot traffic on military training base camps had also destroyed pavements in the
Sonoran Desert, leaving scars long after the military camp was abandoned in 1944.
Haff and Werner (1996) attempted to quantify the response of desert pavement to
a disturbance. In a five-year field experiment in Panamint Valley, California, clasts were
removed from the desert pavement surface in square plots to reveal the soil layer below
in an effort to study the processes and rate of desert pavement recovery. In studying the
resurfacing process, Haff and Werner found that gaps caused by the removal of tiny
stones had completely healed in five years. The authors, therefore, concluded that the
larger the disturbance area of desert pavement, the slower the rate at which it will
recover. The recovery rate of desert pavements is, however, a function of several factors
including the availability of stones, the magnitude and variety of mobilizing forces, and
the microtopography of the surface.
10
In general, the stones which mobilized to infill the disturbed area were smaller
than the clasts that made up the original pavement surface, and stones of greater than
1cm remained in the same location over the five-year period. First-hand observations of
clast motions are often spotty and unrepresentative, and there was no evidence of any
clast-moving forces to a degree significant enough to mobilize the clasts needed to infill
the cleared plots. Therefore, the authors did not offer an exact recovery process for this
study site, but concluded that small stones appear to be re-emplaced from one dominant
direction, indicating that a uni-directional process must be responsible for the recovery.
2.4 Desert Pavement Formation
The precise mechanism for desert pavement formation remains a controversial
topic, as several hypotheses exist regarding their formation. These include: a) the
deflation of fine sediments by wind, b) the removal of fines by fluvial action, c) the
upward migration of stones, d) concentration by subsurface weathering, and e) surface-
derived desert pavement clasts rising vertically on an accreting mantle of soil (Cooke,
1970; Mabbutt, 1977; McFadden et al., 1987; Tchakerian, 1999b). In all cases, the
formation and preservation of desert pavement is contingent on the abandonment of the
surface when it becomes isolated from the surrounding area by incision or diversion of
overland flow elsewhere.
11
2.4.1 Deflation
The deflation hypothesis suggests that a heterogeneous mixture of clay- to
cobble-sized sediments is acted upon by the wind, the latter removing the fine sand and
dust particles. The coarse materials are left behind and concentrate to form a lag deposit
that mantles the surface of the desert floor (Cooke and Warren, 1973). Deflation alone,
however, cannot account for the existence of many desert pavements with subsurface
soil layers and the virtually stone-free underlying materials (Cooke et al., 1993).
2.4.2 Fluvial Action
Still other literature suggests that water is the dominant force in desert pavement
formation (Lowdermilk and Sudling, 1950). This occurs either by surface runoff
washing finer textured soils off desert slopes, or by high-intensity desert precipitation
events which produce raindrops that impact and dislodge the finer sediments on the
surface. Similar to deflation, fine sediments are removed by water, leaving behind the
coarse stones to form a desert pavement. Sharon (1962) demonstrated the importance of
surface runoff at pavement sites in Israel, and Cooke et al. (1993) noted fluvial erosion at
various sites throughout California.
2.4.3 Upward Migration
The concentration of coarse clasts at the surface and the distinct lack of similarly
sized particles below lead to the hypothesis that the stones originated below the surface
and migrated upward (Springer, 1958). Jessup (1960) observed the migration of coarse
12
particles following twenty-two repeated wet/dry cycles in laboratory experiments. This
hypothesis is undermined, however, by the fact that few stones are actually observed in
transition upward in field experiments.
2.4.4 Concentration by Subsurface Weathering
Stones embedded in moist soil are more susceptible to weathering (mechanical,
chemical, and biological weathering) than stones at the surface, therefore surface
pavement clasts may survive above soils containing little stone (Mabbutt, 1977). Fan
terraces in eastern Sinai Desert, Egypt exhibit this phenomenon, as granitic desert
pavement clasts concentrate atop grus formed by simultaneous weathering of granite
boulders below the surface. This process is more common in moist desert environments,
since water accelerates weathering processes.
2.4.5 Accretionary Mantle Model
Based on work in central Australia, Mabbutt (1977) suggested that desert
pavements result from processes of cumulic pedogenesis, upward sorting of clasts
through a fine textured soil mantle. McFadden et al. (1987), working on desert
pavements atop the Cima volcanic complex (a 560,000 year old basalt field in the
eastern Mojave Desert, California), were the first to provide field-based evidence that
desert pavements are created at the land surface and remain there through aeolian
deposition and concurrent development of soils underneath the pavement (Fig. 3).
Similarly to Mabbutt (1977), McFadden et al. proposed that the deposited pavement
13
Fig. 3. Desert pavement at Cima Volcanic Field, Mojave Desert. (Top) Soil pit beneath desert pavement exposing vesicular horizon and aeolian mantle. (Bottom) Landscape view of basaltic desert pavement. Photos taken in 1998 by V.P. Tchakerian.
14
clasts rise upward on a vertically accreting soil mantle through a process termed the
accretionary mantle model, as shown in Fig. 4.
McFadden et al. (1987) suggested the seminal processes for pavement formation
and surface evolution. First, clasts are derived in situ from basaltic bedrock from
topographically high areas that are mechanically weathered. This weathering process
leads to the formation of a rubble layer that fills in topographically low areas, thus
smoothing out the surface and creating a layer of armored stones atop the parent
bedrock. Second, soil is concurrently developed beneath the pavement, causing the clasts
to rise vertically (Anderson et al., 1994). Windblown dust from nearby playas and dunes
accumulates on the desert floor and becomes incorporated into the subsurface vesicular
soil horizon, which is rich in aeolian silt and clay and has a columnar structure (Wells, et
al., 1998). The seasonal changes of this soil layer, particularly the upward doming of ped
tops and vertical displacement of the overlying clasts in the summer, and their
subsequent collapse during the winter, constantly maintains the pavement clasts on the
surface while soil layers develop and thicken underneath.
Wells et al. (1995) supported this model by comparing in-situ cosmogenic 3He
exposure ages of pavement clasts to the bedrock source exposure age. Their results
showed similarity in age between un-eroded bedrock and pavement beginning to form
nearby, and age correlation between several desert pavement fields and their underlying
basalt flows. This field evidence from the Cima Volcanic Field supports the born-at-the-
surface desert pavements depicted in the accretionary mantle model.
15
Fig. 4. Accretionary mantle model of desert pavement formation as first proposed by McFadden et al. (1987). Image from Tchakerian (1999a).
16
It is very likely that a combination of the above processes is required for desert
pavement formation. In particular, Dixon (1994) notes that clast source is central to the
understanding of desert pavement development, and that there are two principal sources:
clasts disintegrated from bedrock and fluvially deposited clasts. Recently, Williams and
Zimbelman (1994) made the case for sheetflood being the primary process for the
emplacement of pavement clasts, since a young, well-developed desert pavement was
observed immediately overlying bare rock on the Pisgah basalt flow in the Mojave
Desert, California. The authors suggest that the deposition by sheetflow could represent
an initial substage of the accretionary model where overland flow of water was
responsible for the initial creation of the desert pavement, and a vesicular soil horizon
subsequently formed beneath it, rather than the pavement and soil horizon coevolving.
2.5 Desert Pavement Classification
A desert pavement classification system was developed by Wood et al. (2002) on
the Cima volcanic field in the eastern Mojave Desert, California based on such textural
parameters as percent ground cover, clast size, and sorting. Three distinct surface mosaic
types of bare ground (BG1, BG2, BG3) and three desert pavement mosaic types (DP1,
DP2, DP3) were identified as shown in Fig. 5, and each desert pavement mosaic was
determined to be “unique, precise, and consistent across space” (Wood et al., 2002, p.
314). Although several sedimentological and surface characteristics were considered,
desert pavement mosaics were primarily differentiated from bare ground as having more
than 65% of the ground covered by clasts.
17
Fig. 5. Desert pavement classification system. Examples of the three defined desert pavement surface mosaics (DP1, DP2, DP3) and three bare ground surface mosaics (BG1, BG2, BG3) as classified by Wood et al., (2002). Plan view photos show desert pavement from the Cima Volcanic Field in the eastern Mojave Desert, with a 50cm field of view (Wood, 2002).
18
The above study in the Mojave Desert concluded that DP1 has successively more
ground cover, better sorting, and smaller clasts than DP2 or DP3. Areas of desert
pavement labeled as DP1 were limited in distribution, while DP2 was found more
widely throughout the pavement field, and DP3 covered about half of the study site. The
authors suggest that the textural variations may result from differences in their
formation, with DP1 possibly indicating a regenerative surface that has been covered by
gravels and DP2 forming according to the accretionary mantle model. Textural
differences among desert pavements seen during the authors’ field reconnaissance in
other arid lands suggest that this surface mosaic type classification may be effective
when applied to diverse geomorphic surfaces.
Further studies by Wood et al. (2005) suggest that these distinct surface mosaics
could also correspond to fundamental characteristics of vegetation and soil morphology
in the desert pavement areas. DP2 and DP3 are characterized by less than 5% shrub
cover, with DP1 exhibiting no vegetation cover. Depth of leaching and concentration of
soluble salts becomes shallower with increasing degree of clast cover. Vesicular soil
horizons are present in all DP mosaics, but range in thickness from 6 cm beneath DP1 to
less than 2 cm at DP3. Argillic soil horizons and gypsum are typically found below
vesicular soils in all three DP mosaics.
19
REGIONAL SETTING
3.1 Geology and Geomorphology
BBNP, Texas comprises approximately 3250 km2 of federal lands managed by
the National Park Service and is located about 425 km southeast of El Paso, Texas and
450 km west of San Antonio, Texas. This park was named after the curve, or “big bend,”
in the Rio Grande River that delineates the boundary between Texas and Mexico and
also marks the southern extent of BBNP. Positioned along the eastern edge of the Basin
and Range Province, BBNP lies at the junction of two major mountain ranges, the Rocky
Mountains and the now-buried Ouachita Mountains. Big Bend National Park is situated
at the heart of the Chihuahuan Desert, an area that covers 32% of the North American
arid region (Tchakerian, 1997).
The following geologic narrative is based primarily on the work of Maxwell,
1966; 1968; and Maxwell et al., 1967. The diverse geologic history of the Big Bend
region is reflected in its stratigrafic column (Fig. 6). During the Paleozoic, a deep-sea
trough extended through the Big Bend area, which accumulated sediments eroded from
the highlands. These sand, gravel, and clay deposits of the late Paleozoic are still visible
at the surface in the northern portion of the park. The Ouachita orogeny of the
Pennsylvanian Period deformed the sedimentary rocks of the Ouachita System, which
are exposed in BBNP, and initiated a grand period of denudation which formed thick
beds of Mesozoic sandstones, shales, and limestones. Then, a warm, shallow sea of the
Cretaceous Period deposited limestone and mudstone layers throughout the region, and
20
Fig. 6. Stratigraphic column of geology in Big Bend National Park. (Nelson, 1992)
21
sandstones and siltstones were left behind as the sea retreated to its present position. The
Laramide orogeny during the late Cretaceous was the second major orogeny to affect
BBNP, leading to the formation of the Mariscal Mountains of BBNP, the most southern
extension of the Rocky Mountains in the United States. A discontinuous series of
Tertiary volcanic activity during the Eocene and Oligocene Periods formed the Chisos
Mountains, caused lava to flow west and southwest of the Chisos Mountains, and left
behind numerous igneous intrusions and layers of tephra. Throughout the Quaternary,
weathering and erosion has left behind thick alluvial and colluvial deposits including
approximately one-fourth of the park (Maxwell et al., 1967).
The present geomorphic setting of BBNP, shown in Appendix A, is largely the
result of Cenozoic deformation and subsequent weathering, erosion and fluvial activity,
combined with volcanism associated with the formation of the Basin and Range
Province (Tchakerian, 1997). The oldest rocks in BBNP are exposed on the park’s north
side near Persimmon Gap, where Paleozoic rocks of the Ouachita system were thrust
over Cretaceous limestones. The Chisos Mountains, at Big Bend’s center, are the
product of extrusive lava flows, breccias, and rhyolites which overlie the intrusive
igneous mass that forms the base of the mountains. Geomorphologically, the entire
central portion of the park, including the Chisos Mountains, is a down-dropped block
(graben), the result of extensional faulting in the late Tertiary, and a classic example of
the basin and range topography evidenced throughout much of the southwestern United
States. BBNP’s southeastern side is dominated by exposed Cretaceous sedimentary
22
rocks and alluvial fan deposits sloping away from the Chisos Mountains. The Rio
Grande River cuts through a thick section of the Santa Elena limestone at Boquillas
Canyon. Aeolian deposits, mostly in the forms of climbing dunes, are also located in the
southeast section of BBNP. The western part of BBNP (the focus of this study) has been
mapped as Quaternary surficial deposits of alluvium or gravel and silt. Volcanics of the
Chisos formation including ashbeds, tuffaceous clays and sandstones, basaltic and
rhyolitic lavas, and igneous intrusions are also evidenced in this area. Badlands are
found along Old Maverick Road where Cretaceous clay beds have been eroded by the
Alamo Wash, Javelina Wash, and Dawson Creek (Spearing, 1991).
The USGS (2004) is currently undertaking the re-mapping and production of a
digitized geologic map of BBNP to replace Maxwell’s outdated 1967 version. Large
unmapped areas of Quaternary surficial deposits are serious gaps in knowledge, and the
USGS hopes that detailed mapping of these surficial deposits (including desert
pavements) will lead to a better understanding of the Quaternary geologic history of
BBNP.
3.2 Modern Climate
The aridity of the Chihuahuan Desert is attributed to the rainshadow effect of the
Sierra Madre Occidental and Sierra Madre Oriental mountain ranges, the subtropical
high and continentality (Tchakerian, 1997). Five National Climatic Data Center weather
stations are scattered throughout BBNP (Fig. 7). The mean annual precipitation in the
Big Bend National Park is about 400 mm (15 in), which falls mainly during the summer
23
0 10 Kilometers
Albers Equal Area
Persimmon Gap
Panther Junction
Boquillas Ranger Station
Chisos Basin
Castolon
TEXAS
0 100 Kilometers
Albers Equal Area
Big Bend NPTEXAS
Fig. 7. Location of weather stations in Big Bend National Park (Image adapted from Herbert, 2004).
24
monsoon season. As Table 1 shows, however, the precipitation and temperature values
vary greatly throughout the park because of elevation, with the high Chisos mountains
experiencing considerably more precipitation and cooler temperatures than the adjacent
desert piedmonts and the Rio Grande floodplains. The Castolon and Panther Junction
weather stations (Fig. 8), located nearest the desert pavement study areas, are indicative
of a BWh (dry and arid with hot summers) Köppen climate classification (Herbert,
2004).
25
Table 1. Climate variations throughout Big Bend National Park. Temperature and precipitation values reported in Herbert (2004) Station Name Cooperative
Station Identifier
Elevation (m)
Mean July temperature
(°C)
Mean Jan. temperature
(°C)
Mean annual precip. (mm)
Boquillas Ranger Station
410950 566.3 30.4 9.2 251
Castolon
411524 661.1 31.2 10.4 249
Persimmon Gap
416959 873.3 29.1 9.3 236
Panther Junction
416792 1140.0 27.3 9.4 362
Chisos Basin
411715 1615.4 23.4 8.3 487
26
0.0
10.0
20.0
30.0
40.0
JAN FEB MAR APR MAY JUN JUL AUG SEP OCT NOV DEC0
10
20
30
40
50
60
70
80
90
100
Fig. 8. Climographs for Castolon and Panther Junction weather stations. Castolon (top) is located ~15 km from study area 1 and study area 2. Panther Junction (bottom) is located ~5 km from study area 3. Temperatures are in oC (line, left axis) and precipitation in mm (bars, right axis). Data from 1971-2000 National Climatic Data Center climate normals (Herbert, 2004).
0.0
10.0
20.0
30.0
40.0
JAN FEB MAR APR MAY JUN JUL AUG SEP OCT NOV DEC0
10
20
30
40
50
60
70
80
90
100
27
RESEARCH DESIGN AND METHODS
4.1 Study Areas
The mapping of desert pavement distribution was accomplished following
consultation with park scientists, analysis of geologic maps and digital imagery, and
field reconnaissance. The most well-developed desert pavements were found to be on
abandoned alluvial apron surfaces in the western section of BBNP. From this section,
three desert pavement study areas (Fig. 9) representing the diversity of desert pavements
in the park were selected for detailed geomorphological analysis: Study Area 1 off Old
Maverick Road, Study Area 2 off Ross Maxwell Scenic Drive, and Study Area 3 off
Croton Springs Road.
Each area is visually distinct and situated in a different geomorphic setting (Fig.
10 and Fig. 11). The desert pavement at Study Area 1 has more rounded clasts, sparse
vegetation, and is located near the badlands formed by the Alamo and Javelina Washes.
The desert pavement at Study Area 2 contains poorly sorted angular clasts and is
surrounded by intrusive igneous formations and other volcanic deposits. Study Area 3
exhibits a steeper slope, is more densely vegetated than the other two sites, and has
weathered, mosaiced clasts.
For each study area, nine 1m2 sample sites of desert pavement spaced 15 meters
apart along three parallel transects were selected and their GPS locations recorded using
a handheld Garmin device. Where vegetation prevented placing the 1m2 grid directly on
the pavement, the grid was relocated immediately next to the plant. For simplicity, the
28
Study Area 3
Study Area 1
Study Area 2
TEXAS
Big Bend NP
TEXAS
Fig. 9. BBNP map showing three desert pavement study areas. The western section of the park was determined to be optimal for desert pavement development. Image modified from National Park Service (2006).
29
Fig. 10. Landscape views of desert pavement study areas. (Top) Study Area 1 off Old Maverick Road (Center) Study Area 2 off Ross Maxwell Scenic Drive (Bottom) Study Area 3 off Croton Springs Road
30
Fig. 11. Close-up views of desert pavement study areas. (Top) Study Area 1 off Old Maverick Road (Center) Study Area 2 off Ross Maxwell Scenic Drive (Bottom) Study Area 3 off Croton Springs Road
31
sample sites will be referred to by their site number, with a dash separating the Study
Area number from the sample site number (e.g. sample site 2-8 is the 8th sample site at
Study Area 2, off Ross Maxwell Scenic Drive). In order to accomplish the four
objectives outlined earlier, the following field and laboratory methods were conducted.
4.2 Field Sampling
At each sample site, two digital photographs were taken for later analysis: one of
the ground cover, and one with a 1 m2 grid with string intersections placed at 10 cm
intervals. Appendix B contains sample site photographs from Study Areas 1, 2, and 3.
Using a list of ten randomly generated numbers, the surface clasts (≥ 4 mm in diameter)
located nearest each corresponding numbered grid intersection were collected. After
removing all surface clasts from a 10 cm2 area, a 100 gm sediment sample was taken
from the top 2 cm immediately beneath the desert pavement. At three sample sites in
each study area, a 10 cm deep soil cross-section was dug, photographed, and described ─
taking care to note vesicular horizon depth and degree of development, depth to argillic
horizon, and character of other visible subsoils. In addition, a 100 gm soil sample was
collected at 10 cm depth from one randomly selected sample site within each study area
(1-5, 2-4, and 3-7). After completing the field sampling, geologic handsamples were
collected from surrounding outcrops, and the direction and percent slope of the desert
pavement study area, the relative abundance of vegetation types, and the approximate
degree of vegetative cover were recorded. This procedure was repeated at all three study
areas.
32
4.3 Determining Desert Pavement Classification
For each sample site, clast diameter along the b-axis was recorded for the 81
surface clasts nearest the string intersections (9 x 9) on the gridded photographs using
the measuring tapes in the photos. Following procedures outlined in Wood et al., (2002),
clast size was recorded to the nearest millimeter, and only clasts greater than 4 mm along
the b-axis were considered as surface clasts for size analysis. Mean, median, mode,
maximum and minimum clast sizes were calculated for each sample site. Sorting of the
desert pavement surface clasts was determined from the standard deviation of the clast
sizes (converted to cm), where sample sites with values below 1 were moderately sorted
and values above 1 were poorly sorted (Folk, 1980). Percentage diagrams for estimating
composition by volume were used to visually approximate the percent of ground covered
by desert pavement clasts in the non-gridded photographs of each 1m2 sample site
(Compton, 1985, p. 366). These values for clast size, sorting and percent cover were
compared to the parameters set forth in Wood et al. (2002) to classify the desert
Table 6. Chemical composition of surface and subsurface sediments. CaCO3 OrganicsSample Sample Calcite Dolomite equivalent Gypsum (carbon) site depth % % % % % 1-5 2 cm 6.1 0.5 6.6 0.0 0.79 1-5 10 cm 14.7 0.6 15.5 0.0 1.80 2-4 2 cm 3.5 0.5 4.0 0.0 0.47 2-4 10 cm ………… destroyed during lab analysis…………… 3-7 2 cm 6.3 0.8 7.2 0.0 0.84 3-7 10 cm 6.9 1.6 8.6 19.4 0.99 * small sample size due to NPS sampling limitations
47
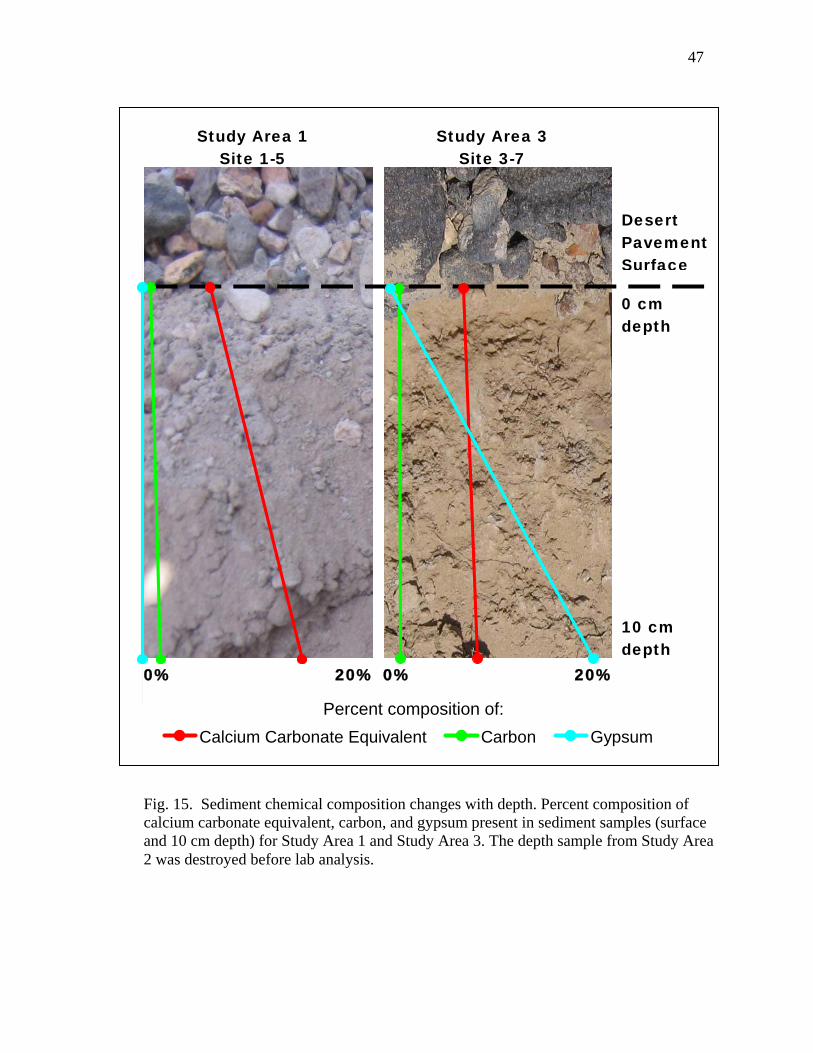
Fig. 15. Sediment chemical composition changes with depth. Percent composition of calcium carbonate equivalent, carbon, and gypsum present in sediment samples (surface and 10 cm depth) for Study Area 1 and Study Area 3. The depth sample from Study Area 2 was destroyed before lab analysis.
0% 20% 0%
Calcium Carbonate Equivalent Carbon Gypsum
20%
Percent composition of:
Desert Pavement Surface
10 cm depth
0 cm depth
Study Area 1 Site 1-5
Study Area 3 Site 3-7
48
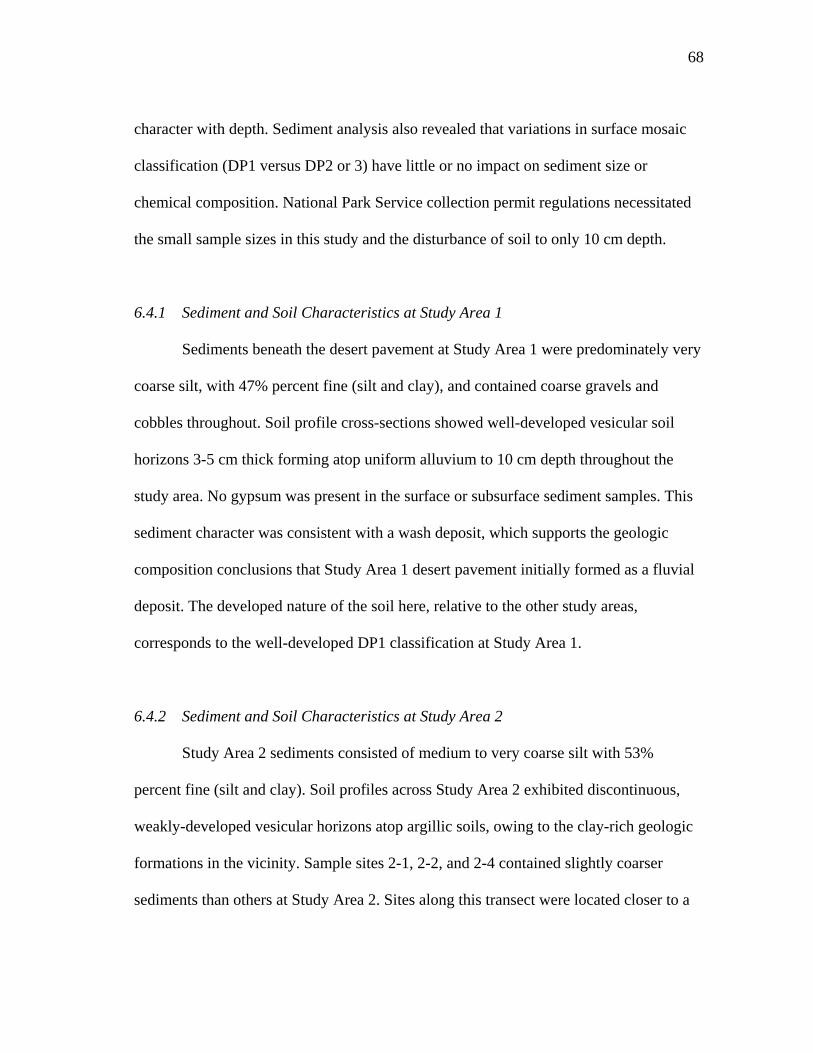
Fig. 16. Grain size distribution of Study Area 1 sediments, BBNP.
0
25
50
75
100
0 0.1 0.2 0.3 0.4 0.5 0.6 0.7 0.8 0.9 1
Grain size (mm)
Cum
ulat
ive
perc
ent f
iner
(%)
Sample site 1-1 Sample site 1-2 Sample site 1-3Sample site 1-4 Sample site 1-5 Sample site 1-6Sample site 1-7 Sample site 1-8 Sample site 1-9
49
surface to subsurface sediments, cumulative percent finer distribution (Fig. 17) showed a
larger percentage of coarser sediments at 10cm depth and greater amounts of fine
sediments at the surface. Percent calcium carbonate equivalent (calcite plus dolomite)
increased from 6.6% at the surface to 15.5% at 10 cm depth, the most significant
increase with depth of all study areas. Sediments contain no gypsum, and the surface
sample contained 0.79% organics and 1.80% organics at depth.
As shown in Fig. 18, cross-sections of the soil beneath the desert pavements at all
three Study Area 1 sites revealed uniform sandy/silty alluvium to 10 cm depth. Sub-
angular gravels 3-4mm in width comprised approximately 25% of the subsurface soils,
with partial or complete calcium carbonate coatings on larger gravel grains. A well-
developed vesicular soil horizon (Fig. 19) was visible to 3 cm beneath the desert
pavement surface at sites 1-1 and 1-5. The vesicular soil horizon extended to 5.5 cm
depth at site 1-9.
5.3.2 Sediment and Soil Analysis at Study Area 2
Fifty-six percent of the surface sediments at Study Area 2 were very coarse silt,
with coarse silt and medium silt comprising 22% each. Mean percent fine (silt and clay)
composition was 53%, with sample site values ranging from 39% to 72.3%. The
cumulative percent finer graph (Fig. 20) of Study Area 2 shows generally consistent
grain size distribution at all sample sites, with an average D50 grain size of 0.4 mm. The
surface sample contains 4% calcium carbonate equivalent, less than 1% carbon, and no
50
Fig. 17. Grain size distribution comparison of surface and subsurface sediments. Surface sediments sampled at 2 cm, and subsurface sediments sampled at 10 cm depth at Study Areas 1 and 3. 10cm depth sample from Study Area 2 was destroyed during lab analysis and not included in this comparison.
0
25
50
75
100
0 0.1 0.2 0.3 0.4 0.5 0.6 0.7 0.8 0.9 1
Grain size (mm)
Cum
ulat
ive
perc
ent f
iner
(%)
Study Area 1, surface Study Area 1, subsurfaceStudy Area 3, surface Study Area 3, subsurface
51
Fig. 18. Soil profile cross-sections (10 cm), Study Area 1. The third cross-section photograph did not develop.
52
Fig. 19. Soil beneath Study Areas 1 and 2. Examples of well-developed vesicular horizons at Study Area 1 (top) and Study Area 2 (bottom).
53
Fig. 20. Grain size distribution of Study Area 2 sediments, BBNP.
0
25
50
75
100
0 0.1 0.2 0.3 0.4 0.5 0.6 0.7 0.8 0.9 1
Grain size (mm)
Cum
ulat
ive
perc
ent f
iner
(%)
Sample site 2-1 Sample site 2-2 Sample site 2-3 Sample site 2-4 Sample site 2-5Sample site 2-6 Sample site 2-7 Sample site 2-8 Sample site 2-9
54
gypsum. The 10 cm depth sediment sample from Study Area 2 was destroyed during lab
analysis, so surface to depth comparisons are not available.
The cross-section at site 2-1 (Fig. 21) revealed a vesicular horizon to 4.2 cm
depth, underlain by clay-rich soils with a medium sub-angular blocky structure. Coarse
gravels (approximately 3 cm grain size) with thin discontinuous carbonate coatings on
the underside comprised 25% of the argillic soil horizon. At site 2-5, a very weakly
developed vesicular horizon less than 1cm thick was underlain by virtually gravel-free
clay-rich soil soils at 5 cm depth. Cross-sections at site 2-9 revealed a 1 cm thick very
weakly developed vesicular horizon, and argillic soils of moderate, medium granular
texture at 3 cm depth. Figure 19 shows an example of vesicular horizon at Study Area 2.
5.3.3 Sediment and Soil Analysis at Study Area 3
At Study Area 3, coarse silts dominated (67%), with 33% mean texture of surface
sediments very coarse silt. Percent fine (silt and clay) ranged from 32.6% to 52.3%, with
a mean of 41% silt and clay composition. Study Area 3 exhibits the most tightly
constrained grain size distribution when graphed as cumulative percent finer (Fig. 22),
with a mean D50 grain size of 0.7 mm. Comparing surface to subsurface sediments (Fig.
17), cumulative percent finer distribution showed a larger percentage of fine sediments
at 10 cm depth than at the surface. Percent calcium carbonate equivalent increased from
7.2% at the surface to 8.6% at 10 cm depth. The surface sediment sample contained no
gypsum, but 19.4% gypsum was present at 10 cm depth. The 10 cm depth sample at
55
Fig.
21.
Soi
l pro
file
cros
s-se
ctio
ns (1
0 cm
),St
udy
Are
a 2.
56
Fig. 22. Grain size distribution of Study Area 3 sediments, BBNP.
0
25
50
75
100
0 0.1 0.2 0.3 0.4 0.5 0.6 0.7 0.8 0.9 1
Grain size (mm)
Cum
ulat
ive
perc
ent f
iner
(%)
Sample site 3-1 Sample site 3-2 Sample site 3-3 Sample site 3-4 Sample site 3-5Sample site 3-6 Sample site 3-7 Sample site 3-8 Sample site 3-9
57
Study Area 3 contained the only gypsum present in this study. The sediment samples
contained less than 1% carbon at the surface and depth.
Figure 23 shows that the cross-section at site 3-1 exhibited a weakly-developed
vesicular horizon to 2 cm depth, with an argillic soil horizon at 8 cm depth. The
subsurface soils contained more than 50% medium-coarse gravels with some
discontinuous calcium carbonate coatings and abundant calcium carbonate nodules.
Sample site 3-5 was characterized by a well-developed vesicular horizon to 3 cm depth,
while a weakly-developed vesicular horizon extended to 9 cm. Argillic soils were
present at 9 cm depth, and calcium carbonate nodules were abundant. Soil underlying the
desert pavement at site 3-9 exhibited a discontinuous, weakly-developed vesicular
horizon to 0.5 cm, becoming argillic and calcium carbonate-rich at 1.5 cm. Secondary
gypsum crystals (Fig. 24) and gravels with calcium carbonate coatings on the underside
were also present. Sample site 3-9 was located furthest downslope, relative to other sites
at Study Area 3.
5.4 Vegetation and Slope
Landscape-scale photos, shown in Fig. 10, depict vegetation cover and slope at
BBNP desert pavement study areas. Approximately 10% of the desert pavement area
was vegetated at Study Area 1 off Old Maverick Road. Creosote dominated, comprising
90% of the total vegetation, along with 5% cholla, 3% ocotillo, and 2% lechugilla. Less
than 1% slope was measured at this desert pavements site.
58
Fig.
23.
Soi
l pro
file
cros
s-se
ctio
ns (1
0 cm
), St
udy
Are
a 3.
59
Fig. 24. Soil beneath Study Area 3 desert pavement. Large secondary gypsum crystals (top). Distinct vesicles visible when a large clast was removed (bottom).
60
Study Area 2 off Ross Maxwell Scenic Drive exhibited 15% vegetative cover
and less than 1% slope. The vegetation included approximately 80% honey mesquite,
10% cholla, and lesser amounts of creosote, prickly pear, ocotillo, annuals, and grasses.
Study Area 3 (Croton Springs Road) was the most diverse and densely vegetated
desert pavement area, with approximately 30% vegetative cover: 40% creosote, 20%
honey mesquite, 20% lechugilla, 10% prickly pear, and the remaining 10% ocotillo and
assorted cacti. This desert pavement area had a 6% slope, the steepest of all three study
areas.
61
DISCUSSION 6.1 Desert Pavement Distribution in Big Bend National Park
Evenari (1985) estimates that desert pavement covers more than half of the arid
land surface in North America. In BBNP, that percentage is likely lower because of the
presence of mountain ranges, and active fluvial and weathering processes in the park.
Desert pavement formation requires a flat or moderately inclined plane surface with
sparse vegetation and periods of geomorphic stability, abandonment, in order to form
(Mabbutt, 1977).
Mapping of desert pavement distribution in BBNP was based on field
reconnaissance, analysis of geologic maps and digital images, and discussion with park
scientists. Figure 25 divides BBNP into five segments, according to the likelihood of
desert pavement formation on those surfaces.
1, Green. Desert pavement is not forming in the desert plains portion of BBNP which is
still covered in grasses and mesquite shrubs, owing to the cattle ranching era in BBNP’s
early history. The high percent of vegetative cover and active fluvial channels minimize
the likelihood of desert pavement formation in the northern part of BBNP.
2, Pink. The steep slopes of the Chisos Mountains, particularly the Chisos Basin in the
center of the park, would prevent the establishment of desert pavements.
3, Blue. The active floodplains of the Rio Grande are also not conducive to desert
pavement formation.
62
Desert plains
Mountain ranges
Rio Grande floodplains
Active alluvial fan surfaces
Abandoned alluvial fan surfaces
Study Area 1
Study Area 3
Study Area 2
3
5
4
2
1
Fig. 25. Desert pavement distribution in BBNP. Three desert pavement study areas located in the western portion of BBNP, marked in red. Distribution of desert pavement in BBNP, divided into 5 segments:
1 (green) Desert pavement NOT likely. Desert plains. 2 (pink) Desert pavement NOT likely. Mountain ranges. 3 (blue) Desert pavement NOT likely. Rio Grande floodplains. 4 (orange) Desert pavement NOT likely. Active alluvial fan surfaces. 5 (yellow) Desert pavement LIKELY. Abandoned alluvial fan surfaces.
63
4, Orange. Active alluvial fan surfaces prohibit pavement establishment in the
southeastern portion of BBNP.
5, Yellow. Well-developed desert pavements concentrate exclusively on the abandoned
alluvial fan surfaces west of the Chisos Basin in BBNP.
Vast alluvial aprons extend both to the west and southeast of the Chisos
Mountain Basin, however, the processes currently acting on the two fan surfaces differ
as a result of localized uplift which tilted BBNP toward the southeast direction. This
tectonic activity re-activated the fan surfaces located in the southeastern portion of
BBNP (4, orange), and numerous channels dissected the alluvial apron, discouraging
desert pavement formation across this area. During the summer monsoon season, water
flows from Chisos Basin, over the alluvial fan surfaces to the southeast, and toward the
Rio Grande River.
Alluvial aprons extending west of the Chisos Basin were largely rendered
inactive by the regional uplift (5, yellow). These abandoned fan surfaces are optimal
locations for desert pavement formation because of their geomorphic surface stability
and the decreased fluvial activity. Thick accumulations of alluvium and weathered
fragments from volcanic outcrops that punctuate the fan surface act as source rocks for
desert pavement clasts.
Areas where desert pavement fields may exist are extensive and difficult to
access in BBNP, both because of physical and technological constraints. Few roads or
trails traverse these areas, off-trail exploration in the park is regulated, and large-scale
64
re-mapping efforts using remotely-sensed imagery to identify desert pavement and other
Quaternary surficial deposits are still ongoing by the USGS (2004).
6.2 Surface Mosaic Classification System
All of the sample sites in this study resulted in desert pavement (DP 1,2,3)
classifications based on parameters of percent clast cover, clast width, and clast sorting
(Wood et al., 2002). However, the classification system yielded inconsistent results in
63% of the sample sites in this study, meaning that classification from each of the three
parameters did not yield the same overall result. Forty-four percent of sites at Study Area
1 were inconsistently classified, 89% at Study Area 2, and 56% at Study Area 3.
Well developed (“older”) desert pavement according to this classification
exhibits small, well-sorted clasts with greater percent of the ground covered by clasts.
Study Area 1 contained a majority of these well-developed DP1 classified pavements,
while Study Areas 2 and 3 were generally determined to be DP2 or DP3.
6.2.1 Classification by Clast Cover
The most clear distinction between the bare ground mosaics (BG 1,2,3) and
desert pavement mosaics (DP 1,2,3) was found using percent ground cover; greater than
65% ground cover indicated desert pavement mosaics. In BBNP, 100% of Study Area 1
sites were DP1, and 89% of Study Area 2 were DP1. Percent clast cover varied
significantly at Study Area 3, with 44% classified as DP2, 33% as DP3, and 22% as
DP1.
65
6.2.2 Classification by Clast Width
Five clast measurements were considered when determining surface mosaic
classification by clast width (median, mean, mode maximum, and minimum). In this
study, median and mode values were most distinctive when determining surface mosaic
classification by clast width. According to clast width parameters, 56% of Study Area 1
sample sites were classified as DP1, 67% of Study Area 2 were DP3, and 78% of Study
Area 3 were DP2.
6.2.3 Classification by Clast Sorting
According to this classification system, sorting values (standard deviation) for
both DP2 and DP3 were 1.3, and DP1 was well-sorted. Consequently, it was not possible
to distinguish between DP2 and DP3 pavements using the parameter of clast sorting. At
Study Area 1, 89% of the sites were classified DP1, while 100% of Study Area 2 and
89% of Study Area 3 were labeled as DP2/DP3.
6.3 Geologic Composition of Desert Pavement
Geologic composition of the desert pavement clasts provides the most
compelling evidence for deciphering the processes involved in desert pavement
formation.
66
6.3.1 Geologic Composition at Study Area 1
At Study Area 1, bedrock was not present, outcrops were not located nearby, and
the dry washes near this study site cut through thick deposits of alluvial fill, similarly
depicted on the BBNP geologic map. This region of BBNP is an alluvial apron,
descending from the Chisos Mountains in west and southwesterly directions. A single
rock type did not dominate the desert pavement clasts at this study area. Instead, the
small, sub-rounded, well-sorted clasts of diverse geologic composition suggest that these
clasts may have been derived from areas upstream. No historical flow data was collected
by BBNP in these washes, and no flood events were observed during BBNP field
reconnaissance. However, it is feasible that rock fragments from geologic formations
upstream were entrained, weathered during transport, and deposited in their present
location during a series of floods events. Desert pavement formation could have
commenced subsequent to the abandonment of these wash areas.
6.3.2 Geologic Composition at Study Area 2
Bedrock was not exposed at the surface of Study Area 2, and research permit
regulations in the National Park prevented disturbance beneath the desert pavement to
determine depth to and composition of the underlying bedrock. However, rhyolitic
pavement clasts dominated at Study Area 2 (94%), and the geologic composition was
consistent with the Burro Mesa Riobeckite Rhyolite member and the Lost Mine Rhyolite
member of the South Rim Formation, outcropping near the pavement field. The
predominance of rhyolite at the study site can be attributed to the resistant Burro Mesa
67
Rhyolite, which capped many ridges throughout the area. The uppermost exposure of
rhyolite was almost completely eroded adjacent to Study Area 2, contributing to rhyolitic
pavement clasts.
6.3.3 Geologic Composition at Study Area 3
Steeply dipping surface exposures of sandstone bedrock were visible in some
places in the desert pavement field at Study Area 3. This bedrock sandstone appears
consistent with the Aguja and Javelina sandstone formations; however, only 2% of the
pavement clasts in this area were sandstone. Basaltic pavement clasts dominated (96%),
and the presence of geologically consistent layers of basalt upslope of Study Area 3
suggest that the clasts were likely derived from the adjacent basalt outcrop, rather than
the underlying sandstone bedrock. These basalts were likely the Bee Mountain or Ash
Spring Basalt members of the Chisos Formation. Study Area 3 was the most steeply
sloped pavement area of the three in this study, and the basalt outcrop was located in the
upslope direction of the desert pavement area, with large pieces of weathered basalt
lying on the slope toward the pavement. The appearance of a black rock coating on these
pavement clasts can be attributed to weathering of the basalt, rather than rock varnish.
6.4 Sediment and Soil Characteristics
Sediment samples indicated that silt, clay, and very fine sands dominate the
surface sediments beneath desert pavement at all three study areas. Grain size
distribution within each study area was consistent, there was little change in sediment
68
character with depth. Sediment analysis also revealed that variations in surface mosaic
classification (DP1 versus DP2 or 3) have little or no impact on sediment size or
chemical composition. National Park Service collection permit regulations necessitated
the small sample sizes in this study and the disturbance of soil to only 10 cm depth.
6.4.1 Sediment and Soil Characteristics at Study Area 1
Sediments beneath the desert pavement at Study Area 1 were predominately very
coarse silt, with 47% percent fine (silt and clay), and contained coarse gravels and
horizons 3-5 cm thick forming atop uniform alluvium to 10 cm depth throughout the
study area. No gypsum was present in the surface or subsurface sediment samples. This
sediment character was consistent with a wash deposit, which supports the geologic
composition conclusions that Study Area 1 desert pavement initially formed as a fluvial
deposit. The developed nature of the soil here, relative to the other study areas,
corresponds to the well-developed DP1 classification at Study Area 1.
6.4.2 Sediment and Soil Characteristics at Study Area 2
Study Area 2 sediments consisted of medium to very coarse silt with 53%
percent fine (silt and clay). Soil profiles across Study Area 2 exhibited discontinuous,
weakly-developed vesicular horizons atop argillic soils, owing to the clay-rich geologic
formations in the vicinity. Sample sites 2-1, 2-2, and 2-4 contained slightly coarser
sediments than others at Study Area 2. Sites along this transect were located closer to a
69
bare ground area, and increased surface runoff may have washed away fines, leaving
larger sediments in the surface sample here than in other sites at Study Area 2.
6.4.3 Sediment and Soil Characteristics at Study Area 3
Coarse silts dominated sediments at Study Area 3, and weakly-developed
vesicular soils were present at all sites. Gypsum was found at depth at Study Area 3
only, and secondary gypsum crystals and significant calcium carbonate accumulations
were more prevalent in sites farther downslope. The steep slope of this desert pavement
field may contribute to the soluble salts washing downhill and concentrating in areas
with low relief.
6.5 Evaluation of Accretionary Mantle Model
Current literature favors the accretionary mantle model of desert pavement
formation, which contends that desert pavement clasts are derived immediately atop
bedrock and evolve in situ (McFadden et al., 1987). In the case of these three study areas
in Big Bend National Park, however, the desert pavement clasts do not appear to have
been derived from bedrock. At Study Areas 2 and 3, mechanical weathering of adjacent
outcrops, and the subsequent movement of the eroded fragments downslope because of
gravity or fluvial action, could serve as an alternative process of desert pavement clast
derivation. At Study Area 1, deposition of clasts following flood events in nearby
washes may suggest yet another preliminary stage of desert pavement formation. These
70
assertions are aligned with Williams and Zimbelman (1994), who suggested that
sheetflood served as a precursor stage to desert pavement formation.
Predominately clay- and silt-sized surface sediments in the BBNP study areas
could indicate emplacement by a combination of aeolian processes or in situ subsurface
weathering. However, aeolian influence in BBNP is probably limited because there is
little evidence of aeolian erosion and sand sources (playas or dunes) in the vicinity. In
addition, subsequent soil development is not proceeding as described by McFadden et al.
(1987) and Anderson et al. (1994). The characteristic vesicular soil horizon was well-
developed in Study Area 1, but weakly-developed or not present at many more sites in
the other study areas. The soil profiles at Study Areas 1 and 2 were not virtually stone-
free, as suggested by the Mojave model. The wetter environment of BBNP may favor
the formation of a soil mantle by in situ weathering, similar to the concentration by
weathering desert pavement formation hypothesis. Differential weathering of the
rhyolite and basalt at Study Areas 2 and 3 may result in differing rates of soil formation
in these two areas. Despite a mature surface appearance, the desert pavements at BBNP
may be “younger” than they appear.
6.6 Comparison to Desert Pavements in the Mojave Desert
Important contrasts exist between the desert pavements at Big Bend National
Park and those studied in the Mojave Desert, California by Wells et al. (1985),
McFadden et al. (1987), Anderson et al. (1994), Wood et al. (2002) and (2005), for
example. Pavements of the Cima volcanic field are composed of bedrock-derived basalt
71
clasts, while the desert pavements in BBNP display varying volcanic and non-volcanic
rock compositions. At the study areas in BBNP, the clasts are not likely derived from
bedrock, but from other precursor stages of formation. Desert pavements at the Cima
volcanic field cover vast aerial expanses of the Mojave Desert, BBNP topography results
in numerous smaller fields of desert pavement. Compared to the Mojave Desert, the
topography of Big Bend National Park displays more relief, with alluvial aprons
descending from the Chisos Mountains, interrupted by geomorphic formations and cut
by ephemeral washes. Most importantly, climate variations affect ecosystem process at
the Mojave Desert and BBNP differently.
In the semi-arid environment of BBNP, it is likely that fluvial processes and
enhanced (mechanical, chemical, and biological) weathering play a more prominent role
in the development of desert pavement on abandoned desert surfaces than in the Mojave
Desert. Results from this study indicate that fluvial processes could be responsible for
the deposition of desert pavement clasts near ephemeral washes and the small-scale re-
working of desert pavements surfaces in their early stages of development. The
comparatively wetter climate in BBNP can contribute to greater mechanical weathering
responsible for eroding outcrops and providing another source rock for desert pavement
clasts. The abundance of vegetation in BBNP increases surface stability on sloping
alluvial fans, which is essential to desert pavement establishment. Increased precipitation
in BBNP flushes salts and carbonates deeper beneath the pavements, and increase rates
of subsurface weathering of large particles, producing a soil mantle. These different
environmental conditions may have also attributed to the complications in applying the
72
surface mosaic classification for desert pavements that was developed for the Mojave
Desert. This Mojave classification system may require modification to accommodate
different climatic and geomorphic regimes.
73
CONCLUSION
The purpose of this study was to assess the geomorphology of previously un-
studied desert pavements in the Big Bend National Park, Texas, area of the Chihuahuan
Desert. This geomorphic assessment filled an important gap in regional arid land
literature and offered the opportunity to evaluate processes of desert pavement formation
in a semi-arid environment. Specifically, this study sought to:
1) identify areas of well-developed desert pavement in BBNP and classify the desert
pavements into surface mosaic units using the parameters of clast width, sorting, and
percent ground cover. Well-developed desert pavements are concentrated in the western
portion of BBNP because of geologic processes and subsequent geomorphic
abandonment of fan surfaces. The classification system by Wood et al., (2002) yielded
largely inconsistent results at the three study areas. However, the desert pavements at
Study Area 1 were mostly DP1, and the other Study Areas were DP2 or DP3.
2) determine the geologic composition of the desert pavement clasts and the source rock
from which the pavement was likely derived. Lithologic comparison revealed that the
desert pavement clasts may have originated from stream deposits and weathering of
adjacent outcrops.
74
3) describe the sediments and subsurface soil horizons that lie beneath desert pavements.
Soil profiles lack the characteristics of mature desert pavements, and the underlying silt
and clay sediments were most likely deposited by aeolian processes or weathered in situ.
4) evaluate the applicability of the accretionary mantle model (McFadden et al., 1987)
of desert pavement formation at BBNP. Clasts derived from stream deposits and
weathering of adjacent outcrops may represent precursor stages of desert pavement
development to complement the accretionary mantle model developed in the Mojave
Desert. Although desert pavements in BBNP are not bedrock derived, subsequent stages
of soil development may begin according to the model. However, the enhanced
influence of fluvial action, weathering (mechanical, chemical, and biological), and
vegetation in the semi-arid environment of BBNP may contribute to variations in the
stages and rates of desert pavement development. Even though desert pavements at
BBNP have a well-developed surface texture, the absence of rock varnish indicates that
they may be “younger” than they appear.
Since this study served as a preliminary geomorphic assessment, many avenues
for future research have been uncovered. The semi-arid environment in BBNP
introduces a unique set of environmental variables to the study of desert pavement in this
region. Further studies could investigate the impact of vegetation on desert pavement
surficial patterns. Upon completion of the USGS (2004) mapping efforts, more extensive
areas of desert pavement in BBNP could be identified and included in future
comparative studies. Permission from the National Park Service to expose bedrock
75
beneath desert pavements and to conduct comprehensive sampling in more areas could
result in evidence to further substantiate these conclusions. Most importantly, Nichols et
al. (2006) and Lancaster and Tchakerian (2003) note the importance of cosmogenic
nuclides and luminescence dating in understanding desert surface change over time.
Determining the precise age of the desert pavements in BBNP would allow for further
conclusions on the stages and processes specific to the development of desert pavement
at Big Bend National Park.
76
REFERENCES Al-Farraj, A., Harvey, A.M., 2000. Desert pavement characteristics on wadi terrace and
alluvial fan surfaces: Wadi Al-Bih, U.A.E. and Oman. Geomorphology. 35, 279-297.
Anderson, K.C., Wells, S.G., Graham, R.C., McFadden, L.D., 1994. Process of vertical
accretion in the stone-free zone below desert pavements. Geological Society of America Abstracts with Programs. 26, A-87.
Belnap, J., Warren, S.D., 2002. Patton’s tracks in the Mojave Desert, USA: An
ecological legacy. Arid Land Research and Management. 16, 245-258. Blott, S.J., Pye, K., 2001. GRADISTAT: A grain size distribution and statistics package
for the analysis of unconsolidated sediments. Earth Surface Processes and Landforms. 26, 1237-1248.
Compton, R.R., 1985. Geology in the Field. John Wiley and Sons, New York. Cooke, R.U., 1970. Stone pavements in deserts. Annuals of the Association of American
Geographers. 60, 560-577. Cooke, R.U., Warren, A., 1973. Geomorphology in Deserts. University of California
Press, Berkeley. Cooke, R., Warren, A. Goudie, A., 1993. Desert Geomorphology. UCL Press Limited,
A.D., Parsons, A.J. (Eds.), Geomorphology of Desert Environments. Chapman and Hall, London. pp 64-81.
Dorn, R.I., 2004. Rock coating, in: A.S. Goudie (Eds.), Encyclopedia of
Geomorphology, Vol. 2. Routledge, London, pp 870-873. El-Baz, F., 1992. Preliminary observations of environmental damage due to the Gulf
War. Natural Resources Forum. 2, 71-75. Evenari, M., 1985. The desert environment, in: Evenari, M., Noy-Meir, I., Goodall, D.
W. (Eds.), Hot Deserts and Arid Shrublands, Part A. Elsevier Science Publishing Company, New York, pp. 1-19.
Folk, R.L., 1980. Petrology of Sedimentary Rocks. Hemphill Publishing Company,
Austin.
77
Haff, P.K., Werner, B.T., 1996. Dynamical processes on desert pavements and the
healing of surficial disturbances. Quaternary Research. 45, 38-46. Haff, P., 2001. Desert pavement: An environmental canary? The Journal of Geology.
109, 661-668. Herbert, J.M., 2004. Predicting climate change in Big Bend National Park, Texas.
Unpublished doctoral dissertation, Texas State University, San Marcos, TX. Higgitt, D., Allison, R., 1999. Characteristics of stone covers on the surface of basalt
flows in arid, northeast Jordan. Geomorphology. 28 (3-4), 263-280. Hume, W.F., 1925. Geology of Egypt. Vol 1. Cairo. Jessup, R. 1960. The Stony Tableland soils of the Australian arid zone and their
evolutionary history. Journal of Soil Science. 11, 188-196. Kade, A., Warren, S.D., 2002. Soil and plant recovery after historic military disturbances
in the Sonoran Desert, USA. Arid Land Research and Management. 16, 231-243. Kilmer, V.J., Alexander, L.T., 1949. Methods of making mechanical analyses of soils.
Soil Science. 68, 15-24. Laity, J.E., 2002. Desert environments, in: Orme, A.R. (Ed.), The Physical Geography of
North America. Oxford University Press, Oxford, pp. 380-401. Lancaster, N., Tchakerian, V.P., 2003. Late Quaternary eolian dynamics, Mojave Desert,
California, in Enzel, Y., Wells, S.G., and Landcaster, N., Eds., Paleoenvironments and paleohydrology of the Mojave and southern Great Basin deserts: Geological Society of America Special Paper 368, 231-249.
Lowdermilk, W.C. Sundling, H.L., 1950. Erosion pavement, its formation and
significance. Transactions of the American Geophysical Union. 31, 96-100. Mabbutt, J.A., 1977. Desert Landforms. MIT Press: Cambridge. Maxwell, R., 1966. Geologic map of the Big Bend National Park, Brewster County,
Texas. University of Texas, Austin. Maxwell, R.A., Lonsdale, J.T., Hazzard, R.T., Wilson, J.A., 1967. Geology of Big Bend
National Park, Brewster County, Texas. University of Texas, Bureau of Economic Geology, Austin.
78
Maxwell, R., 1968. Big Bend of the Rio Grande: A Guide to the Rocks, Landscape, Geologic History, and Settlers of the Area of Big Bend National Park. University of Texas, Bureau of Economic Geology, Austin.
McFadden, L., Wells, S., Jercinovich, M., 1987. Influences of eolian and pedogenic
processes of desert pavements. Geology. 15 (6), 504-508. National Park Service (NPS), 2006. Big Bend National Park.
<http://www.nps.gov/bibe/> Last updated Sep 13, 2006. Last accessed Oct 2006. Nelson, K., 1992. A Road Guide to the Geology of Big Bend National Park. Big Bend
Natural History Association, Paragon Press, Salt Lake City. Nichols, K.K., Bierman, P.R., Foniri, W.R., Gillespie, A.R., Caffee, M., Finkel, R.,
2006. Dates and rates of arid region geomorphic processes. GSA Today. 16 (8), 4-11.
Sharon, D. 1962. On the nature of hamadas in Israel. Geom. 6: 129–147. Singer, M.J., and Janitzky, P., 1986. Field and laboratory procedures used in a soil
chronosequence study. United States Geological Survey Bulletin. 1648, p. 49. Spearing, D., 1991. Roadside Geology of Texas. Mountain Press Publishing, Missoula,
MT. Springer, M.E., 1958. Desert pavement and vesicular layer of some soils of the desert of
the Lahontan Basin, Nevada. Soil Science Society of America Proceedings. 22, 63-68.
Tchakerian, V.P., 1997. North America, in: Thomas, D. (Ed.), Arid Zone
Geomorphology: Process, Form and Change in Drylands. John Wiley and Sons, Chichester, pp. 523-542.
Tchakerian, V.P., 1999a. Dune paleoevnironments, in: Goudie, A.S., Livingstone, I.,
Stokes S. (Eds.), Aeolian Environments, Sediments and Landforms. John Wiley and Sons, New York, pp. 261-292.
Tchakerian, V.P., 1999b. Stone pavement, in: Mares, M.A. (Ed.), Encyclopedia of
Deserts. University of Oklahoma Press, Norman, pp. 542-543. United States Geological Survey, Turner, K.J., 2004. A new digital geologic map of Big
Bend National Park, Texas. Presentation No. 47-9 2004 Denver Annual Meeting November 7-10, 2004 Geological Society of America Abstracts with Programs, 36:5, p.128.
79
Watson, A., Nash F., 1997. Desert crusts and varnishes, in: Thomas, D. (Ed.), Arid Zone
Geomorphology: Process, Form and Change in Drylands. John Wiley and Sons, Chichester, pp. 69-107.
Wells, S.G., Dohrenwend, J.C., McFadden, L.D. and Turrin, B.D., 1985. Late Cenozoic
landscape evolution on lava flow surfaces of the Cima volcanic field, Mojave Desert, California: Geological Society of America Bulletin. 96, 1518-1529.
exposure dating of stone pavements: Implications for landscape evolution in deserts. Geology. 23, 613-616.
Wells, S.G., McDonald, E., Lancaster, J., Sparks, R., Johnson, W., 1998. Desert Surficial
Process and Landscape Dynamics on Military Lands: Field Trip Road Log. Desert Research Institute, Reno, NV.
Williams, S.H., Zimbelman, J.R., 1994. Desert pavement evolution: An example of the
role of sheetflood. The Journal of Geology. 102, 243-248. Wood, Y.A., Graham, R.C, Wells S.G., 2002. Surface mosaic map unit development for
a desert pavement surface. Journal of Arid Environments. 52 (3), 305-317. Wood, Y.A., Graham, R.C, Wells S.G., 2005. Surface control of desert pavement
pedologic process and landscape function, Cima Volcanic field, Mojave Desert, California. Catena. 59, 205-230.
80
A
PPE
ND
IX A
Fig.
26.
Geo
logi
c m
ap o
f Big
Ben
d N
atio
nal P
ark,
Bre
wst
er C
ount
y, T
exas
(Max
wel
l, 19
66).
81
Alluvium Recent valley fill, unconsolidated fan and terrace deposits Gravel and Silt Consolidated high-level terrace gravels, pediment gravels, and older valley-fill deposits South Rim Formation (unconformity) Massive lava, flow breccia, and conglomerate Burro Mesa Riobeckite Rhyolite Member; massive rhyolite with quartz and riobeckite; correlation not definite, but un-named riobeckite-bearing rocks on Casa Grande and Lost Mine Peak may be the base of the Burro Mesa Riobeckite Rhyolite flow. Lost Mine Rhyolite Member, vari-colored, glassy, rhyolite lava. Wasp Spring Flow Breccia Member, orange to reddish-brown flow breccia interbedded with indurated tuff, rhyolite lava, and locally massive conglomerate. Brown rhyolite, informally named group of rhyolite flows at base of formation Chisos Formation Grey to buff and light-brown tuffaceous sandstone, tuffaceous clay, massive conglomerate, ash beds, and lava. Tule Mountain Trachyandesite Member, a massive dense porphyritic trachyandesite. Undifferentiated lavas mapped but not formally named. Mule Ear Spring Tuff Member, yellowish to reddish-brown tuff hard and flinty. Bee Mountain Basalt Member, massive basaltic lava, normally consisting of three flows; middle member has numerous cavities and veinlets filled with silica or calcium carbonate. Ash Spring Basalt Member, massive hard, dense basaltic lava, base of Chisos Formation at most localities in western part of the Park. Canoe Formation Yellowish massive conglomerate sandstone at base, overlain by white, pink, and yellow tuff and tuffaceous clay. Locally, one or more lavas. Hannold Hill Formation Maroon, pink, yellow, and grey clay with grey to yellowish-grey channel mudstone near middle of formation. Fig. 27. BBNP geologic map legend. Enlarged and adapted from Maxwell (1966).
82
Black Peaks Formation Yellowish-grey and pink clay sandstone commonly conglomerate.
and yellow sandstone. Basal
Javelina Formation Yellow, grey, pink, and maroon clay interbedded with a few yellowish-brown, soft, argillaceous sandstone layers. Dinosaur bone and silicified wood fragments Aguja Formation Yellowish-grey to dark-brown medium-grained sandstone interbedded with yellowish-brown and maroon clay. Dinosaur bone and silicified wood in upper half of formation Pen Formation Bluish-grey calcareous clay weathers yellow, a few thin sandstone beds near top. Large septarianlike concretions common, some fossiliferous beds. Boquillas Formation Upper unit: San Vicente member, grey, chalky limestone interbedded with grey, flaggy shale. Lower unit: Ernst member, yellowish-grey or buff, argillaceous limestone with grey, chalky shales. Some basal beds have reddish-brown to yellow mottled colors Buda Limestone Grey marl containing a thin bed of grey, marly modular limestone; massive, hard, light-grey to white porcellaneous limestone beds at base and top Del Rio Clay Yellow and yellowish-grey, calcareous clay with a few thin, hard, dark-brown ferruginous shale beds. Fossils are abundant at some localities and most of the ferruginous shale beds contain Haploatiche texana Santa Elena Limestone Massive, hard, cherty, rudistid-bearing, grey or bluish-grey limestone interbedded with a few thin layers or marly and modular limestone in upper half of formation Fig. 27, Continued.
83
Sue Peaks Formation Yellow to yellowish-grey or buff, fossiliferous, calcareous shale and thin beds of buff modular limestone Del Carmen Limestone Massive cherty hard rudistid-bearing, light brown limestone with marly beds near top in eastern part of Park Telephone Canyon Formation Alternating layers of yellowish-grey and buff marl and thin, marly, modular limestone. Fossiliferous at most localities and locally contains abundant Exogyra texana Glen Rose Limestone Massive, hard, dark-grey and locally brownish limestone, interbedded with light-grey or brown marl, and marly limestone. Many beds contain Orbitolina texana Paleozoic Formations (Undifferentiated). Limestone, chert, novaculite, and shale. Parts of Maravillas, Caballos, and Texana Formation and perhaps Marathon Formation Intrusive Rock Cretaceous and Tertiary. In stocks, sheetlike masses, dikes, and sills.
Fig. 27, Continued.
84
APPENDIX B
Photographs of desert pavement sample sites from Study Area 1 off Old Maverick
Road, Study Area 2 off Ross Maxwell Scenic Drive, and Study Area 3 off Croton Springs
Road. Black and white meter stick shows a 1 m field of view. GPS locations are noted on
the photographs.
Fig. 28. Desert pavement sample sites. Continued on next 7 pages.
N 29° 15’ 20.9” W 103 °31’ 56.6”
N 29° 15’ 21.3” W 103 °31’ 56.6”
85
N 29° 15’ 21.9” W 103° 31’ 56.4”
N 29° 15’ 20.8” W 103° 31’ 56.1”
N 29° 15’ 22.1” W 103° 31’ 55.4”
N 29° 15’ 21.3” W 103° 31’ 55.9”
86
N 29° 15’ 20.7” W 103° 31’ 55.4”
N 29° 15’ 21.2” W 103° 31’ 55.3”
N 29° 15’ 21.7” W 103° 31’ 55.1”
N 29° 09’ 45.0” W 103° 27’ 01.4”
87
N 29° 09’ 45.2” W 103° 27’ 00.9”
N 29° 09’ 45.5” W 103° 27’ 00.5”
N 29° 09’ 45.8” W 103° 27’ 00.0”
N 29° 09’ 46.0” W 103° 26’ 59.7”
88
N 29° 09’ 45.8” W 103° 27’ 01.0”
N 29° 09’ 45.5” W 103° 27’ 01.2”
N 29° 09’ 46.1” W 103° 27’ 00.5”
N 29° 09’ 46.4” W 103° 27’ 00.1”
89
N 29° 20’ 06.1” W 103° 20’ 29.4”
N 29° 20’ 06.2” W 103° 20’ 29.4”
N 29° 20’ 06.5” W 103° 20’ 28.5”
N 29° 20’ 06.6” W 103° 20’ 30.1”
90
N 29° 20’ 07.1” W 103° 20’ 28.8”
N 29° 20’ 06.8” W 103° 20’ 29.5”
N 29° 20’ 07.0” W 103° 20’ 30.1”
N 29° 20’ 07.4” W 103° 20’ 29.6”
91
N 29° 20’ 07.5” W 103° 20’ 29.1”
92
APPENDIX C
Table 7. Sediment analysis data from surface and subsurface samples
Very
coarse Coarse Medium Fine Very fine Coarse Fine Clay Sample sand sand sand sand sand silt silt