47
Deserving a better fate: mangroves and sea-level rise Catherine Lovelock School of Biological Science The University of Queensland

Deserving a better fate: mangroves and sea-level rise
Catherine Lovelock School of Biological Science The University of Queensland

Sea level rise
• Aboriginal story memories- 8000 years old: – The Narrangga tribe living on Yorke Peninsula ‘had
a story that has been handed down through the ages’ which recalled a time when Spencer Gulf was dry land, ‘marshy country reaching into the interior of Australia’….
– ‘the sea broke through, and came tumbling and rolling along in the track…it flowed into the lagoons and marshes which completely disappeared’
Patrick D. Nunn & Nicholas J. Reid (2016) Aboriginal Memories of Inundation of the Australian Coast Dating from More than 7000 Years Ago, Australian Geographer, 47:1, 11-47, DOI: 10.1080/00049182.2015.1077539


July 17, 2016
Climate change has barely registered as a 2016 campaign issue, but in Florida, the state which usually decides the presidential election, the waters are lapping at the doors of Donald Trump’s real estate empire

Agenda
1. Review vulnerability to sea level rise
2. Additional environmental factors
3. Some direct human impacts
4. Pathways for the future

Mangrove forests and tidal marshes – exceptional plant communities exposed to climate change
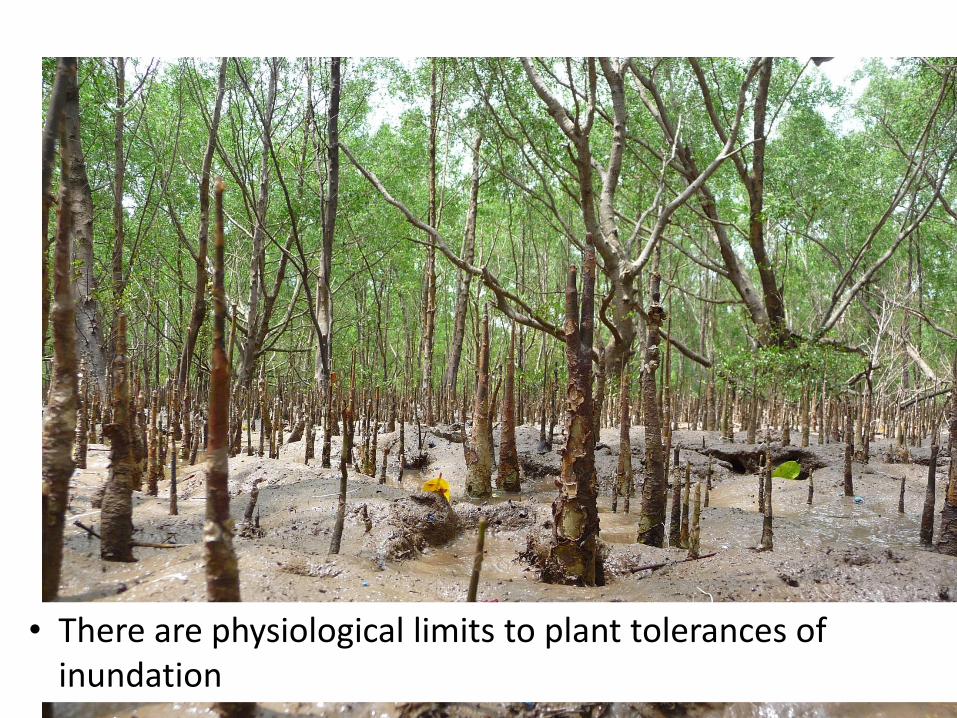
• There are physiological limits to plant tolerances of inundation
Image Tran Triet
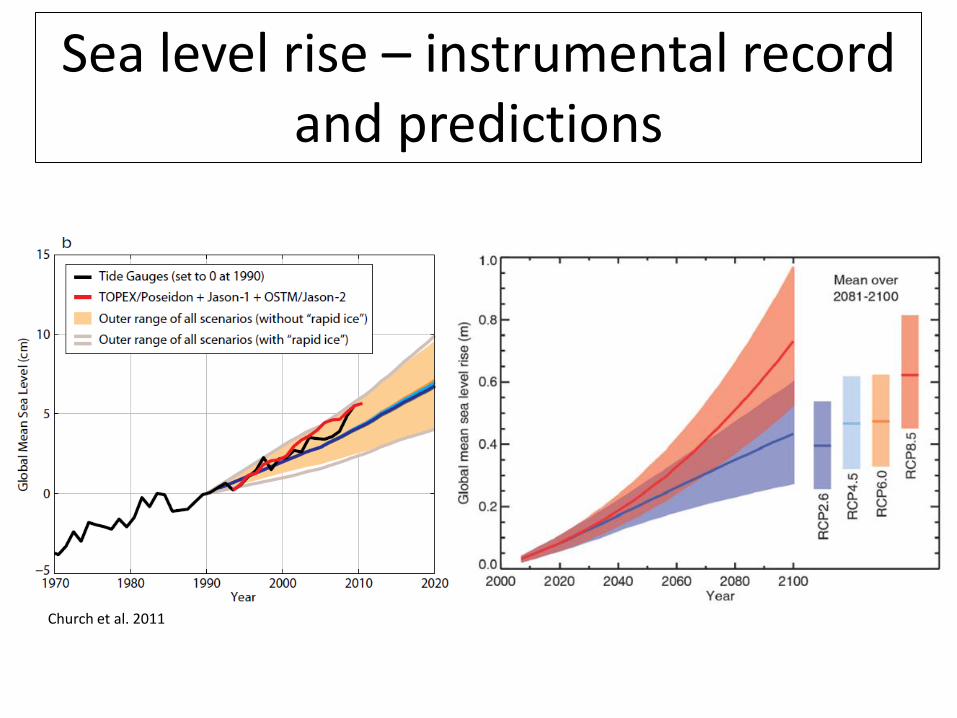
Sea level rise – instrumental record and predictions
Church et al. 2011

Subsidence – deeper processes
• Extraction of oil, gas, ground water
• Also local compaction (Swales et al. 2016 – Marine Geology)
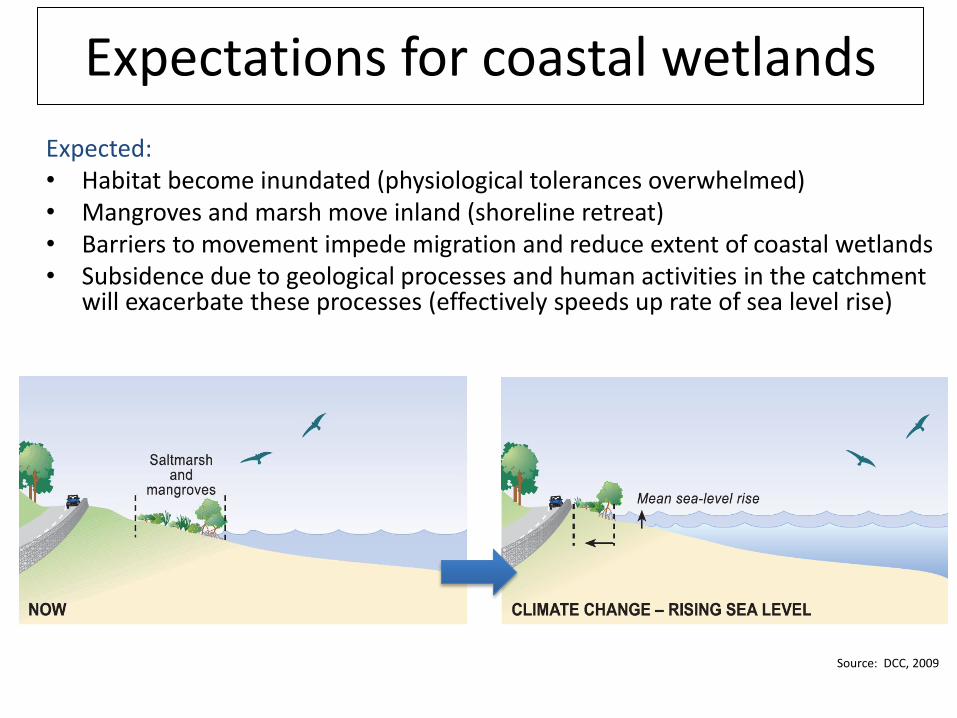
Expectations for coastal wetlands
Expected: • Habitat become inundated (physiological tolerances overwhelmed) • Mangroves and marsh move inland (shoreline retreat) • Barriers to movement impede migration and reduce extent of coastal wetlands • Subsidence due to geological processes and human activities in the catchment
will exacerbate these processes (effectively speeds up rate of sea level rise)
Source: DCC, 2009

• “Kept up” with sea level in some locations • Mangrove soils accrete – increase in soil volume • Wetland soil surface elevation can match the rate of sea level rise •Organic matter inputs are important
Mangrove stability – sediment record
McKee et al. 2007

Theoretical models
Allen 2000 Kirwan and Murray 2007
Stable marsh

Mangroves of the Indo-Pacific • Indo-Pacific has about 60% of the worlds mangroves • High diversity • Vulnerable because of high rates of sea level rise, intense human pressures
on coasts, typhoons/cyclones
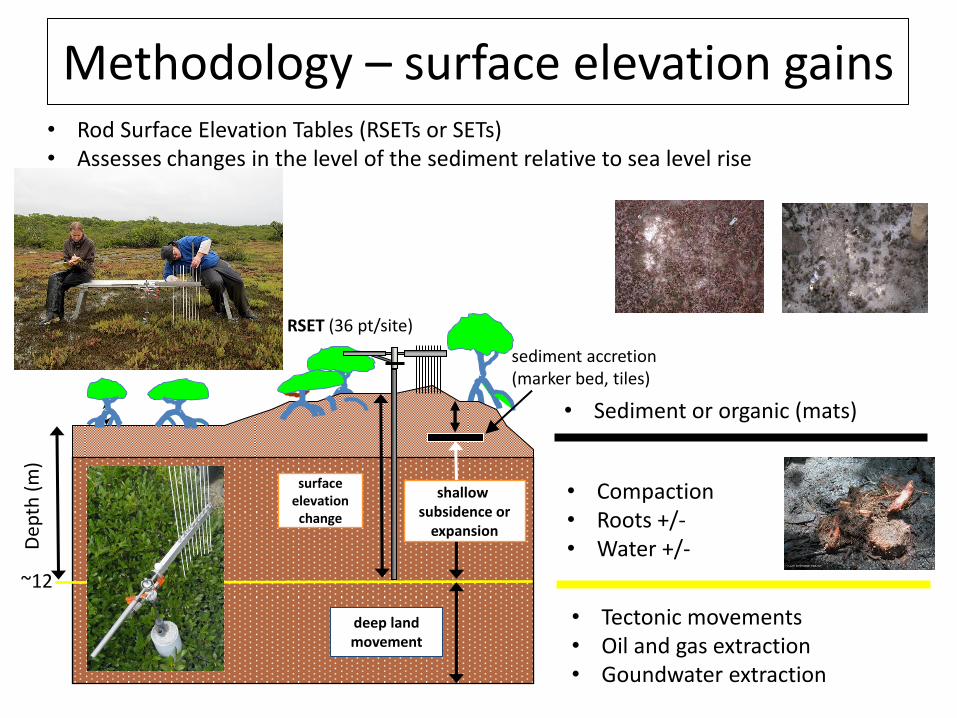
Methodology – surface elevation gains
surface elevation
change
shallow subsidence or
expansion
deep land movement
0
~12
Dep
th (
m)
RSET (36 pt/site)
sediment accretion (marker bed, tiles)
• Rod Surface Elevation Tables (RSETs or SETs) • Assesses changes in the level of the sediment relative to sea level rise
• Sediment or organic (mats)
• Compaction • Roots +/- • Water +/-
• Tectonic movements • Oil and gas extraction • Goundwater extraction
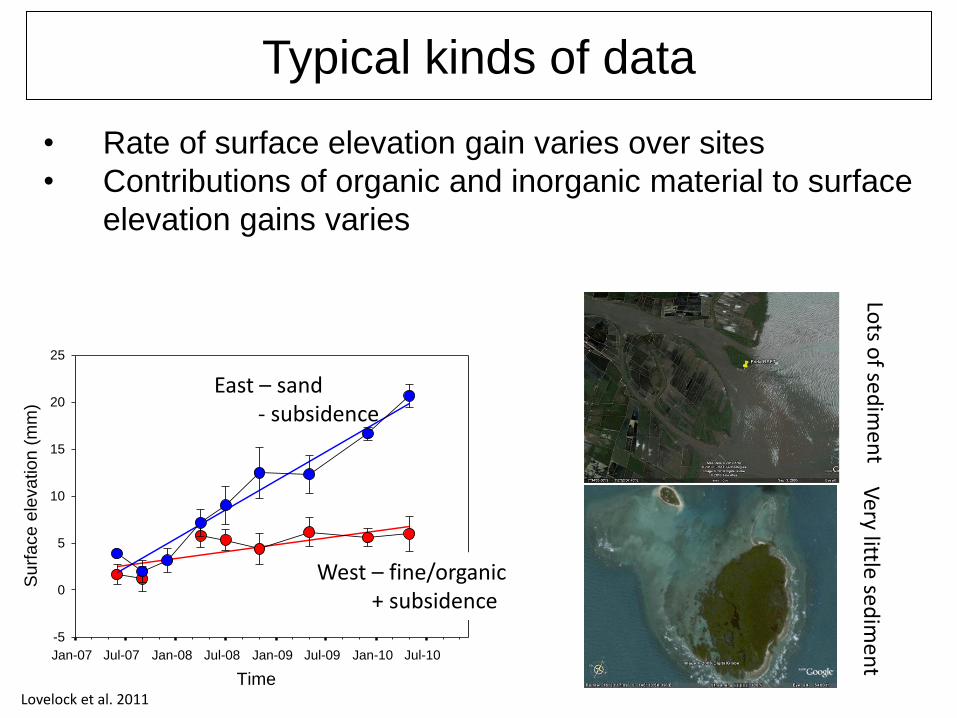
Typical kinds of data
• Rate of surface elevation gain varies over sites
• Contributions of organic and inorganic material to surface
elevation gains varies
Time
Jan-07 Jul-07 Jan-08 Jul-08 Jan-09 Jul-09 Jan-10 Jul-10
Surf
ace e
levation (
mm
)
-5
0
5
10
15
20
25
East
West
Lovelock et al. 2011
East – sand - subsidence
West – fine/organic + subsidence
Lots o
f sed
imen
t V
ery little sed
imen
t

Study sites
153 installations over 27 sites
Lovelock et al. 2015, Nature

Surface accretion mm/year0 50 100 150 200
Surf
ace
ele
vatio
n g
ain
mm
/ye
ar
-20
0
20
40
60
80
100
120
140
160
180
Sediment supply was key to surface elevation gains
• In contrast to previous analyses that found that surface sediment inputs were not good predictors of surface elevation gains
Porong, Indonesia
Vietnam
New Zealand
Slope = 0.78

Globcolour dataset. Medium Resolution Imaging Spectrometer (MERIS) instrument on the European Space Agency’s (ESA) Envisat satellite (390 – 1040 nm). 4 km pixels.
Surface elevation gain correlates with available sediment
• Potential for using remotely sensed data for predicting surface elevation gains
Total suspended matter g/m3
0 5 10 15 20 25 30
Surf
ace
ele
vatio
n g
ain
mm
/ye
ar
-20
0
20
40
100
150

Analysis of variation in surface elevation trends
• Used Boosted Regression Trees and fitted a range of models • TSM and annual change in sea level account for ~60% of variation

“Mass accretion rates of mineral and organic matter in tidal freshwater and salt water wetlands ….have been reported ……..these authors have advanced the argument that organic matter accretion is the principal means by which marshes accrete vertically. Our analysis supports this view, considering the low TSS concentrations typical of many estuaries, but we would argue that vertical accretion is limited by low availability of mineral sediment.”
……..even current rates of SLR along the East Coast (mean=0.34 cm yr−1, range=0.18–0.60 cm yr−1) are near the point that will lead to long-term elevation loss and eventual drowning of coastal wetlands.
Tidal marshes from the east coast of USA
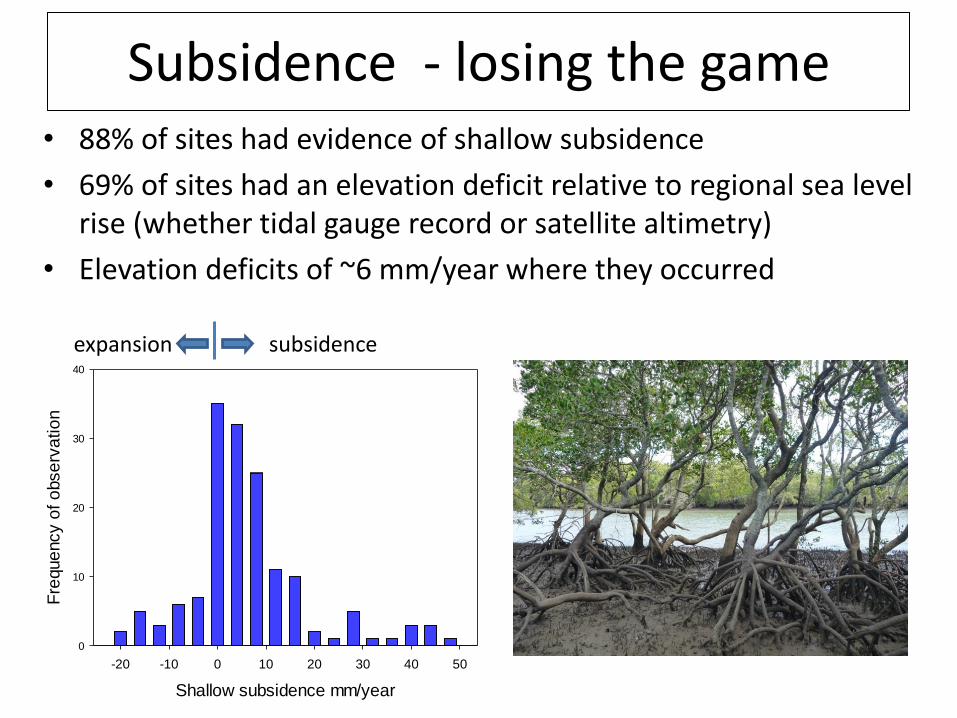
Subsidence - losing the game • 88% of sites had evidence of shallow subsidence
• 69% of sites had an elevation deficit relative to regional sea level rise (whether tidal gauge record or satellite altimetry)
• Elevation deficits of ~6 mm/year where they occurred
Shallow subsidence mm/year
-20 -10 0 10 20 30 40 50
Fre
que
ncy o
f o
bse
rva
tio
n
0
10
20
30
40
subsidence expansion

But does this indicate disaster for mangrove forests?
• The concept of elevation capital • How much loss of elevation capital before the plants cannot
grow/recruit (before they reach mean sea level)? • Elevation capital is described by the depth of the sediment
pile that is within the range that would support growth (tidal range and also where you are in the intertidal zone)
Not much elevation capital Lots of elevation capital

Elevation capital and tidal range
McKee and Patrick 1988
Elevation capital
Mean tidal range
Growth range= ~1/2 the tidal range

How long can a habitat be suitable?

A simple model
Sea level rise (mm/year)
0 5 10 15 20 25 30
Surf
ace
ele
va
tio
n g
ain
(m
m/y
ea
r)
-50
0
50
100
150
200
High sediment (>12 g m-3)
Moderate sediment (2.5 -12 g m-3)
Low sediment (<2.5 g m-3)

Estimating time to submergence
• Used a range of rates of sea level rise comparable to IPCC scenarios and a 1.4 m “extreme” scenario
• Calculated elevation deficit relative to sea level and subtracted from the elevation capital
• Assumed no horizontal migration (barriers up-slope – no capital for migration) • Conservative: assumed the forest is not lost until all the elevation capital is gone (this is
not change in forested area) • 192 simulations
Elevation capital
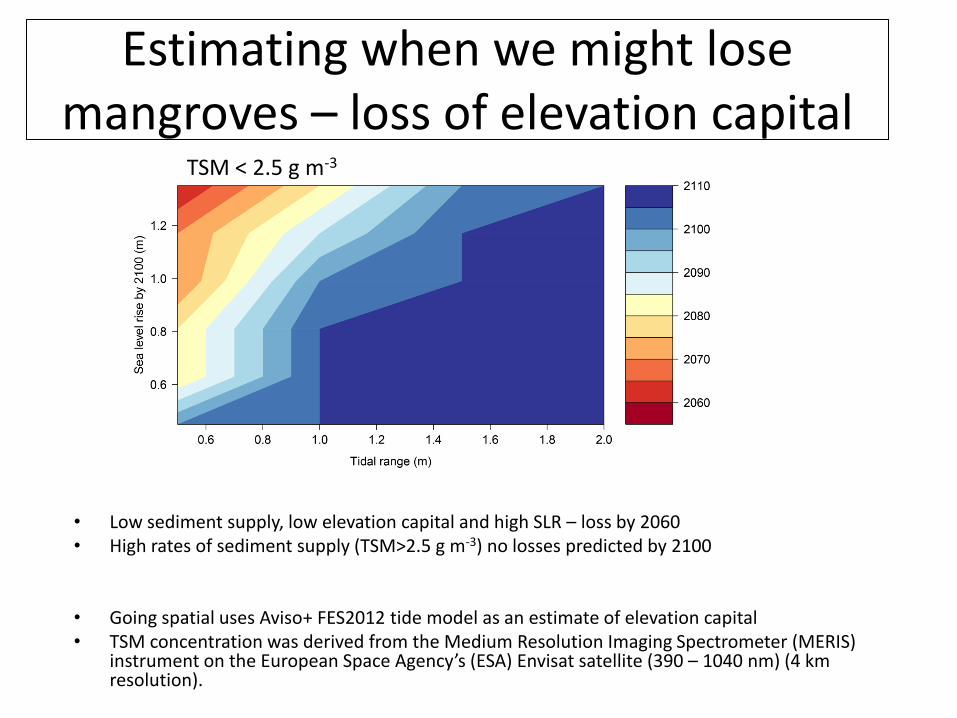
Estimating when we might lose mangroves – loss of elevation capital
• Low sediment supply, low elevation capital and high SLR – loss by 2060 • High rates of sediment supply (TSM>2.5 g m-3) no losses predicted by 2100
• Going spatial uses Aviso+ FES2012 tide model as an estimate of elevation capital • TSM concentration was derived from the Medium Resolution Imaging Spectrometer (MERIS)
instrument on the European Space Agency’s (ESA) Envisat satellite (390 – 1040 nm) (4 km resolution).
TSM < 2.5 g m-3

a b
c d
Spatial variation in vulnerability
Mangrove distribution RCP 6.0 – 0.6 m
RCP 8.5 – 0.8 m Extreme – 1.4 m
www.nature.com/articles/nature15538

RCP 8.5

RCP – 6.0

The Chao Phraya River enters the ocean near Bangkok. According to Global Forest Watch, the area’s mangroves lost nearly 8 percent of their tree cover from 2001 through 2014.
http://news.mongabay.com/2015/10/new-research-sets-doomsday-for-indo-pacific-mangroves/

Overly optimistic?
Environmental Research Letters, 2016

Woodroffe et al. 2016 Annual Review in Marine Science

Other environmental factors: Waves • Increases in wind-driven wave heights in austral winter months (Hemer et al. 2013) • Increases in wind-driven waves with intensification of ENSO (Barnard et al. 2015) • Variation in north Atlantic waves influence mangrove distribution (Walcker et al. 2016) • Sensitivity of recruitment to waves (Balke et al. 2015)

Mar
sh e
rosi
on
(d
imen
sio
nle
ss)
Wave power (dimensionless)
“Our result clearly shows that long-term salt marsh deterioration is dictated by average wave conditions, and it is, therefore, predictable.”
(2016)

Other factors: extreme events
Photo-Norm Duke

Other direct human influences: Dams
Definite Planned

Milliman and Farnsworth 2011

https://theconversation.com/dam-hard-water-storage-is-a-historic-headache-for-australia-33397
Fitzroy River
Australia – Dams on the drawing board • Reversal of past declines in water quality? • Interactions with changing rainfall

Other factors: Aquaculture
Murdiyarso et al. 2015
Kennedy Warren

Other factors: Agriculture
Richards and Friess 2016, PNAS Holmes et al. 2013, GBRMPA
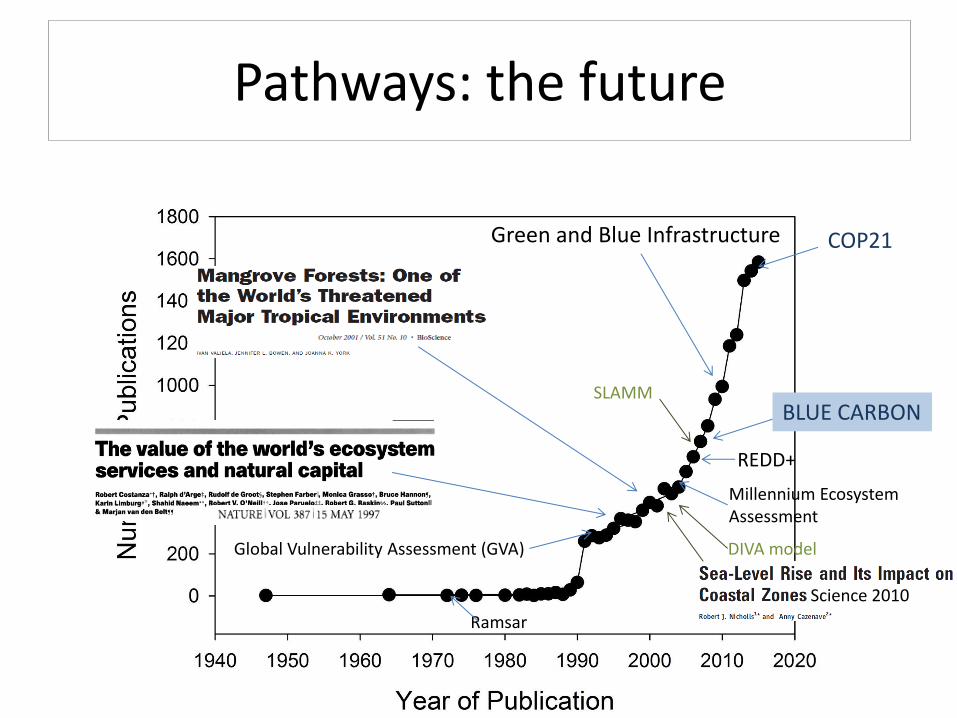
Pathways: the future
Green and Blue Infrastructure
BLUE CARBON
COP21
DIVA model
REDD+
SLAMM
Millennium Ecosystem Assessment
Global Vulnerability Assessment (GVA)
Ramsar
Science 2010

Improve the tools
• Improved modelling approaches would open up opportunities – modelling CO2 emissions or C burial (blue carbon); optimisation of coastal wetlands vs. hard infrastructure (Mills et al.
Conservation letters 2015) Some current options: • Dynamic Interactive Vulnerability Assessment Wetland Change Model
(DIVA_WCM) (e.g. Spencer et al. 2016) 85 km segments – missing a lot of detail Scores and weightings (expert opinion)
• Smaller scale modelling using tools like SLAMM (e.g. Traill et al. 2011) Not easily used by land-sea managers (needs experts) Elevation models of much of the coasts of the region are not available
• If we want to make better decisions for future of coastal wetlands we need better tools

Can carbon value of coastal wetlands compensate for the cost of extending reserve network to accommodate sea level rise?
Runting et al. Conservation Letters 2016
• Amount of land that can be preserved and still “break-even”
Details: • Modest payments for
carbon ($20/MgCO2) • Cost of land increases
with elevation • SLAMM model • Connectivity • Land already
conserved is no cost

“Working with nature” Adaptation and mitigation
• Conservation and restoration of tidal marshes and mangrove forests – Avoided GHG emissions and enhanced carbon sequestration – Restore and maintain for ecosystem services (fisheries, fuel, coastal
protection, flood protection, biodiversity) – Support local economies through restoration (Edwards et al. 2013)
• Planning for reserving ‘new’ space

Conclusions • Sediment is important to surface
elevation gains; maintaining sediment supply is important
• Subsidence reduces resilience
• A range of other environmental factors interact with rising sea level
• Development of tools
• Restoration and planning provides opportunities for ‘adaptation’

Acknowledgements • MMM4 – Candy, organizing committee, Tamar, Beth and team and sponsors • Global Change Institute, The University of Queensland • Supporters of SET sites - many, many agencies and people
Co - conspirators


![Ecosystem carbon stocks of mangroves across broad ... · Introduction Mangroves provide many ecosystem services that directly benefit biodiversity and human soci-ety [1–3]. Mangroves](https://static.documents.pub/doc/80x56/5fcb7a9d68debf2fd338ae6c/ecosystem-carbon-stocks-of-mangroves-across-broad-introduction-mangroves-provide.jpg)


