Desiccant Dehumidification Wheel Test Guide December 2000 NREL/TP-550-26131 S.J. Slayzak and J.P. Ryan National Renewable Energy Laboratory 1617 Cole Boulevard Golden, Colorado 80401-3393 NREL is a U.S. Department of Energy Laboratory Operated by Midwest Research Institute • Battelle • Bechtel Contract No. DE-AC36-99-GO10337
Transcript
Desiccant DehumidificationWheel Test Guide
December 2000 NREL/TP-550-26131
S.J. Slayzak and J.P. Ryan
National Renewable Energy Laboratory1617 Cole BoulevardGolden, Colorado 80401-3393NREL is a U.S. Department of Energy LaboratoryOperated by Midwest Research Institute •••• Battelle •••• Bechtel
Contract No. DE-AC36-99-GO10337
National Renewable Energy Laboratory1617 Cole BoulevardGolden, Colorado 80401-3393NREL is a U.S. Department of Energy LaboratoryOperated by Midwest Research Institute •••• Battelle •••• Bechtel
Contract No. DE-AC36-99-GO10337
December 2000 NREL/TP-550-26131
Desiccant DehumidificationWheel Test Guide
S.J. Slayzak and J.P. RyanPrepared under Task No. BET1.3001
NOTICE
This report was prepared as an account of work sponsored by an agency of the United Statesgovernment. Neither the United States government nor any agency thereof, nor any of their employees,makes any warranty, express or implied, or assumes any legal liability or responsibility for the accuracy,completeness, or usefulness of any information, apparatus, product, or process disclosed, or representsthat its use would not infringe privately owned rights. Reference herein to any specific commercialproduct, process, or service by trade name, trademark, manufacturer, or otherwise does not necessarilyconstitute or imply its endorsement, recommendation, or favoring by the United States government or anyagency thereof. The views and opinions of authors expressed herein do not necessarily state or reflectthose of the United States government or any agency thereof.
Available electronically at http://www.doe.gov/bridge
Available for a processing fee to U.S. Department of Energyand its contractors, in paper, from:
U.S. Department of EnergyOffice of Scientific and Technical InformationP.O. Box 62Oak Ridge, TN 37831-0062phone: 865.576.8401fax: 865.576.5728email: [email protected]
Available for sale to the public, in paper, from:U.S. Department of CommerceNational Technical Information Service5285 Port Royal RoadSpringfield, VA 22161phone: 800.553.6847fax: 703.605.6900email: [email protected] ordering: http://www.ntis.gov/ordering.htm
Printed on paper containing at least 50% wastepaper, including 20% postconsumer waste
iii
Contents
List of Figures .................................................................................................................... ivList of Tables....................................................................................................................... vAcknowledgements ............................................................................................................ viIntroduction ........................................................................................................................ 1
Definitions.................................................................................................................... 2Performance Figures of Merit ............................................................................................ 2
In the Standards............................................................................................................ 2For Wheel Designers.................................................................................................... 4For Application Engineers ......................................................................................... 10
Total Combined Uncertainty............................................................................................. 22Instrument Uncertainty Propagated into Humidity Ratio ........................................... 24Instrument Uncertainty Propagated into MRC............................................................ 28Instrument Uncertainty Propagated into RSHI ........................................................... 32Instrument Uncertainty Propagated into Moisture Mass Balance............................... 32
Safeguards ......................................................................................................................... 37High Temperature Air ................................................................................................. 37Manual Control of Fans............................................................................................... 37LiCl Wheels................................................................................................................. 37Initial Running of Rotors............................................................................................. 37
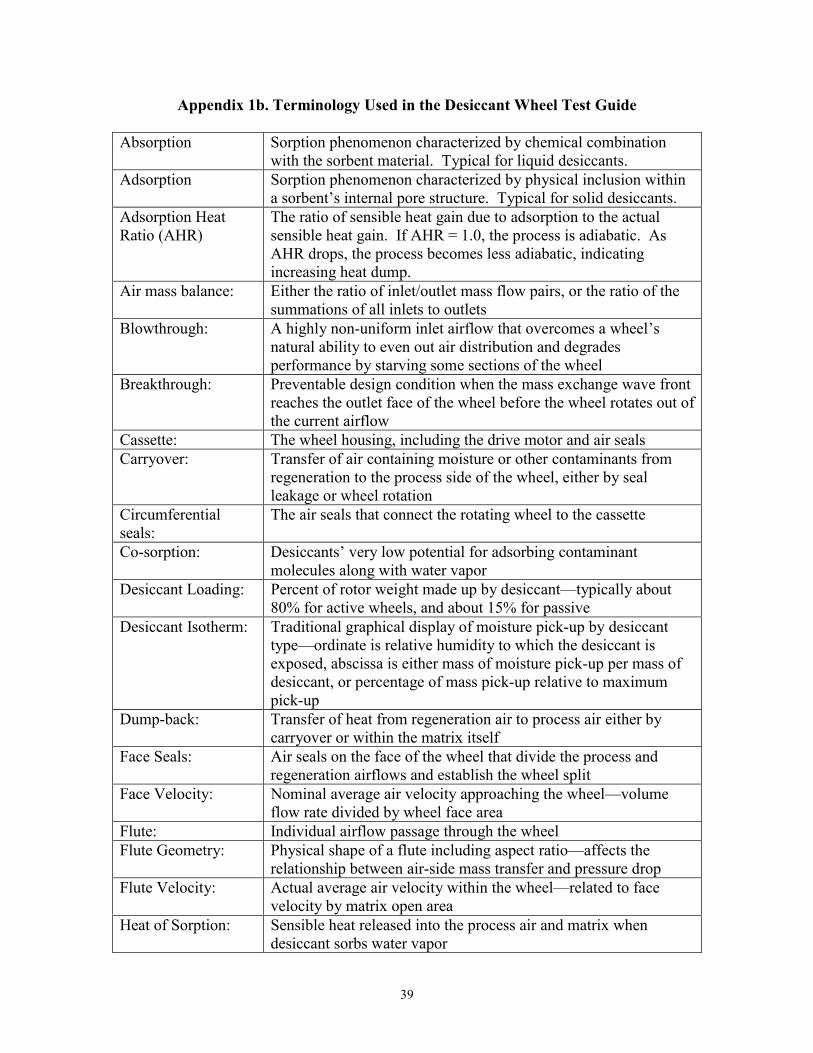
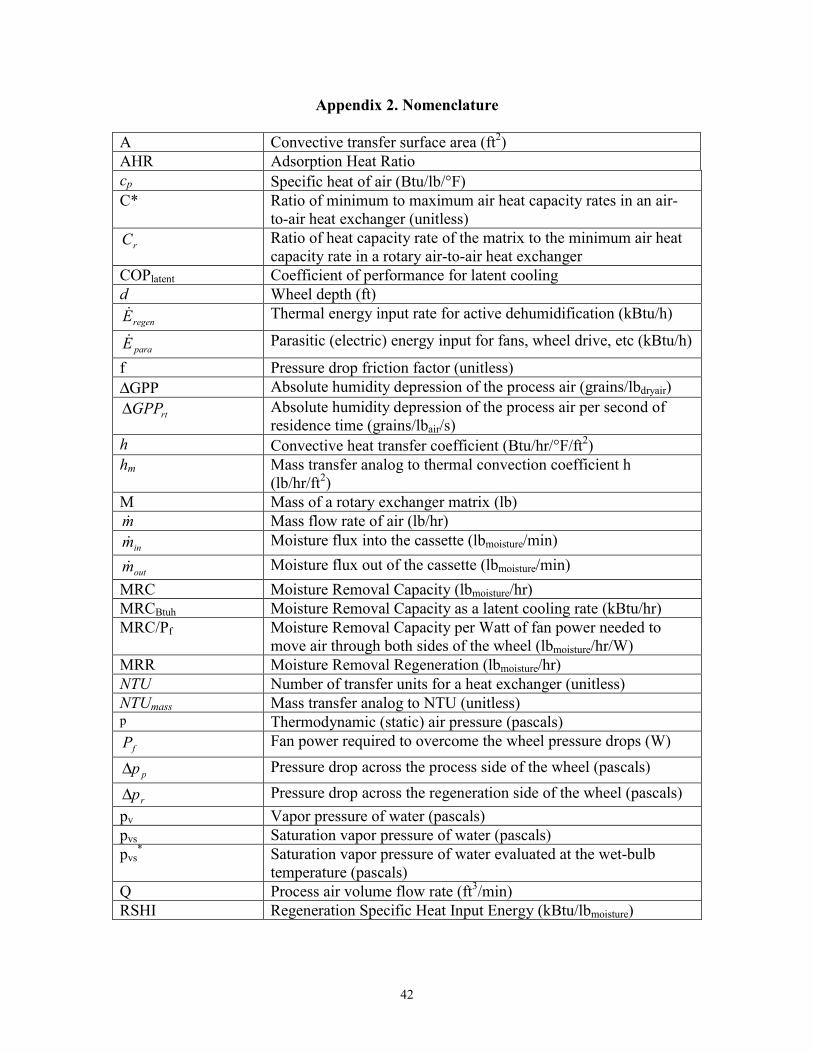
AppendicesAppendix 1a. Definitions Currently Under Consideration by ASHRAE................... 38Appendix 1b. Terminology Used in the Desiccant Wheel Test Guide ...................... 39Appendix 2. Nomenclature ...................................................................................... 42
iv
List of Figures
Figure 1. Analysis of mass transfer-to-pressure-drop ratio (St/f) for variousflute geometries ....................................................................................................... 11
Figure 2. Purge section forces a PI to RI leak to prevent RI to PO carryovercontamination inherent in wheel rotation ................................................................ 15
Figure 3. IR image of regeneration outlet air with no mixer............................................ 17Figure 4. IR image of regeneration outlet air with mixer................................................. 17Figure 5. IR image of regeneration outlet air 10 duct diameters from plenum................ 17Figure 6. Radiation shield for near-rotor inlet air temperature ........................................ 18Figure 7. Radiation shield for near-rotor inlet or outlet air temperature.......................... 18Figure 8. Instrument uncertainty in calculation of process inlet humidity ratio
(Standard 139 Accuracies)....................................................................................... 27Figure 9. Instrument uncertainty in calculation of heater inlet humidity ratio
(Standard 139 Accuracies)....................................................................................... 27Figure 10. Illustration of the three process air outlet conditions used in the
uncertainty analysis ................................................................................................. 29Figure 11. Instrument uncertainty calculation of process outlet humidity ratio
assuming an isothermal process (Standard 139 Accuracies)................................... 29Figure 12. Instrument uncertainty in calculation of process outlet humidity ratio
assuming an adiabatic process (Standard 139 Accuracies) ..................................... 30Figure 13. Instrument uncertainty in calculation of process outlet humidity
ratio assuming AHR = 0.7 (Standard 139 Accuracies) ........................................... 30Figure 14. Instrument uncertainty in calculation of regeneration outlet
humidity ratio assuming AHR = 0.7 (Standard 139 Accuracies) ............................ 31Figure 15. Instrument uncertainty in calculation of delta w on the process side
assuming an isothermal process (Standard 139 Accuracies)................................... 31Figure 16. Instrument uncertainty in calculation of MRC assuming an
isothermal process (Standard 139 Accuracies)........................................................ 34Figure 17. Instrument uncertainty in calculation of MRC assuming an
isothermal process (High Accuracy).................................................................... 34Figure 18. Instrument uncertainty in calculation of RSHI (Standard 139 Accuracies) ... 35Figure 19. Instrument uncertainty in calculation of RSHI (High Accuracy) ............... 35Figure 20. Instrument uncertainty in calculation of moisture mass balance
(Standard 139 Accuracies)....................................................................................... 36Figure 21. Instrument uncertainty in calculation of moisture mass balance
Table 1. Fundamental Wheel Parameters........................................................................... 8Table 2. ARI Rating Conditions....................................................................................... 25Table 3. Instrument Accuracies Used in Uncertainty Analysis ....................................... 25
vi
Acknowledgements
The authors would like to thank Ron Fiskum, DOE Program Manager, Office of DistributedEnergy Resources, for his guidance and support throughout this project.
1
Introduction
Desiccant cooling systems are energy efficient and environmentally benign. Accordingto one estimate, desiccant dehumidification could reduce total residential electricitydemand by 25% or more1 in humid regions, providing a drier, cleaner, more comfortableindoor environment with a lower energy bill. Desiccant systems allow more fresh air intobuildings, thus improving indoor air quality without using more energy. Desiccantsystems also displace chlorofluorocarbon-based cooling equipment, the emissions fromwhich contribute to the depletion of the Earths ozone layer.
When fresh outdoor air is brought into a building, it often carries a high humidity loadrelative to the buildings internal latent load. Conventional vapor-compression coolingsystems are not suited to efficiently treat large humidity loads. To sufficiently dry the airin many applications, vapor-compression systems must be operated at low temperatures,which reduces their efficiency and results in inefficient reheating of the dry, cold air toachieve some degree of comfort. Additionally, matters are made worse by common useof oversized compressors controlled by dry-bulb set points. This leads to short-cycling,which can reintroduce condensate from a wet cooling coil back into the supply air .
Currently, desiccant cooling and dehumidification systems are being used successfully inindustrial and various commercial markets and provide clear advantages in manyapplications throughout the United States. Desiccant cooling systems are used toimprove the indoor air quality of all types of buildings by efficiently controlling moisturein large quantities of fresh, ventilation air. In these systems, a desiccant removesmoisture from the air via a process called sorption, which releases heat and increases theair temperature. A combination of heat exchange with ambient air and evaporative orconventional cooling coils then cools the dry air. Temperature and humidity loads arevery effectively and efficiently met by separating them in this way. The desiccant is thendried out (regenerated) to complete the cycle using thermal energy supplied by naturalgas, waste heat, or the sun. Commercially available desiccants include silica gel,activated alumina, natural and synthetic zeolites, titanium silicate, lithium chloride, andsynthetic polymers. An excellent summary of desiccant technology and applications canbe found in The Desiccant Dehumidification Handbook, produced by the MuntersCorporation of Amesbury, Massachusetts.
The desiccant wheel is at the heart of these systems, providing large surface areas fordesiccant-to-air contact at pressure drops suitable for HVAC application. Two nationalstandards have recently been developed for testing and rating. They are:
• American Society of Heating, Refrigerating and Air-conditioning Engineers MOTStandard 139Method of Testing for Rating Desiccant Dehumidifiers UtilizingHeat for the Regeneration Process.
1 Houghton, D.J., R.C. Bishop, A.B. Lovins, and B.L. Stickney, with J.J. Newcomb and B.J. Davids(August 1992). State of the Art Technology Atlas: Space Cooling and Air Handling. Boulder, Colorado: E-Source, Inc.
2
• Air-conditioning and Refrigeration Institute Rating Standard 940DesiccantDehumidification Components.
ARI is also in the process of developing its Certification Program Operational Manualimplementing these two standards. This Desiccant Dehumidification Wheel Test Guideis intended to facilitate their use by certification labs and manufacturers. It is a productof more than 20 years of experience gained at the National Renewable EnergyLaboratorys (NREL) desiccant research facilities. The Test Guide details practicalexperimental experience with rotary mass exchangers in relation to the standards, and isaimed at developing this testing expertise in industry quickly and cost-effectively.
A Desiccant Dehumidifier Wheel Test Method and Rating Workshop took placeFebruary 2426, 1999, at NRELs Advanced HVAC Test Facility where the Test Guidewas presented to industry. The workshop was co-sponsored by ARI, the Gas ResearchInstitute (GRI), and the U.S. Department of Energys Office of Building EquipmentTechnology (DOE/OBT). The workshop supported the co-sponsors goal of acceleratingdesiccant technologys transition to widespread use. As a result of the workshop, severalmanufacturers and certification labs across the country have made improvements in rotortest capability. Typical areas where extra attention has been required include airflowmeasurement, humidity measurement, and rotor-face pressure differentials.
This Test Guide describes performance figures of merit that are useful in evaluatingrotary dehumidification equipment and practical advice on how to successfully measurethe physical parameters needed for calculating these figures. This Guide also calculatesrepresentative limits of uncertainty for these figures, giving experimentalists a reasonablesense of the maximum accuracy they can expect from good data in this field. This isnecessary to prevent test results from being applied in ways that are not justified by theexperimental method. Finally, we offer safeguards for testing to avoid damage toequipment and researchers.
Definitions
Definitions follow industry standards outlined in the ASHRAE Terminology of Heating,Air-conditioning, and Refrigeration. New definitions currently under consideration byASHRAE Technical Committee 3.5, Sorption and Desiccant Technology, are describedin Appendix 1a. Other terminology used in this document is included in Appendix 1b.Nomenclature for equations is in Appendix 2.
Performance Figures of Merit
In the Standards
Standard 139 defines two primary figures of merit for comparing desiccant wheelperformance. They are Moisture Removal Capacity (MRC), referred to here asperformance, and Regeneration Specific Heat Input (RSHI), referred to here as energy
3
efficiency. MRC is presented as mass of moisture removed per hour, (lbs/hr or kg/hr),and RSHI as hourly regeneration energy supplied to the device, normalized by MRC,(kBtu/lb or kJ/kg).
GPPQMRC std ∆⋅⋅=7000
160ρ (1)
MRCERSHI regen= (2)
where:
MRC = moisture removal capacity, lb/hrρstd = standard density of air, 0.075 lb/ft3
Q = process air volume flow rate, (ft3/min)GPP∆ = absolute humidity depression of the process, grains/lb
RSHI = regeneration specific heat input, kBtu/lbregenE = thermal energy input rate, kBtu/hr.
The Standard 940 rating is concerned with MRC only. Standard 139 requires theacquisition of more than 30 data points per test, allowing the calculation of several otherrelevant figures of merit that NREL has researched. Standard 139 also describes onefigure of merit that rates the test itself rather than the device being tested. That figureis Moisture Mass Balance, defined as:
MRRMRCBalanceMassMoisture /= , (3)
where MRR, Moisture Removal Regeneration, is analogous to MRC, but is calculatedusing regeneration flow rate and grain pickup across the wheel. It confirms that themeasured adsorption on the process side matches the measured desorption duringregeneration, and it must fall in the range of 0.951.05 for a test to be considered valid.This DOES NOT imply that the MRC is known to within five percent; the acceptablerange is empirical, based on decades of collective industry experience. It is a toughstandard to satisfy because of the inherent difficulty in psychrometric measurement, but abalance outside this range indicates a condition in the system that must be corrected. It isalso important to calculate the balance as defineddo not sum inlet moisture fluxes andcompare to outlet fluxes ( outin mm ) as this results in a ratio of sums rather thandifferences. This is a much easier ratio to balance and definitely allows testing underconditions that could seriously misrepresent wheel performance.
4
For Wheel Designers
Some of the fundamental physical parameters describing rotary heat/mass exchangers,sometimes classified as regenerators, are summarized in Table 1. Residence time and thebasic mass transfer parameters are critical. Residence time combines the effects of facevelocity, open area, and wheel depth. Overall mass transfer is governed by drivingpotential, airside transfer coefficient, diffusion within the desiccant, and surface area.Thermal and material sciences are used together to optimize these parameters.
The driving potential is the difference in partial pressure of water vapor between the airand the surface of the desiccant. Water vapor pressures in terrestrial dehumidificationapplications are on the order of two to five kilopascals (kPa) (0.6-1.5 in Hg) at the wheelinlet. Vapor pressures of a few hundred pascals exist locally at the wheel outlet. Vaporpressure at the desiccant surface varies with desiccant type and temperature and is on theorder of hundreds of pascals.
Airside transfer coefficient is governed by fluid dynamic phenomena and is typicallycorrelated for both heat and mass transfer to Reynolds number, Prandtl number, andgeometry, including number of transfer units (NTU). NTU relates rotor surface areaexposed to the thermal loads embodied in the airstreams.2 Prandtl number is a functionof air thermophysical properties. Reynolds number is a ratio of momentum to viscousforces. Air velocity enters the correlations in the momentum term. The correlationschange to reflect the flow regime present in the flutes. Flute velocity determines theregime, which may be roughly categorized as laminar or turbulent. In laminar flow,viscous forces dominate, so that nearly all air motion is in the direction of the bulk flow,along the axis of the flute. In turbulent flow, momentum is strong enough to producesubstantial eddies within the bulk flow that continuously mix the air as it passes throughthe flute. This mixing generally means turbulent flow produces higher heat/masstransfer, but in doing so, also generates higher-pressure drops. The pressure dropsincurred by turbulent airflow put an unacceptable load on the face and circumferentialseals and drastically increase seal wear and fan power requirements. Laminar flow keepspressure drops within HVAC application ranges and has the added benefit of keeping theinternal surfaces of the matrix relatively clean because airflow moving parallel to theflute walls tends not to deposit dirt there.
NTU is a figure of merit commonly applied to heat exchangers that can also be applied torotary mass exchangers. It is typically defined for the thermal component as the ratio ofconvective heat transfer at a given matrix-to-air temperature potential to the thermalcapacity of the air over that potential:
jpairjpairj cm
AhTcm
TAhNTU
=
∆∆=
(4)
where: 2 Number of transfer units, NTU, is a function of convective transfer coefficient, making the correlationsrecursive.
5
NTU = number of transfer unitsT = temperaturej = hot or cold side of the wheelm = mass flowrate of airh = convective heat transfer coefficientcp = specific heat of airA = convective transfer surface area.
This calculation must be performed on the hot and cold sides of the wheel (j) separately.The resulting values can be combined with the use of the parameter C*:
hotcoldtotalthermal NTUC
NTUNTU*11
,
+= (5)
where C* is the ratio of minimum to maximum air heat capacity rates:
( )( )
max
min*pair
pair
cmcm
C
= . (6)
Heat exchange effectiveness for a direct counterflow heat exchanger is then calculatedwith total NTU:
1,
,
+=
totalthermal
totalthermalcf NTU
NTUε (7)
where:
εcf = heat exchange effectiveness.
Heat exchange effectiveness (and thereby outlet temperatures) for a rotary exchanger isthen correlated using a parameter tailored to rotary devices that represents the thermalcapacitance of the matrix:3
( )( )
( )( )
( ) PIRI
RORI
p
Rp
PIRI
PIPO
p
Pp
rcf TT
TTcmcm
TTTT
cmcm
C −−=
−−=
−=
minmin93.19
11
εε
( )( )
minp
matrixpr cm
McC
φ= (8)
3 These correlations are valid for values of Cr over 0.4 (high wheel speed; temperature does not vary withrotational angle but with distance through the wheel only). This is the case for enthalpy exchangers;dehumidifiers might have a heat capacitance one-tenth this value. The concept applied here to thermalpotentials is often also applied to enthalpy.
6
where:
M = the mass of the matrixφ = its rotational frequency.
NTU for mass transfer is similarly defined:
j
jjmjmass m
AhNTU
,, = (9)
where:
hm = the mass transfer analog to thermal convection coefficient h.
Mass transfer parameters are modeled analytically by heat transfer analogy or computednumerically.
Diffusion and surface area are closely related in wheel dynamics. Given the restrictionsof residence time, the limitations of the former require a lot of the latter to achieveacceptable grain depression. Air is in contact with the desiccant only for a fewhundredths of a second, making mass transfer for a given flute primarily a surfacephenomenon. When performance depends on a single pass, surface area is critical ininherently slower processes like mass diffusion in solids. Diffusion comes into play asthe desiccant/matrix slowly rotates within the same airflow; mass diffusion within thedesiccant must keep the surface as dry as possible (on the adsorption side) until it can beregenerated and vice-versa during desorption.4
Maximizing surface area means packing a lot of matrix into as small an area as possible,which leads to flutes with small cross sections. This is convenient because laminar flowis best achieved in small flow channels. This also means matrix walls should be as thinas possible to maximize open area and keep flute velocities as low and residence time aslong as possible. This too is convenient because thin walls are less likely to wasteunexposed desiccant by relying on slower solid-side diffusion to utilize drying potential.Surface area as a function of matrix design is complimented by the effect chemistry canproduce with desiccant pore structure. Silica gels typically have on the order of 100million square feet of surface area within their pores for each cubic foot of material.Activated carbon has several times that volumetric surface area but has lower water vaporuptake because its pore void space is too small to hold much water.
Residence time is the result of a number of important parameters. We propose theformulation of a fundamental performance figure of merit grain depression per unit ofresidence time.
4 In slowly rotating dehumidifier wheels, solid-side diffusion can be a bottleneck to convective masstransfer, indicated by another fundamental figure of merit, Lewis number (Le) = NTU/NTUmass, when ittakes values greater than unity.
7
dV
GPPd
VQ
MRCGPP flfl
stdrt 603600
7000 ∆==∆ρ
(10)
where:
rtGPP∆ = absolute humidity depression per second of residence time, grains/lbair/sMRC = moisture removal capacity, lb/hrVfl = flute velocity, ft/minQ = process air volume flowrate, ft3/mind = wheel depth, ft.
This simultaneously normalizes tests for differing face velocities, open areas, and wheeldepths and would be of interest to a rotor designer trying to maximize mass transfer perunit of desiccant contact area.
RSHI is an indicator of energy consumed by the regeneration heater. This type of figureis entirely appropriate for a standard where its primary purpose is calculating energyconsumption for dehumidifiers. RSHI can be used for this purpose at the rated facevelocity only and does not include the effect of a heat exchanger that can be employed atthe process air outlet to recover heat of adsorption and preheat regeneration air. Thisconfiguration is commonly found in ventilation air conditioning applications. To includethe effect of heat recovery, we use the term RSHIHX.
−−
−=PIRI
PIPOHXHX TT
TTRSHIRSHI
)(1
ε(11)
where:εHX = the heat exchanger effectiveness.
This formulation assumes the PI and the heater receive air from the same source, and theheat exchanger is operated with balanced airflows, as is the case with many ventilationair pre-conditioners. This figure is particularly useful in comparing the efficiency ofwheels with different face splits. For example, 50/50-split wheels often have very highRSHI compared to 75/25 wheels.5 However, due to their lower regeneration temperature,50/50 wheels are among the most efficient in terms of RSHIHX.
Regeneration specific heat drop (RSHD) is an indicator of the energy consumed by thewheel.
MRCTTcm
MRCE
RSHD RORIpROdrop )( −==
(12)
5 RSHI for 50/50 wheels is often higher than 75/25 wheels by 25%-50% or more.
8
RSHD focuses on the energy performance of the matrix itself by focusing on sensibleenergy drop in the regeneration air as it passes through the wheel rather than the energysupplied to the regeneration air. It is very nearly independent of face velocity for manywheel configurations, although there are exceptions. RSHD is also much less sensitive tomass-flow ratio than RSHI, again for many wheels but not all, and trends in the oppositedirection as RSHI in some instances. Unlike high RSHI, high RSHD does not necessarilyindicate reduced efficiency. High RSHD may indicate poor grain depression, as mightRSHI, or it may show that the wheel is able to utilize lower temperature air forregeneration, or that the matrix is picking up a lot of heat. RSHI does not register theseand other phenomena on it own. RSHD is a distinct parameter that adds to theunderstanding of a wheels energy consumption characteristics.
Heat dump-back is another feature of dehumidifier wheels that becomes important whenprocess outlet temperature is a design requirement. Some processes benefit from thesensible energy evolved from the desiccation process; for others, this represents a loadthat must be removed. In quantifying heat dump-back, we calculate adsorption heat ratio:
PIPO
PIadiabaticPO
TTTT
AHR−
−= , (13)
where:
AHR = adsorption heat ratioTPO = temperature achieved upon reaching measured grain depression.
TPO,adiabatic is the temperature achieved upon reaching the measured grain depression withno change in enthalpyessentially evaporative cooling in reverse. If AHR = 1.0, theprocess is adiabatic. Fractional AHR indicates the degree of heat dump-back.
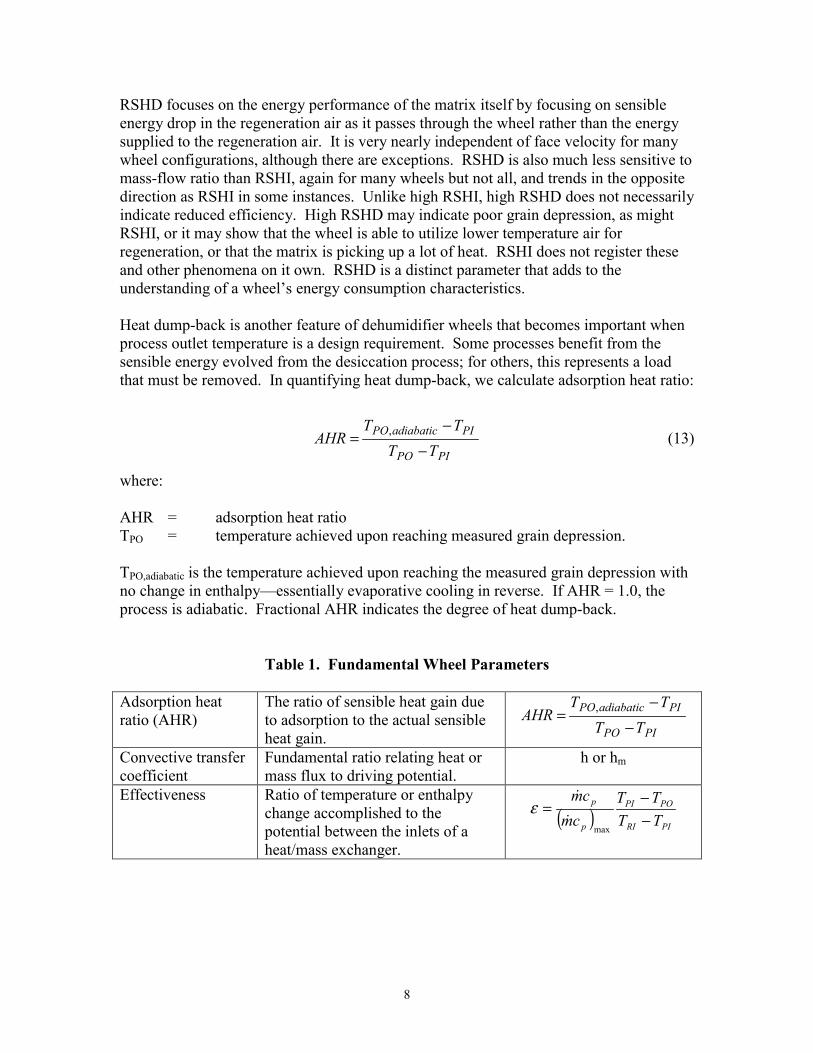
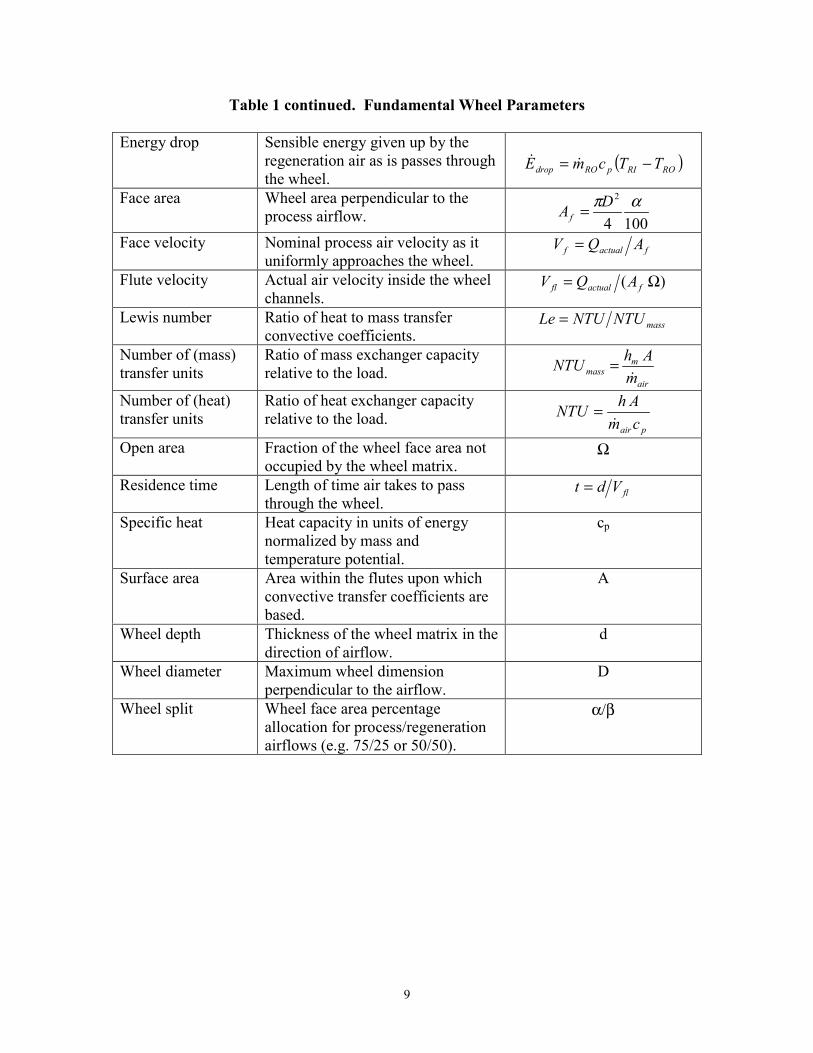
Table 1. Fundamental Wheel Parameters
Adsorption heatratio (AHR)
The ratio of sensible heat gain dueto adsorption to the actual sensibleheat gain. PIPO
PIadiabaticPO
TTTT
AHR−
−= ,
Convective transfercoefficient
Fundamental ratio relating heat ormass flux to driving potential.
h or hm
Effectiveness Ratio of temperature or enthalpychange accomplished to thepotential between the inlets of aheat/mass exchanger.
( ) PIRI
POPI
p
p
TTTT
cmcm
−−
=max
ε
9
Table 1 continued. Fundamental Wheel Parameters
Energy drop Sensible energy given up by theregeneration air as is passes throughthe wheel.
( )RORIpROdrop TTcmE −=
Face area Wheel area perpendicular to theprocess airflow. 1004
2 απDAf =
Face velocity Nominal process air velocity as ituniformly approaches the wheel.
factualf AQV =
Flute velocity Actual air velocity inside the wheelchannels.
)( Ω= factualfl AQV
Lewis number Ratio of heat to mass transferconvective coefficients.
massNTUNTULe =
Number of (mass)transfer units
Ratio of mass exchanger capacityrelative to the load.
air
mmass m
AhNTU
=
Number of (heat)transfer units
Ratio of heat exchanger capacityrelative to the load.
pair cmAhNTU
=
Open area Fraction of the wheel face area notoccupied by the wheel matrix.
Ω
Residence time Length of time air takes to passthrough the wheel.
flVdt =
Specific heat Heat capacity in units of energynormalized by mass andtemperature potential.
cp
Surface area Area within the flutes upon whichconvective transfer coefficients arebased.
A
Wheel depth Thickness of the wheel matrix in thedirection of airflow.
d
Wheel diameter Maximum wheel dimensionperpendicular to the airflow.
D
Wheel split Wheel face area percentageallocation for process/regenerationairflows (e.g. 75/25 or 50/50).
α/β
10
For Application Engineers
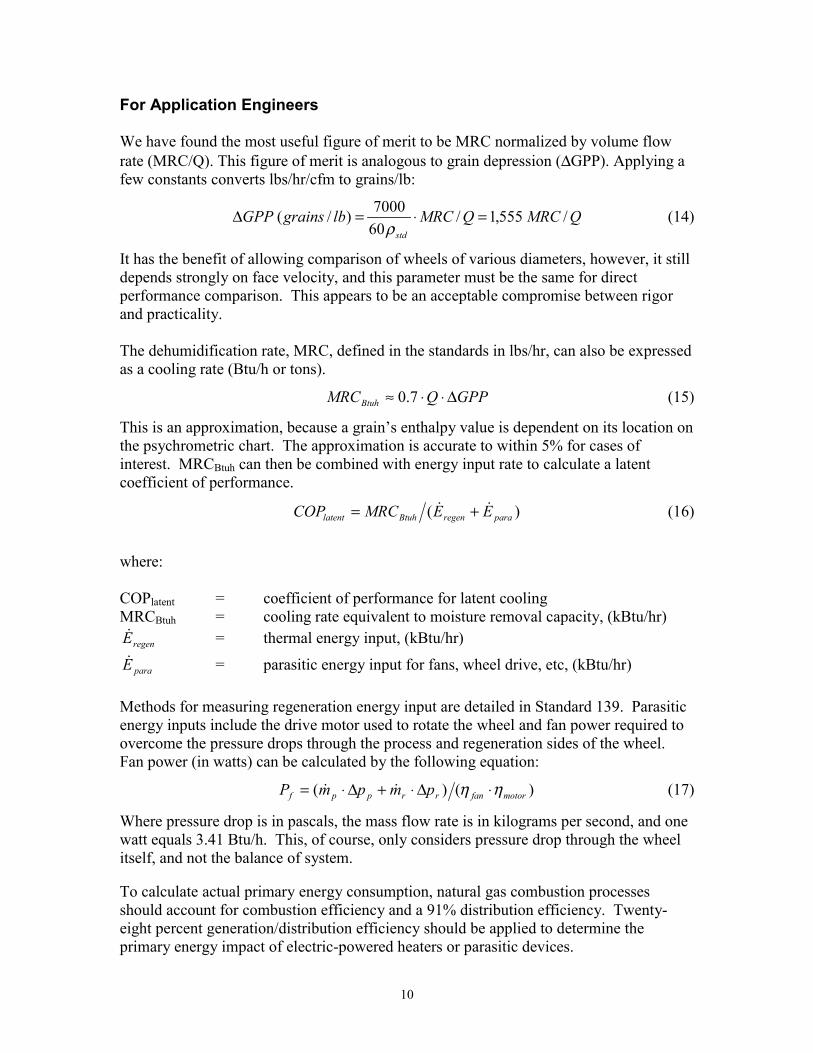
We have found the most useful figure of merit to be MRC normalized by volume flowrate (MRC/Q). This figure of merit is analogous to grain depression (∆GPP). Applying afew constants converts lbs/hr/cfm to grains/lb:
QMRCQMRClbgrainsGPPstd
/555,1/607000)/( =⋅=∆
ρ(14)
It has the benefit of allowing comparison of wheels of various diameters, however, it stilldepends strongly on face velocity, and this parameter must be the same for directperformance comparison. This appears to be an acceptable compromise between rigorand practicality.
The dehumidification rate, MRC, defined in the standards in lbs/hr, can also be expressedas a cooling rate (Btu/h or tons).
GPPQMRCBtuh ∆⋅⋅≈ 7.0 (15)
This is an approximation, because a grains enthalpy value is dependent on its location onthe psychrometric chart. The approximation is accurate to within 5% for cases ofinterest. MRCBtuh can then be combined with energy input rate to calculate a latentcoefficient of performance.
)( pararegenBtuhlatent EEMRCCOP += (16)
where:
COPlatent = coefficient of performance for latent coolingMRCBtuh = cooling rate equivalent to moisture removal capacity, (kBtu/hr)
regenE = thermal energy input, (kBtu/hr)
paraE = parasitic energy input for fans, wheel drive, etc, (kBtu/hr)
Methods for measuring regeneration energy input are detailed in Standard 139. Parasiticenergy inputs include the drive motor used to rotate the wheel and fan power required toovercome the pressure drops through the process and regeneration sides of the wheel.Fan power (in watts) can be calculated by the following equation:
)()( motorfanrrppf pmpmP ηη ⋅∆⋅+∆⋅= (17)
Where pressure drop is in pascals, the mass flow rate is in kilograms per second, and onewatt equals 3.41 Btu/h. This, of course, only considers pressure drop through the wheelitself, and not the balance of system.
To calculate actual primary energy consumption, natural gas combustion processesshould account for combustion efficiency and a 91% distribution efficiency. Twenty-eight percent generation/distribution efficiency should be applied to determine theprimary energy impact of electric-powered heaters or parasitic devices.
11
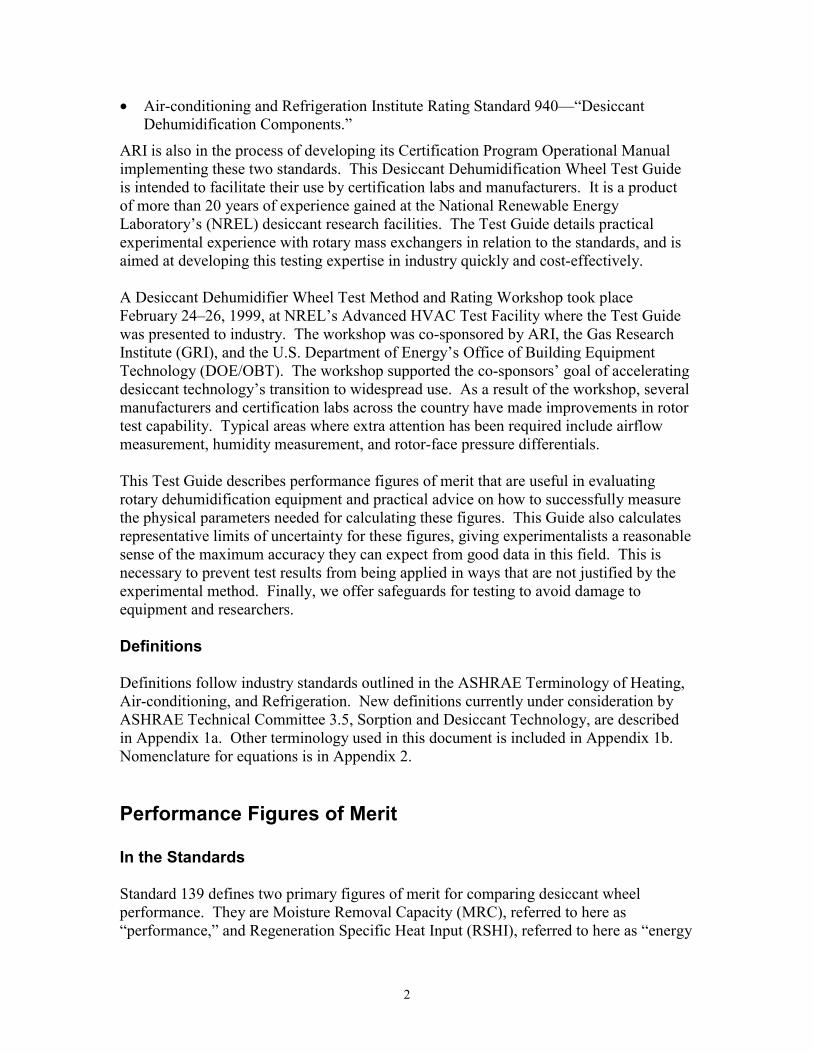
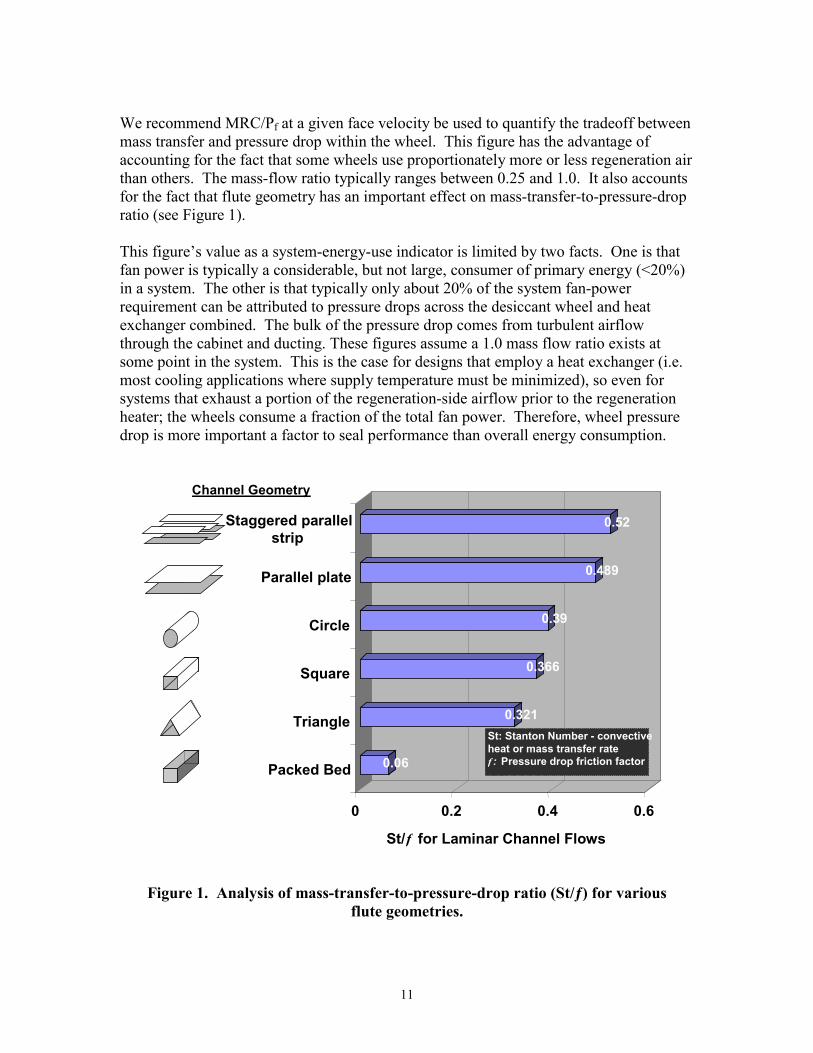
We recommend MRC/Pf at a given face velocity be used to quantify the tradeoff betweenmass transfer and pressure drop within the wheel. This figure has the advantage ofaccounting for the fact that some wheels use proportionately more or less regeneration airthan others. The mass-flow ratio typically ranges between 0.25 and 1.0. It also accountsfor the fact that flute geometry has an important effect on mass-transfer-to-pressure-dropratio (see Figure 1).
This figures value as a system-energy-use indicator is limited by two facts. One is thatfan power is typically a considerable, but not large, consumer of primary energy (<20%)in a system. The other is that typically only about 20% of the system fan-powerrequirement can be attributed to pressure drops across the desiccant wheel and heatexchanger combined. The bulk of the pressure drop comes from turbulent airflowthrough the cabinet and ducting. These figures assume a 1.0 mass flow ratio exists atsome point in the system. This is the case for designs that employ a heat exchanger (i.e.most cooling applications where supply temperature must be minimized), so even forsystems that exhaust a portion of the regeneration-side airflow prior to the regenerationheater; the wheels consume a fraction of the total fan power. Therefore, wheel pressuredrop is more important a factor to seal performance than overall energy consumption.
Figure 1. Analysis of mass-transfer-to-pressure-drop ratio (St/) for variousflute geometries.
0.06
0.321
0.366
0.39
0.489
0.52
0 0.2 0.4 0.6
St/f for Laminar Channel Flows
Packed Bed
Triangle
Square
Circle
Parallel plate
Staggered parallelstrip
Channel Geometry
St: Stanton Number - convectiveheat or mass transfer ratef : Pressure drop friction factor
12
Differential Pressure Measurement
Standard 139 calls for the measurement of pressure differential according to ASHRAEStandard 41.31989 across the regeneration and process sides of the wheel. It is equallyimportant to measure the PI-RO and RI-PO face pressure differentials6. Maintainingreasonable face differentials is critical to successful testing. Subjecting the face seals todifferentials larger than 2 w.c. will often lead to poor performance assessment ofcommercial products. Face differentials may have to be maintained even lower whentesting prototypes. All four differentials need not be continuously monitored; so twoseparate sensors can do the job. Once reasonable face differentials have been established,these sensors can easily be switched over to monitor wheel pressure drops.
Leaks from inlets to outlets affect actual face velocities and contaminate outlet flows. Inthe field, fans are often arranged in blow/draw configuration to preserve grain depressionin the supply air. Supply air is blown through the wheel, and regeneration air is drawnthrough. This prevents any regeneration air from forcing its way into the process side ofthe cassette, which can seriously degrade performance. In the laboratory, it helps toutilize four fansone on each inlet and outlet7. In this way, face pressures can be variedto either minimize face differentials or simulate field conditions to test seal integrity. Iffour fans are not used, minimize face differentials by minimizing pressure drops on thewheel inlets/outlets opposite the fans.
Moisture Mass Balance and MRC
Leakage across face seals is a common condition that prevents moisture mass balance.The seals on commercial units typically will allow balance when face differentials arekept below 2 w.c. A balance of less than 1.0 usually indicates leakage from RI to PO,and degradation in MRC. The bone-dry PO air is very susceptible to small leaks of wetregeneration air. If the test system does not employ four fans, it may be necessary toinduce a pressure drop on the PO ductwork to stop the leak8.
Circumferential seals typically do not contribute to poor moisture mass balance oncommercial wheels. If a cassette is sealed fairly airtight, any circumferential leak wouldhave to bypass the wheel, passing through two circumferential seals. This effectivedouble-sealing forces the path of least resistance to be through the wheel9. If the
6 Section 6.15.7 of Standard 139 calls for the measurement of RI-PO differential, but it is not included onthe sample data sheet or the system diagram. We recommend recording this value.7 The only concern about negative duct pressures in the lab is that leaks into the system can easilycontaminate outlet airflows prior to measurement.8 To achieve the most accurate measurement of a wheels performance, the pressure differential across theRI-PO face seal should be held at zero. This will minimize leakage between these two airstreams and theRI and PO flow rates will be measurements of the air actually passing through the wheel. In this case, theprocess outlet airflow should be used in the calculation of MRC (Eq. 1). This will force the moisture massbalance to be greater than 1; however, a well-sealed wheel will still produce a moisture mass balancewithin 5% of 1.9 This is true for typical, low-pressure-drop commercial wheels. A deep industrial wheel may havesufficient airflow resistance to force some air to bypass.
13
cassette is open to lab pressure, it is easier for air to escape through circumferential seals.This is particularly true if the wheel is not supported by an axle and is shipped on its face.The rotor is fairly heavy, and will tend to compress the circumferential seal it rests on.When the cassette is placed upright, a gap is formed if the seal cannot spring backsufficiently. Leaks such as these will lower the actual air mass flow through the wheelafter it has been measured10. The resulting air velocity through the wheel will be lowerthan expected, enhancing grain depression across the wheel slightly11. If circumferentialleaks leave the cassette, they will lead to a high bias in calculation of MRC as defined inStandard 139.
Cyclic Pressure Flux
Monitoring pressure differentials serves another important purpose. Wheel matrices aregenerally not perfectly uniform, in either open area or desiccant loading, and excessdesiccant or compressed flutes will tend to restrict the air passages. This means airflowresistance varies with circumferential location. If the wheel has sufficient authority in theairflow circuit, its rotation will cycle the flow rates in synch with its frequency. It alsomeans that performance can vary the same way. This is most noticeable in theregeneration airflow of 75/25 split wheels, where a non-uniformity in the matrix canoccupy the greatest percentage of flow area. The amplitude of the cycle is not typicallylarge enough to be detrimental to performance measurement, but fluctuating pressure canseverely tax some duct-based psychrometric control schemes.
For example, steam injection was used to control humidity in the original design of ourAdvanced HVAC Test Facility. At low regeneration flow rates typical for small 75/25wheels, humidity control was extremely difficult to maintain because injection ratedepended both on injector valve position and duct-boiler pressure differential. It wasdifficult to modulate the valve adequately to compensate for both boiler pressurefluctuations and the cyclic variations in airflow and duct pressure caused by the rotatingwheel. Our current humidifiers, evaporative saturators, are airside-limited devices andtherefore provide very even humidification under such conditions.
This control issue should not affect the psychrometric chamber-based conditioningapproach typically employed in the HVAC certification industry. Keeping wheel-non-uniformity in mind, however, can be a useful troubleshooting tool. When faced withunexpected results, measurements that do not follow the cyclic pattern can immediatelybe identified as suspect. One of the first steps in troubleshooting an experiment should beto check the frequency of a phenomenon to see if it coincides with wheel rotation.
10 Standard 139 section 9.2 calls for calculations based on inlet flow rates. Inlet air mass flow rates shouldbe checked against the outlets. Mass flow rate agreement within 3% is an indication that circumferentialleakage is not a problem. It is also useful to periodically short the inlet and outlet ducts as a checkagainst each other.11 The relationship between face velocity and grain depression is not one-to-onea 10% reduction in facevelocity would not produce a 10% rise in grain depression. However, it could be an unacceptable fewpercent.
14
Flow MeasurementStandard 139 calls for the measurement of airflow rates according to ASHRAE Standard41.2-1987 (RA 92).
Purge Sections/Carryover
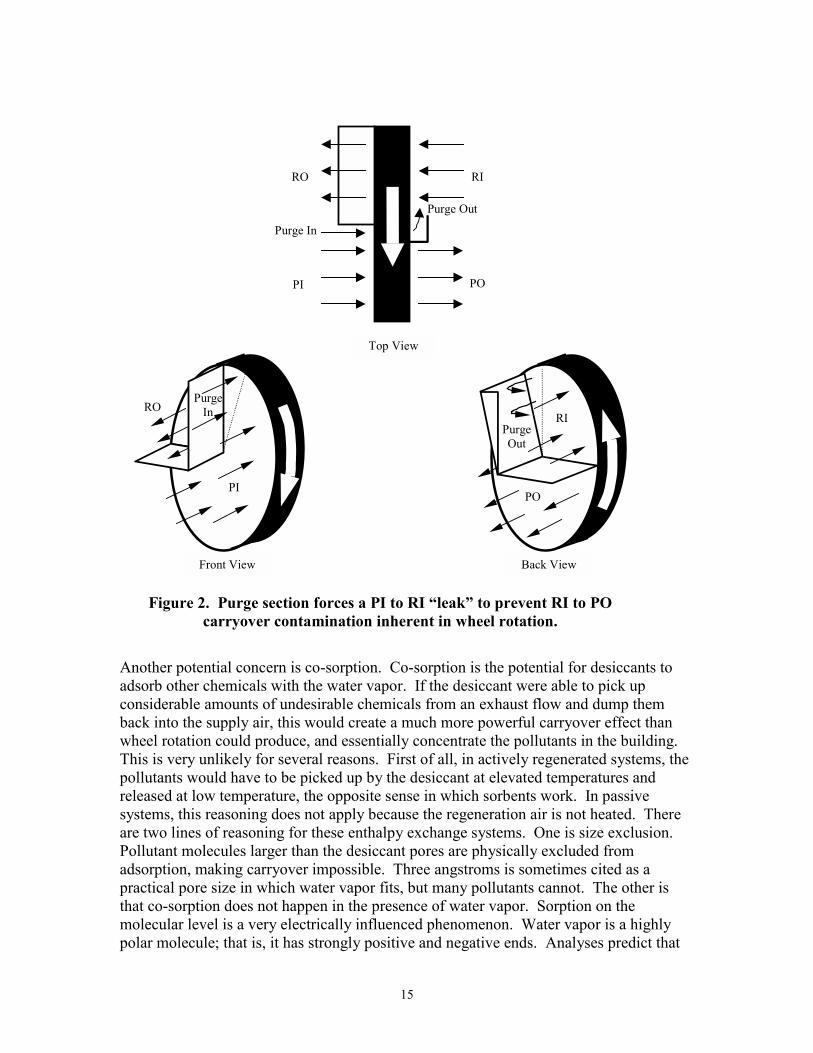
As the matrix rotates out of the regeneration airflow, it carries with it both regenerationair trapped in the flutes and heat, contained in the air and in the matrix itself. Thisamounts to a small, constant rotation leak or carryover from RI to PO, which isacceptable in most instances. Purging purposely misaligns one of the seals on the RI/POface of the wheel to eliminate this leak by forcing a purge leak from PI to RI. Figure 2diagrams the purge concept. Purge sections are not addressed by either standard, but arecommonly used in industrial applications when very low PO dew points are required.Purges can also be necessary in applications that demand minimal carryover ofregeneration air into the supply air.
One of the reasons purge was not included in the test standards is that it would be verydifficult to monitor in the lab. The purge section is extremely compact. Sampling is notlikely to provide useful results. The entire purge flow would have to be extracted,measured, and reintroduced to the RI flow. This would require substantial modificationto the cassette and seals and would certainly affect performance. Moisture mass balancecould not be calculated without monitoring the purge flow in this way.
In low dew-point applications, the purge is designed to pre-cool the matrix before itbegins to condition supply air. This is necessary because hot desiccant does not adsorbvery well; without a purge, the first several degrees of rotation do very littledehumidification, allowing untreated air into the process outlet. This is in addition tocarryover from regeneration air trapped in the flutes by wheel rotation. Purge is veryeffective at eliminating these performance inhibitors.
In the case of carryover, the purge prevents regeneration air trapped in the flutes fromcarrying contaminants into the supply air. This could be a concern if the unit is direct-fired and if there are combustion products in the regeneration air, or if the regenerationair comes from an indoor or outdoor source that may have high levels of volatile organiccompounds (VOCs) or other pollutants. For example, if building exhaust air is used forregeneration, and the interior is emitting high levels of VOCs (e.g. new construction), RIto PO carryover reduces the effectiveness of the ventilation air for maintaining indoor airquality. Generally speaking, seal leakage and rotation carryover combined are not largeenough to be a concern.
15
Another potential concern is co-sorption. Co-sorption is the potential for desiccants toadsorb other chemicals with the water vapor. If the desiccant were able to pick upconsiderable amounts of undesirable chemicals from an exhaust flow and dump themback into the supply air, this would create a much more powerful carryover effect thanwheel rotation could produce, and essentially concentrate the pollutants in the building.This is very unlikely for several reasons. First of all, in actively regenerated systems, thepollutants would have to be picked up by the desiccant at elevated temperatures andreleased at low temperature, the opposite sense in which sorbents work. In passivesystems, this reasoning does not apply because the regeneration air is not heated. Thereare two lines of reasoning for these enthalpy exchange systems. One is size exclusion.Pollutant molecules larger than the desiccant pores are physically excluded fromadsorption, making carryover impossible. Three angstroms is sometimes cited as apractical pore size in which water vapor fits, but many pollutants cannot. The other isthat co-sorption does not happen in the presence of water vapor. Sorption on themolecular level is a very electrically influenced phenomenon. Water vapor is a highlypolar molecule; that is, it has strongly positive and negative ends. Analyses predict that
Top View
RO RI
PO
Purge In
PI
Purge Out
PO
Back View
RIPurgeOut
PI
Front View
ROPurge
In
Figure 2. Purge section forces a PI to RI leak to prevent RI to POcarryover contamination inherent in wheel rotation.
16
desiccants will always adsorb the most polar molecules first. Experience shows this to betrue. Even ammonia, which is moderately polar, is not picked up in appreciablequantities when water vapor is present. Carryover does not currently appear to be anissue for rotary desiccant equipment, but it should be kept in mind for each newapplication.
Air Mass Balance
Outlet and inlet nozzles should be checked against each other as a quality-of-test figure ofmerit in parallel with moisture mass balance. This air mass balance can take a couple offorms and is useful when troubleshooting. In one form, inlet flows should be summedand compared to the sum of the outlet flows. This balance will remain between 1.00 and1.02 when there are no substantial leaks out of the system. In another form, the massflows of inlet/outlet pairs should be compared to each other. They should match withinthe 3% experimental uncertainty called for in the standard. Each level of air massbalance can be a clue to narrowing down a problem with the device under test or the testrig itself.
Airflow Uniformity/Blowthrough
Another important consideration in testing rotary equipment related to airflow isuniformity. The desiccant wheel typically has a relatively high pressure drop (~1w.c.).This is convenient for testing because it helps even out the airflow distribution upstreamof the wheel. Improper ducting, however, can overcome this feature and present a verynon-uniform air distribution that will degrade performance. Introducing inlet air tooclose to the wheel or at an odd angle through too small a duct can cause thisblowthrough. It starves some portions of the wheel, and raises flute velocities in othersfor a net negative effect on performance. Transitions and/or flow conditioning baffles arein order to ensure reasonable uniformity within several percent.
Introducing air at an odd angle is of particular concern in testing desiccant wheels.Flexible ducting is often required to connect the test rig to the wide range of availableequipment sizes. This required flexibility leaves the possibility that ductwork ends up atnon-ideal angles that can contribute to blowthrough. Introducing air in this way can alsoseverely affect standard pressure taps. Conventional design relies on parallel flow alongthe duct axis. Impinging flow on the pressure tap will naturally ruin the measurement.Take note of the pressure drops across the wheel from test to test and compare inlet/outletflows to guard against this. Move flexible ducts around during steady state testing to besure their positions dont affect results.
17
Min Mean Max 155.9169.3
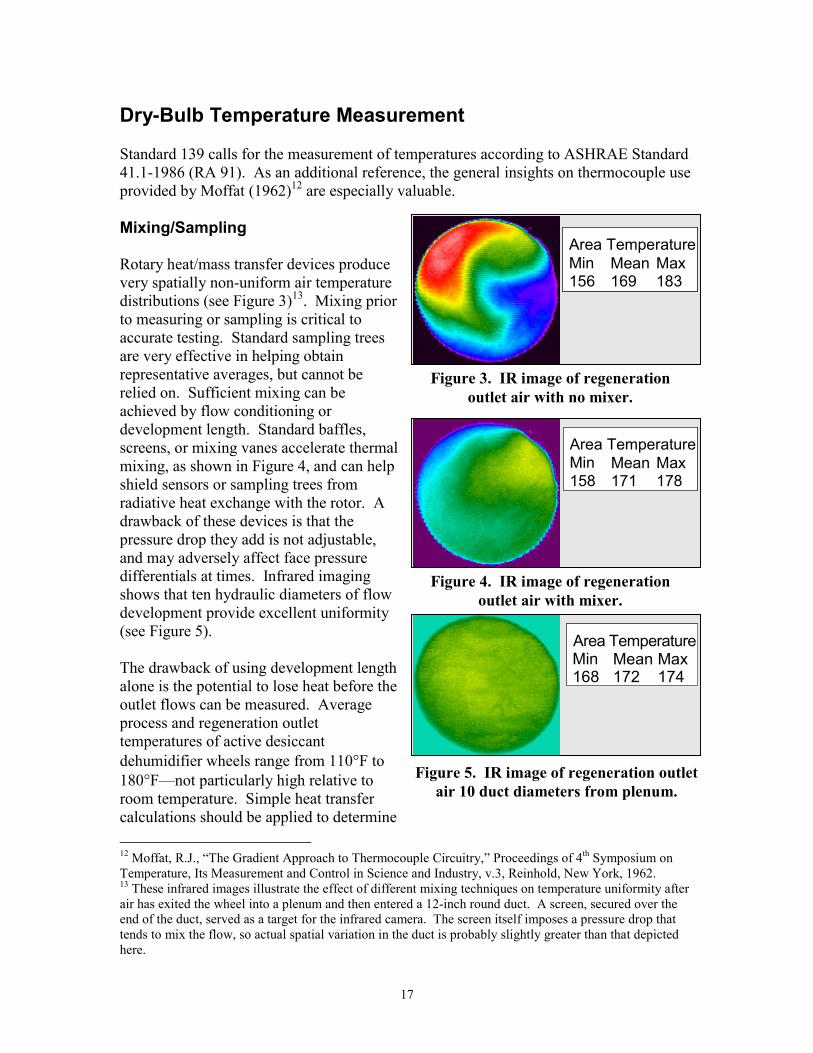
Area TemperatureMin Mean Max 156 169 183
Dry-Bulb Temperature Measurement
Standard 139 calls for the measurement of temperatures according to ASHRAE Standard41.1-1986 (RA 91). As an additional reference, the general insights on thermocouple useprovided by Moffat (1962)12 are especially valuable.
Mixing/Sampling
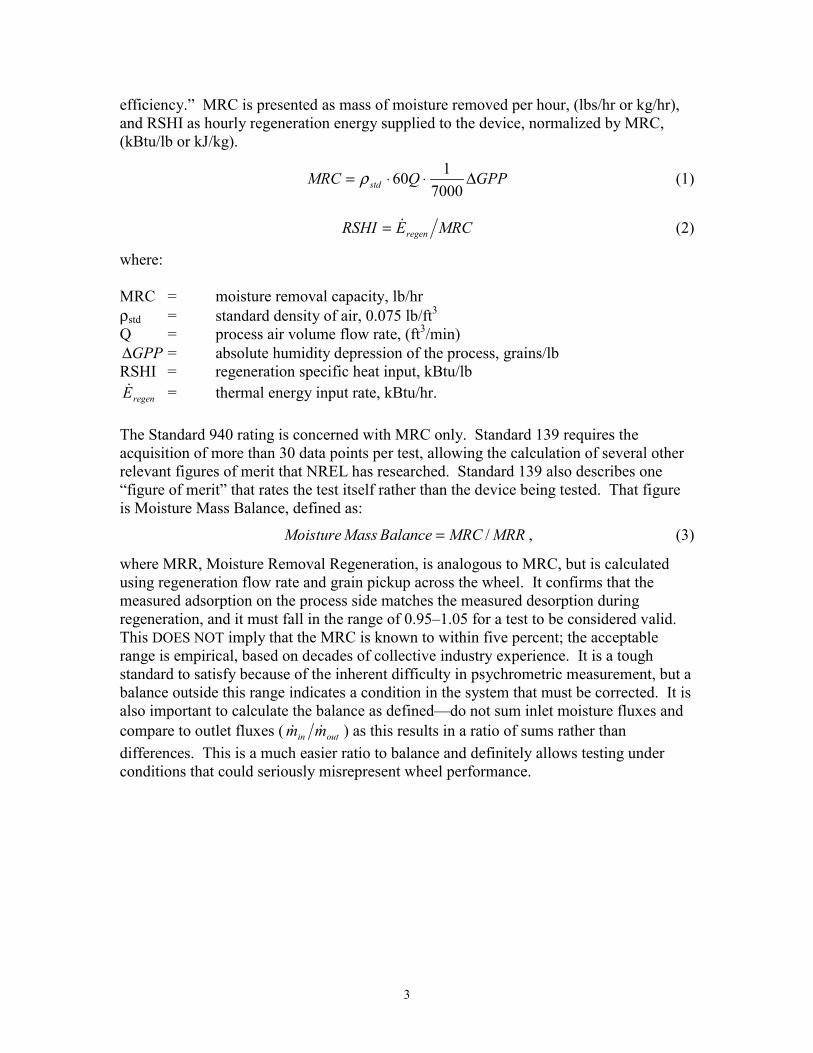
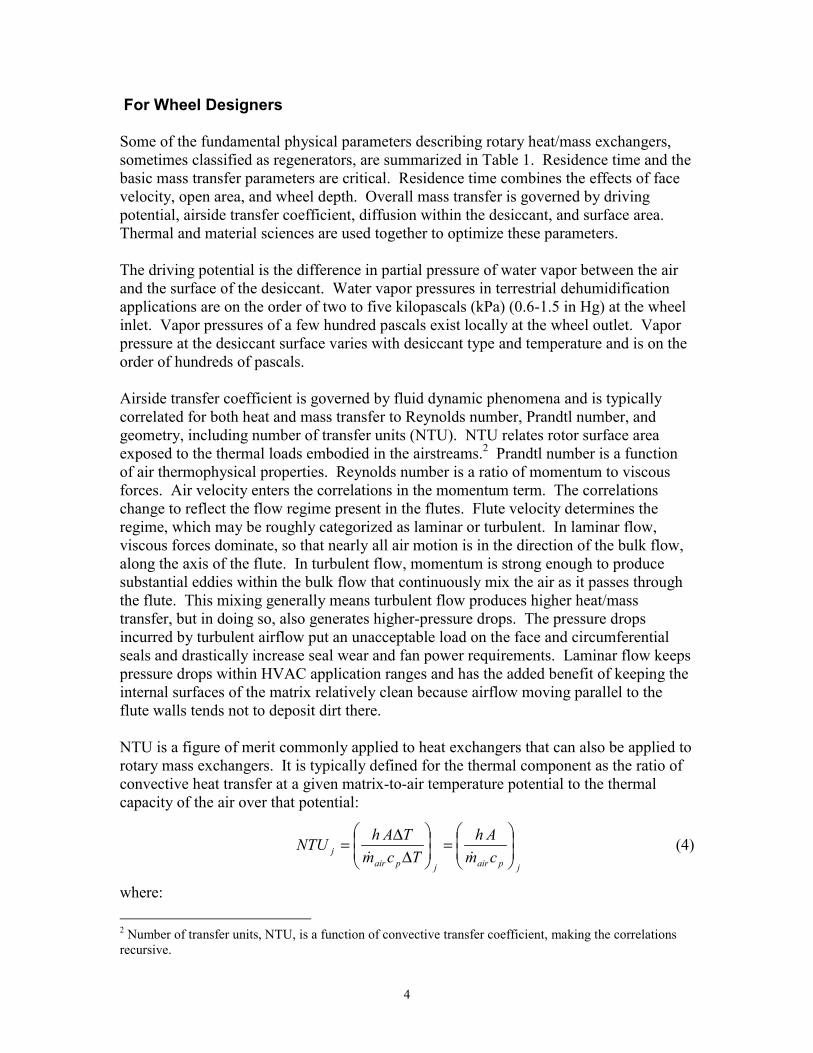
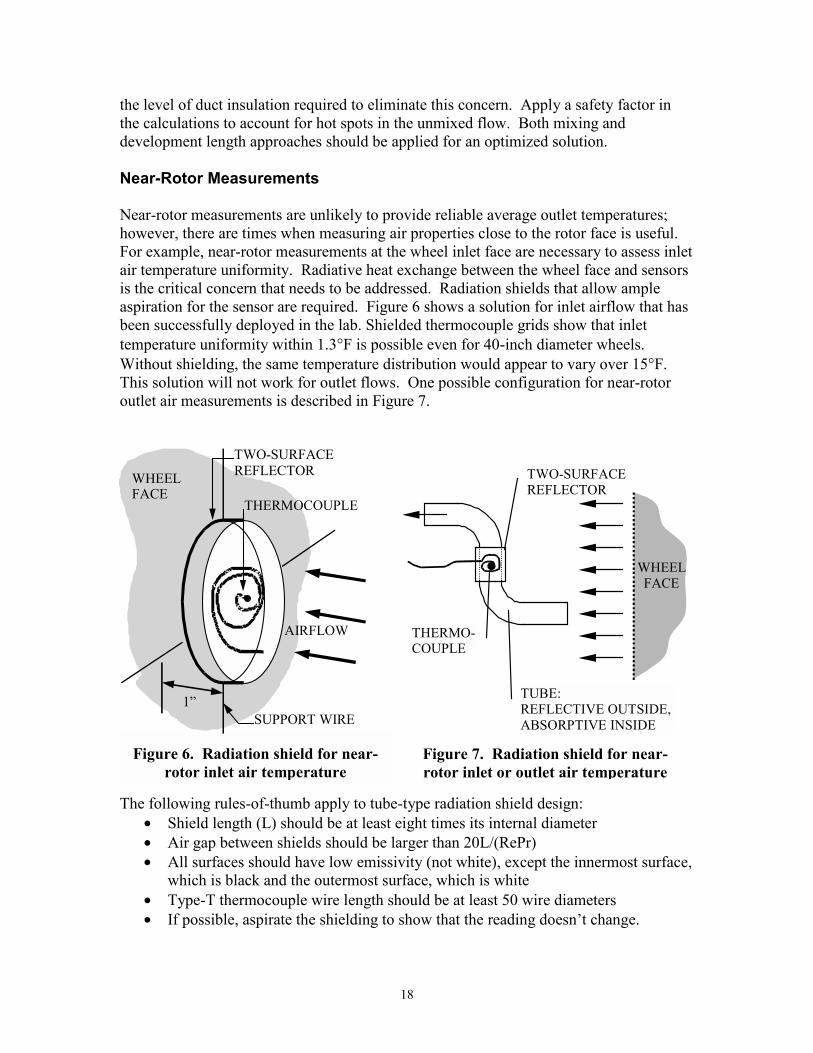
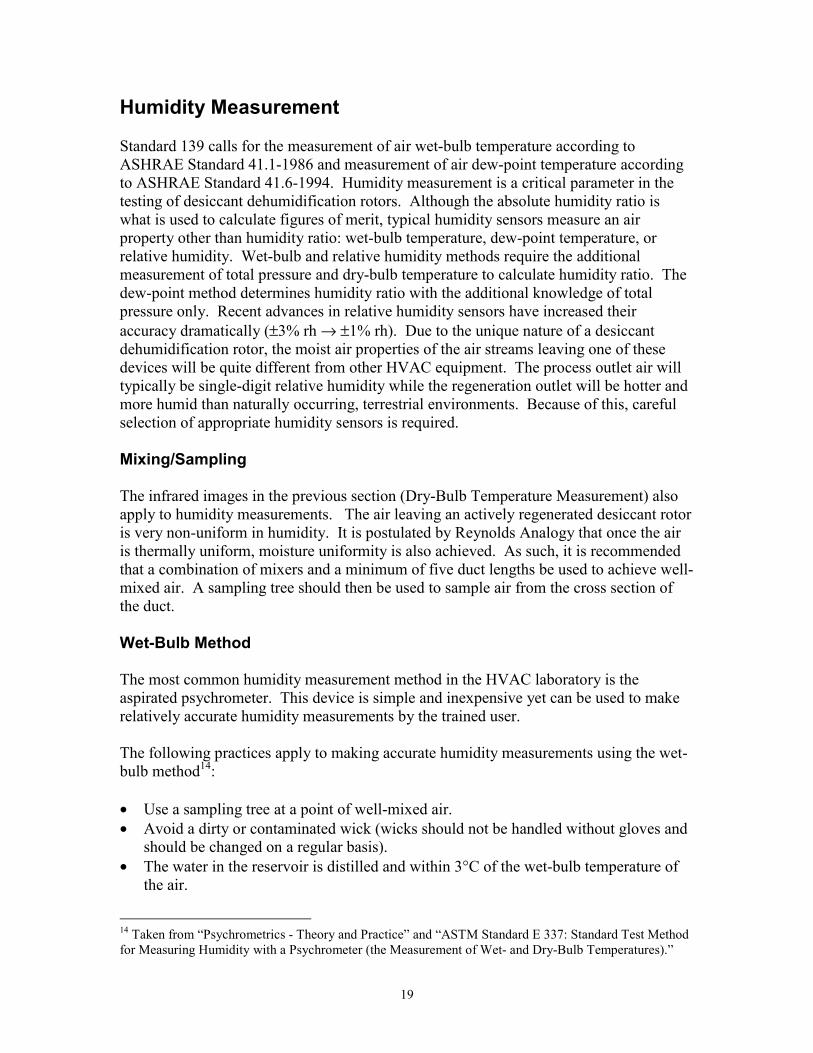
Rotary heat/mass transfer devices producevery spatially non-uniform air temperaturedistributions (see Figure 3)13. Mixing priorto measuring or sampling is critical toaccurate testing. Standard sampling treesare very effective in helping obtainrepresentative averages, but cannot berelied on. Sufficient mixing can beachieved by flow conditioning ordevelopment length. Standard baffles,screens, or mixing vanes accelerate thermalmixing, as shown in Figure 4, and can helpshield sensors or sampling trees fromradiative heat exchange with the rotor. Adrawback of these devices is that thepressure drop they add is not adjustable,and may adversely affect face pressuredifferentials at times. Infrared imagingshows that ten hydraulic diameters of flowdevelopment provide excellent uniformity(see Figure 5).
The drawback of using development lengthalone is the potential to lose heat before theoutlet flows can be measured. Averageprocess and regeneration outlettemperatures of active desiccantdehumidifier wheels range from 110°F to180°Fnot particularly high relative toroom temperature. Simple heat transfercalculations should be applied to determine 12 Moffat, R.J., The Gradient Approach to Thermocouple Circuitry, Proceedings of 4th Symposium onTemperature, Its Measurement and Control in Science and Industry, v.3, Reinhold, New York, 1962.13 These infrared images illustrate the effect of different mixing techniques on temperature uniformity afterair has exited the wheel into a plenum and then entered a 12-inch round duct. A screen, secured over theend of the duct, served as a target for the infrared camera. The screen itself imposes a pressure drop thattends to mix the flow, so actual spatial variation in the duct is probably slightly greater than that depictedhere.
Min Mean Max 155.9169.3
Area TemperatureMin Mean Max 158 171 178
Figure 3. IR image of regenerationoutlet air with no mixer.
Figure 5. IR image of regeneration outletair 10 duct diameters from plenum.
Min MeanMax155.9169.3
Area TemperatureMin Mean Max168 172 174
Figure 4. IR image of regenerationoutlet air with mixer.
18
the level of duct insulation required to eliminate this concern. Apply a safety factor inthe calculations to account for hot spots in the unmixed flow. Both mixing anddevelopment length approaches should be applied for an optimized solution.
Near-Rotor Measurements
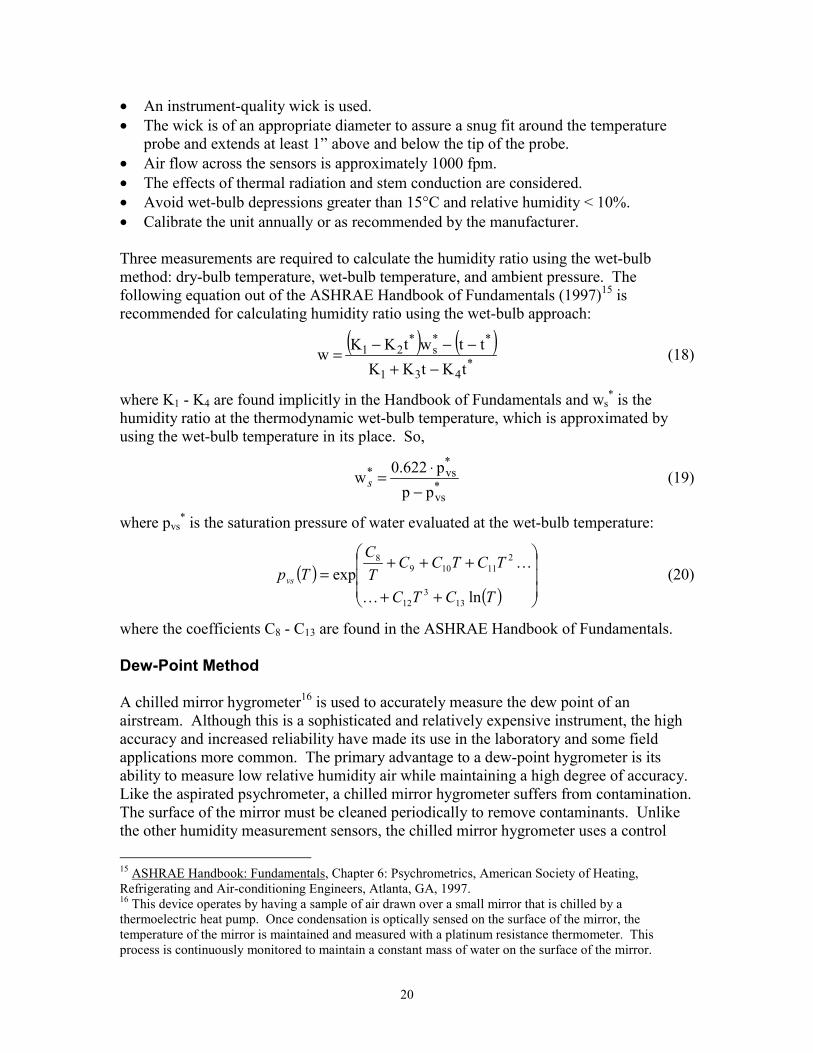
Near-rotor measurements are unlikely to provide reliable average outlet temperatures;however, there are times when measuring air properties close to the rotor face is useful.For example, near-rotor measurements at the wheel inlet face are necessary to assess inletair temperature uniformity. Radiative heat exchange between the wheel face and sensorsis the critical concern that needs to be addressed. Radiation shields that allow ampleaspiration for the sensor are required. Figure 6 shows a solution for inlet airflow that hasbeen successfully deployed in the lab. Shielded thermocouple grids show that inlettemperature uniformity within 1.3°F is possible even for 40-inch diameter wheels.Without shielding, the same temperature distribution would appear to vary over 15°F.This solution will not work for outlet flows. One possible configuration for near-rotoroutlet air measurements is described in Figure 7.
The following rules-of-thumb apply to tube-type radiation shield design:• Shield length (L) should be at least eight times its internal diameter• Air gap between shields should be larger than 20L/(RePr)• All surfaces should have low emissivity (not white), except the innermost surface,
which is black and the outermost surface, which is white• Type-T thermocouple wire length should be at least 50 wire diameters• If possible, aspirate the shielding to show that the reading doesnt change.
Figure 6. Radiation shield for near-rotor inlet air temperature
WHEELFACE
TUBE:REFLECTIVE OUTSIDE,ABSORPTIVE INSIDE
TWO-SURFACEREFLECTOR
THERMO-COUPLE
Figure 7. Radiation shield for near-rotor inlet or outlet air temperature
AIRFLOW
WHEELFACE
1
TWO-SURFACEREFLECTOR
SUPPORT WIRE
THERMOCOUPLE
19
Humidity Measurement
Standard 139 calls for the measurement of air wet-bulb temperature according toASHRAE Standard 41.1-1986 and measurement of air dew-point temperature accordingto ASHRAE Standard 41.6-1994. Humidity measurement is a critical parameter in thetesting of desiccant dehumidification rotors. Although the absolute humidity ratio iswhat is used to calculate figures of merit, typical humidity sensors measure an airproperty other than humidity ratio: wet-bulb temperature, dew-point temperature, orrelative humidity. Wet-bulb and relative humidity methods require the additionalmeasurement of total pressure and dry-bulb temperature to calculate humidity ratio. Thedew-point method determines humidity ratio with the additional knowledge of totalpressure only. Recent advances in relative humidity sensors have increased theiraccuracy dramatically (±3% rh → ±1% rh). Due to the unique nature of a desiccantdehumidification rotor, the moist air properties of the air streams leaving one of thesedevices will be quite different from other HVAC equipment. The process outlet air willtypically be single-digit relative humidity while the regeneration outlet will be hotter andmore humid than naturally occurring, terrestrial environments. Because of this, carefulselection of appropriate humidity sensors is required.
Mixing/Sampling
The infrared images in the previous section (Dry-Bulb Temperature Measurement) alsoapply to humidity measurements. The air leaving an actively regenerated desiccant rotoris very non-uniform in humidity. It is postulated by Reynolds Analogy that once the airis thermally uniform, moisture uniformity is also achieved. As such, it is recommendedthat a combination of mixers and a minimum of five duct lengths be used to achieve well-mixed air. A sampling tree should then be used to sample air from the cross section ofthe duct.
Wet-Bulb Method
The most common humidity measurement method in the HVAC laboratory is theaspirated psychrometer. This device is simple and inexpensive yet can be used to makerelatively accurate humidity measurements by the trained user.
The following practices apply to making accurate humidity measurements using the wet-bulb method14:
• Use a sampling tree at a point of well-mixed air.• Avoid a dirty or contaminated wick (wicks should not be handled without gloves and
should be changed on a regular basis).• The water in the reservoir is distilled and within 3°C of the wet-bulb temperature of
the air.
14 Taken from Psychrometrics - Theory and Practice and ASTM Standard E 337: Standard Test Methodfor Measuring Humidity with a Psychrometer (the Measurement of Wet- and Dry-Bulb Temperatures).
20
• An instrument-quality wick is used.• The wick is of an appropriate diameter to assure a snug fit around the temperature
probe and extends at least 1 above and below the tip of the probe.• Air flow across the sensors is approximately 1000 fpm.• The effects of thermal radiation and stem conduction are considered.• Avoid wet-bulb depressions greater than 15°C and relative humidity < 10%.• Calibrate the unit annually or as recommended by the manufacturer.
Three measurements are required to calculate the humidity ratio using the wet-bulbmethod: dry-bulb temperature, wet-bulb temperature, and ambient pressure. Thefollowing equation out of the ASHRAE Handbook of Fundamentals (1997)15 isrecommended for calculating humidity ratio using the wet-bulb approach:
( ) ( )*
431
**s
*21
tKtKKttwtKKw
−+−−−= (18)
where K1 - K4 are found implicitly in the Handbook of Fundamentals and ws* is the
humidity ratio at the thermodynamic wet-bulb temperature, which is approximated byusing the wet-bulb temperature in its place. So,
*vs
*vs*
ppp0.622w
−⋅=s (19)
where pvs* is the saturation pressure of water evaluated at the wet-bulb temperature:
( )( )
++
+++=
TCTC
TCTCCTC
Tpvs
lnexp
133
12
211109
8
(20)
where the coefficients C8 - C13 are found in the ASHRAE Handbook of Fundamentals.
Dew-Point Method
A chilled mirror hygrometer16 is used to accurately measure the dew point of anairstream. Although this is a sophisticated and relatively expensive instrument, the highaccuracy and increased reliability have made its use in the laboratory and some fieldapplications more common. The primary advantage to a dew-point hygrometer is itsability to measure low relative humidity air while maintaining a high degree of accuracy.Like the aspirated psychrometer, a chilled mirror hygrometer suffers from contamination.The surface of the mirror must be cleaned periodically to remove contaminants. Unlikethe other humidity measurement sensors, the chilled mirror hygrometer uses a control 15 ASHRAE Handbook: Fundamentals, Chapter 6: Psychrometrics, American Society of Heating,Refrigerating and Air-conditioning Engineers, Atlanta, GA, 1997.16 This device operates by having a sample of air drawn over a small mirror that is chilled by athermoelectric heat pump. Once condensation is optically sensed on the surface of the mirror, thetemperature of the mirror is maintained and measured with a platinum resistance thermometer. Thisprocess is continuously monitored to maintain a constant mass of water on the surface of the mirror.
21
loop to maintain accurate measurements. At times the instrument will get lost andsearch for its equilibrium point. Depending on the nature of the event, the hygrometermay not be able to get back in control on its own and will have to be reset manually.Some units allow this to be done remotely. A very small air sample is needed (15 ft3/hr)for the modern chilled mirror hygrometer. The sample lines should be kept as short aspossible, and they must be heated to prevent condensation from forming in them. Theelevated dry-bulb temperature of the air sample does not effect the humiditymeasurement so long as the thermoelectric heat pump can provide sufficient temperaturedepression of the chilled mirror. A two-stage cooler will provide 65°C of sensortemperature depression. Some dew-point sensors do not have the cooling capacity tomeasure very low dew points, and the cooling rate will affect response times. Checkmanufacturers specifications to match sensors to the task.
The following practices apply to making accurate humidity measurements using the dewpoint method:
• Use a sampling tree at a location of well-mixed air.• Periodically clean the chilled mirror surface as recommended by the manufacturer
more frequently is not necessarily better and may be detrimental.• Periodically zero the instrument to account for trace amounts of contaminants.• Locate the sensor close to the sampling tree to minimize the length of sampling tube.• Heat the sampling tube to prevent condensation from occurring.• Make sure the thermoelectric heat pump has sufficient capacity for the air stream
being measured.• Calibrate the unit annually or as recommended by the manufacturer.
Two measurements are required to calculate the humidity ratio using the dew pointmethod: dew point temperature and duct static pressure. The following equation out ofthe ASHRAE Handbook of Fundamentals is recommended for calculating humidity ratiousing the dew-point method:
vs
vs
ppp0.622
w−
⋅= (21)
where pvs is the saturation pressure evaluated at the dew-point temperature (Eq. 20).
Relative Humidity Method
In the past, relative humidity sensors have been used to monitor the moisture level of theair in a building. An accuracy of ±3% relative humidity was sufficient for thismonitoring, but was insufficient for measuring the performance of HVAC equipment.However, recent advances have increased the best available accuracy of these sensors to±1% relative humidity. This enables their use in monitoring the performance of HVACequipment without incurring high uncertainties, while providing low maintenance andreliable performance.
22
Typically, these sensors use a material whose capacitance varies with the relativehumidity of the airstream in which they are exposed. The humidity sensor is usuallycoupled with a temperature sensor within a filtered cavity. The output from thistemperature sensor should be used for all humidity calculations. The velocity of the airpassing over the sensors should be monitored and kept within the manufacturersrecommended range. This will prevent slow response times and decrease the possibilityof conduction and radiation errors. It is not uncommon to insert a relative humiditysensor directly in the duct. If this is done, the thermal and moisture uniformity at thatlocation is paramount. The flow uniformity should also be verified to assure oneself thatsufficient flow over the sensor is provided.
The following practices apply to making accurate humidity measurements using therelative humidity method:
• If a sampling method is used, use a sampling tree at a location of well-mixed air.• If the sensor is inserted in a duct, do so at a location of very well mixed air.• Monitor the airflow across the sensor.• Use the temperature output from the temperature sensor provided with the unit.• Maintain strict control of duct air temperatures within the sensors safety range to
avoid damaging the sensing element.• Calibrate the unit annually or as recommended by the manufacturer.
Three measurements are required to calculate humidity ratio using the relative humiditymethod: dry-bulb temperature, relative humidity, and ambient pressure. The followingequations from the ASHRAE Handbook of Fundamentals are recommended forcalculating the humidity ratio using the relative humidity method:
v
vpp
p0.622w−
⋅= (22)
where
vsv pp ⋅Φ= (23)
where pvs is Eq. 20 evaluated at the dry-bulb temperature, and Φ is the decimalrepresentation of relative humidity.
Total Combined Uncertainty
Standard 139 calls for specific limits on uncertainty for instrumentation, but does notdiscuss total combined uncertainty for its primary figures of merit, MRC and RSHI. Itsrequirement that moisture mass balance fall within 5% of 1.0 must not be taken as theaccuracy of these calculated results. There are several ways to mathematicallypropagate random and bias uncertainties into a total combined uncertainty for a givenfigure of merit.
23
Calculation of what is commonly called true uncertainty involves a what if exercise todetermine a worst-case scenario in the calculations. It assumes all measurements are inerror to the maximum extent possible, and each in a sense that skews the calculatedresults in the same direction. For example, if experimental technique is perfect, measureddry-bulb temperature is 0.3°C high, and measured wet-bulb temperature is 0.3°C low,calculated absolute humidity will be low by the maximum amount possible using theseinstruments. With this approach, and standard instrumentation, it is easy to realize MRCuncertainties in excess of 25%. Thankfully, in the absence of extremely biased errors, itis statistically very unlikely that this condition will exist. It is much more likely thatrandom errors will partially compensate for each other. This is the approach detailed inKline and McClintock (1953)17, and the one recommended and used here.
Uncertainty in a test result has two components: random uncertainty and systematic (bias)uncertainty. Uncertainty analysis should help determine which instruments will play asignificant role in the magnitude of the uncertainty and which will not. This informationshould then be used to focus more resources in those instruments playing a major role.
Sources of systematic uncertainties that will be an issue in testing an actively regenerateddesiccant rotor have been discussed in the previous sections of this test guide and aresummarized here. They include (but are not limited to):
Pressure/Flow• Maldistribution of air supplied to the rotor (blowthrough)• Air leaks between air measurement stations• Use of instrumentation outside of published range• Use of instrumentation out of calibration• Not allowing appropriate development lengths upstream or downstream of nozzles• Poor nozzle construction• Poor pressure tap construction/location.
Temperature/Humidity• Sampling of a non-uniform air stream• Conduction and/or radiation affecting dry-bulb and/or wet-bulb measurements• Use of instrumentation outside of published range• Use of instrumentation out of calibration• Allowing condensation to form in sampling tubes• Insufficiently insulated ducts or sampling tubes• Contaminated wicks for wet-bulb measurements• Contaminated mirror for dew-point sensors• Insufficient air flow across a sensor• Requiring a dew point sensor or wet-bulb sensor to develop a temperature depression
greater than their capability.
17 Kline, S.J., and F.A. McClintock, Describing Uncertainties in Single-Sample Experiments, MechanicalEngineering, Vol.75, No.1, pp. 3-8, 1953
24
Systematic errors, if not sufficiently addressed, can overwhelm random errors. With somany different possibilities, quantifying the effect of systematic errors on a test result isdifficult, and varies from lab to lab and test to test. Good testing procedures willminimize their effect, but not eliminate it. As researchers and test engineers, it isimportant that we maintain an awareness of their existence and work to minimize theireffect.
Instrument readings contain both random and bias errors. The following sectionillustrates the propagation of instrument uncertainty into test results assuming that themanufacturers stated instrument accuracies are entirely random and that other non-instrument systematic errors are negligible. Under some conditions, the effect ofincluding bias components would be that total uncertainty would be slightly more thanthat presented here, and, under other conditions, it would be slightly less. One couldargue that sensors calibrated to each other could substantially reduce uncertainty in adifferential measurement (like grain depression across a wheel). But non-instrumentsystematic uncertainties cannot be totally eliminated, and so our approximation gives asense of what is reasonable and achievable based on our experience. The intent of thisdiscussion is to show that even under ideal testing conditions, all of the humidityinstruments examined here have distinct limitations. All laboratories conductingdesiccant wheel testing should complete detailed uncertainty analyses including theeffects of their specific instruments bias errors and quantify their rigs systematic biases.References for conducting detailed uncertainty analyses include Coleman and Stuck(1999)18 and Dieck (1992)19.
Instrument Uncertainty Propagated into Humidity Ratio
To calculate a figure of merit, the humidity measurements must be converted into ahumidity ratio. In the previous section, three methods of humidity measurement werediscussed: wet-bulb method, dew-point method, and relative humidity method. Multiplemeasurements are required to calculate the humidity ratio for each of these methods.This section will illustrate how the uncertainty in each of these individual measurementspropagates into the calculation of the humidity ratio.
The root-sum-square method of uncertainty calculation is applied here to the individualequations used in calculating the humidity ratio for each individual approach. If theinstrument uncertainties are independent, it is statistically likely that the errors willpartially counteract each other most of the time such that the square root of the sum of thesquares of the individual uncertainties is a more representative gauge of the overallrandom uncertainty. If w is a function of three independent variables (x,y,z), the randomuncertainty in w (δw) is:
18 Coleman, H.W., and W.G. Stuck, Experimentation and Uncertainty Analysis for Engineers, Wiley, NewYork, 2nd edition, 1999.19 Dieck, R.H., Measurement Uncertainty Methods and Applications, Instrument Society of America, NorthCarolina, 1992.
25
21
222
zz
wyy
wxxww
+
+
= δ
∂∂δ
∂∂δ
∂∂δ (24)
where xw
∂∂ is the partial derivative of w with respect to x and δx is the uncertainty in x,
and so on. The partial derivatives can be interpreted as sensitivity coefficients of thehumidity ratio. The magnitude of each sensitivity coefficient enables one to determinewhich measurements play a significant role in the uncertainty in w. Slayzak and Ryan(1998)20 give a thorough description of this uncertainty analysis applied to the threehumidity measurement methods described above. This uncertainty analysis is nowapplied to the four ARI rating conditions given in Table 2.
For this analysis, it will be assumed that the humidity measurement of the regenerationair occurs before it enters the regeneration heater. This is the only option for both thewet-bulb method and the relative humidity method because of temperature limits. Theanalysis is applied to the two levels of instrument accuracies given in Table 3.
Table 3. Instrument Accuracies Used in Uncertainty Analysis
Temperatures(TDB, TWB, TDP) Relative Humidity21 Mass
Flow RatePressure
Standard 139Accuracies ±0.3°C ±3% rh ±3% ±0.13 kPa
A series of figures follow giving the results of this uncertainty analysis. The results arereported as a percent uncertainty, which is found by dividing the uncertainty in thecalculated value by the calculated value:
20 Slayzak, S.J., and J.P. Ryan, Instrument Uncertainty Effect on Calculation of Absolute Humidity UsingDew-Point, Wet-Bulb, and Relative Humidity Sensors. Solar 98: ASME International Solar EnergyConference Proceedings, 199821 ASHRAE Standard 139 does not consider the use of relative humidity sensors for humiditymeasurements; however, representative models are included here for completeness.
26
wwδ=yuncertaint% (25)
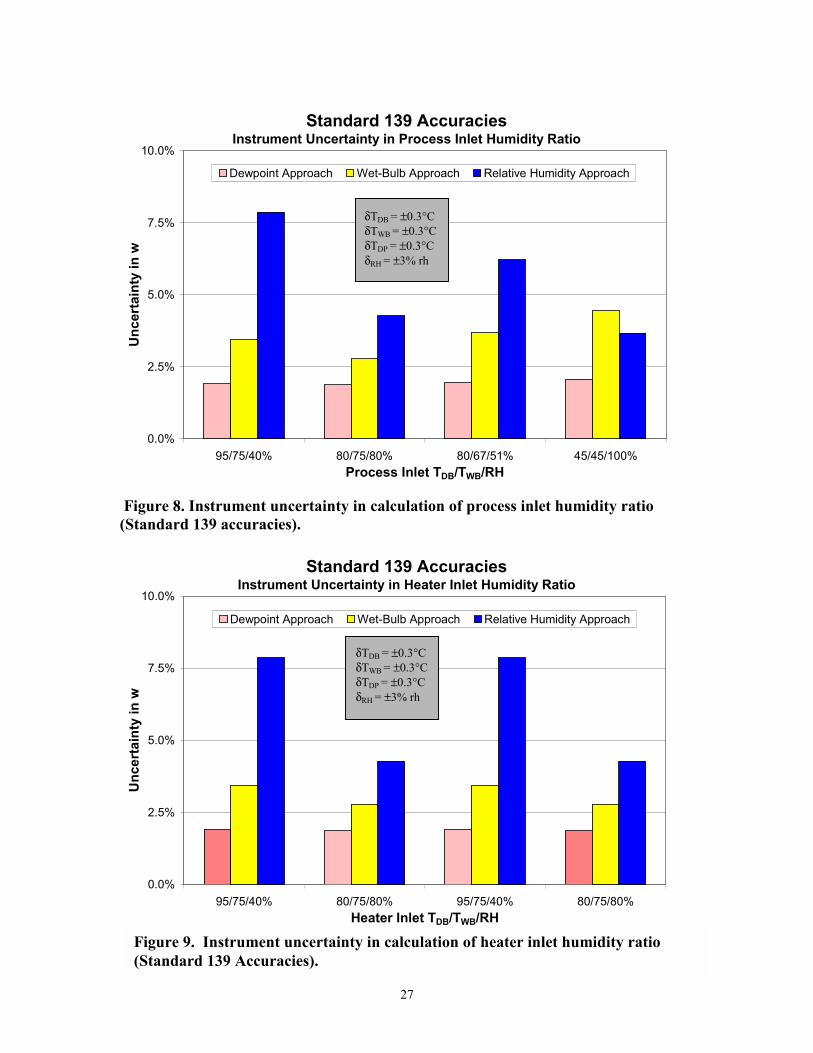
Figure 8 gives the uncertainty in the calculation of the process inlet humidity ratio foreach of the four ARI process inlet rating conditions using the Standard 139 accuraciesgiven in Table 3. It can be seen that the uncertainty is least for the dew-point method.The uncertainty is greatest for the relative humidity method for the first three points. Thehigh relative humidity of the fourth point enables the relative humidity method to incurless uncertainty than the wet-bulb method. Figure 9 gives the uncertainty results for theregeneration heater inlet conditions. Looking at Table 2, points (1,3) and (2,4) areidentical pairs. Again, the dew-point method incurs the least uncertainty and the relativehumidity method the greatest.
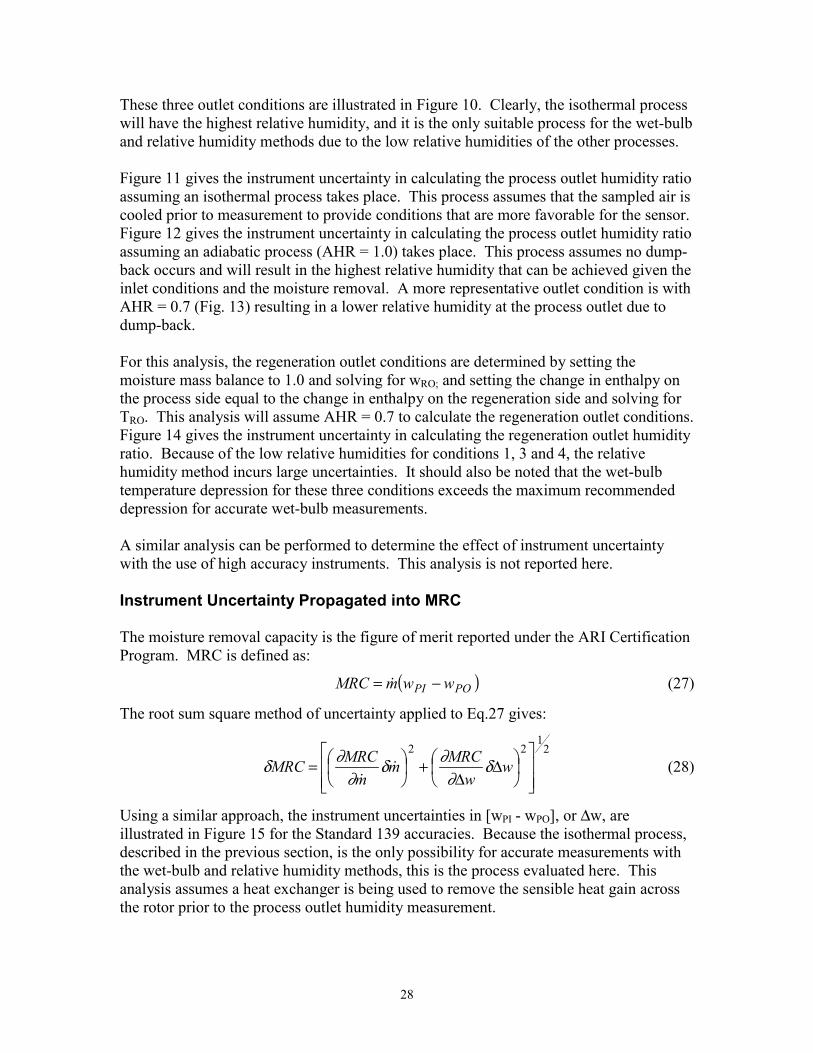
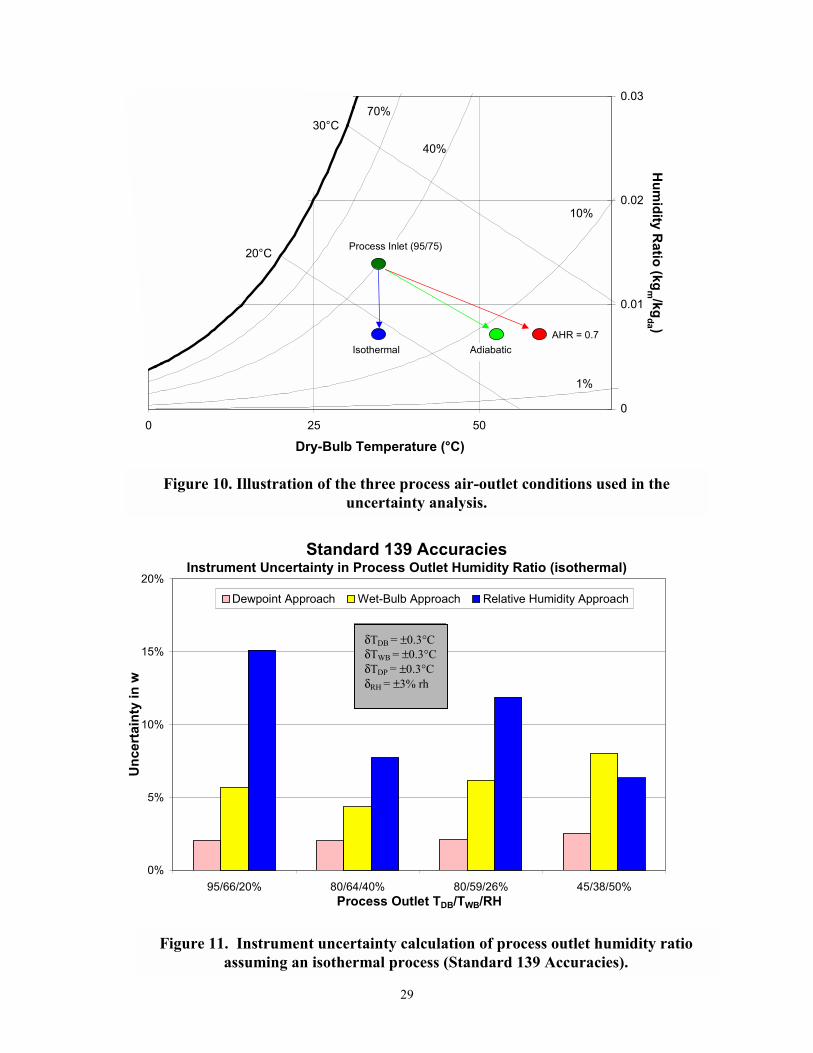
The outlet air conditions from an actively regenerated desiccant rotor will vary dependingon the inlet conditions, airflow rates, and the rotors performance. The first assumptionmade here is that the rotor removes half the moisture from the process inlet air (e.g. ARIcondition #1 has an inlet humidity ratio of 98.6 grains/lb; therefore, the process outlethumidity ratio is assumed to be 49.3 grains/lb)22. Due to the heat of adsorption anddump-back from the regeneration air stream, the process outlet air will be hot and dry:not ideal for the wet-bulb and relative humidity methods. Three possible process outletconditions will be illustrated in this analysis: isothermal, adiabatic, and adsorption heatratio (AHR) of 0.7. AHR is the ratio of sensible heat gain in the process air due toadsorption to the actual sensible heat gain:
PIPO
PIadiabaticPO
TTTT
AHR−
−= , (26)
22 Experience shows this assumption gives a reasonable figure for the outlet conditions.
27
Figure 8. Instrument uncertainty in calculation of process inlet humidity ratio(Standard 139 accuracies).
Figure 9. Instrument uncertainty in calculation of heater inlet humidity ratio(Standard 139 Accuracies).
Standard 139 AccuraciesInstrument Uncertainty in Process Inlet Humidity Ratio
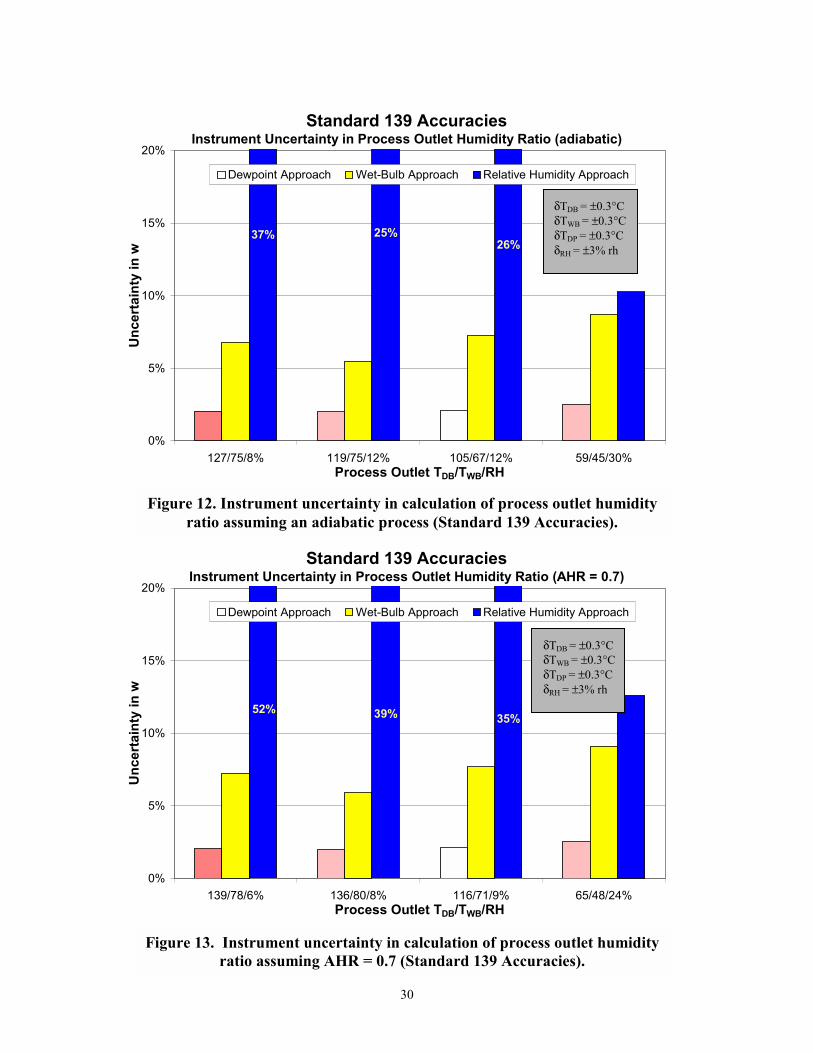
These three outlet conditions are illustrated in Figure 10. Clearly, the isothermal processwill have the highest relative humidity, and it is the only suitable process for the wet-bulband relative humidity methods due to the low relative humidities of the other processes.
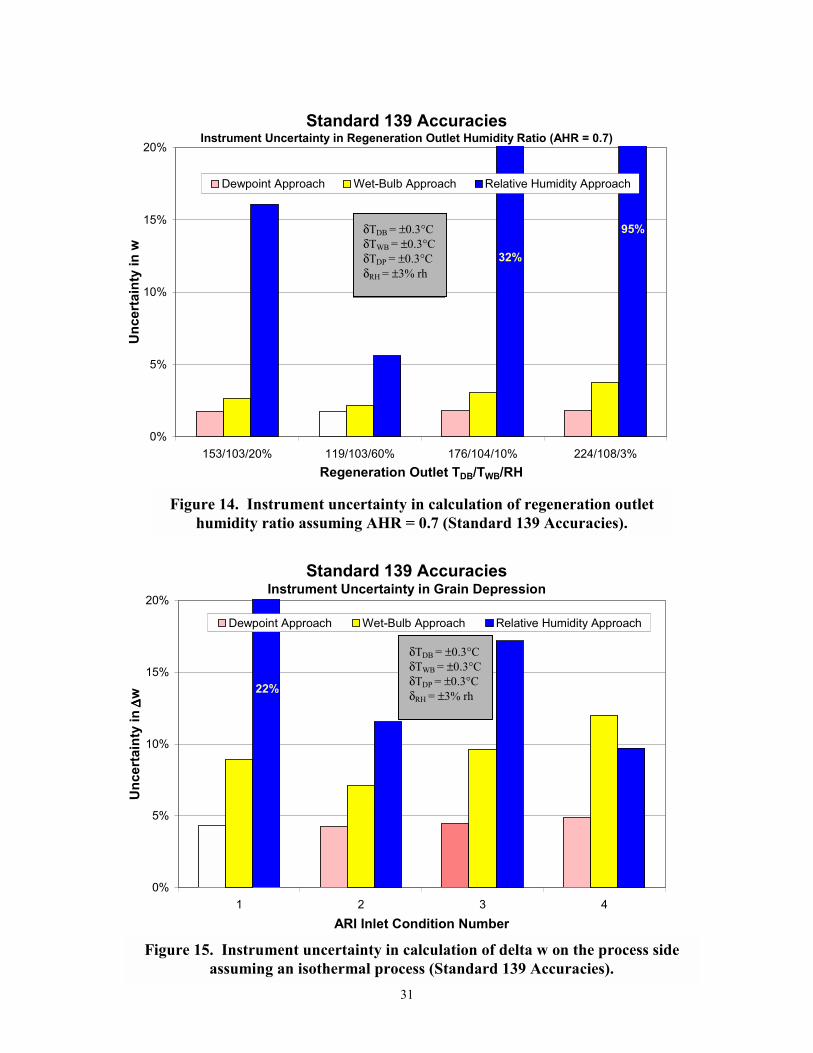
Figure 11 gives the instrument uncertainty in calculating the process outlet humidity ratioassuming an isothermal process takes place. This process assumes that the sampled air iscooled prior to measurement to provide conditions that are more favorable for the sensor.Figure 12 gives the instrument uncertainty in calculating the process outlet humidity ratioassuming an adiabatic process (AHR = 1.0) takes place. This process assumes no dump-back occurs and will result in the highest relative humidity that can be achieved given theinlet conditions and the moisture removal. A more representative outlet condition is withAHR = 0.7 (Fig. 13) resulting in a lower relative humidity at the process outlet due todump-back.
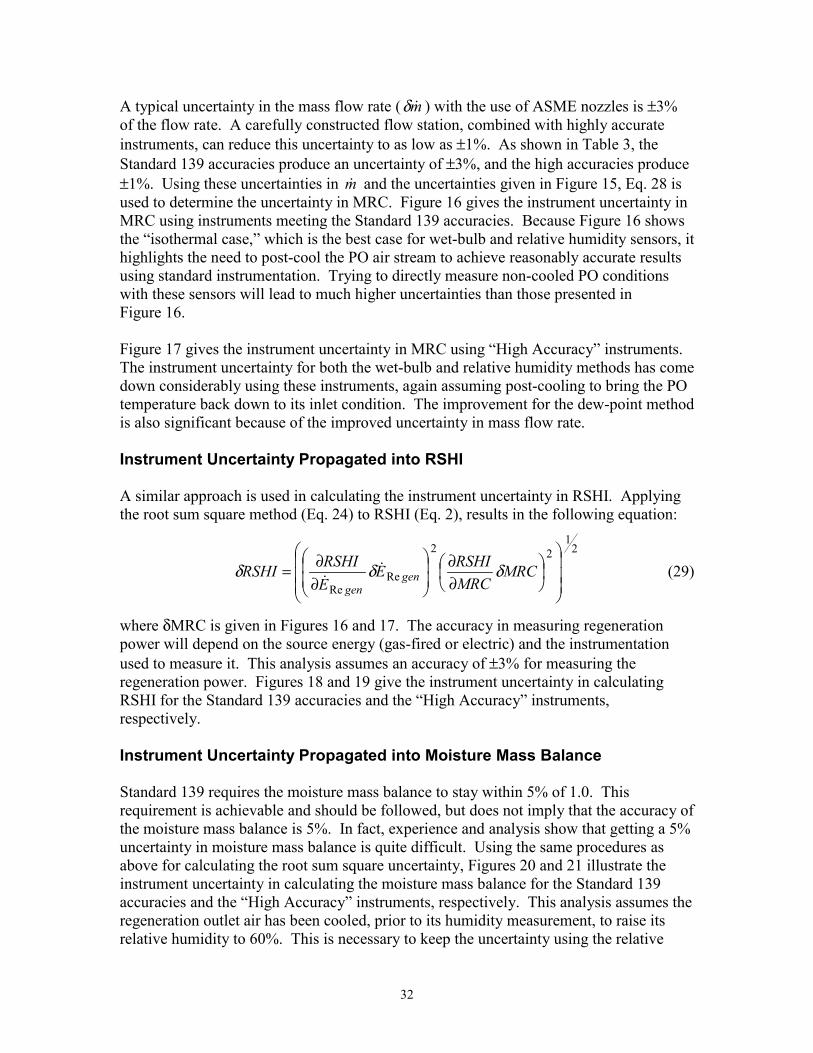
For this analysis, the regeneration outlet conditions are determined by setting themoisture mass balance to 1.0 and solving for wRO; and setting the change in enthalpy onthe process side equal to the change in enthalpy on the regeneration side and solving forTRO. This analysis will assume AHR = 0.7 to calculate the regeneration outlet conditions.Figure 14 gives the instrument uncertainty in calculating the regeneration outlet humidityratio. Because of the low relative humidities for conditions 1, 3 and 4, the relativehumidity method incurs large uncertainties. It should also be noted that the wet-bulbtemperature depression for these three conditions exceeds the maximum recommendeddepression for accurate wet-bulb measurements.
A similar analysis can be performed to determine the effect of instrument uncertaintywith the use of high accuracy instruments. This analysis is not reported here.
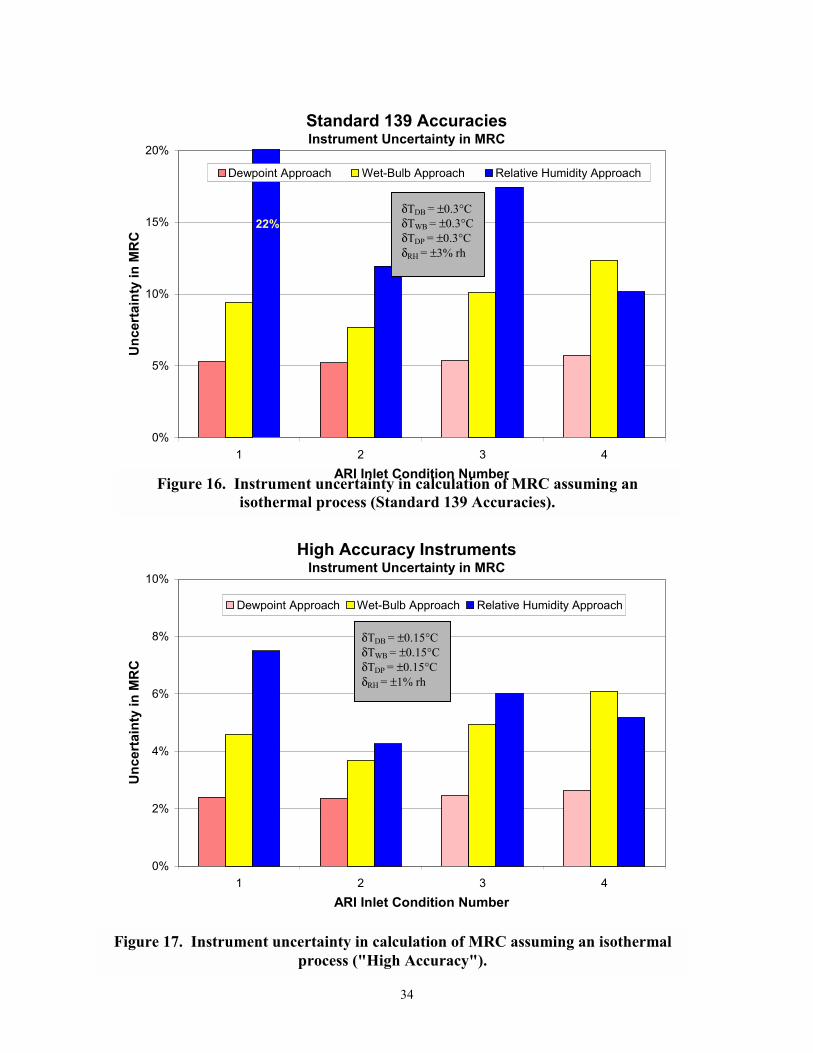
Instrument Uncertainty Propagated into MRC
The moisture removal capacity is the figure of merit reported under the ARI CertificationProgram. MRC is defined as:
( )POPI wwmMRC −= (27)
The root sum square method of uncertainty applied to Eq.27 gives:
21
22
∆∆
+
= ww
MRCmm
MRCMRC δ∂
∂δ∂
∂δ
(28)
Using a similar approach, the instrument uncertainties in [wPI - wPO], or ∆w, areillustrated in Figure 15 for the Standard 139 accuracies. Because the isothermal process,described in the previous section, is the only possibility for accurate measurements withthe wet-bulb and relative humidity methods, this is the process evaluated here. Thisanalysis assumes a heat exchanger is being used to remove the sensible heat gain acrossthe rotor prior to the process outlet humidity measurement.
29
0 25 50
Dry-Bulb Temperature (°C)
0
0.01
0.02
0.03
Hum
idity Ratio (kg
m /kgda )
1%
10%
40%
70%
20°C
30°C
Isothermal
Process Inlet (95/75)
AdiabaticAHR = 0.7
Figure 10. Illustration of the three process air-outlet conditions used in theuncertainty analysis.
Figure 11. Instrument uncertainty calculation of process outlet humidity ratioassuming an isothermal process (Standard 139 Accuracies).
Standard 139 AccuraciesInstrument Uncertainty in Process Outlet Humidity Ratio (isothermal)
A typical uncertainty in the mass flow rate ( mδ ) with the use of ASME nozzles is ±3%of the flow rate. A carefully constructed flow station, combined with highly accurateinstruments, can reduce this uncertainty to as low as ±1%. As shown in Table 3, theStandard 139 accuracies produce an uncertainty of ±3%, and the high accuracies produce±1%. Using these uncertainties in m and the uncertainties given in Figure 15, Eq. 28 isused to determine the uncertainty in MRC. Figure 16 gives the instrument uncertainty inMRC using instruments meeting the Standard 139 accuracies. Because Figure 16 showsthe isothermal case, which is the best case for wet-bulb and relative humidity sensors, ithighlights the need to post-cool the PO air stream to achieve reasonably accurate resultsusing standard instrumentation. Trying to directly measure non-cooled PO conditionswith these sensors will lead to much higher uncertainties than those presented inFigure 16.
Figure 17 gives the instrument uncertainty in MRC using High Accuracy instruments.The instrument uncertainty for both the wet-bulb and relative humidity methods has comedown considerably using these instruments, again assuming post-cooling to bring the POtemperature back down to its inlet condition. The improvement for the dew-point methodis also significant because of the improved uncertainty in mass flow rate.
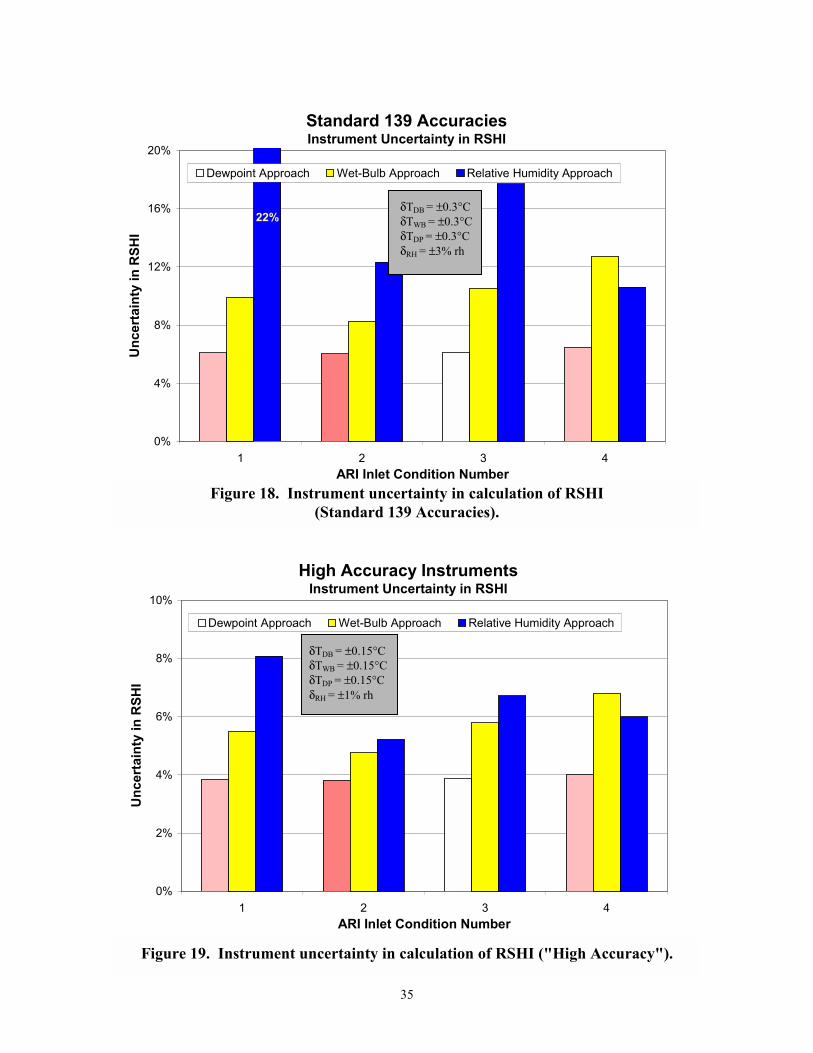
Instrument Uncertainty Propagated into RSHI
A similar approach is used in calculating the instrument uncertainty in RSHI. Applyingthe root sum square method (Eq. 24) to RSHI (Eq. 2), results in the following equation:
21
22
ReRe
∂∂
∂∂= MRC
MRCRSHIE
ERSHIRSHI gen
genδδδ
(29)
where δMRC is given in Figures 16 and 17. The accuracy in measuring regenerationpower will depend on the source energy (gas-fired or electric) and the instrumentationused to measure it. This analysis assumes an accuracy of ±3% for measuring theregeneration power. Figures 18 and 19 give the instrument uncertainty in calculatingRSHI for the Standard 139 accuracies and the High Accuracy instruments,respectively.
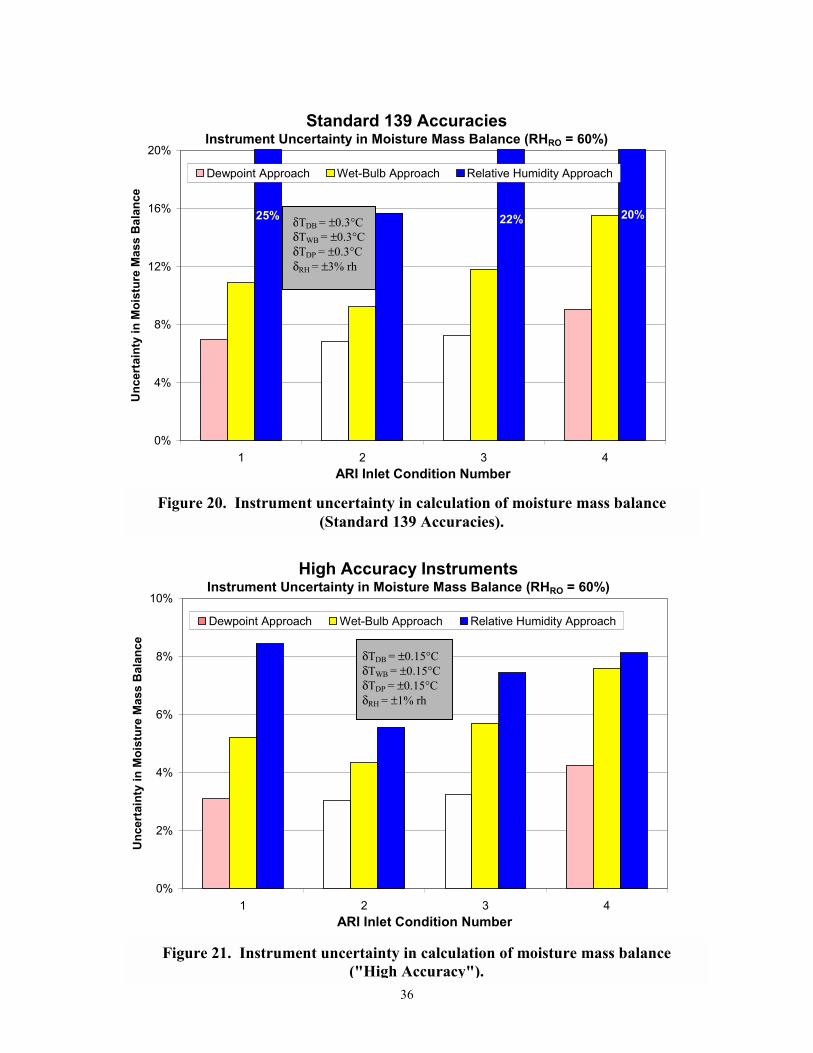
Instrument Uncertainty Propagated into Moisture Mass Balance
Standard 139 requires the moisture mass balance to stay within 5% of 1.0. Thisrequirement is achievable and should be followed, but does not imply that the accuracy ofthe moisture mass balance is 5%. In fact, experience and analysis show that getting a 5%uncertainty in moisture mass balance is quite difficult. Using the same procedures asabove for calculating the root sum square uncertainty, Figures 20 and 21 illustrate theinstrument uncertainty in calculating the moisture mass balance for the Standard 139accuracies and the High Accuracy instruments, respectively. This analysis assumes theregeneration outlet air has been cooled, prior to its humidity measurement, to raise itsrelative humidity to 60%. This is necessary to keep the uncertainty using the relative
33
humidity approach within reasonable limits. And although this cooling has little effect onthe instrument uncertainty using the wet-bulb approach, it does reduce the wet-bulbdepression to a reasonable magnitude (<10oC). If the regeneration outlet air is not cooledprior to its humidity measurement, the uncertainty encountered in calculating theregeneration outlet humidity ratio using the relative humidity method (Figure 14), caninduce a very large instrument uncertainty in moisture mass balance (>100%). Therefore,like the process outlet air stream, if the wet-bulb or relative humidity method is used tomeasure the moisture content of the regeneration outlet air, the air should first be cooled,raising the relative humidity above 50%, to achieve reasonable accuracy. Figure 21shows that the instrument uncertainty in the moisture mass balance, using the bestcommercially available dew-point hygrometers coupled with other high accuracyinstruments, is typically 3-4%.
34
Figure 16. Instrument uncertainty in calculation of MRC assuming anisothermal process (Standard 139 Accuracies).
Figure 17. Instrument uncertainty in calculation of MRC assuming an isothermalprocess ("High Accuracy").
Standard 139 AccuraciesInstrument Uncertainty in MRC
Actively regenerated desiccant dehumidification rotors can be regenerated with air attemperatures up to 400°F. Ducts and cabinets carrying this air should be well insulatedto prevent contact with personnel. The temperature of the regeneration air should becontinuously monitored by a high temperature limit controller separate from thecomputer to prevent the possibility of excessively high temperature air from entering thetest article and causing damage to the rotor or seals. Where possible, makemeasurements (moisture, flow, etc.) prior to heating, so sampling tubes and instrumentsare not required to handle high temperature.
Manual Control of Fans
Typically, fans can be controlled by either the data acquisition system or manually.Manual control is recommended due to the damage that can be caused by a fan receivinga faulty control signal. The fans do not need continuous adjustments for steady-statetesting and, therefore, lend themselves to manual control.
LiCl Wheels
If exposed to high relative humidity air without sufficient regeneration, lithium chloride(LiCl) rotors will deliquesce, a phenomenon whereby the desiccant over-adsorbsmoisture to the point where damage occurs. LiCl has a very high capacity for holdingmoisture. If it is not regenerated, the LiCl will continue to absorb moisture until itbecomes such a weak solution that it can drain out of the matrix. The combination ofwater weight and the soaking effect can also destroy the structural integrity of the matrix.Either will ruin the rotors ability to dehumidify. The manufacturer should be contactedfor advice on the maximum relative humidity to which the rotor should be subjected. Inaddition, the rotors should be stored in airtight containers or bags to prevent damageduring storage.
Initial Running of Rotors
The first time air is passed through a rotor, desiccant dust and fumes from themanufacturing process may cause problems for sensitive personnel. An initiation periodof approximately two hours is recommended, during which the outlet air is not sampledand is exhausted outdoors.
38
APPENDICES
Appendix 1a. Definitions Currently Under Consideration by ASHRAE
Desiccant Cooling: The use of desiccant dehumidification systems for latent heat(humidity) removal in air conditioning systems inconjunction with sensible heat exchange and/or evaporativecooling equipment to perform cooling. This process may usevapor compression equipment to provide the final stage ofcooling. Desiccant cooling equipment is used to treatoutdoor air by reducing both the sensible and latent(temperature and humidity) loads during cooling seasons.Some systems also include winter heating and humidificationcomponents for all season service.
DesiccantDehumidification
Static:
Active:
The removal of moisture from humid air by exposing the airto a desiccant without the use of an air-moving device. Oncethe desiccant achieves moisture equilibrium with the ambientair, the dehumidification process stops and the desiccantmust be replaced with regenerated desiccant, e.g., packagedor bagged desiccant placed in shipping containers toprevent moisture condensation during transit or storage; alsolaboratory desiccators.
The removal of moisture from the air by exposing the humidair to a desiccant using an air-moving device and aconcurrent reactivation (regeneration) process such as byapplying thermal heat or pressure swings. The reactivationprocess can be either intermittent, such as dual powerdehumidifiers, or concurrent and continuous such as forrotary dehumidifiers.
PassiveDehumidification:
The removal of moisture from the air by exposing the humidair to a desiccant with the use of an air-moving device and atemperature/humidity sink (i.e., difference in the partialvapor pressure of moisture between the ventilation (outdoor)air and exhaust air streams). For example, enthalpy wheelsthat are used to reduce the impact of ambient temperatureand humidity of ventilation air on cooling and heatingsystems.
39
Appendix 1b. Terminology Used in the Desiccant Wheel Test Guide
Absorption Sorption phenomenon characterized by chemical combinationwith the sorbent material. Typical for liquid desiccants.
Adsorption Sorption phenomenon characterized by physical inclusion withina sorbents internal pore structure. Typical for solid desiccants.
Adsorption HeatRatio (AHR)
The ratio of sensible heat gain due to adsorption to the actualsensible heat gain. If AHR = 1.0, the process is adiabatic. AsAHR drops, the process becomes less adiabatic, indicatingincreasing heat dump.
Air mass balance: Either the ratio of inlet/outlet mass flow pairs, or the ratio of thesummations of all inlets to outlets
Blowthrough: A highly non-uniform inlet airflow that overcomes a wheelsnatural ability to even out air distribution and degradesperformance by starving some sections of the wheel
Breakthrough: Preventable design condition when the mass exchange wave frontreaches the outlet face of the wheel before the wheel rotates out ofthe current airflow
Cassette: The wheel housing, including the drive motor and air sealsCarryover: Transfer of air containing moisture or other contaminants from
regeneration to the process side of the wheel, either by sealleakage or wheel rotation
Circumferentialseals:
The air seals that connect the rotating wheel to the cassette
Co-sorption: Desiccants very low potential for adsorbing contaminantmolecules along with water vapor
Desiccant Loading: Percent of rotor weight made up by desiccanttypically about80% for active wheels, and about 15% for passive
Desiccant Isotherm: Traditional graphical display of moisture pick-up by desiccanttypeordinate is relative humidity to which the desiccant isexposed, abscissa is either mass of moisture pick-up per mass ofdesiccant, or percentage of mass pick-up relative to maximumpick-up
Dump-back: Transfer of heat from regeneration air to process air either bycarryover or within the matrix itself
Face Seals: Air seals on the face of the wheel that divide the process andregeneration airflows and establish the wheel split
Face Velocity: Nominal average air velocity approaching the wheelvolumeflow rate divided by wheel face area
Flute: Individual airflow passage through the wheelFlute Geometry: Physical shape of a flute including aspect ratioaffects the
relationship between air-side mass transfer and pressure dropFlute Velocity: Actual average air velocity within the wheelrelated to face
velocity by matrix open areaHeat of Sorption: Sensible heat released into the process air and matrix when
desiccant sorbs water vapor
40
Mass Flow Ratio: Ratio of regeneration air mass flow to process air mass flowMatrix: Wheel core consisting of a substrate impregnated or coated with
desiccantprovides large surface area required for mass transferMoisture massbalance:
Figure of merit that indicates quality of testthe ratio ofmeasured moisture drop in the process air to measured moisturerise in the regeneration airmust be between 0.95 and 1.05
Moisture RemovalCapacity (MRC):
Dehumidification rate in pounds of dehumidification per hour(also performance)
Open Area: Percent of wheel face area not taken up by the matrixPI: Process inletPO: Process outletProcess: The airflow or side of the wheel where dehumidification occurs
taken from industrial terminology (supply in commercial terms)Primary energy: Fossil fuel combusted to produce heat or electricity(also source
energy)Regeneration: The airflow or side of the wheel where desorption occursRegenerationSpecific Heat Input(RSHI):
Energy input to the regeneration heater per pound ofdehumidification (also efficiency)
Energy input per pound of dehumidification including the benefitof heat exchange between process outlet air and regeneration airprior to the heater
RegenerationSpecific Heat Drop(RSHD):
Energy consumed by the wheel per pound of dehumidification
Residence Time: Amount of time air spends within the wheelwheel depthdivided by flute velocity
RI: Regeneration inletRO: Regeneration outletRotor: WheelSource energy: Fossil fuel combusted to produce heat or electricity, (also primary
energy)Std. 139: ASHRAE Standard 139 Method of Testing for Rating
Dehumidifiers Utilizing Heat for the Regenerative ProcessStd. 940: ARI Standard 940 Desiccant Dehumidification Components,
the basis for its upcoming National Certification Program forthese products.
Wavefront: Region within the wheel where mass transfer is occurringvariesaxially and circumferentially
Wheel: Disk consisting of the matrix, rim, and possibly a hub with spokesand axle for support (also rotor)
41
Wheel Depth: Thickness in the flow directionWheel Diameter: Largest wheel dimensionWheel Speed: Rotation rategiven in rotations per minute for passive and heat-
exchange wheels, in revolutions per hour for active wheels.Wheel Split: Percent of wheel face area allocated to process vs. regeneration
(e.g., 75/25 or 50/50)1M: Type 1 ModerateTheoretically ideal desiccant isotherm shape
required for effective/efficient performance at higher regenerationtemperatures
42
Appendix 2. Nomenclature
A Convective transfer surface area (ft2)AHR Adsorption Heat Ratiocp Specific heat of air (Btu/lb/°F)C* Ratio of minimum to maximum air heat capacity rates in an air-
to-air heat exchanger (unitless)rC Ratio of heat capacity rate of the matrix to the minimum air heat
capacity rate in a rotary air-to-air heat exchangerCOPlatent Coefficient of performance for latent coolingd Wheel depth (ft)
regenE Thermal energy input rate for active dehumidification (kBtu/h)
paraE Parasitic (electric) energy input for fans, wheel drive, etc (kBtu/h)
f Pressure drop friction factor (unitless)∆GPP Absolute humidity depression of the process air (grains/lbdryair)
rtGPP∆ Absolute humidity depression of the process air per second ofresidence time (grains/lbair/s)
h Convective heat transfer coefficient (Btu/hr/°F/ft2)hm Mass transfer analog to thermal convection coefficient h
(lb/hr/ft2)M Mass of a rotary exchanger matrix (lb)m Mass flow rate of air (lb/hr)
inm Moisture flux into the cassette (lbmoisture/min)
outm Moisture flux out of the cassette (lbmoisture/min)MRC Moisture Removal Capacity (lbmoisture/hr)MRCBtuh Moisture Removal Capacity as a latent cooling rate (kBtu/hr)MRC/Pf Moisture Removal Capacity per Watt of fan power needed to
move air through both sides of the wheel (lbmoisture/hr/W)MRR Moisture Removal Regeneration (lbmoisture/hr)NTU Number of transfer units for a heat exchanger (unitless)NTUmass Mass transfer analog to NTU (unitless)p Thermodynamic (static) air pressure (pascals)
fP Fan power required to overcome the wheel pressure drops (W)
pp∆ Pressure drop across the process side of the wheel (pascals)
rp∆ Pressure drop across the regeneration side of the wheel (pascals)pv Vapor pressure of water (pascals)pvs Saturation vapor pressure of water (pascals)pvs
* Saturation vapor pressure of water evaluated at the wet-bulbtemperature (pascals)
Q Process air volume flow rate (ft3/min)RSHI Regeneration Specific Heat Input Energy (kBtu/lbmoisture)
43
RSHIHX Regeneration Specific Heat Input Energy including the benefit ofheat exchange between process outlet air and regeneration airprior to the burner (kBtu/lbmoisture)
RSHD Regeneration Specific Heat Drop (kBtu/lbmoisture)St Stanton Number convective heat or mass transfer rate (unitless)T Temperature (F)t Dry-bulb temperature (F)t* Thermodynamic wet-bulb temperature (approximated as wet-bulb
temperature) (F)TPO,adiabatic The temperature achieved upon reaching a given grain depression
with no change in enthalpyessentially evaporative cooling inreverse
Vfl Flute velocity (ft/min)w Absolute Humidity Ratio (lbmoisture/lbdryair)∆w Absolute humidity depression of the process air (wPI - wPO)
(lbmoisture/lbdryair)ws
* Humidity ratio at the thermodynamic wet-bulb temperature(lbmoisture/lbdryair)
Greek symbols:εcf Counter-flow heat exchange effectiveness (unitless)Φ Decimal representation of relative humidity (unitless)φ Rotational frequency of a rotary exchanger (rph)
fanη Efficiency of the fans (unitless)
motorη Efficiency of the fan motors (unitless)
stdρ Standard density of air (0.075 lb/ft3)Subscripts:DB Dry-bulbDP Dew-point Approach for humidity measurementj Hot or cold side of the wheelmax The airflow in a heat exchanger with the larger heat capacity ratemin The airflow in a heat exchanger with the smaller heat capacity
rateP ProcessPI Process inletPO Process outletR RegenerationRH Relative Humidity Approach for humidity measurementRI Regeneration inletRO Regeneration outletrt Residence time of air inside the exchanger matrixWB Wet-bulb Approach for humidity measurement
REPORT DOCUMENTATION PAGE Form ApprovedOMB NO. 0704-0188
Public reporting burden for this collection of information is estimated to average 1 hour per response, including the time for reviewing instructions, searching existing data sources,gathering and maintaining the data needed, and completing and reviewing the collection of information. Send comments regarding this burden estimate or any other aspect of thiscollection of information, including suggestions for reducing this burden, to Washington Headquarters Services, Directorate for Information Operations and Reports, 1215 JeffersonDavis Highway, Suite 1204, Arlington, VA 22202-4302, and to the Office of Management and Budget, Paperwork Reduction Project (0704-0188), Washington, DC 20503.
1. AGENCY USE ONLY (Leave blank) 2. REPORT DATEDecember 2000
3. REPORT TYPE AND DATES COVEREDTechnical Report
4. TITLE AND SUBTITLEDesiccant Dehumidification Wheel Test Guide
6. AUTHOR(S)Steven J. Slayzak and Joseph P. Ryan
5. FUNDING NUMBERS
BET1.3001
7. PERFORMING ORGANIZATION NAME(S) AND ADDRESS(ES) 8. PERFORMING ORGANIZATIONREPORT NUMBER
9. SPONSORING/MONITORING AGENCY NAME(S) AND ADDRESS(ES)National Renewable Energy Laboratory1617 Cole Blvd.Golden, CO 80401-3393
10. SPONSORING/MONITORINGAGENCY REPORT NUMBER
NREL/TP-550-26131
11. SUPPLEMENTARY NOTESNREL Technical Monitor: NA
12a. DISTRIBUTION/AVAILABILITY STATEMENTNational Technical Information ServiceU.S. Department of Commerce5285 Port Royal RoadSpringfield, VA 22161
12b. DISTRIBUTION CODE
13. ABSTRACT (Maximum 200 words)NREL's Desiccant Dehumidification Wheel Test Guide intends to facilitate execution of the new standards by certificationlabs and manufacturers. The Test Guide is a product of more than 20 years of experience gained at NREL's desiccantresearch facilities. It details practical experimental experience with rotary mass exchangers in relation to the standards andaims to develop testing expertise in industry quickly and cost effectively.
15. NUMBER OF PAGES14. SUBJECT TERMSdesiccant dehumidification wheel, test guide, cooling, rotary mass exchangers, NREL,National Renewable Energy Laboratory, Advanced Heating Ventilation and Air-Conditioning, HVAC, Department of Energy, DOE 16. PRICE CODE
17. SECURITY CLASSIFICATIONOF REPORTUnclassified
18. SECURITY CLASSIFICATIONOF THIS PAGEUnclassified