Page 1
HYDROGEN DESIGN COMPETITION 2017
DESIGN A POWER TO GAS SYSTEM
Power To Gas Solar Generation to Develop Future
Hydrogen Industries in Moquegua, Peru
Team Members Enzo Ochoa Energy Engineering Student
Alejandra Valdivia Energy Engineering Student
Claudia Ames chemical Engineering Student
Luz Cirineo Chemical EngineeringStudent
Faculty Advisor Dr. José Ramos-Saravia
Page 2
Executive Summary
The environmental impact produced by conventional fuels is a problem of great concern at
present. Likewise, the traditional fuels used in Peru are from non-renewable energy sources,
therefore new alternatives must be sought to generate low emission energy and renewable
sources. A great alternative is hydrogen, which can be obtained from renewable energy and
water. Hydrogen, due to its high calorific value, is more efficient to produce thermal energy
than traditional fuels. In addition, the only products emitted after combustion are water and
oxygen resulting in zero carbon emissions to the environment. For these reasons, hydrogen
is now considered as an important fuel and with a high potential for development in new
markets.
The development of our project is located in the province of Mariscal Nieto, department of
Moquegua, whose altitude is 1410 meters above sea level. These locations were selected
due to their high potential in renewable energy resources such as solar and wind energy.
Likewise, an increase in the demand for energy, oxygen and demineralized water is
projected for future projects of mineral smelting and mining processes.
The first objective is to design a system that uses electrical energy to produce hydrogen,
such as:
- Energy storage (Backup) for Smelter of Ilo that is part of the company Southern Peru
Cooper Corporation (SPCC).
- Fuel for transportation (Natural Gas + Hydrogen) for Smelting and Mining Processes
of Southern Peru Cooper Corporation (SPCC)
- Auxiliary services (Provide desalinated water and Demineralized water) to cover the
shortage of water resources of the department.
A contract will be made with the Panamericana Solar S.A.C. who is the concessionaire of
the solar park called "Panamericana Solar". The park has the technology of photovoltaic
solar generation of mobile modules. It has an installed capacity of 20 MW and an investment
of 94 588 MM $ [1]. Currently, it delivers a power of 16 MW to the National Interconnected
System (SEIN). The electric connection supply point is located at the Ilo ELP bar of 138kv
and the price of the offered energy is 0.215 $ / kwh.
A contract will be made with the company Fenosa, which is present in the cities of Arequipa,
Moquegua, Ilo and Tacna, which together generate 18% of Peru's GDP (excluding Lima).
The urban population is more than 1,500,000 inhabitants and 358 thousand homes, as well
as a fleet of more than 93 thousand vehicles. This area is characterized by having important
industrial developments including Smelting and Mining. Therefore Fenosa will be the
supplier of Natural Gas that will be used to enrich hydrogen.
Page 3
Table of contents
Executive Summary 1
Table of contents Error! Bookmark not defined.
Sitting and local problematic 3
Future Energy Demand 3
Water Stress 4
Environmental Contamination 5
Transport and commercialization of Natural Gas 5
Propuesta de solución 5
Ubicación de la Planta 6
Layout 7
Design Data and Equipment Drawings 8
First Subsystem: Desalination 8
Second Subsystem: Electrolysis 8
Third Subsystem: Hydrogen Enrichment of Natural Gas 8
Fourth System: Backup Energy with fuel cell 9
Cost and Economics 9
Safety Analysis & Codes and Standards 10
Internacional
Operation and Maintenance 10
Environmental Analysis 10
Huella de carbono 11
Policy/Regulatory Analysis
National 11
References 12
Page 4
Solar Park
Ilo Copper Smelter
Electrolysis Plant
20 km
I. Sitting and local problematic
In this section, mining activity and copper smelting in the city of Ilo are shown as the main industries
that project positive growth in the demand for energy, backup energy systems and water for its
internal process. The city of Ilo is located in the department of Moquegua, south of Peru. The
reasons for the selection of this city is explained in the following paragraphs where the local
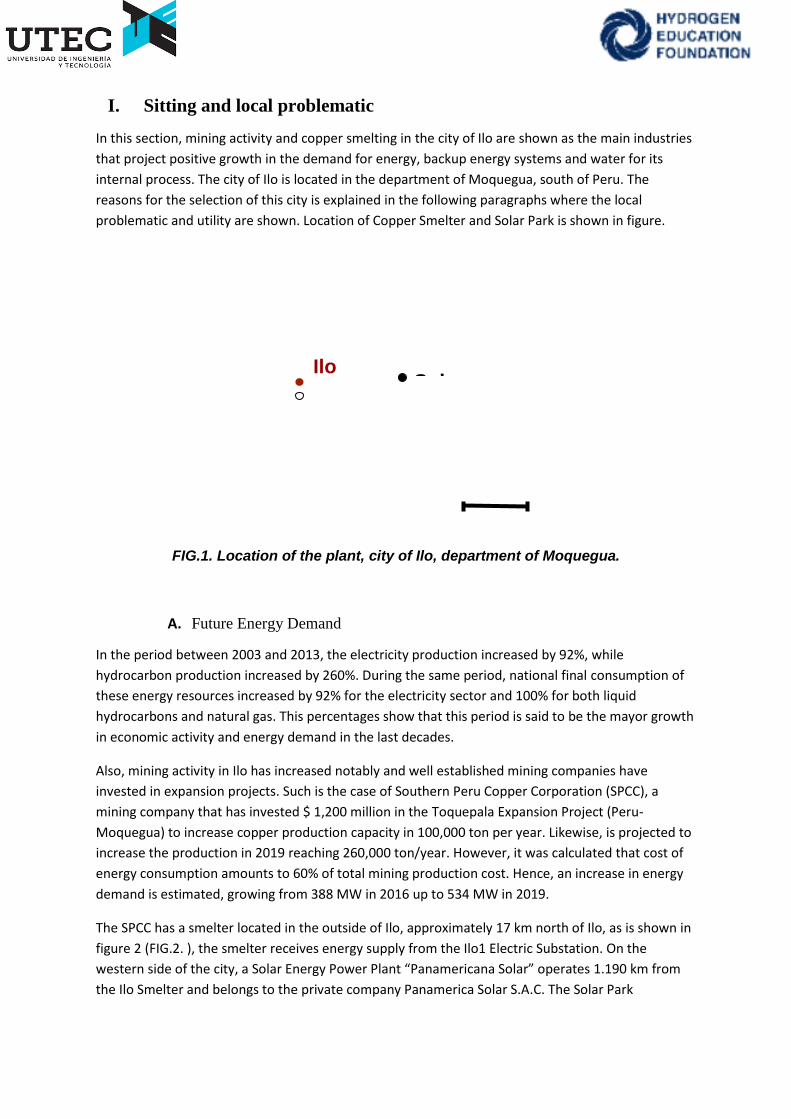
problematic and utility are shown. Location of Copper Smelter and Solar Park is shown in figure.
FIG.1. Location of the plant, city of Ilo, department of Moquegua.
A. Future Energy Demand
In the period between 2003 and 2013, the electricity production increased by 92%, while
hydrocarbon production increased by 260%. During the same period, national final consumption of
these energy resources increased by 92% for the electricity sector and 100% for both liquid
hydrocarbons and natural gas. This percentages show that this period is said to be the mayor growth
in economic activity and energy demand in the last decades.
Also, mining activity in Ilo has increased notably and well established mining companies have
invested in expansion projects. Such is the case of Southern Peru Copper Corporation (SPCC), a
mining company that has invested $ 1,200 million in the Toquepala Expansion Project (Peru-
Moquegua) to increase copper production capacity in 100,000 ton per year. Likewise, is projected to
increase the production in 2019 reaching 260,000 ton/year. However, it was calculated that cost of
energy consumption amounts to 60% of total mining production cost. Hence, an increase in energy
demand is estimated, growing from 388 MW in 2016 up to 534 MW in 2019.
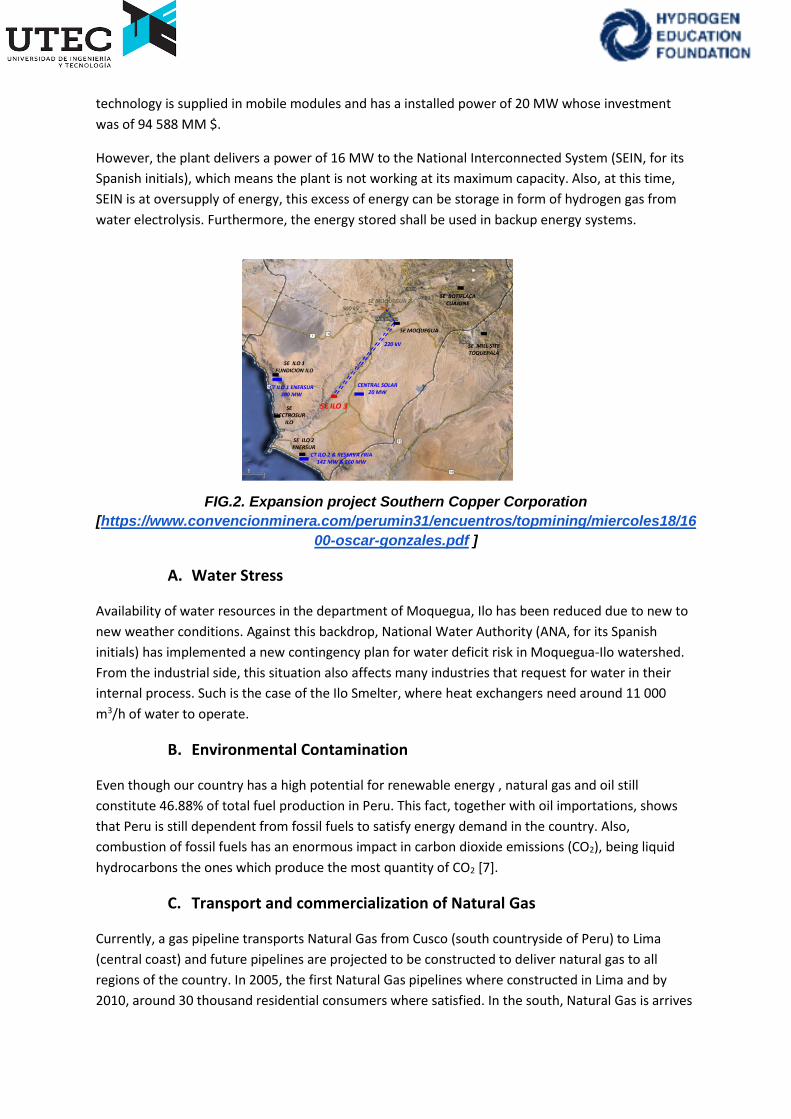
The SPCC has a smelter located in the outside of Ilo, approximately 17 km north of Ilo, as is shown in
figure 2 (FIG.2. ), the smelter receives energy supply from the Ilo1 Electric Substation. On the
western side of the city, a Solar Energy Power Plant “Panamericana Solar” operates 1.190 km from
the Ilo Smelter and belongs to the private company Panamerica Solar S.A.C. The Solar Park
Page 5
technology is supplied in mobile modules and has a installed power of 20 MW whose investment
was of 94 588 MM $.
However, the plant delivers a power of 16 MW to the National Interconnected System (SEIN, for its
Spanish initials), which means the plant is not working at its maximum capacity. Also, at this time,
SEIN is at oversupply of energy, this excess of energy can be storage in form of hydrogen gas from
water electrolysis. Furthermore, the energy stored shall be used in backup energy systems.
FIG.2. Expansion project Southern Copper Corporation
[https://www.convencionminera.com/perumin31/encuentros/topmining/miercoles18/16
00-oscar-gonzales.pdf ]
A. Water Stress
Availability of water resources in the department of Moquegua, Ilo has been reduced due to new to
new weather conditions. Against this backdrop, National Water Authority (ANA, for its Spanish
initials) has implemented a new contingency plan for water deficit risk in Moquegua-Ilo watershed.
From the industrial side, this situation also affects many industries that request for water in their
internal process. Such is the case of the Ilo Smelter, where heat exchangers need around 11 000
m3/h of water to operate.
B. Environmental Contamination
Even though our country has a high potential for renewable energy , natural gas and oil still
constitute 46.88% of total fuel production in Peru. This fact, together with oil importations, shows
that Peru is still dependent from fossil fuels to satisfy energy demand in the country. Also,
combustion of fossil fuels has an enormous impact in carbon dioxide emissions (CO2), being liquid
hydrocarbons the ones which produce the most quantity of CO2 [7].
C. Transport and commercialization of Natural Gas
Currently, a gas pipeline transports Natural Gas from Cusco (south countryside of Peru) to Lima
(central coast) and future pipelines are projected to be constructed to deliver natural gas to all
regions of the country. In 2005, the first Natural Gas pipelines where constructed in Lima and by
2010, around 30 thousand residential consumers where satisfied. In the south, Natural Gas is arrives
Page 6
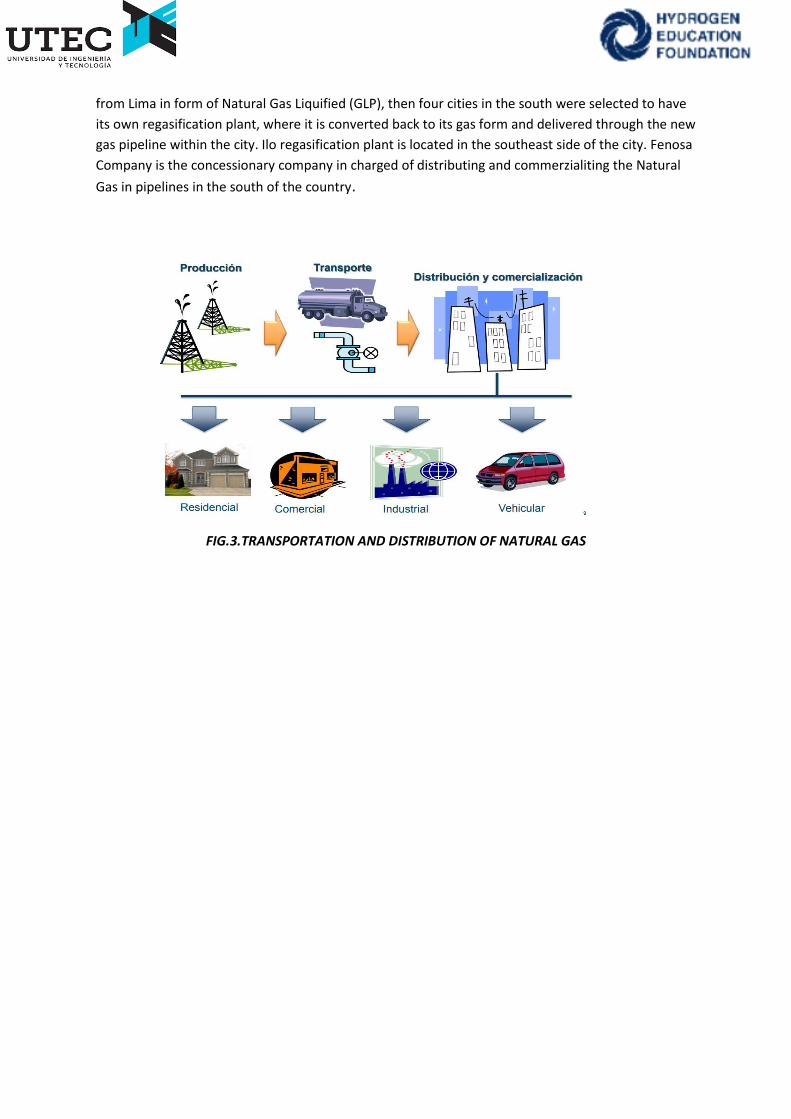
from Lima in form of Natural Gas Liquified (GLP), then four cities in the south were selected to have
its own regasification plant, where it is converted back to its gas form and delivered through the new
gas pipeline within the city. Ilo regasification plant is located in the southeast side of the city. Fenosa
Company is the concessionary company in charged of distributing and commerzialiting the Natural
Gas in pipelines in the south of the country.
FIG.3.TRANSPORTATION AND DISTRIBUTION OF NATURAL GAS
Page 7
II. Proposed Solution
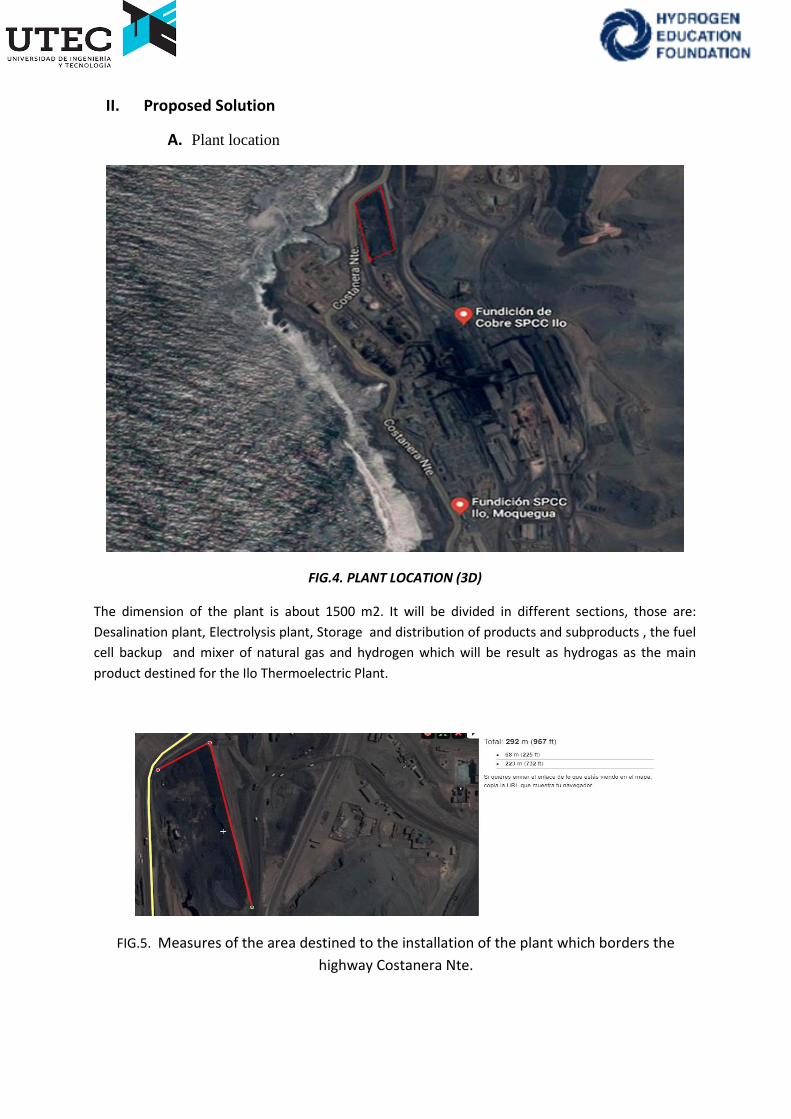
A. Plant location
FIG.4. PLANT LOCATION (3D)
The dimension of the plant is about 1500 m2. It will be divided in different sections, those are:
Desalination plant, Electrolysis plant, Storage and distribution of products and subproducts , the fuel
cell backup and mixer of natural gas and hydrogen which will be result as hydrogas as the main
product destined for the Ilo Thermoelectric Plant.
FIG.5. Measures of the area destined to the installation of the plant which borders the
highway Costanera Nte.
Page 8
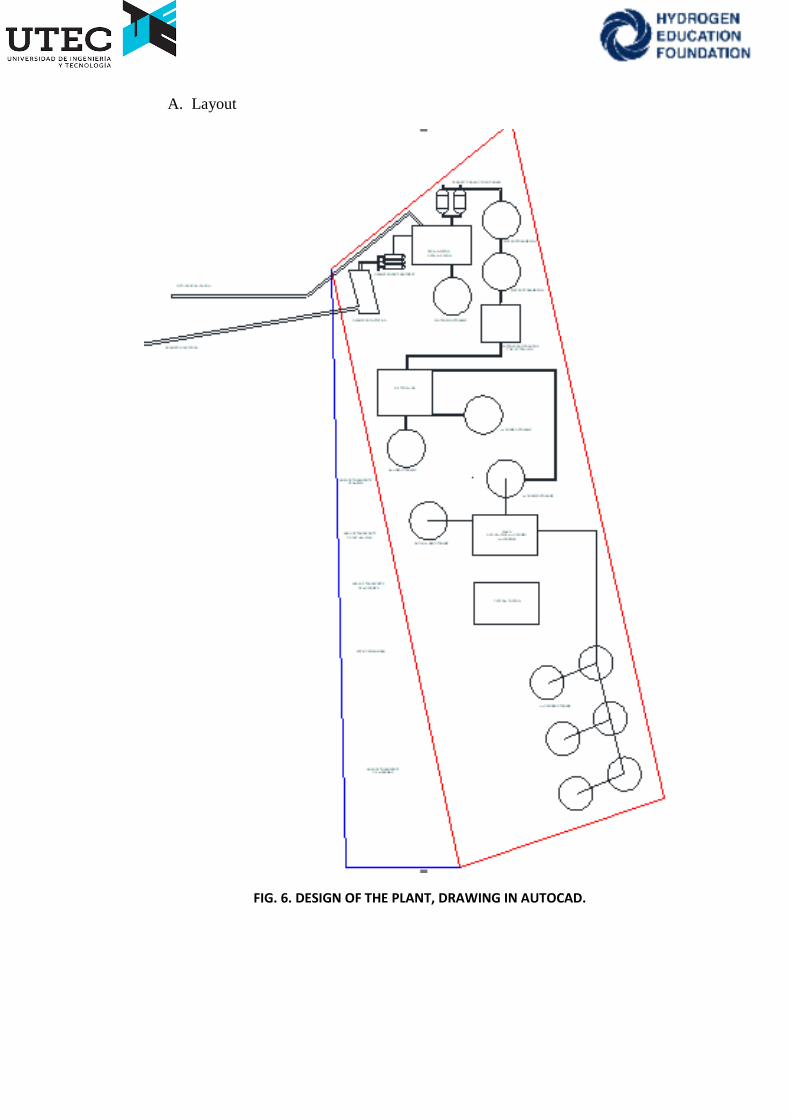
A. Layout
FIG. 6. DESIGN OF THE PLANT, DRAWING IN AUTOCAD.
Page 9
III. Design Data and Equipment Drawings
The power plant is composed in four subsystems, these subsystems are developed in the following
paragraphs.
A. First Subsystem: Desalination
A Reversed Osmosis (RO) water desalination is a technology already used in the Southern Peru
Company. Currently, the company has two desalination plants in operation which produce 110m3/h
in total of sweet water. This water is used in the oven ISASMELT for the smelting copper process in
the Smelter of Ilo. Likewise, our team proposes the addition of a new desalination module to
sufficient the water consumption from the electrolysis subsystem.
For the water desalination process, a PS-RO 1018 was chosen. This module will have a capacity of
1000 - 1800 L/day of sweet water.. The technology used is RO and is capable of reducing up to 40
000 ppm of TDS, this way the output water is near demineralised. This desalination module was
chosen due to the purity of its output water. Water purity was considered for the correct operation
of the electrolyzer, which will use the produced demineralised water, in order to avoid component
damages. Another desalination technologies is distillation.
FIG. 7. DESIGN OF THE PLANT DESALINATION
B. Second Subsystem: Electrolysis
In order to supply energy for all the electricity consumption, Desalination and Electrolysis
subsystems, a contract of 4 MW will be formed with the company Panamericana Solar S.A.C. The
Solar Energy Power Plant “Panamericana Solar” was selected as the renewable energy supplier. The
Solar Park technology is supplied in mobile modules and has a installed power of 20 MW whose
investment was of 94 588 MM $ [10]. At this time, the plant delivers a power of 16 MW to the
Page 10
National Interconnected System (SEIN). The point of offer of the electric connection is located in the
Barra Ilo ELP of 138 kv and the price of the power bid is 0.215 $kWh.
For the electrolysis process, the HyStat 10 was chosen, it has a water storage capacity of 10 m3, with
these specifications the energy consumed is calculated which is 4,9 kWh. This way, this power
installed and 10 m3 of water the electrolyzer will produce 10Nm3/h of hydrogen with a purity of
99,8 % .
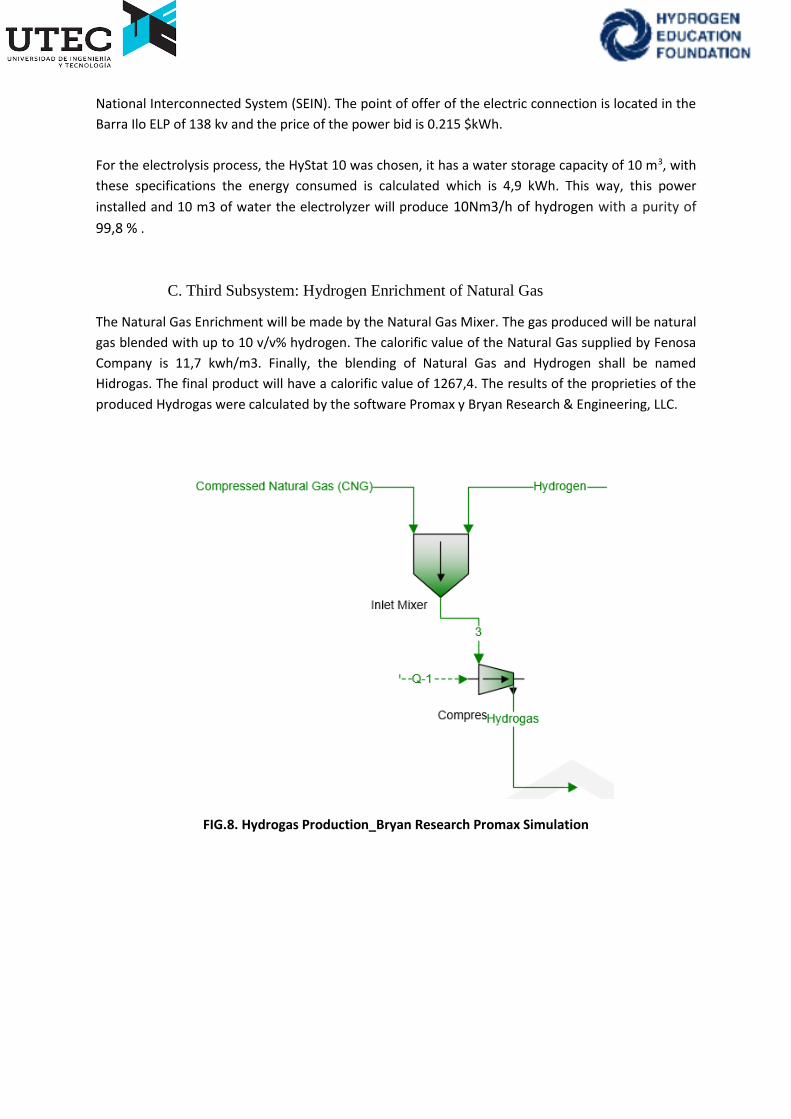
C. Third Subsystem: Hydrogen Enrichment of Natural Gas
The Natural Gas Enrichment will be made by the Natural Gas Mixer. The gas produced will be natural
gas blended with up to 10 v/v% hydrogen. The calorific value of the Natural Gas supplied by Fenosa
Company is 11,7 kwh/m3. Finally, the blending of Natural Gas and Hydrogen shall be named
Hidrogas. The final product will have a calorific value of 1267,4. The results of the proprieties of the
produced Hydrogas were calculated by the software Promax y Bryan Research & Engineering, LLC.
FIG.8. Hydrogas Production_Bryan Research Promax Simulation
Page 11
FIG.9. Hydrogas Properties
Page 12
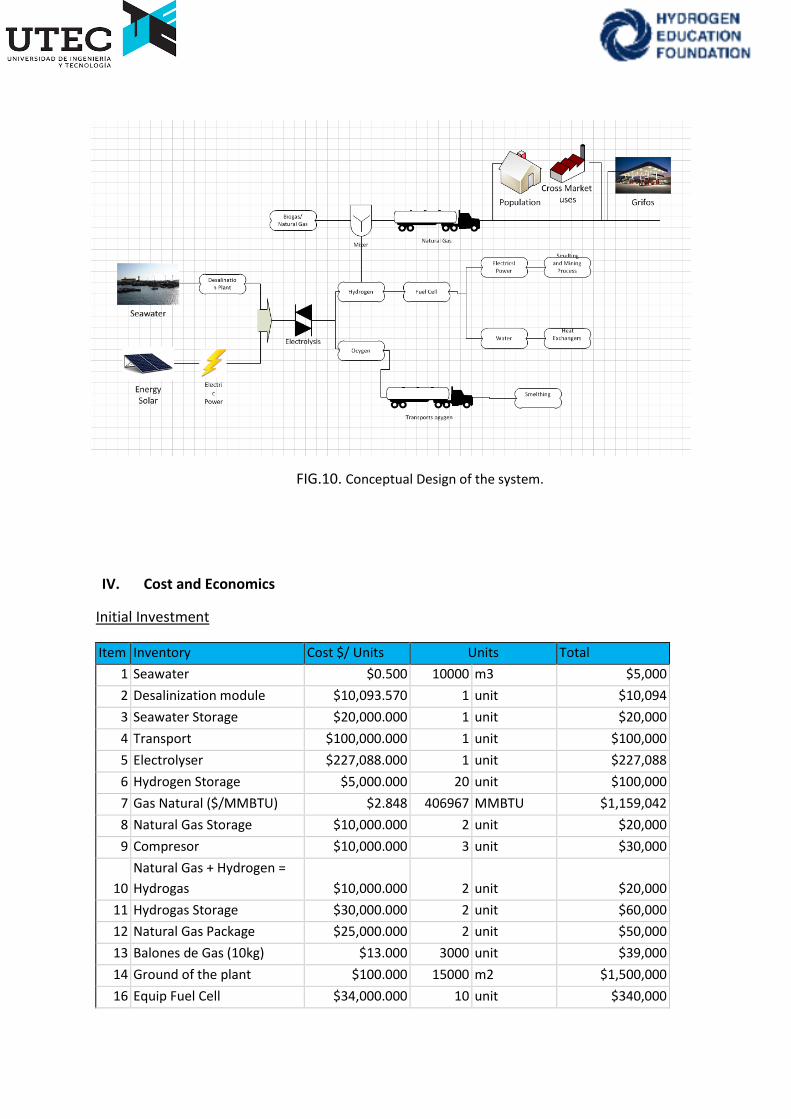
FIG.10. Conceptual Design of the system.
IV. Cost and Economics
Initial Investment
Item Inventory Cost $/ Units Units Total
1 Seawater $0.500 10000 m3 $5,000
2 Desalinization module $10,093.570 1 unit $10,094
3 Seawater Storage $20,000.000 1 unit $20,000
4 Transport $100,000.000 1 unit $100,000
5 Electrolyser $227,088.000 1 unit $227,088
6 Hydrogen Storage $5,000.000 20 unit $100,000
7 Gas Natural ($/MMBTU) $2.848 406967 MMBTU $1,159,042
8 Natural Gas Storage $10,000.000 2 unit $20,000
9 Compresor $10,000.000 3 unit $30,000
10
Natural Gas + Hydrogen =
Hydrogas $10,000.000 2 unit $20,000
11 Hydrogas Storage $30,000.000 2 unit $60,000
12 Natural Gas Package $25,000.000 2 unit $50,000
13 Balones de Gas (10kg) $13.000 3000 unit $39,000
14 Ground of the plant $100.000 15000 m2 $1,500,000
16 Equip Fuel Cell $34,000.000 10 unit $340,000
Page 13
17 Energy Consume $/kwh $0.215 8760000 kwh $1,883,400
15 Installation $1,105,376
Investment $6,669,000.00
Sales Analysis 1st Year
SALES
Form of Product Price Units
Quantity
Hydrogen (m3)
Quantity
NG (m3)
Hydrogas
Sold (m3) Total ($)
Container
>200m3 5.10
$/m3 120000 1200000 1,320,000 $ 6,732,000.00
Container
<200m3 7.14
$/m3 120000 1200000 1,320,000 $ 9,424,800.00
Premium Gas
10kg (GN + H) 3.03
$/m3 240000 2400000 2,640,000 $ 7,999,200.00
Standar Gas
10kg (GN + H) 2.53
$/m3 120000 1200000 1,320,000 $ 3,333,000.00
- 600000
Oxygen (O) 0.18 $/m3 300,000 $ 54,540.00
Water 0.02 $/m3 900,000 $ 18,180.00
Total Sales $ 27,561,720.00
Costs Analysis 1st Year
COST
Price Units
Quantity
Hydrogen
(m3)
Quantity
NG (m3)
Quantity
Sales (m3) Total ($)
Container
>200m3 4.75 $/m3 120000 1200000 1,320,000 $ (6,270,000.00)
Container<20
0m3 6.65 $/m3 120000 1200000 1,320,000 $ (8,778,000.00)
Premium Gas
10kg (GN + H) 2.85 $/m3 240000 2400000 2,640,000 $ (7,524,000.00)
Standar Gas
10kg (GN + H) 2.38 $/m3 120000 1200000 1,320,000 $ (3,135,000.00)
- 600000
Oxygen (O) 0.17 $/m3 300,000 $ (51,300.00)
Water 0.02 $/m3 900,000 $ (17,100.00)
Total Cost $ (25,775,400.00)
Page 14
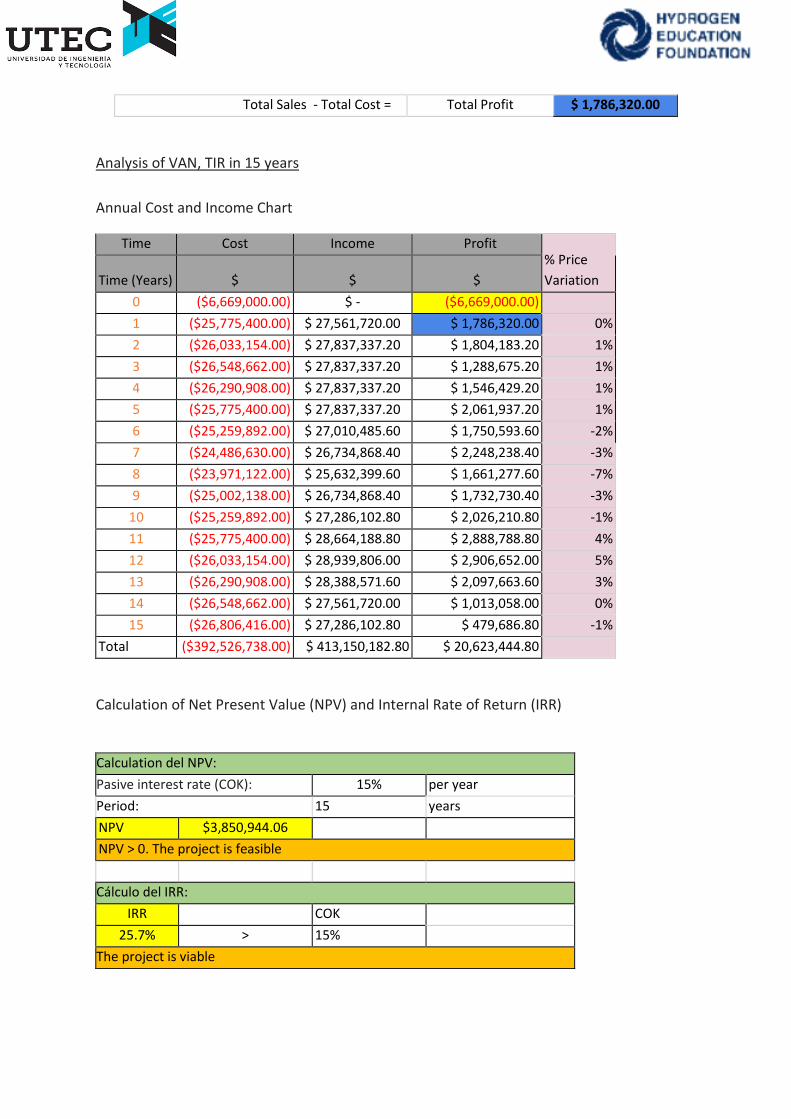
Total Sales - Total Cost = Total Profit $ 1,786,320.00
Analysis of VAN, TIR in 15 years
Annual Cost and Income Chart
Time Cost Income Profit % Price
Variation Time (Years) $ $ $
0 ($6,669,000.00) $ - ($6,669,000.00)
1 ($25,775,400.00) $ 27,561,720.00 $ 1,786,320.00 0%
2 ($26,033,154.00) $ 27,837,337.20 $ 1,804,183.20 1%
3 ($26,548,662.00) $ 27,837,337.20 $ 1,288,675.20 1%
4 ($26,290,908.00) $ 27,837,337.20 $ 1,546,429.20 1%
5 ($25,775,400.00) $ 27,837,337.20 $ 2,061,937.20 1%
6 ($25,259,892.00) $ 27,010,485.60 $ 1,750,593.60 -2%
7 ($24,486,630.00) $ 26,734,868.40 $ 2,248,238.40 -3%
8 ($23,971,122.00) $ 25,632,399.60 $ 1,661,277.60 -7%
9 ($25,002,138.00) $ 26,734,868.40 $ 1,732,730.40 -3%
10 ($25,259,892.00) $ 27,286,102.80 $ 2,026,210.80 -1%
11 ($25,775,400.00) $ 28,664,188.80 $ 2,888,788.80 4%
12 ($26,033,154.00) $ 28,939,806.00 $ 2,906,652.00 5%
13 ($26,290,908.00) $ 28,388,571.60 $ 2,097,663.60 3%
14 ($26,548,662.00) $ 27,561,720.00 $ 1,013,058.00 0%
15 ($26,806,416.00) $ 27,286,102.80 $ 479,686.80 -1%
Total ($392,526,738.00) $ 413,150,182.80 $ 20,623,444.80
Calculation of Net Present Value (NPV) and Internal Rate of Return (IRR)
Calculation del NPV:
Pasive interest rate (COK): 15% per year
Period: 15 years
NPV $3,850,944.06
NPV > 0. The project is feasible
Cálculo del IRR:
IRR COK
25.7% > 15%
The project is viable
Page 15
V. Safety Analysis & Codes and Standards
A. International
NFPA 10: Standard for Portable Fire Extinguishers.
NFPA 55: Compressed Gases and Cryogenic Fluids Code.
NFPA 55 - National Fire Protection Association.
NFPA 853: Standard for the Installation of Stationary Fuel Cell Power Systems, 2015 Edition.
ANSI/CSA FC 1-2014 - Fuel cell technologies - Part 3-100: Stationary fuel cell power systems -
Safety (Adopted IEC 62282-3-100:12, first edition, 2012-02 with U.S. deviations).
CGA P-1: Safe Handling of Compressed Gases.
ASTM D760 Standard Practice for Sampling of High Pressure Hydrogen and Related Fuel Cell
Feed Gases.
National Fire Protection Association (NFPA) 2 Hydrogen Technologies Codes 2. ISO Draft
International.
Standard (DIS) 26142 Hydrogen Detection Apparatus.
Page 16
International Building Code (International Code Council, 2009)
VI. Operation and Maintenance
A. Electrolyzer
Life expectancy of the electrolyzer is estimated to be __ years considering __. After this period of
time, cost of replacement or maintenance service is equivalent to _% of the original cost, this service
will be coordinated with Hydrogenics. HyStat 10 electrolyzer was chosen due to its integrated design
which includes a purification system, closed loop refrigeration system, feed water treatment. Also,
the electrolyzer posses operational autonomy because this equipment is driven by a control panel,
which converts it into a whole autonomous unit.
A. Desalination Module
Daily use of the desalination module brings benefits to the maintenance of the equipment because,
while is operating, it prevents the accumulation of salts and minerals that sea water brings. For this
reason, life expectancy of the desalination module is 3 to 5 years and the equipment maintenance is
only membrane cleaning with chemicals.
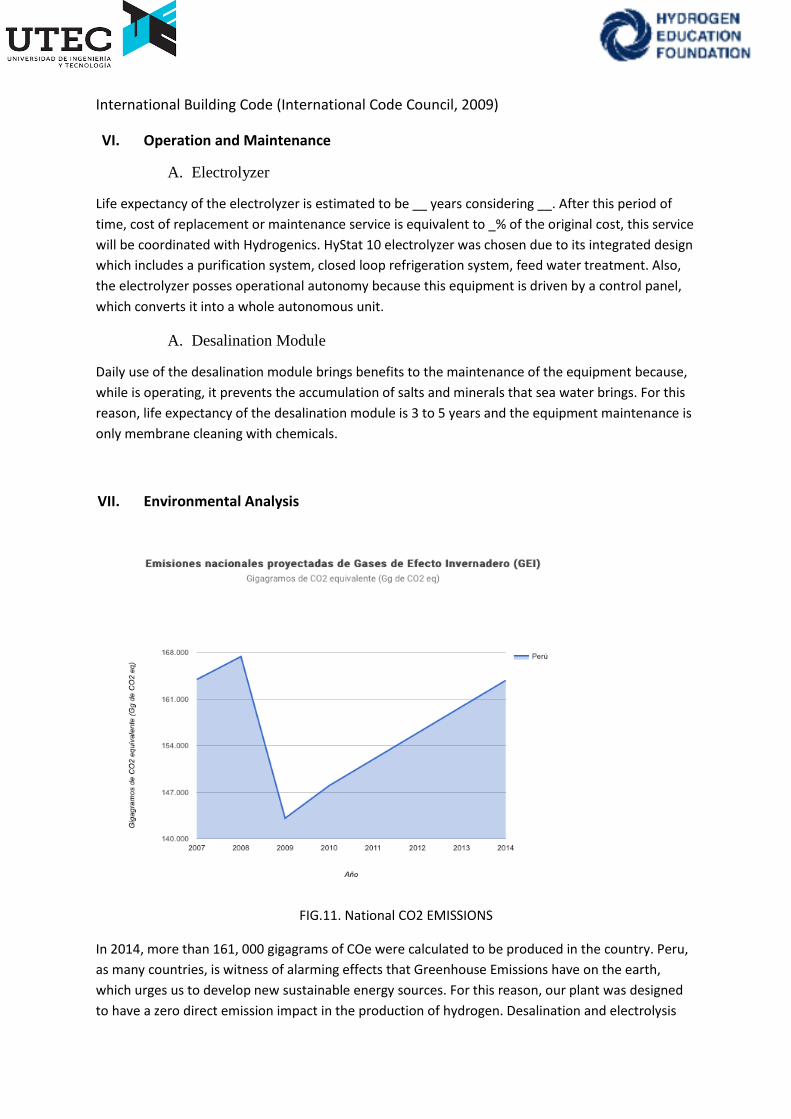
VII. Environmental Analysis
FIG.11. National CO2 EMISSIONS
In 2014, more than 161, 000 gigagrams of COe were calculated to be produced in the country. Peru,
as many countries, is witness of alarming effects that Greenhouse Emissions have on the earth,
which urges us to develop new sustainable energy sources. For this reason, our plant was designed
to have a zero direct emission impact in the production of hydrogen. Desalination and electrolysis
Page 17
will consume solar energy. Hence, the consumption of hydrogen in the fuel cells installed in the SPCC
Ilo Smelter will have no emissions. Currently, SPCC has a contract for 240 MW that proceeds from a
hydroelectric and a thermal power plant. However, when the energy consumed exceeds energy
supplied, the company needs to buy more energy from the national grid SEIN. With the backup
energy system, the mining company will not need to consume energy from the national grid and
Carbon Dioxide emissions will be reduced.
For the production of Enriched Natural Gas, tanks will transport the natural gas to the hydrogen
production plant and after the enrichment process the new gas will be transported to the thermal
power plant. The type of fuel consumed will depend on the type of tank. However, a vehicular fuel
emission factor is detailed in the following table.
Emissions kg CO2
GLP 6,326907019
Gas Natural 1,615544366
Emissions kg CH4
GLP 0,0005013397004
Gas Natural 0,0001439879114
Emissions kg N2O
GLP 0,00001002679401
Gas Natural 0,000002879758228
Page 18
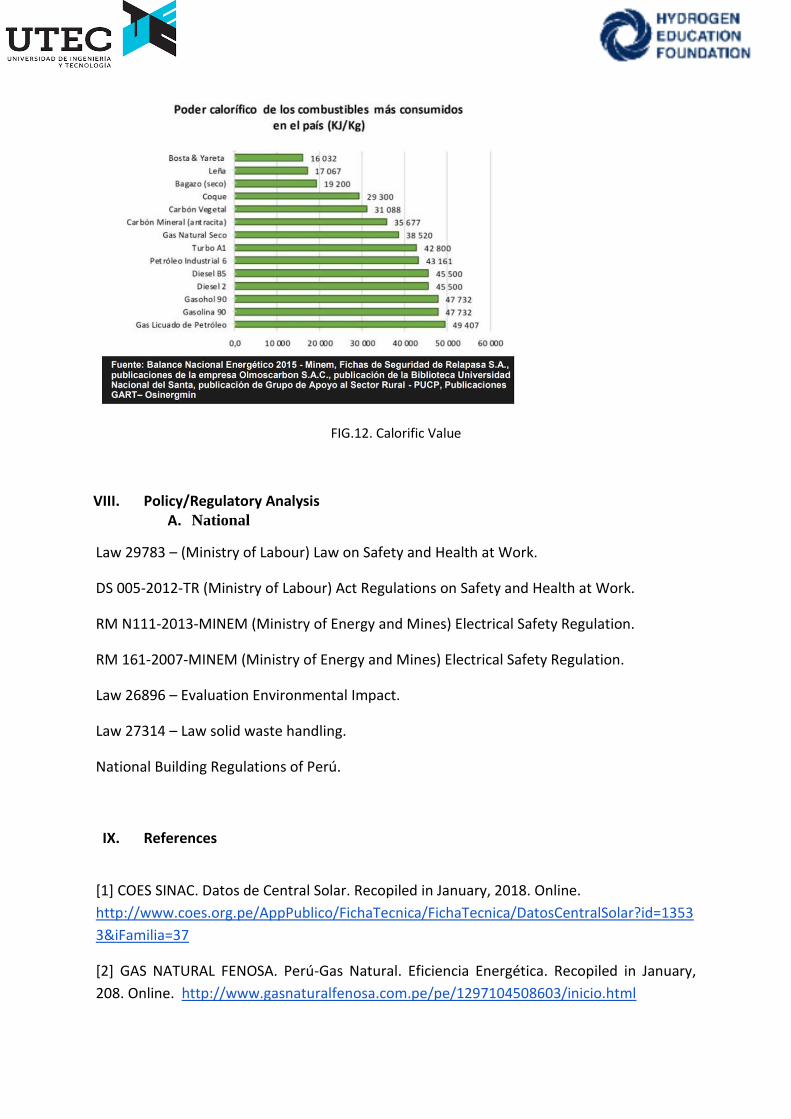
FIG.12. Calorific Value
VIII. Policy/Regulatory Analysis A. National
Law 29783 – (Ministry of Labour) Law on Safety and Health at Work.
DS 005-2012-TR (Ministry of Labour) Act Regulations on Safety and Health at Work.
RM N111-2013-MINEM (Ministry of Energy and Mines) Electrical Safety Regulation.
RM 161-2007-MINEM (Ministry of Energy and Mines) Electrical Safety Regulation.
Law 26896 – Evaluation Environmental Impact.
Law 27314 – Law solid waste handling.
National Building Regulations of Perú.
IX. References
[1] COES SINAC. Datos de Central Solar. Recopiled in January, 2018. Online.
http://www.coes.org.pe/AppPublico/FichaTecnica/FichaTecnica/DatosCentralSolar?id=1353
3&iFamilia=37
[2] GAS NATURAL FENOSA. Perú-Gas Natural. Eficiencia Energética. Recopiled in January,
208. Online. http://www.gasnaturalfenosa.com.pe/pe/1297104508603/inicio.html
Page 19
[3] GAS NATURAL FENOSA. Perú-Gas Natural. Distribución de Gas Natural. Recopiled in
January, 2018. Online.
http://www.gasnaturalfenosa.com.pe/pe/conocenos/la+compania/nuestra+compania/orga
nizacion+local/1297247503077/distribucion+de+gas+natural.html
[4] Plan Energético Nacional 2014-2025. Ministerio de Energia y Minas. Pg. 9. Year 2014.
Online. http://deltavolt.pe/documentos/Resumen2014-2025Vf.pdf.
[5] AUTORIDAD NACIONAL DEL AGUA (ANA). published in February , 2016. Online.
http://www.ana.gob.pe/noticia/ana-aprueba-planes-de-contingencia-por-riesgo-de-deficit-
hidrico-en-cuenca-moquegua-ilo
[6] Plan Energético Nacional Perú 2014-2015. MINEM
[7] Departamento de Estudios Económicos de la Sucursal Arequipa, “Caracterización de
Moquegua,” BCRP, Arequipa, ARQ, Peru, 2016. [Online]. Available:
http://www.bcrp.gob.pe/docs/Sucursales/Arequipa/moquegua-caracterizacion.pdf
[8] National Renevable Energy Laboratory SWERA. Departamento EEUU.
[9] Osinergmin, “Portal corporativo del Organismo Supervisor de la Minería y la Energía –
OSINERGMIN y presentaciones institucionales”, Gerencia de Fiscalización Eléctrica y
Gerencia Adjunta de Regulación Tarifaria. Lima, Peru, 2016.
[10] E. Quintanilla, “Perú: Soluciones para un mercado eléctrico de alto crecimiento -
Promoción de energías renovables… y competitivas”, in Cuadernos de Energía, 48th ed.
Madrid, Spain: ENERCLUB, 2016, ch 2, pp. 10. [Online]. Available:
https://www2.deloitte.com/content/dam/Deloitte/ec/Documents/energy-
resources/Deloitte-ES-Energia-cuadernos-de-energia-48.pdf
[11] Oficina de Planeamiento, Inversiones y Cooperación Internacional, “Balance de Energía
2007” MINEM, Lima, LIM, Peru, 2007. [Online]. Available:
http://sinia.minam.gob.pe/documentos/balance-nacional-energia-2007
[12] Southern Copper Grupo Mexico, “Cumpliendo Metas Informe Anual” 2015, pp. 7.
[Online]. Available:
http://www.southernperu.com/esp/relinv/2015/AnnualReport/informe2015.pdf
[13] Convención Minera, “Proyectos de Expansión de Southern Peru Copper Corporation”
pp. 30. [Online]. Available:
https://www.convencionminera.com/perumin31/encuentros/topmining/miercoles18/1600-
oscar-gonzales.pdf
[14] Southern Copper Grupo Mexico, “Informe Anual Íntegramente Sólido” 2016, pp. 6.
[Online]. Available:
http://www.southernperu.com/esp/relinv/2016/AnnualReport/m2016e.pdf
[15] Hydrogenics, “Datasheet Fuel Cell Megawatt Power Generation platform”, 2017
[Online]. Available: http://www.hydrogenics.com/wp-content/uploads/fuel-cell-megawatt-
power-plant-platform.pdf
[16] Hydrogenics, “Datasheet Hydrogen Fueling Stations”, 2017. [Online]. Available:
http://www.hydrogenics.com/hydrogen-products-solutions/energy-storage-fueling-
solutions/hydrogen-fueling-stations/
Page 20
[17] Alstom, “Coradia iLint A full emission-free train”, 2016 [Online]. Available:
http://www.alstom.com/Global/Transport/Resources/Documents/brochure2014/Coradia%
20iLint%20-%20Product%20sheet%20-%20English.pdf?epslanguage=en-GB
[18] Al Power Labs, “Datasheet Gek Gasifier KIT”, 2015 [Online]. Available:
http://www.allpowerlabs.com/products/gasifier-kits
[19] H. Martinez “Design of a desalination plant: Aspects to consider”. University of Gavle,
Sweden, 2010. [Online]. Available: http://www.diva-
portal.org/smash/get/diva2:325813/fulltext01
[20] Autoridad Nacional del Agua (ANA) http://www.ana.gob.pe/noticia/ana-aprueba-
planes-de-contingencia-por-riesgo-de-deficit-hidrico-en-cuenca-moquegua-ilo
[21] Universidad Nacional San Antonio Abad del Cuzco. Carrera Profesional de Ingenieria
Metalúrgica. 2014.
https://es.scribd.com/document/239228102/Fundicion-y-Refineria-de-Ilo
[22] PLATAFORMA DE DEFENSA CIVIL ILO TOMA ACCIONES ANTE DÉFICIT HÍDRICO EN LA
REGIÓN MOQUEGUA.
http://www.mpi.gob.pe/noticias/2231-plataforma-de-defensa-civil-ilo-toma-acciones-ante-
deficit-hidrico-en-la-region-moquegua
Page 21
Universidad de Ingenieria y Technologia Final Submission Links
https://www.youtube.com/watch?v=-aEbZ8A6Z_E&feature=youtu.be