A&A 495, 363–370 (2009) DOI: 10.1051/0004-6361:200810918 c ESO 2009 Astronomy & Astrophysics Design, analysis, and testing of a microdot apodizer for the Apodized Pupil Lyot Coronagraph P. Martinez 1,2,5 , C. Dorrer 3 , E. Aller Carpentier 1 , M. Kasper 1 , A. Boccaletti 2,5 , K. Dohlen 4 , and N. Yaitskova 1 1 European Southern Observatory, Karl-Schwarzschild-Strasse 2, 85748 Garching, Germany e-mail: [email protected]2 LESIA, Observatoire de Paris Meudon, 5 pl. J. Janssen, 92195 Meudon, France 3 Laboratory for Laser Energetics-University of Rochester, 250 East River Rd, Rochester, NY, 14623-USA, USA 4 LAM, Laboratoire d´Astrophysique de Marseille, 38 rue Frédéric Joliot Curie, 13388 Marseille Cedex 13, France 5 Groupement d´intérêt scientifique PHASE (Partenariat Haute résolution Angulaire Sol Espace) Receved 5 September 2008 / Accepted 29 October 2008 ABSTRACT Context. Coronagraphic techniques are required for detecting exoplanets with future Extremely Large Telescopes. One concept, the Apodized Pupil Lyot Coronagraph (APLC), combines an apodizer in the entrance aperture with a Lyot opaque mask in the focal plane. This paper presents the manufacturing and testing of a microdots apodizer optimized for the near IR. Aims. We attempt to demonstrate the feasibility and performance of binary apodizers for the APLC. This study is also relevant to coronagraph using amplitude pupil apodization. Methods. A binary apodizer was designed using a halftone-dot process, where the binary array of pixels with either 0% or 100% transmission was calculated to fit the required continuous transmission, i.e. local transmission control was obtained by varying the relative density of the opaque and transparent pixels. An error-di ffusion algorithm was used to optimize the distribution of pixels that approximated the required field transmission. The prototype was tested with a coronagraphic setup in the near IR. Results. The transmission profile of the prototype agrees with the theoretical shape to within 3% and is achromatic. The observed apodized and coronagraphic images are consistent with theory. However, binary apodizers introduce high frequency noise that is a function of the pixel size. Numerical simulations were used to specify pixel size and minimize this e ffect, and validated by experiment. Conclusions. This paper demonstrates that binary apodizers are well suited for use in high-contrast imaging coronagraphs. The correct choice of pixel size is important and must be addressed by considering the scientific field of view. Key words. techniques: high angular resolution – instrumentation: high angular resolution – telescopes – instrumentation: adaptive optics 1. Introduction Direct detection and characterization of faint objects around bright astrophysical sources is challenging due to the high flux ratios and small angular separations. For instance, self-luminous giant planets are typically 10 6 times fainter than the parent star in the near-infrared. Even higher contrasts as high as 10 10 are needed to reach the realm of mature giant or telluric planets. To achieve these contrast levels, dedicated instruments for large ground-based telescopes such as SPHERE or GPI (Beuzit et al. 2006; Macintosh et al. 2006), or EPICS (Kasper et al. 2008) for the future European-Extremely Large Telescope (E-ELT) will use powerful Adaptive Optics (extreme AO or XAO) systems coupled with coronagraphs. While the XAO system corrects for atmospheric turbu- lence and instrument aberrations, the coronagraph attenuates the starlight diffracted by the telescope in the image plane. Since the invention of the stellar Lyot coronagraph (Lyot 1939), there has been impressive progress in the field leading to a wealth of dif- ferent coronagraphs that can be divided into different families. In particular, the Apodized Pupil Lyot Coronagraph (APLC) (Aime et al. 2002; Soummer et al. 2003a) appears to be well suited to ELTs and has been studied theoretically (Soummer 2005; Martinez et al. 2007). The APLC features amplitude apodization in the entrance aperture for reducing diffraction, and a small Lyot mask in the focal plane. It is the baseline coronagraph for e.g. SPHERE, GPI, and the Lyot Project (Oppenheimer et al. 2004). Martinez et al. (2008) further demonstrated that the APLC is well suited for use with ELTs considering their particular pupil shapes and segmented mirrors. A major issue with the APLC, and other coronagraphs us- ing apodization such as is the dual zone coronagraph, Soummer et al. (2003b), is the manufacture of the apodizer itself. Three concepts have been explored in manufacturing apodizers: (1/) a metal layer of spatially variable thickness, (2/) electron- sensitized HEBS glass (high-electron-beam-sensitive glass), and (3/) an array of opaque pixels with spatially variable den- sity. The third concept has several advantages over the first and second ones because it is intrinsically achromatic and avoids wavefront phase errors introduced by a metal layer of variable thickness or the process of writing a HEBS pattern. Simplicity and reproducibility of the technique are also major advantages. A binary design using a halftone-dot process can in principle be generalized to any apodizer masks (APLC, Dual zone) and even a conventional pupil apodization coronagraph (Jacquinot & Roisin-Dossier 1964; Nisenson & Papaliolios 2001; Aime 2005), or as an alternative manufacturing solution for binary- shaped pupil-coronagraph masks (Vanderbei et al. 2003; Kasdin et al. 2003; Vanderbei et al. 2004; Enya et al. 2007, 2008). Article published by EDP Sciences
2 LESIA, Observatoire de Paris Meudon, 5 pl. J. Janssen, 92195 Meudon, France3 Laboratory for Laser Energetics-University of Rochester, 250 East River Rd, Rochester, NY, 14623-USA, USA4 LAM, Laboratoire d´Astrophysique de Marseille, 38 rue Frédéric Joliot Curie, 13388 Marseille Cedex 13, France5 Groupement d´intérêt scientifique PHASE (Partenariat Haute résolution Angulaire Sol Espace)
Receved 5 September 2008 / Accepted 29 October 2008
ABSTRACT
Context. Coronagraphic techniques are required for detecting exoplanets with future Extremely Large Telescopes. One concept, theApodized Pupil Lyot Coronagraph (APLC), combines an apodizer in the entrance aperture with a Lyot opaque mask in the focal plane.This paper presents the manufacturing and testing of a microdots apodizer optimized for the near IR.Aims. We attempt to demonstrate the feasibility and performance of binary apodizers for the APLC. This study is also relevant tocoronagraph using amplitude pupil apodization.Methods. A binary apodizer was designed using a halftone-dot process, where the binary array of pixels with either 0% or 100%transmission was calculated to fit the required continuous transmission, i.e. local transmission control was obtained by varying therelative density of the opaque and transparent pixels. An error-diffusion algorithm was used to optimize the distribution of pixels thatapproximated the required field transmission. The prototype was tested with a coronagraphic setup in the near IR.Results. The transmission profile of the prototype agrees with the theoretical shape to within 3% and is achromatic. The observedapodized and coronagraphic images are consistent with theory. However, binary apodizers introduce high frequency noise that is afunction of the pixel size. Numerical simulations were used to specify pixel size and minimize this effect, and validated by experiment.Conclusions. This paper demonstrates that binary apodizers are well suited for use in high-contrast imaging coronagraphs. The correctchoice of pixel size is important and must be addressed by considering the scientific field of view.
Key words. techniques: high angular resolution – instrumentation: high angular resolution – telescopes –instrumentation: adaptive optics
1. Introduction
Direct detection and characterization of faint objects aroundbright astrophysical sources is challenging due to the high fluxratios and small angular separations. For instance, self-luminousgiant planets are typically 106 times fainter than the parent starin the near-infrared. Even higher contrasts as high as 1010 areneeded to reach the realm of mature giant or telluric planets.To achieve these contrast levels, dedicated instruments for largeground-based telescopes such as SPHERE or GPI (Beuzit et al.2006; Macintosh et al. 2006), or EPICS (Kasper et al. 2008) forthe future European-Extremely Large Telescope (E-ELT) willuse powerful Adaptive Optics (extreme AO or XAO) systemscoupled with coronagraphs.
While the XAO system corrects for atmospheric turbu-lence and instrument aberrations, the coronagraph attenuates thestarlight diffracted by the telescope in the image plane. Since theinvention of the stellar Lyot coronagraph (Lyot 1939), there hasbeen impressive progress in the field leading to a wealth of dif-ferent coronagraphs that can be divided into different families. Inparticular, the Apodized Pupil Lyot Coronagraph (APLC) (Aimeet al. 2002; Soummer et al. 2003a) appears to be well suitedto ELTs and has been studied theoretically (Soummer 2005;Martinez et al. 2007). The APLC features amplitude apodizationin the entrance aperture for reducing diffraction, and a small Lyot
mask in the focal plane. It is the baseline coronagraph for e.g.SPHERE, GPI, and the Lyot Project (Oppenheimer et al. 2004).Martinez et al. (2008) further demonstrated that the APLC iswell suited for use with ELTs considering their particular pupilshapes and segmented mirrors.
A major issue with the APLC, and other coronagraphs us-ing apodization such as is the dual zone coronagraph, Soummeret al. (2003b), is the manufacture of the apodizer itself. Threeconcepts have been explored in manufacturing apodizers: (1/)a metal layer of spatially variable thickness, (2/) electron-sensitized HEBS glass (high-electron-beam-sensitive glass),and (3/) an array of opaque pixels with spatially variable den-sity. The third concept has several advantages over the first andsecond ones because it is intrinsically achromatic and avoidswavefront phase errors introduced by a metal layer of variablethickness or the process of writing a HEBS pattern. Simplicityand reproducibility of the technique are also major advantages.
A binary design using a halftone-dot process can in principlebe generalized to any apodizer masks (APLC, Dual zone) andeven a conventional pupil apodization coronagraph (Jacquinot& Roisin-Dossier 1964; Nisenson & Papaliolios 2001; Aime2005), or as an alternative manufacturing solution for binary-shaped pupil-coronagraph masks (Vanderbei et al. 2003; Kasdinet al. 2003; Vanderbei et al. 2004; Enya et al. 2007, 2008).
364 P. Martinez et al.: Design, analysis, and testing of a microdot apodizer for the Apodized Pupil Lyot Coronagraph
In this paper, we report on the development (design and labo-ratory tests) of a binary apodizer for the APLC using a halftone-dot process. We first describe the binary mask principle and thealgorithm used to distribute pixels across the pupil (Sect. 2).Optimization of the design (i.e. pixels size issue) is discussedin Sect. 3, while in Sect. 4 we report on laboratory results ob-tained with a prototype using a near-IR bench that reproducesthe Very Large Telescope (VLT) pupil. Finally, we conclude onthe suitability of this technique for planet finder instruments inSect. 5.
2. Principle of microdots apodizer
A binary apodizer is made of an array of opaque pixels (i.e.dots) on a transparent substrate. It is fabricated by lithographyof a light-blocking metal layer deposited on a transparent glasssubstrate. Spatially variable transmission is obtained by varyingpixel density. An error-diffusion algorithm was used to calcu-late the density distribution that reproduces most effectively therequired field transmission (Floyd & Steinberg 1976; Ulichney1987; Dorrer & Zuegel 2007). This algorithm chooses the trans-mission of a given pixel of the apodizer (either 0% or 100%)by comparing the transmission required at this location to a 50%threshold, i.e. the transmission is set to zero if the required trans-mission is smaller than 50%, and to one otherwise (see Fig. 1).The induced transmission error is diffused into adjacent pixelsthat have not yet been processed by biasing the transmission re-quired at the corresponding locations. This locally cancels the er-ror of the binary optics introduced by the process of writing therequired transmission (in gray-levels) into binary values. Thisprocedure is used in gray-level reproduction with black-and-white printing techniques (Ulichney 1987), and further detailsabout the algorithm principle are presented in Dorrer & Zuegel(2007).
The shaping of coherent laser beams has also been demon-strated (Dorrer & Zuegel 2007) using this technique. The error-diffusion algorithm has the advantage that the introduced noiseis blue, i.e., the noise spectral density is only significant at highspatial frequencies. This allows the accurate generation of graylevels and rapidly varying shaping functions. In the specific caseof the design of a coronagraph, the algorithm allows us to re-produce well the PSF of the binary apodizer to the requiredapodized PSF to a certain radial distance, which could be chosento be the control radius of the AO system. In theory, higher qual-ity shaping results are obtained with smaller pixels (i.e. samplingproblem, Dorrer & Zuegel 2007), since this allows finer controlof the local transmission and increases spatial frequency of thebinarization noise. This will be discussed further in Sect. 3.
3. Design optimization
Assuming a VLT-like pupil, the apodizer is defined for a 15%central obscuration pupil (bagel regime, Soummer 2005). Weconsider a 4.5λ/D APLC (Martinez et al. 2007). The apodizershape is illustrated in Fig. 1 (left image). The inner-working an-gle of this configuration is ∼2.3λ/D.
The manufactured apodizer has a diameter of 3mm due toconstraints on our optical bench (Sects. 3.3 and 4). For mi-crodots, the performance is related to the ratio of the smallestfeature to the pixel size. Hence, for the sake of clarity, we denoteby S the scaling factor, the ratio between the apodizer useful
Fig. 1. Left: shaper target (continuous apodizer). Right: resulting mi-crodots pattern using algorithm discussed in Sect. 2. The spatial scaleof these maps is 600× 600 pixels. The scale of transmission is givenin %.
diameter (i.e. pupil diameter, denotedΦ hereafter), and the pixelspacing, i.e. pixel size (dot size), denoted p hereafter:
S =Φ
p· (1)
The individual pixels of a binary apodizer scatter light towardsspatial frequencies that depend on the pixel size. The smallerthe pixels are, the higher are the spatial frequencies at which thelight is scattered, and the more closely the achieved transmissionprofile matches the desired one.
We also note that the high-frequency noise might have differ-ent distributions at different wavelengths. This would be a situa-tion similar to diffraction gratings, where only diffracted orders(i.e. corresponding to large values of the transverse wavevec-tor k) are frequency-dependent. To be able to complete a moredetailed analysis, Fresnel propagators and a thorough modelingof the binary shaper (including process errors on the shape andsize of each dot such as edge effects resulting from the isotropicwet etching process, Sect. 3.3) would be required.
3.1. Microdots diffraction stray light
The microdots apodizer is modeled as an aperiodic, under-filled,two-dimensional grating, which exhibits blue-noise propertiesbecause of the error-diffusion algorithm used (Ulichney 1987;Dorrer & Zuegel 2007). The binary pattern produces an averagedgray level (g =
√T , i.e. averaged amplitude transmission) from
an apodizer profile with intensity transmission T . The resultingpattern spectral energy is determined by g (i.e. by the minor-ity pixels present on the device: non-metal pixels when g < 0.5and by metal pixels conversely). The spectral energy increasesas the number of minority pixels increases, peaking at g = 0.5(Ulichney 1987, 1988). Most of the energy in the power spec-trum of the pattern will be concentrated around the first-orderdiffraction, which would appear in the field of view at the spatialfrequency fg (in λ/D units):
fg ={ √g × S g ≤ 1/2√(1 − g) × S g > 1/2.
(2)
Therefore, for a given g, the pattern power spectrum has a peakin its diffraction at fg (Ulichney 1987, 1988). As the gray level,g, increases from 0 to 0.5, the peak diffraction moves to fur-ther angular distance (Fig. 2) with an increase in energy. Aboveg = 0.5, the situation is similar to that for (1−g), minority pixelshas only changed from non-metal dots to metal dots. The PSF of
P. Martinez et al.: Design, analysis, and testing of a microdot apodizer for the Apodized Pupil Lyot Coronagraph 365
Fig. 2. First-order peak diffraction fg position in S ×λ/D units as a func-tion of gray level g. Typical domain of application of apodizer masksare reported on the plot.
a microdots device can be therefore expressed as a function ofa deterministic effect (the first-order diffraction peak) borderedby speckles due to a stochastic effect (i.e. the dot distributionis irregular). Higher-order diffraction peaks are irrelevant sincethey are out of the science field of view. The intensity of thefirst-order diffraction peak in the final coronagraphic image isalso function of g. The model presented hereafter is based ona study performed by Dohlen (2008), where effects of micro-obscurations, such as dust or cosmetic errors, are analyticallydescribed for the SPHERE-instrument image quality. The coro-nagraphic halo intensity (I) of the first-order peak diffraction for
N dots normalized to the stellar peak intensity is Ndots ×(
pΦ
)4
(Dohlen 2008, assuming halos from all the dots add incoher-ently). The total number of minority dots present in the pattern(Ndots) can be easily calculated to be the product of the surfaceratio of the pupil to a square dot, and the density of minority dots(η, hereafter). The minority dot density can be expressed as:
η =
{g g ≤ 1/2
1 − g g > 1/2 (3)
where Ndots is given by:
Ndots = η ×π
4×(Φ
p
)2· (4)
The resulting relative halo intensity is then:
I = η × π4×(
1S
)2(5)
therefore, using Eq. (3) one finally obtains:
I =
g × π4 ×
(1S
)2g ≤ 1/2
(1 − g) × π4 ×(
1S
)2g > 1/2.
(6)
Considering our APLC apodizer (T = 51%, g = 0.71), the first-order diffraction peak would be therefore localized at fg ∼ S/2in λ/D units with an intensity of I ∼ 1/(4 × S 2). For the DualZone coronagraph (T ∼ 80%, therefore g ∼ 0.9), the first-order,diffraction-peak position moves closer to the central core of the
PSF, while its intensity decreases with respect to the APLC case:fg ∼ S/3 in λ/D with an intensity of I ∼ 1/(13 × S 2). ForConventional pupil apodization (T ∼ 25%, hence g ∼ 0.5), thefirst-order diffraction peak moves further away from the centralcore of the PSF while its intensity increases: fg ∼ 1/
√2 × S
in λ/D with an intensity of I ∼ 2/(5 × S 2).
3.2. Numerical simulations
Our simulations make use of Fraunhofer propagators betweenpupil and image planes, which is implemented as fast Fouriertransforms (FFTs) generated with an IDL code. In the following,pixels describe the resolution element of the simulation, whiledots describe the physical units forming the apodizer. We use0.3λ/D per pixel, while dots are sampled by a sufficient 4 pixelsto allow field of view for imaging the first-order diffraction peakfor each S . Validity of the numerical dot sampling has been ver-ified by comparing simulations with different dot sampling (1, 4,and 16 pixels per dot for S = 150).
We first analyze how the dot size affects the apodized PSF(Fig. 3, left) and the coronagraphic PSF (Fig. 3, right) with re-spect to an ideal, continuous apodizer. The intent of these simu-lations is to derive relevant information about S and specify thispattern by preserving from noise, low and mid-range frequen-cies that are critical to coronagraphy. Since the APLC combinesa conventional Lyot-type design with pupil apodization to shapethe intensity in the Lyot plane, the specification of S must betackled at the level where the coronagraphic effect appears, i.e.in the coronagraphic images.
All plots confirm agreement with theory (continuous model),until a given angular separation where pixellation noise appears.This angular separation is a function of S as predicted by theo-retical models (Eqs. (2) and (6)). From the results summarizedin Table 1, we derive the following conclusions:
– reduction in the dot size by a factor of 2 increases the ra-dial distance, providing adequate agreement with the spec-ification by a factor of 2 for the coronagraphic image.Equation (2) has been confirmed by simulations;
– the analytical model given by Eq. (6) is consistent with simu-lation predictions. This model is representative of the APLCsituation;
– at a given frequency in the coronagraphic images, the levelof noise decreases in proportion to S 4 (for instance, at80λ/D, noise increases from 3.2 × 10⁻⁹ to 3.5 × 10⁻⁵, whileincreases S by a factor of 8)
In practice, for the selection of S (dots size), we modeled insimulation our specific pupil (VLT-like including the secondarysupport, i.e. contrast accessibility issue), taking into account thefield of view of interest (constrained by the AO correction do-main: 20λ/D as in SPHERE). As expected we found that, theradial distance corresponding to adequate agreement with thespecification (ideal model) moved to larger angular separations,while the intensity level at which the noise appears remains sim-ilar to the previous case. In our context, S = 600 (5 µm dots)meets our specifications. The S = 1200 configuration producesan extremely small dot size (2.5 µm). When the dot size is ofthe order or lower than the operating wavelength (1.65 µm forour application), a Rigorous Coupled-Wave Analysis (RCWA)is mandatory to know how the field reacts to small perturbationsin the shaper (Genet & Ebbesen 2007; Huang & Zhu 2007).Gratings with small periods generally have missing diffractedorders in visible and IR light.
366 P. Martinez et al.: Design, analysis, and testing of a microdot apodizer for the Apodized Pupil Lyot Coronagraph
Fig. 3. Apodized PSFs (left) and APLC coronagraphic PSFs (right) using several dot sizes for the binary apodizer compared to that with continuousapodizer (i.e. theory, in black). Simulation assumes a pupil with 15% central obscuration. Profiles presented are azimuthal averages.
Table 1. High frequency noise properties as a function of the pixel size.
S p [µm] High frequency noise angular position [λ/D] Microdots halo intensityApodized PSF Coronagraphic PSF Theory (I) simulation
150 20 20 5 1.0 × 10⁻⁵ 1.7 × 10⁻⁵
300 10 30 10 2.6 × 10⁻⁶ 4.2 × 10⁻⁶
600 5 40 20 6.5 × 10⁻⁷ 1.0 × 10⁻⁶
1200 2.5 50 40 1.6 × 10⁻⁷ 2.6 × 10⁻⁷
3.3. Other specifications
The microdots apodizer was fabricated by Precision OpticalImaging in Rochester, New York. To reduce the effect of mis-aligning the apodizer with the telescope pupil, the designed pro-file of the apodizer (Φ = 3 mm) was not obscured at the cen-ter by the central obscuration (no 0% transmission values) andwas extrapolated by a Gaussian function in its outer part (from1.5 mm to 3 mm in radius, i.e. above the apodizer function ra-dius) to reduce the transmission slowly to zero. Having a sharpedge on the apodizer might be detrimental to the characterizationprocess (inspection of the profile), because of strong diffractioneffects. The shaper was fabricated using wet-etch contact lithog-raphy of a Chrome layer (Optical Density of 4.0) deposited ona BK7 glass substrate (λ/20 peak-to-valley). The back face ofthe apodizer has an antireflection coating for the H band (1.2 to1.8 µm, R < 1%). In contrast to other techniques (HEBS glassor deposition of spatially varying metal thickness), no wavefronterrors are introduced by the microdots apodizer, while its sub-strate has the highest quality requirement of all components usedin our experiment.
In the case of wet-etch lithography, etching can cause a re-duction in the light-blocking metal dot-sizes (smaller than spec-ified in the digital design), which potentially leads to increasedtransmission. Dot spacing remains the same, while opaque dotsize are reduced in size due to an undercut of the masking layerthat form cavities with sloping sidewalls. To minimize the im-pact of this effect on the obtained transmission, the mask de-sign was numerically precompensated by estimating the featuresize that would be obtained after fabrication (Dorrer & Zuegel2007). In practice, we adopted a pixel grid of 6 µm (i.e. dotsize, S = 500), and several runs were necessary to calibrate the
process and reach the specification. Reproducibility was con-firmed by a final test after optimal conditions had been set.
The 4.5 λ/D hard-edge opaque Lyot mask was fabricated byGEPI, Paris Observatory (360 µm± 1 µm in diameter, OD= 6.0at 1.65 µm using two metallic layers of Chrome (20 nm) andGold (200 nm)).
4. Experiment
4.1. Optical setup
The experiment configuration is shown is Fig. 4, where the op-tical IR coronagraphic path is indicated (top) by dot red line.The optical setup was designed to simulate the 8 m VLT pupil.The 3 mm entrance aperture diameter was made in a laser-cut, stainless-steel sheet to an accuracy of 0.002 mm. The cen-tral obscuration was scaled to be 0.47 mm± 0.002 mm andthe spider-vane thickness is 15 µm± 4µm. The coronagraphicmask was installed at an F/48.4 beam. Re-imaging optics weremade with λ/10 achromatic IR doublets. The quality of the col-limation in the pupil plane and re-imaged pupil plane (wherethe pupil stop is placed) was checked and adjusted using anHASO 64 Shack-Hartmann sensor. A pupil-imager system (seeFig. 4, where a dotted blue line indicates its optical path) was im-plemented to align the pupil-stop mask with the entrance-pupilmask (to complete alignment in the x and y direction, orientationof the spider vanes and focalisation).
We installed the entrance-pupil mask and the apodizer in thesame collimated beam. Hence, the apodizer is not perfectly in-side the pupil plane. The apodizer was placed inside a rotatingadjustable-length lens tube that allows a translation of ∼3.5 mmfrom the pupil mask.
P. Martinez et al.: Design, analysis, and testing of a microdot apodizer for the Apodized Pupil Lyot Coronagraph 367
Fig. 4. Top: picture of the IR coronagraphic test-bench on HOT. Thered dot line shows the IR coronagraphic path, while the blue dot lineshows the pupil imager system path when placing a mirror on a mag-netic mount before the external IR filter. Bottom: schematic setup of thecoronagraphic testbench.
We used a white-light source combined either with an IR narrow-band filter of ∆λ/λ = 1.4%, central wavelength of 1.64 µm, anda peak transmission of 64.4%, or IR filters (J, H, K), installedinside the filter wheel of the IR camera, where the H filter wascentered on 1.6 µm, ∆λ/λ = 20%. The camera used was theESO Infrared Test Camera (ITC), cooled to 103 K degree with avacuum pressure of 10−5 mbar. Internal optics were designed toreach a pixel scale of 5.3 mas. The Strehl ratio was evaluated tobe 94%.
The APLC pupil stop mimics the VLT pupil mask with aspider-vane thickness that is larger by a factor 4 (60 µm± 4 µm),an outer diameter that is smaller by a factor 0.96 × Φ(2.88 mm± 0.002 mm), and a central obscuration that is equalto 0.16×Φ (0.49 mm± 0.002 mm). The pupil stop throughput isabout 90%.
4.2. Quality of the binary apodizer
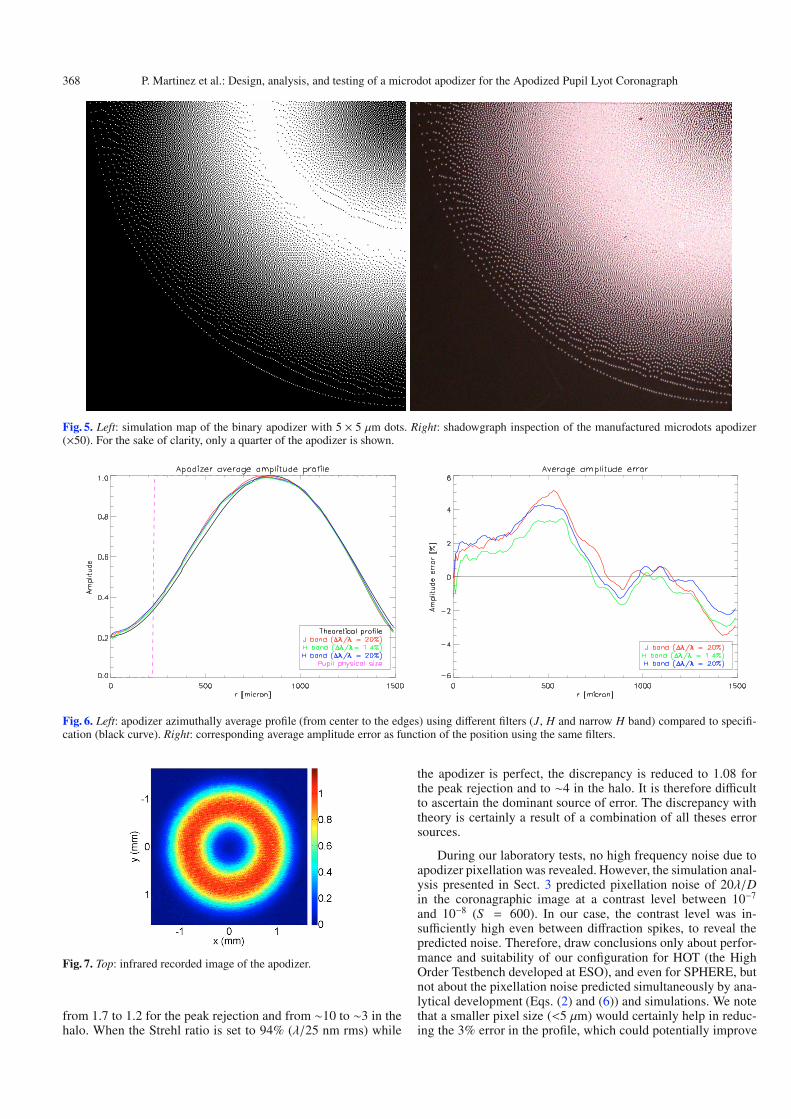
The size of the square chrome dots has been determined to be4.5 × 4.5 µm using a microscopic inspection. The dot spatialdistribution across the pupil diameter was also analyzed using ashadowgraph (×50, Fig. 5) and compared with a simulation map(5 × 5 µm dots). Figure 6 shows that the accuracy of the profilematches that expected, and the transmission error is about 3%.Achromaticity of the profile is also demonstrated: the profileerror increases by only about 2% between the narrow H filterand the broadband J filter. A smaller pixel size than that of thedigital design (6 × 6 µm) was expected (Sect. 3.3) and demon-strates that precompensation of the transmission error due to the
feature size was necessary and works well. The global shape ofthe binary apodizer is illustrated in Fig. 7.
4.3. Coronagraphic results and discussion
4.3.1. Effect on the PSF
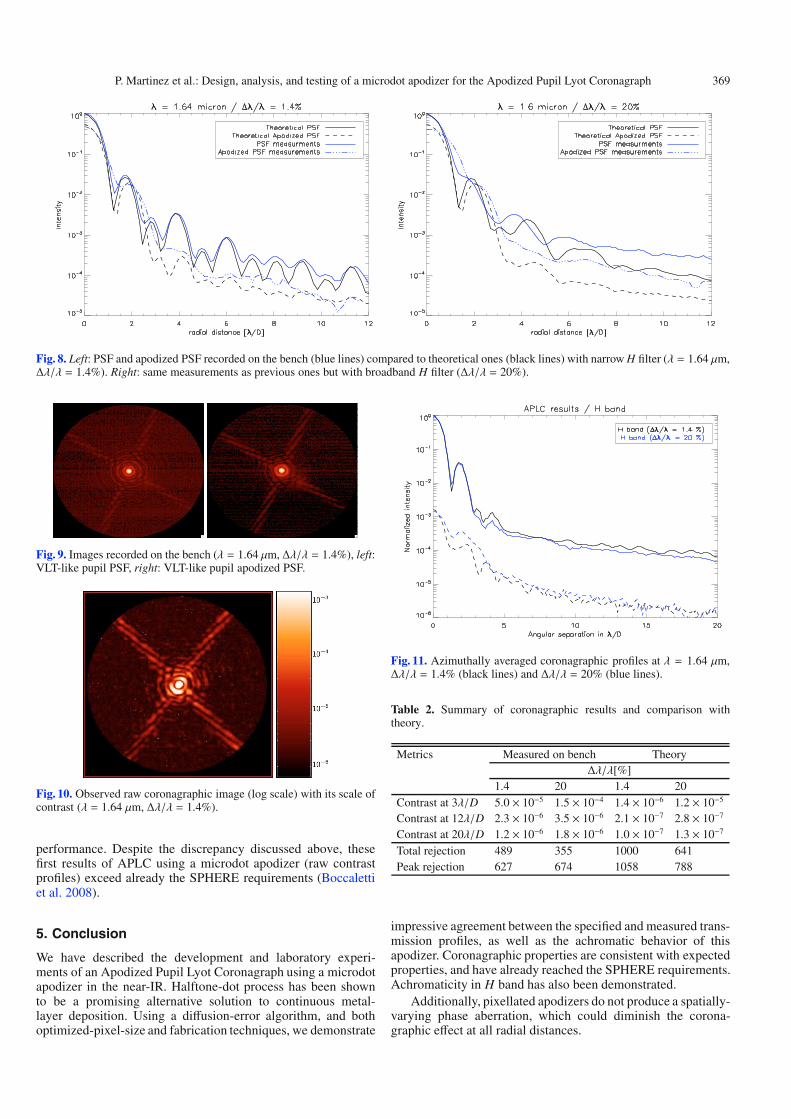
The intention behind this first series of tests was to demon-strate the effect of the binary apodizer on the PSF. We onlycompare the PSF in the absence of the apodizer to that withthe apodizer. Qualitatively (Fig. 9), it is demonstrated that theapodizer works well: the wings of the apodized PSF are reducedin intensity, while the core of the apodized PSF becomes larger(exposure time are identical, no neutral density is applied). Thisbehavior agrees well with the theoretical predictions. Althoughthere are some discrepancies between theory and measurements(Fig. 8, bottom, for ∆λ/λ = 20% in H band), the gain betweenPSF and apodized PSF is consistent with theory. This resultshas been demonstrated in the H-band with a narrow-band filter(∆λ/λ = 1.4%) and with a broadband filter (∆λ/λ = 20%). Itsachromaticity in the H band is therefore confirmed. The fact thatwe are using a real optical system and the presence of a 3.5 mmdefocus between the apodizer and the entrance pupil may ex-plain the discrepancies.
4.3.2. Effect on the coronagraphic PSF
The second series of tests were intended to demonstrate the coro-nagraphic behavior of the APLC using the microdots apodizer.
Qualitatively, the profile of the coronagraphic image(Fig. 10, H band with ∆λ/λ= 1.4%) agrees well with theoreticalpredictions: a PSF-like pattern homogeneously reduced in inten-sity with most of the energy inside the first rings. In this observedraw image, a local contrast as large as 6.5×10⁻⁷ has been reachedbetween the diffraction spikes. In Fig. 11, we present apodizedPSFs and coronagraphic images recorded on the bench using anarrow (∆λ/λ = 1.4%) and broadband filter (∆λ/λ = 20%) inthe H band. Most of the time, an order of magnitude discrepancy(mostly in the halo) is found between theory and measured data(Table 2), when we compare intensity levels at 3, 12, and 20λ/D.The contrast is defined to be the ratio of the local intensity (i.e.at a given angular separation) on the coronagraphic image tothe maximum intensity of the apodized PSF image. The totalrejection rate (ratio of the total intensity of the PSF image tothe total intensity of the coronagraphic image, in practice lim-ited to 20λ/D) differs only by a factor of 2 and 1.8 from theory,for the narrow and broad band filters respectively. This discrep-ancy is reduced when considering the peak rejection (ratio ofthe maximum intensity of the PSF to the maximum intensity ofthe coronagraphic image) to a factor of 1.7 and 1.2, respectively.The impact of chromatism is evident only slightly at small angu-lar separations (of less than 4λ/D), otherwise achromaticity canbe seen in the halo in H band.
The discrepancy may find its origin in different error sources(we discuss here only the main ones): (1/) apodizer profile er-ror (∼3%), (2/) quality of the bench (Strehl = 94%), and (3/)defocus between the apodizer and the pupil plane (∼3.5 mm).Simulations were carried out to analyze independently the im-pact of the two first ones. For the impact of the defocus, we re-fer to a sensitivity analysis performed for SPHERE (Boccalettiet al. 2008), where the apodizer mask positioning requirementin defocus is set to be the nominal position ±0.1 mm. This posi-tioning error affects mainly the halo. As also in simulations, themeasured profile of the apodizer (Fig. 6) reduces the discrepancy
368 P. Martinez et al.: Design, analysis, and testing of a microdot apodizer for the Apodized Pupil Lyot Coronagraph
Fig. 5. Left: simulation map of the binary apodizer with 5 × 5 µm dots. Right: shadowgraph inspection of the manufactured microdots apodizer(×50). For the sake of clarity, only a quarter of the apodizer is shown.
Fig. 6. Left: apodizer azimuthally average profile (from center to the edges) using different filters (J, H and narrow H band) compared to specifi-cation (black curve). Right: corresponding average amplitude error as function of the position using the same filters.
Fig. 7. Top: infrared recorded image of the apodizer.
from 1.7 to 1.2 for the peak rejection and from ∼10 to ∼3 in thehalo. When the Strehl ratio is set to 94% (λ/25 nm rms) while
the apodizer is perfect, the discrepancy is reduced to 1.08 forthe peak rejection and to ∼4 in the halo. It is therefore difficultto ascertain the dominant source of error. The discrepancy withtheory is certainly a result of a combination of all theses errorsources.
During our laboratory tests, no high frequency noise due toapodizer pixellation was revealed. However, the simulation anal-ysis presented in Sect. 3 predicted pixellation noise of 20λ/Din the coronagraphic image at a contrast level between 10−7
and 10−8 (S = 600). In our case, the contrast level was in-sufficiently high even between diffraction spikes, to reveal thepredicted noise. Therefore, draw conclusions only about perfor-mance and suitability of our configuration for HOT (the HighOrder Testbench developed at ESO), and even for SPHERE, butnot about the pixellation noise predicted simultaneously by ana-lytical development (Eqs. (2) and (6)) and simulations. We notethat a smaller pixel size (<5 µm) would certainly help in reduc-ing the 3% error in the profile, which could potentially improve
P. Martinez et al.: Design, analysis, and testing of a microdot apodizer for the Apodized Pupil Lyot Coronagraph 369
Fig. 8. Left: PSF and apodized PSF recorded on the bench (blue lines) compared to theoretical ones (black lines) with narrow H filter (λ = 1.64 µm,∆λ/λ = 1.4%). Right: same measurements as previous ones but with broadband H filter (∆λ/λ = 20%).
Fig. 9. Images recorded on the bench (λ = 1.64 µm, ∆λ/λ = 1.4%), left:VLT-like pupil PSF, right: VLT-like pupil apodized PSF.
Fig. 10. Observed raw coronagraphic image (log scale) with its scale ofcontrast (λ = 1.64 µm, ∆λ/λ = 1.4%).
performance. Despite the discrepancy discussed above, thesefirst results of APLC using a microdot apodizer (raw contrastprofiles) exceed already the SPHERE requirements (Boccalettiet al. 2008).
5. Conclusion
We have described the development and laboratory experi-ments of an Apodized Pupil Lyot Coronagraph using a microdotapodizer in the near-IR. Halftone-dot process has been shownto be a promising alternative solution to continuous metal-layer deposition. Using a diffusion-error algorithm, and bothoptimized-pixel-size and fabrication techniques, we demonstrate
impressive agreement between the specified and measured trans-mission profiles, as well as the achromatic behavior of thisapodizer. Coronagraphic properties are consistent with expectedproperties, and have already reached the SPHERE requirements.Achromaticity in H band has also been demonstrated.
Additionally, pixellated apodizers do not produce a spatially-varying phase aberration, which could diminish the corona-graphic effect at all radial distances.
370 P. Martinez et al.: Design, analysis, and testing of a microdot apodizer for the Apodized Pupil Lyot Coronagraph
We therefore conclude that microdots apodizers represent anexcellent choice for the APLC.
Although this study was carried out in the context ofResearch & Development for future near IR instruments onE-ELT, it is already applicable to other instruments such asSPHERE and other coronagraphs such as the Dual Zone. Finally,we note that a RCWA analysis would be mandatory for a morerefined analysis of the dependency of optimal pixel size onwavelength.
Acknowledgements. P.M. would like to thank Sebastien Tordo and ChristopheDupuy from ESO for their helpful support with the ITC and metrology inspec-tion. This activity is supported by the European Community under its FrameworkProgramme 6, ELT Design Study, Contract No. 011863.
ReferencesAime, C. 2005, A&A, 434, 785Aime, C., Soummer, R., & Ferrari, A. 2002, A&A, 389, 334Beuzit, J.-L., Feldt, M., Dohlen, K., et al. 2006, The Messenger, 125, 29Boccaletti, A., Abe, L., Baudrand, J., et al. 2008, Proc. SPIEDohlen, K. 2008, Proc. SPIEDorrer, C., & Zuegel, J. D. 2007, J. Opt. Soc. Am. B, 24, 1268Enya, K., Tanaka, S., Abe, L., & Nakagawa, T. 2007, A&A, 461, 783
Enya, K., Abe, L., Tanaka, S., et al. 2008, A&A, 480, 899Floyd, R. W., & Steinberg, L. 1976, J. Soc. Inf. Disp., 17, 7577Genet, C., & Ebbesen, T. W. 2007, Nature, 445, 39Huang, C.-P., & Zhu, Y.-Y. 2007Jacquinot, P., & Roisin-Dossier, B. 1964, Prog. Opt., 3, 29Kasdin, N. J., Vanderbei, R. J., Spergel, D. N., & Littman, M. G. 2003, ApJ, 582,
1147Kasper, M., Beuzit, J.-L., Verinaud, C., et al. 2008, Proc. SPIELyot, B. 1939, MNRAS, 99, 580Macintosh, B., Graham, J., Palmer, D., et al. 2006, in Advances in Adaptive
Optics II, Presented at the Society of Photo-Optical InstrumentationEngineers (SPIE) Conference, ed. B. L. Ellerbroek, & D. Bonaccini Calia,Proc. SPIE, 6272, 62720L
Martinez, P., Boccaletti, A., Kasper, M., Baudoz, P., & Cavarroc, C. 2007, A&A,474, 671
Martinez, P., Boccaletti, A., Kasper, M., et al. 2008, A&A, 492, 289Nisenson, P., & Papaliolios, C. 2001, ApJ, 548, L201Oppenheimer, B. R., Digby, A. P., Newburgh, L., et al. 2004, in Advancements
in Adaptive Optics, Presented at the Society of Photo-Optical InstrumentationEngineers (SPIE) Conference, ed. D. Bonaccini Calia, B. L. Ellerbroek, &R. Ragazzoni, Proc. SPIE, 5490, 433
Soummer, R. 2005, ApJ, 618, L161Soummer, R., Aime, C., & Falloon, P. E. 2003a, A&A, 397, 1161Soummer, R., Dohlen, K., & Aime, C. 2003b, A&A, 403, 369Ulichney, R. 1987, The MIT PressUlichney, R. 1988, Proc. IEEE, 76, 1, 56Vanderbei, R. J., Spergel, D. N., & Kasdin, N. J. 2003, ApJ, 590, 593Vanderbei, R. J., Kasdin, N. J., & Spergel, D. N. 2004, ApJ, 615, 555