Asian Journal of Research in Social Sciences and Humanities Asian Journal of Research in Social Sciences and Humanities Vol. 6, No. 10, October 2016, pp. 196-212. ISSN 2249-7315 A Journal Indexed in Indian Citation Index DOI NUMBER: 10.5958/2249-7315.2016.01007.8 Category:Science and Technology 196 Asian Research Consortium www.aijsh.com Design and Analysis of Automotive Wheel Rim by using ANSYS and MSC Fatigue Software S. Karuppusamy*; G. Karthikeyan**; S. Dinesh***; T. Rajkumar****; Dr. V. Vijayan*****; J. Kalil Basha****** *Department of Mechanical Engineering, K. Ramakrishnan College of Technology, Trichy, India. **Department of Mechanical Engineering, Dhanalakshmi Srinivasan Engineering College, Perambalur, India. ***Department of Mechanical Engineering, K. Ramakrishnan College of Technology, Trichy, India. ****Department of Mechanical Engineering, K. Ramakrishnan College of Technology, Trichy, India. *****Department of Mechanical Engineering, K. Ramakrishnan College of Technology, Trichy, India. ******Department of Mechanical Engineering, Dhanalakshmi Srinivasan Engineering College, Perambalur, India. Abstract Wheel rim is the part of automotive where it heavily undergoes both static loads as well as fatigue loads as wheel rim travels different road profile. As it develops heavy stresses in the rim, the critical stress and number cycles to failure are to be found. The purpose of the car wheel rim is to provide a firm base to hold the tire. Its dimensions and shape should be suitable to accommodate the particular tire required for the vehicle. In this study, a car wheel rim is considered. The wheel rim is designed by using modeling software SOLIDWORKS V13. The solid model is then imported
Transcript
Asian Journal
of Research in
Social Sciences
and
Humanities Asian Journal of Research in Social Sciences and Humanities Vol. 6, No. 10, October 2016, pp. 196-212.
ISSN 2249-7315 A Journal Indexed in Indian Citation Index
DOI NUMBER: 10.5958/2249-7315.2016.01007.8 Category:Science and Technology
196
Asian Research Consortium
www.aijsh.com
Design and Analysis of Automotive Wheel Rim by using ANSYS and MSC Fatigue Software
S. Karuppusamy*; G. Karthikeyan**; S. Dinesh***; T. Rajkumar****; Dr. V. Vijayan*****; J. Kalil Basha******
*Department of Mechanical Engineering,
K. Ramakrishnan College of Technology,
Trichy, India.
**Department of Mechanical Engineering,
Dhanalakshmi Srinivasan Engineering College,
Perambalur, India.
***Department of Mechanical Engineering,
K. Ramakrishnan College of Technology,
Trichy, India.
****Department of Mechanical Engineering,
K. Ramakrishnan College of Technology,
Trichy, India.
*****Department of Mechanical Engineering,
K. Ramakrishnan College of Technology,
Trichy, India.
******Department of Mechanical Engineering,
Dhanalakshmi Srinivasan Engineering College,
Perambalur, India.
Abstract
Wheel rim is the part of automotive where it heavily undergoes both static loads as well as fatigue loads as wheel rim travels different road profile. As it develops heavy stresses in the rim, the critical stress and number cycles to failure are to be found. The purpose of the car wheel rim is to provide a firm base to hold the tire. Its dimensions and shape should be suitable to accommodate the particular tire required for the vehicle. In this study, a car wheel rim is considered. The wheel rim is designed by using modeling software SOLIDWORKS V13. The solid model is then imported
Karuppusamy et al. (2016). Asian Journal of Research in Social Sciences and Humanities,
Vol. 6, No.10, pp. 196-212.
197
to ANSYS for static analysis. The static analysis was carried out by considering the four different materials namely steel alloy, aluminium alloy, magnesium alloy and forged steel and their relative performance have been observed. In addition to this the rim was subjected to fatigue analysis using MSC fatigue software and its performance was observed. The results of static and fatigue analysis obtained from four different materials reveals that the steel alloy is the best material of wheel rim.
1. Introduction
Wheel is the major structural elements of vehicle tyre assemblies, it connects the vehicle body and the tyre and enables the wheel rotation. This transmits vertical and lateral tyre forces to the axle housing or the axle beam [1,2]. Because of the position and function in vehicle suspensions, they are categorised as safety components [3,4].Therefore, it is necessary to guarantee a predicted durability of this component that should not fail under service loads. Location of a steel wheel in the rear axle of a heavy commercial vehicle is seen in Fig.2.2. The load capacity and fatigue behaviour of a steel wheel under a certain dynamic load is determined by dynamic radial fatigue tests [7]. In these tests, the tyre-wheel assembly is positioned on a rotating drum. The predicted radial test load is applied to the tyre producing contact pressure between the tyre and the drum. In this way, cyclic loading, that may occur during service is simulated. A spun steel rim is then secured around this with a series of welds. The rim is properly balanced and then given a smooth finish. Here we are usig MSC fatigue software and ANSYS to analys the automotive wheel rim.
2. Modeling of Wheel Rim
2.1 Material Properties
Four materials were considered for the selection of suitable material for wheel rim. The properties as in related in Table 2.1 were given on input for Static and Fatigue analysis using ANSYS.
Table No.2.1 Material Properties for Automotive Wheel Rim
Karuppusamy et al. (2016). Asian Journal of Research in Social Sciences and Humanities,
Vol. 6, No.10, pp. 196-212.
198
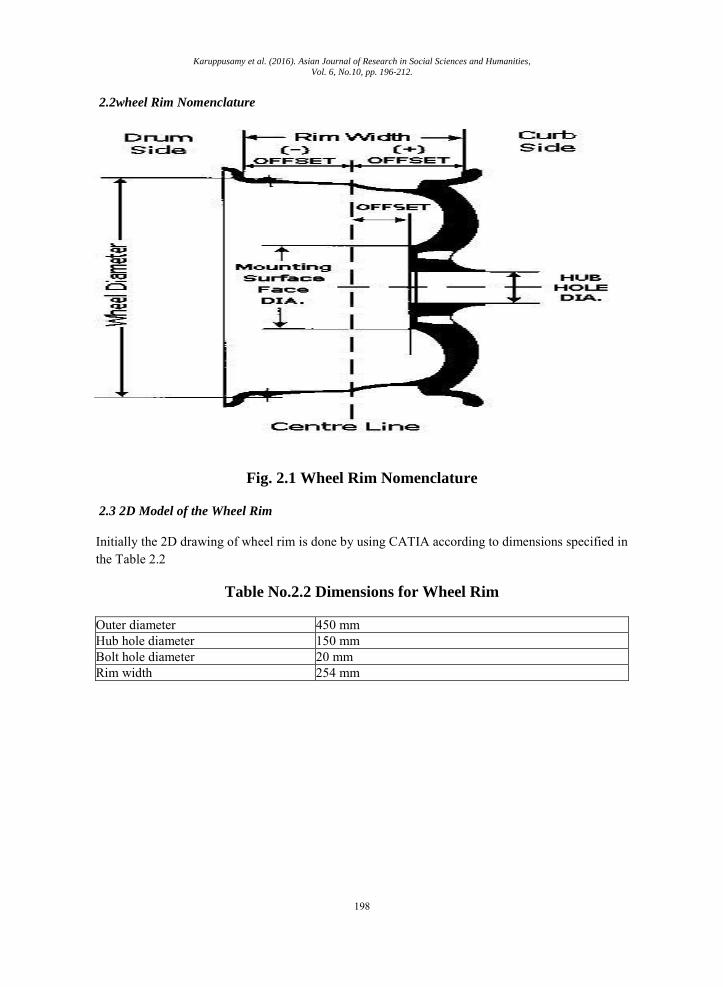
2.2wheel Rim Nomenclature
Fig. 2.1 Wheel Rim Nomenclature
2.3 2D Model of the Wheel Rim
Initially the 2D drawing of wheel rim is done by using CATIA according to dimensions specified in the Table 2.2
Table No.2.2 Dimensions for Wheel Rim
Outer diameter 450 mm Hub hole diameter 150 mm Bolt hole diameter 20 mm Rim width 254 mm
Karuppusamy et al. (2016). Asian Journal of Research in Social Sciences and Humanities,
Vol. 6, No.10, pp. 196-212.
199
Fig.2.2 2D Drawing of Wheel Rim
2.4 3D Model of the Wheel Rim
The 3D model of the wheel rim is shown in below
Fig. 2.3(a) Isometric View
Karuppusamy et al. (2016). Asian Journal of Research in Social Sciences and Humanities,
Vol. 6, No.10, pp. 196-212.
200
Fig 2.3(b) 3D Model of the Wheel Rim
Generating the Mesh using Hypermesh Software
Altair Hyper Mesh is a high-performance finite element pre- and postprocessor for popular finite element solvers - allowing engineers to analyze product design performance in a highly interactive and visual environment. Hyper Mesh user-interface is easy to learn and supports many CAD geometry and finite element model files - increasing interoperability and efficiency.
The process of generating a mesh of nodes and elements consists of three general steps.
1. Set the element attributes.
2. Set mesh controls (optional).
3. Meshing model.
The wheel rim solid model (.IGES file format) is imported to HYPERMESH and the model is meshed with solid tetra element and saved in .hm file format thus finite element model is created and is also show in Fig.
Fig 3.4 2D Meshing in Hyper Mesh
Karuppusamy et al. (2016). Asian Journal of Research in Social Sciences and Humanities,
Vol. 6, No.10, pp. 196-212.
201
Fig 3.5 3D Meshing in Hyper Mesh
3. Finite Element Analysis
3.1introduction to Finite Element Method
The finite element method is a powerful tool for the numerical procedure to obtain solutions to many of the problems encountered in engineering analysis. Structural, thermal and heat transfer, fluid dynamics, fatigue related problems, electric and magnetic fields, the concepts of finite element methods can be utilized to solve these engineering problems. In this method of analysis, a complex region defining a continuum is discretized into simple geometric shapes called finite elements the domain over which the analysis is studied is divided into a number of finite elements. The material properties and the governing relationship are considered over these elements and expressed in terms of unknown values at element corner .An assembly process, duly considering the loading and constraint, results in set of equation. Solution of these equations gives the approximate behavior of the continuum.
3.2 Steps Involved in FEM
Step1: Discretization of continuum
Step 2: Selection of displacement model
Step 3: Derivation of elemental stiffness matrix
Step 4: Assembly of the element stiffness matrix
Step 5: Apply the boundary conditions
Karuppusamy et al. (2016). Asian Journal of Research in Social Sciences and Humanities,
Vol. 6, No.10, pp. 196-212.
202
Step 6: To find unknown displacement, strain and stress
3.2.1 Four Main Steps for Model Analysis
1.Build the model.
2.Apply loads and obtain the solution.
3.Expand the modes.
4.Review the results.
3.3 Importing the Model
The finite element meshed model (.hm file format) of wheel rim is imported from Hyper Mesh Software to ANSYS Software.
1. Centrifugal force, F=mrω2 N
2. ω =2×(22/7)×N/60 rad/s
3. m=24 kg
4. For N=600 rpm
5. ω =62.8 rps
By substituting, we get centrifugal force=21.3kN which acts at each node of the circumference of the rim.
3.4 Boundary Conditions and Loading
To get compressive and tensile stress, a load of 21.3kN is applied on the bolt holes of the wheel rim.
Displacements
Translation in x, y, z directions is zero.
Rotation in x, y, z direction is zero.
Angular Velocity
In X direction is zero,
Y direction is 62.8 rps,
Direction is zero.
These conditions are applied on the six holes provided on the rim.
Karuppusamy et al. (2016). Asian Journal of Research in Social Sciences and Humanities,
Vol. 6, No.10, pp. 196-212.
203
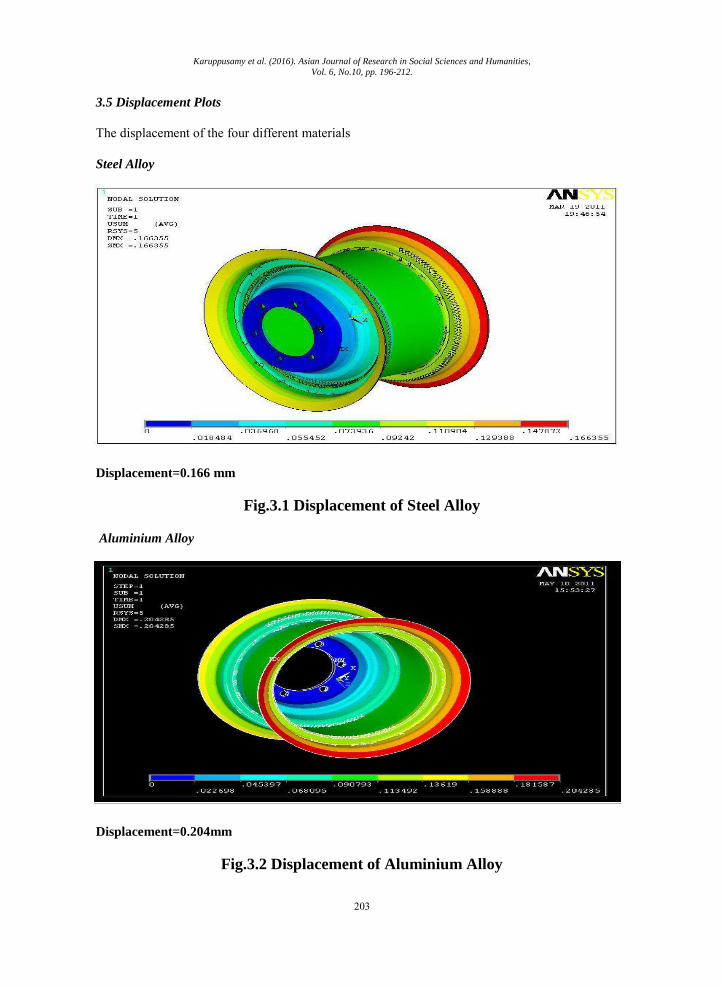
3.5 Displacement Plots
The displacement of the four different materials
Steel Alloy
Displacement=0.166 mm
Fig.3.1 Displacement of Steel Alloy
Aluminium Alloy
Displacement=0.204mm
Fig.3.2 Displacement of Aluminium Alloy
Karuppusamy et al. (2016). Asian Journal of Research in Social Sciences and Humanities,
Vol. 6, No.10, pp. 196-212.
204
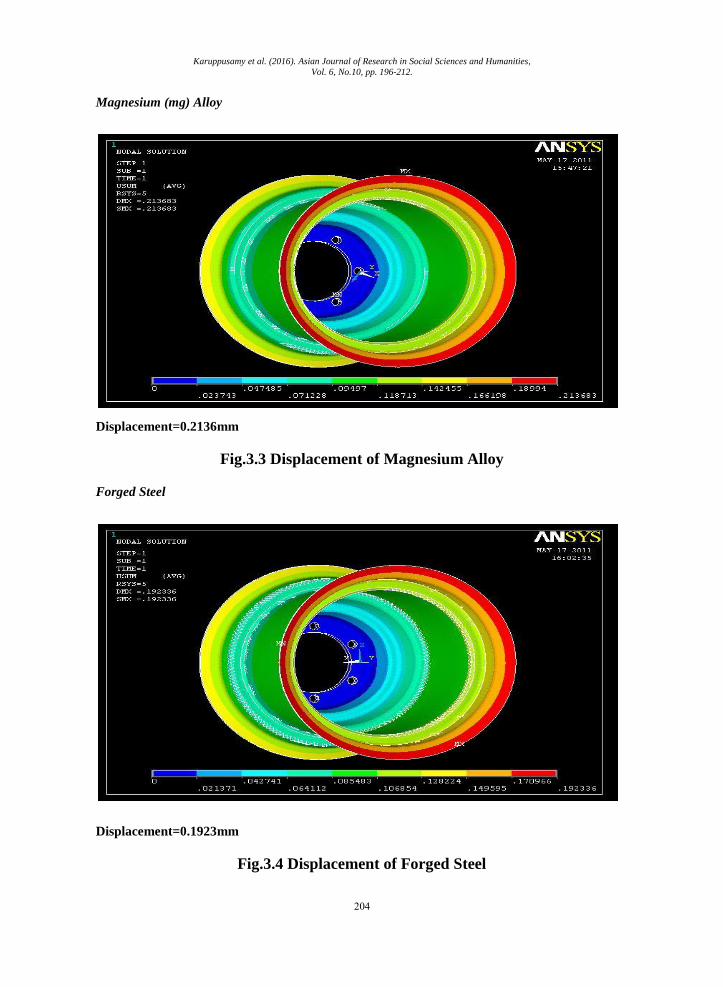
Magnesium (mg) Alloy
Displacement=0.2136mm
Fig.3.3 Displacement of Magnesium Alloy
Forged Steel
Displacement=0.1923mm
Fig.3.4 Displacement of Forged Steel
Karuppusamy et al. (2016). Asian Journal of Research in Social Sciences and Humanities,
Vol. 6, No.10, pp. 196-212.
205
3.6 Stress Plots
The stress of the four different materials as shown
Steel Alloy
Max vonmises stress=140.056 Mpa
Min vonmises stress=3.202 Mpa
Fig.3.5 Von Mises Stress of Steel Alloy
Aluminium Alloy
Max vonmises stress=48.326 Mpa
Min vonmises stress=0.92 Mpa
Fig.3.6 Von Mises Stress of Aluminium Alloy
Karuppusamy et al. (2016). Asian Journal of Research in Social Sciences and Humanities,
Vol. 6, No.10, pp. 196-212.
206
Magnesium (mg) Alloy
Maximum vonmises stress=32.294 Mpa.
Minimum vonmises stress=0.6954 Mpa.
Fig.3.7 Von Mises Stress of Magnesium Alloy
Forged Steel
Maximum stress distribution=135.931 Mpa
Minimum stress distribution=2.452 Mpa
Fig.3.8 Von Mises Stress of Forged Steel
Karuppusamy et al. (2016). Asian Journal of Research in Social Sciences and Humanities,
Vol. 6, No.10, pp. 196-212.
207
4. Fatigue Analysis
4.1 MSC Fatigue Software
MSC Fatigue is a FE-based durability and damage tolerance solver that enables users with minimal knowledge of fatigue to perform comprehensive durability analysis. Some estimates put annual costs in the United States due to premature fatigue fractures in structural components at as much as 4% of the gross domestic product. Yet testing against repeated loading cycles, sometimes millions of times over, is often too expensive and time consuming to be practical. Finite element analysis programs can tell you where stress ―hot spots‖ exist, but on their own can’t tell you whether those hot spots are critical areas for fatigue failure, or when fatigue might become a problem. To avoid contributing further to this statistic, many manufacturers simply accept long prototype-development cycles, overweight components, unpredictable warranty claims, and loss of customer confidence.MSC Fatigue enables durability engineers to quickly and accurately predict how long products will last under any combination of time-dependent or frequency-dependent loading conditions. Benefits include reduced prototype testing, fewer product recalls, lower warranty costs, and increased confidence that your product designs will pass required test schedules Welcome to MSC Fatigue. MSC Fatigue is an advanced fatigue life estimation program for use with finite Element analysis. When used early in a development design cycle it is possible to greatly enhance product life as well as reduce testing and prototype costs, thus ensuring greater speed to market. It is jointly developed in close cooperation between MCV. Software Corporation and its fatigue technology partner, nCode International, Ltd. of Sheffield, England. Although many definitions can be applied to the word, for the purposes of this manual, fatigue is failure under a repeated or otherwise varying load which never reaches a level sufficient to cause failure in a single application. It can also be thought of as the initiation and growth of a crack, or growth from a preexisting defect, until it reaches a critical size, such as separation into two or more parts. Fatigue analysis itself usually refers to one of two methodologies: either the stress life or S-N method, commonly referred to as total life since it makes no distinction between initiating and growing a crack, or the local strain or strain-life (ε-N) method, commonly referred to as the crack initiation method which concerns itself only with the initiation of a crack. Fracture specifically concerns itself with the growth or propagation of a crack once it has initiated. Durability is then the conglomeration of all aspects that affect the life of a product and usually involves much more than just fatigue and fracture, but also loading conditions, environmental concerns, material characterizations, and testing simulations to name a few. A true product durability program in an organization takes all of these aspects (and more) into consideration.
The fatigue analysis is carried out in MSC fatigue tool .The von-misses stresses from ANSYS(.rst file format) is imported to the MSC fatigue and find the number of cycles to failures of crankshaft for forged steel and sintered aluminium.
Karuppusamy et al. (2016). Asian Journal of Research in Social Sciences and Humanities,
Vol. 6, No.10, pp. 196-212.
208
Fig.4.1 Type of Fatigue Load Inputting
4.1 Fatigue Plots and S-N curves
Steel Alloy
Fatigue strength=2.17×10⁵ cycles
Fig.4.2 Fatigue Analysis of Steel Alloy
Karuppusamy et al. (2016). Asian Journal of Research in Social Sciences and Humanities,
Vol. 6, No.10, pp. 196-212.
209
Aluminium Alloy
Fatigue strength=1.32×10
5 cycles
Fig.4.3 Fatigue Analysis of Aluminium Alloy
Magnesium Alloy
Fatigue strength=1.2×10⁵ cycles
Fig.4.4 Fatigue Analysis of Magnesium Alloy
Karuppusamy et al. (2016). Asian Journal of Research in Social Sciences and Humanities,
Vol. 6, No.10, pp. 196-212.
210
Forged Steel
Fatigue strength=1.97×10⁵ cycles
Fig.4.5 Fatigue Analysis of Forged Steel
Fig.4.6 S-N Plot of Steel Alloy Fig.4.7 S-N Plot of Aluminium Alloy
Karuppusamy et al. (2016). Asian Journal of Research in Social Sciences and Humanities,
Vol. 6, No.10, pp. 196-212.
211
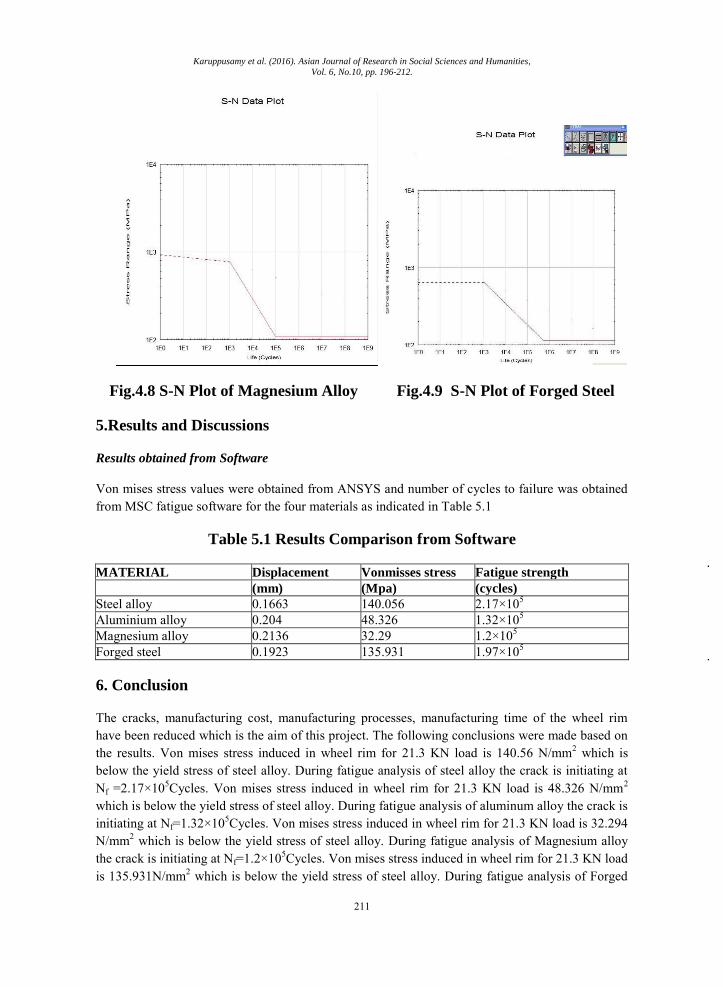
Fig.4.8 S-N Plot of Magnesium Alloy Fig.4.9 S-N Plot of Forged Steel
5.Results and Discussions
Results obtained from Software
Von mises stress values were obtained from ANSYS and number of cycles to failure was obtained from MSC fatigue software for the four materials as indicated in Table 5.1
The cracks, manufacturing cost, manufacturing processes, manufacturing time of the wheel rim have been reduced which is the aim of this project. The following conclusions were made based on the results. Von mises stress induced in wheel rim for 21.3 KN load is 140.56 N/mm2 which is below the yield stress of steel alloy. During fatigue analysis of steel alloy the crack is initiating at Nf =2.17×10⁵Cycles. Von mises stress induced in wheel rim for 21.3 KN load is 48.326 N/mm2 which is below the yield stress of steel alloy. During fatigue analysis of aluminum alloy the crack is initiating at Nf=1.32×10⁵Cycles. Von mises stress induced in wheel rim for 21.3 KN load is 32.294 N/mm2 which is below the yield stress of steel alloy. During fatigue analysis of Magnesium alloy the crack is initiating at Nf=1.2×10⁵Cycles. Von mises stress induced in wheel rim for 21.3 KN load is 135.931N/mm2 which is below the yield stress of steel alloy. During fatigue analysis of Forged
Karuppusamy et al. (2016). Asian Journal of Research in Social Sciences and Humanities,
Vol. 6, No.10, pp. 196-212.
212
steel the crack is initiating at Nf =1.97×10⁵Cycles.From results, it was found that the Number of cycles to failure in steel alloy is Nf = 2.17×10⁵Cycles which is greater than Aluminium, Magnesium, Forged steel. Hence Steel alloy is more feasible to use than aluminum. Hence steel alloy have more life and durability compared to aluminum.
References
Reimpell J, Sponagel P. Fahrwerktechnik: Reifen und Räder. Würzburg: Vogel Buchverlag; 1988. p. 139 [in German].
Hoepke E, Breuer S (Hrsg.). Nutzfahrzeugtechnik, 5. vollständig überarbeitete Auflage. Wiesbaden: Vieweg+Teubner GWV Fachverlage GmbH; 2008. p.212 [in German].
Carboni M, Beretta S, Finzi A. Defects and in-service fatigue life of truck wheels. Eng Fail Anal 2003;10:45–57.
Test requirements for truck steel wheels. EUWA standards, ES 3.11. EUWA-Association of European Wheel Manufacturers; May 2006.
Wheels/Rims – Trucks – Performance requirements and test procedures J267. SAE – society of automotive engineers, Inc.; December 2007.
Raju PR, Satyanarayana B, Ramji K, Babu KS. Evaluation of fatigue life of aluminum alloy wheels under radial loads. Eng Fail Anal 2007;14:791–800.
M.M. Topaç a, S. Ercan b, N.S. Kuralay a, Fatigue life prediction of a heavy vehicle steel wheel under radial loads by using finite element analysis,Oct 2011.