Lecture 6.2 1
© 2016 Michael Stuart
Design and Analysis of Experiments
Lecture 6.2 Review topics
1. Repeated measures
2. Complex block structures
3. Missing / unbalanced data
4. Analysis of Covariance
5. Clinical trials
6. Response surface methodology
7. Transformations
8. Strategies for Experimentation
Postgraduate Certificare in Statistics
Design and Analysis of Experiments
Lecture 6.2 2
© 2016 Michael Stuart
Repeated Measures
Example:
Different calves fed different diet supplements to
improve growth, starting at 9 weeks old.
Initial weight recorded, Y0
blocks formed based on initial weight,
weights recorded at
4 weeks Y1
8 weeks Y2
12 weeks Y3
16 weeks Y4
Postgraduate Certificate in Statistics
Design and Analysis of Experiments
Lecture 6.2 3
© 2016 Michael Stuart
Split plots analysis?
• Calves are whole units
– treatment factor = Supplement Type
• Time periods are sub units
– treatment factor = Supplement Yes / No
• Problems:
− correlation structure
– varying standard deviation
• Solutions:
– DF adjustments
– Multivariate analysis
Postgraduate Certificate in Statistics
Design and Analysis of Experiments
Lecture 6.2 4
© 2016 Michael Stuart
Crossover designs
• Repeated measures designs compares different
diets on different calves,
• reduce variation by comparing diets on same
calves,
• e.g. diet A for weeks 1 to 4
diet B for weeks 5 to 8
diet C for weeks 9 to 12
diet D for weeks 13 to 16
• requires attention to order of diets
Postgraduate Certificate in Statistics
Design and Analysis of Experiments
Lecture 6.2 5
© 2016 Michael Stuart
Crossover design
• Every diet occurs
– once for each calf,
– once in each time
period
– Latin square
• Problems:
? correlation structure
? carry over effect
? experimental set up
versus actual use
Calf Time Period
1 - 4 5 – 8 9 – 12 13 - 16 1 A B C D 2 B D A C 3 C A D B 4 D C B A
Postgraduate Certificate in Statistics
Design and Analysis of Experiments
Lecture 6.2 6
© 2016 Michael Stuart
Design and Analysis of Experiments
Lecture 6.2 Review topics
1. Repeated measures
2. Complex block structures
3. Missing / unbalanced data
4. Analysis of Covariance
5. Clinical trials
6. Response surface methodology
7. Transformations
8. Strategies for Experimentation
Postgraduate Certificare in Statistics
Design and Analysis of Experiments
Lecture 6.2 7
© 2016 Michael Stuart
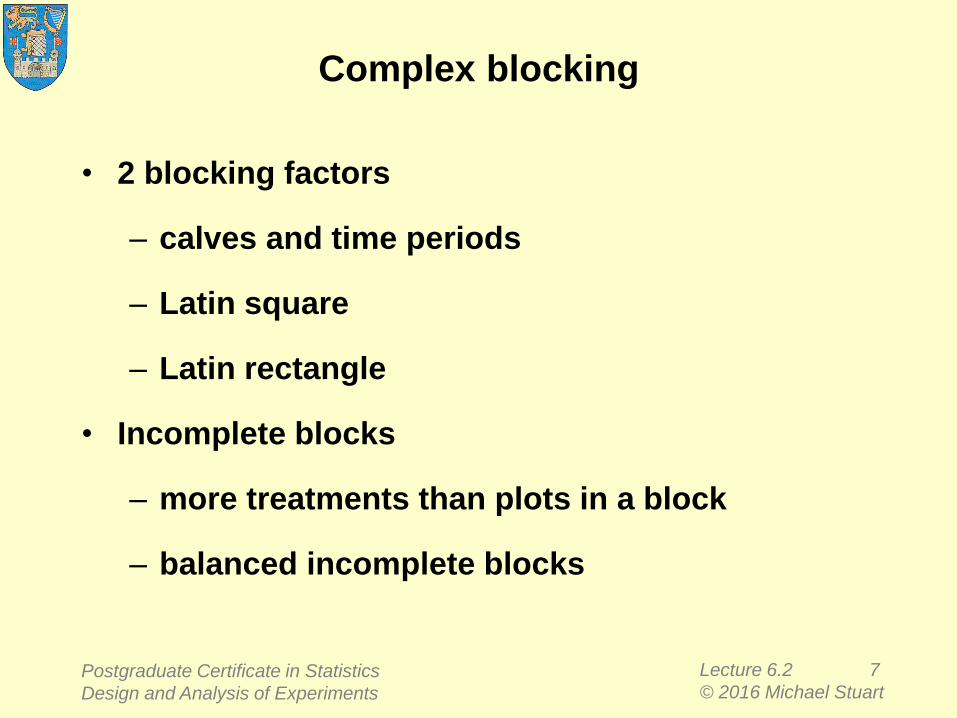
Complex blocking
• 2 blocking factors
– calves and time periods
– Latin square
– Latin rectangle
• Incomplete blocks
– more treatments than plots in a block
– balanced incomplete blocks
Postgraduate Certificate in Statistics
Design and Analysis of Experiments
Lecture 6.2 8
© 2016 Michael Stuart
Design and Analysis of Experiments
Lecture 6.2 Review topics
1. Repeated measures
2. Complex block structures
3. Missing / unbalanced data
4. Analysis of Covariance
5. Clinical trials
6. Response surface methodology
7. Transformations
8. Strategies for Experimentation
Postgraduate Certificare in Statistics
Design and Analysis of Experiments
Lecture 6.2 9
© 2016 Michael Stuart
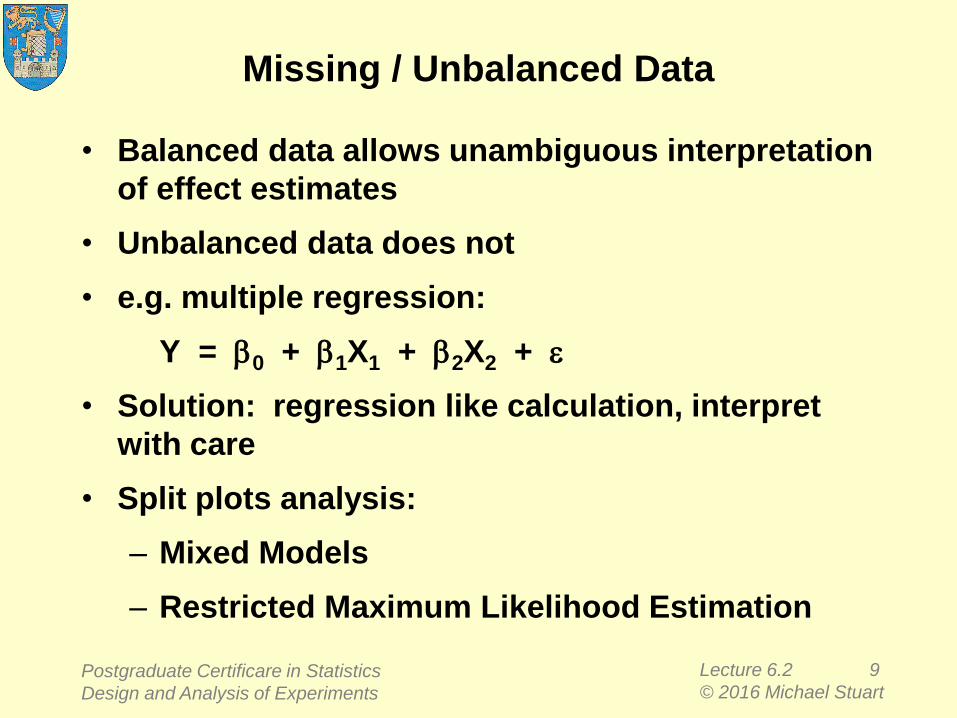
Missing / Unbalanced Data
• Balanced data allows unambiguous interpretation
of effect estimates
• Unbalanced data does not
• e.g. multiple regression:
Y = b0 + b1X1 + b2X2 + e
• Solution: regression like calculation, interpret
with care
• Split plots analysis:
– Mixed Models
– Restricted Maximum Likelihood Estimation
Postgraduate Certificare in Statistics
Design and Analysis of Experiments
Lecture 6.2 10
© 2016 Michael Stuart
Design and Analysis of Experiments
Lecture 6.2 Review topics
1. Repeated measures
2. Complex block structures
3. Missing / unbalanced data
4. Analysis of Covariance
5. Clinical trials
6. Response surface methodology
7. Transformations
8. Strategies for Experimentation
Postgraduate Certificare in Statistics
Design and Analysis of Experiments
Lecture 6.2 11
© 2016 Michael Stuart
Analysis of Covariance
Objective: take account of variation in uncontrolled
environmental variables.
Solution: measure the environmental variables at
each design point and incorporate in the
analysis through regression methods
(Analysis of Covariance)
Effects: reduces "error" variation, makes factor
effects more significant
adjusts factor effect estimates to take
account of extra variation source.
Postgraduate Certificate in Statistics
Design and Analysis of Experiments
Lecture 6.2 12
© 2016 Michael Stuart
Analysis of Covariance; Illustration
Breaking strength of monofilament fibre (Y)
produced by three different machines (1, 2, 3)
allowing for variation in fibre thickness (X)
Machine 1 Machine 2 Machine 3
Y X Y X Y X
36 20 40 22 35 21 41 25 48 28 37 23 39 24 39 22 42 26 42 25 45 30 34 21 49 32 44 28 32 15
Postgraduate Certificate in Statistics
Design and Analysis of Experiments
Lecture 6.2 13
© 2016 Michael Stuart
Analysis of Covariance; Minitab
General Linear Model: Y versus Machine
Source DF SS MS F P
Machine 2 140.40 70.20 4.09 0.044
Error 12 206.00 17.17
Total 14 346.40
S = 4.14
General Linear Model: Y versus Machine, X
Source DF SS MS F P
X 1 178.01 178.01 69.97 0.000
Machine 2 13.28 6.64 2.61 0.118
Error 11 27.99 2.54
Total 14 346.40
S = 1.60
Postgraduate Certificate in Statistics
Design and Analysis of Experiments
Lecture 6.2 14
© 2016 Michael Stuart
Covariance vs Blocking
Chance causes and assignable causes of variation
(W. Shewhart, 1931)
Chance causes of variation are the
many individually negligible and unpredictable
but
collectively influential
factors that affect a process or system.
Assignable causes of variation are the
few individually influential and predictable effect
factors that affect a process or system.
Postgraduate Certificate in Statistics
Design and Analysis of Experiments
Lecture 6.2 15
© 2016 Michael Stuart
Covariance vs Blocking
Blocking Chance causes
Covariance Assignable causes
Postgraduate Certificate in Statistics
Design and Analysis of Experiments
Lecture 6.2 16
© 2016 Michael Stuart
Design and Analysis of Experiments
Lecture 6.2 Review topics
1. Repeated measures
2. Complex block structures
3. Missing / unbalanced data
4. Analysis of Covariance
5. Clinical trials
6. Response surface methodology
7. Transformations
8. Strategies for Experimentation
Postgraduate Certificare in Statistics
Design and Analysis of Experiments
Lecture 6.2 17
© 2016 Michael Stuart
5 Clinical trials
• Simple treatment structure
• Elaborate covariate structure
– blocking / matching
– covariate analysis
• Randomised allocation of treatments to subjects
– randomised controlled trial = "Gold Standard"
• Placebo effect?
Postgraduate Certificare in Statistics
Design and Analysis of Experiments
Lecture 6.2 18
© 2016 Michael Stuart
Ethical issues
• withholding medical treatment?
• blinding,
• double blinding,
• inadequate budget
– puts patients at risk
for non-informative results
Postgraduate Certificare in Statistics
Design and Analysis of Experiments
Lecture 6.2 19
© 2016 Michael Stuart
Design and Analysis of Experiments
Lecture 6.2 Review topics
1. Repeated measures
2. Complex block structures
3. Missing / unbalanced data
4. Analysis of Covariance
5. Clinical trials
6. Response surface methodology
7. Transformations
8. Strategies for Experimentation
Postgraduate Certificare in Statistics
Design and Analysis of Experiments
Lecture 6.2 20
© 2016 Michael Stuart
Initial experiment used to suggest
second experiment with improved results.
Sequence of experiments leads to
best results,
sequential assembly
6 Response surface methodology:
Optimisation using Factorials Designs
Postgraduate Certificare in Statistics
Design and Analysis of Experiments
Lecture 6.2 21
© 2016 Michael Stuart
Optimising performance; hill climbing
50 52 54 56 58 60 62 64
Temperature
65
66
67
68
69
70
Yield
Postgraduate Certificare in Statistics
Design and Analysis of Experiments
Lecture 6.2 22
© 2016 Michael Stuart
Hill climbing
Postgraduate Certificare in Statistics
Design and Analysis of Experiments
Lecture 6.2 23
© 2016 Michael Stuart
Hill climbing
Postgraduate Certificare in Statistics
Design and Analysis of Experiments
Lecture 6.2 24
© 2016 Michael Stuart
Hill climbing
Postgraduate Certificare in Statistics
Design and Analysis of Experiments
Lecture 6.2 25
© 2016 Michael Stuart
Hill climbing
Postgraduate Certificare in Statistics
Design and Analysis of Experiments
Lecture 6.2 26
© 2016 Michael Stuart
Use 2-level factors to locate optimum;
use multi-level factors to explore the response
surface in more detail.
Analysis may involve use of regression methods
and transformation of variables.
NB: Avoid the rush into multi-level factors;
Sequential assembly (Box)
Postgraduate Certificare in Statistics
Design and Analysis of Experiments
Lecture 6.2 27
© 2016 Michael Stuart
Design and Analysis of Experiments
Lecture 6.2 Review topics
1. Repeated measures
2. Complex block structures
3. Missing / unbalanced data
4. Analysis of Covariance
5. Clinical trials
6. Response surface methodology
7. Transformations
8. Strategies for Experimentation
Postgraduate Certificare in Statistics
Design and Analysis of Experiments
Lecture 6.2 28
© 2016 Michael Stuart
7 Transformations
• log transformation
• other transformations
• generalised linear models
Postgraduate Certificare in Statistics
Design and Analysis of Experiments
Lecture 6.2 29
© 2016 Michael Stuart
Why transform?
Postgraduate Certificare in Statistics
Design and Analysis of Experiments
Lecture 6.2 30
© 2016 Michael Stuart
Why transform?
Corresponding skew distribution
Postgraduate Certificare in Statistics
Design and Analysis of Experiments
Lecture 6.2 31
© 2016 Michael Stuart
Why transform?
Postgraduate Certificare in Statistics
Design and Analysis of Experiments
Lecture 6.2 32
© 2016 Michael Stuart
Changing spread with log
Postgraduate Certificare in Statistics
Design and Analysis of Experiments
Lecture 6.2 33
© 2016 Michael Stuart
Changing spread with log
Postgraduate Certificare in Statistics
Design and Analysis of Experiments
Lecture 6.2 34
© 2016 Michael Stuart
Changing spread with log
Postgraduate Certificare in Statistics
Design and Analysis of Experiments
Lecture 6.2 35
© 2016 Michael Stuart
Changing spread with log
Postgraduate Certificare in Statistics
Design and Analysis of Experiments
Lecture 6.2 36
© 2016 Michael Stuart
Changing spread with log
Postgraduate Certificare in Statistics
Design and Analysis of Experiments
Lecture 6.2 37
© 2016 Michael Stuart
Changing spread with log
Postgraduate Certificare in Statistics
Design and Analysis of Experiments
Lecture 6.2 38
© 2016 Michael Stuart
Changing spread with log
Postgraduate Certificare in Statistics
Design and Analysis of Experiments
Lecture 6.2 39
© 2016 Michael Stuart
Changing spread with log
Postgraduate Certificare in Statistics
Design and Analysis of Experiments
Lecture 6.2 40
© 2016 Michael Stuart
Changing spread with log
Postgraduate Certificare in Statistics
Design and Analysis of Experiments
Lecture 6.2 41
© 2016 Michael Stuart
Why the log transform works
High spread at high X
transformed to
low spread at high Y
Low spread at low X
transformed to
high spread at low Y
Postgraduate Certificare in Statistics
Design and Analysis of Experiments
Lecture 6.2 42
© 2016 Michael Stuart
Multiplicative models
Instead of simple linear regression:
Y = a + bX + e
suppose the model is multiplicative:
Y = gXw d
Log transform:
log(Y) = log(g) + w log(X) + log(d)
simple linear regression!
Postgraduate Certificare in Statistics
Design and Analysis of Experiments
Lecture 6.2 44
© 2016 Michael Stuart
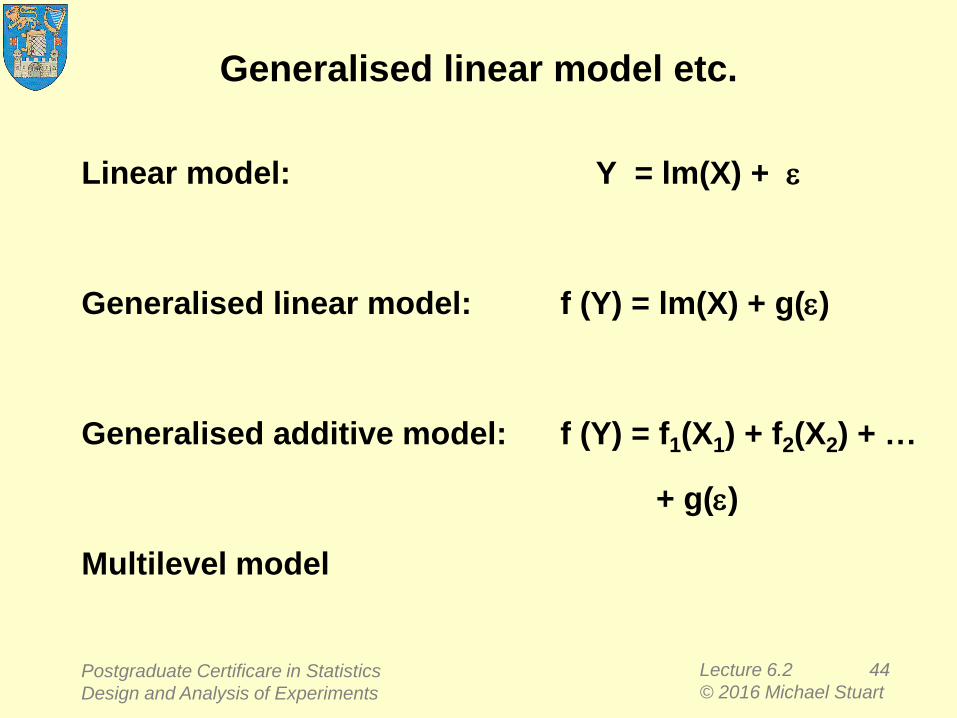
Generalised linear model etc.
Linear model: Y = lm(X) + e
Generalised linear model: f (Y) = lm(X) + g(e)
Generalised additive model: f (Y) = f1(X1) + f2(X2) + …
+ g(e)
Multilevel model
Postgraduate Certificare in Statistics
Design and Analysis of Experiments
Lecture 6.2 45
© 2016 Michael Stuart
Design and Analysis of Experiments
Lecture 6.2 Review topics
1. Repeated measures
2. Complex block structures
3. Missing / unbalanced data
4. Analysis of Covariance
5. Clinical trials
6. Response surface methodology
7. Transformations
8. Strategies for Experimentation
Postgraduate Certificare in Statistics
Design and Analysis of Experiments
Lecture 6.2 46
© 2016 Michael Stuart
8 Strategies for Experimenting
• A list:
– Consultation
– Design
– Planning
– Resources
– Ethical issues
– Implementation (of design)
– Application (of results)
Postgraduate Certificare in Statistics
Design and Analysis of Experiments
Lecture 6.2 47
© 2016 Michael Stuart
Strategy for Experimenting
Shewhart's PDCA Cycle
Check
Act
Plan
Do
Postgraduate Certificare in Statistics
Design and Analysis of Experiments
Lecture 6.2 48
© 2016 Michael Stuart
Strategy for Experimenting
Shewhart's PDCA Cycle
• Plan: Plan a change to the process, predict its effect, plan to measure the effect
• Do: Implement the change as an experiment and measure the results
• Check: Analyse the results to learn what effect the change had, if any
• Act: If successful, make the change permanent, proceed to plan the next improvement
or
if not, proceed to plan an alternative change
Postgraduate Certificare in Statistics
Design and Analysis of Experiments
Lecture 6.2 49
© 2016 Michael Stuart
Robinson's outline
Ref: GKR p.6, see also p.7
Postgraduate Certificare in Statistics
Design and Analysis of Experiments
Lecture 6.2 50
© 2016 Michael Stuart
Strategy
When you see the credits roll at the end of a
successful movie you realize there are many more
things that must be attended to in addition to
choosing a good script.
Similarly in running a successful experiment there
are many more things that must be attended to in
addition to choosing a good experimental design.
George Box
Postgraduate Certificare in Statistics
Design and Analysis of Experiments
Lecture 6.2 51
© 2016 Michael Stuart
Readings from DCM (and BHH)
and others
Time related issues
repeated measures
Kuehl, Robert O., Design of experiments : statistical
principles of research design and analysis, Ch. 15
cross-over designs
Complex block structures
Analysis of Covariance
Robustness studies
Clinical trials
Response surface designs
Transformations
Strategies for Experimentation
x§15.4
§4.2
§4.4 (§§4.4, 4.5)
§§15.3, 15.3.2, 15.3.4
§12.1 (§13.1)
Pocock, SJ
§11.1 (Ch. 12)
§3.4.3, §15.1 (Ch. 8)
§1.1 Postgraduate Certificare in Statistics
Design and Analysis of Experiments