Abstract: This first small-animal up-conversion imager (SAUCI) was developed and used for in-vivo imaging of up-converting nanoparticles (UCNs.) Unlike traditional fluorophores, UCNs absorb multiple lower-energy photons and emit a single higher-energy photon. This unique physical process makes it possible to image deeper into tissue with lower background signals. In vivo imaging of particle accumulation in the liver was demonstrated following intravenous injection of particles.
OCIS codes: (170.3880) Medical and Biological Imaging; (190.4180) Multiphoton processes.
References and links
1. B. Chakravarti, M. Louie, W. Ratanaprayul, A. Raval, S. Gallagher, and D. N. Chakravarti, “A highly uniform UV transillumination imaging system for quantitative analysis of nucleic acids and proteins,” Proteomics 8, 1789-1797 (2008).
2. A. Wunder, C.-H. Tung, U. Muller-Ladner, R. Weissleder, and U. Mahmood, “In vivo imaging of protease activity in arthritis,” Arthritis and Rheumatism 50, 2459-2465 (2004).
3. S. Andersson-Engels, C. Klinteberg, K. Svanberg, and S. Svanberg “In vivo fluorescence imaging for tissue diagnostics,” Phys. Med. Bio. 42, 815-824 (1997).
4. R. Weissleder and V. Ntziachristos “Shedding light onto live molecular targets” Nature Medicine 9, 123-128 (2003).
5. P. L. A. M Corstjens, S. Li, M. Zuiderwijk, K. Kardos, W. R. Abrahms, R. S. Niedbla, and H. J. Tanke, “Infrared up-converting phosphors for bioassays,” IEEE Proc. Nanobiotechnol. 152 64-72 (2005).
6. Z. Chen, H. Chen, H. Hu, M. Yu, F. Li, Q. Zhang, Z. Zhou, T. Yi, and C. Huang, “Versatile synthesis strategy for carboxylic acid-functionalized upconverting nanophosphores as biological labels,” JACS 130 3023-3029 (2008).
7. K. Kuningas, H. Pakkila, T. Ukonaho, T. Rantanen, T. Lovgren, and T. Soukka, “Upconversion fluorescence enables homogeneous immunoassay in whole blood,” Clin. Chem. 53 145-146 (2007).
8. T. Rantanen, M.-L. Jarvenpaa, J. Vuojola, K. Kuningas, and T. Soukka, “Fluorescence-quenching-based enzyme-activity assay by using photon upconversion,” Angew. Chem. Int. Ed. 47 3811-3813 (2008).
9. S. F. Lim, R. Riehn, W. S. Ryu, N. Khanarian, C.-K. Tung, D. Tank, and R. H. Austin, “In vivo and scanning electron microscopy imaging of upconverting nanophosphors in caenorhabditis elegans” Nano. Lett. 6, 169-174 (2006).
10. D. K. Chatterjee, A. J. Rufaihah, and Y. Zhang, “Upconversion fluorescence imaging of cells and small animals using lanthanide doped nanocrystals,” Biomaterials 29, 937-943 (2008).
11. American National Standard for Safe Use of Lasers ANSI Z136.1-2000 (American National Standard Institute, Orlando, Fl 2000).
1. Introduction
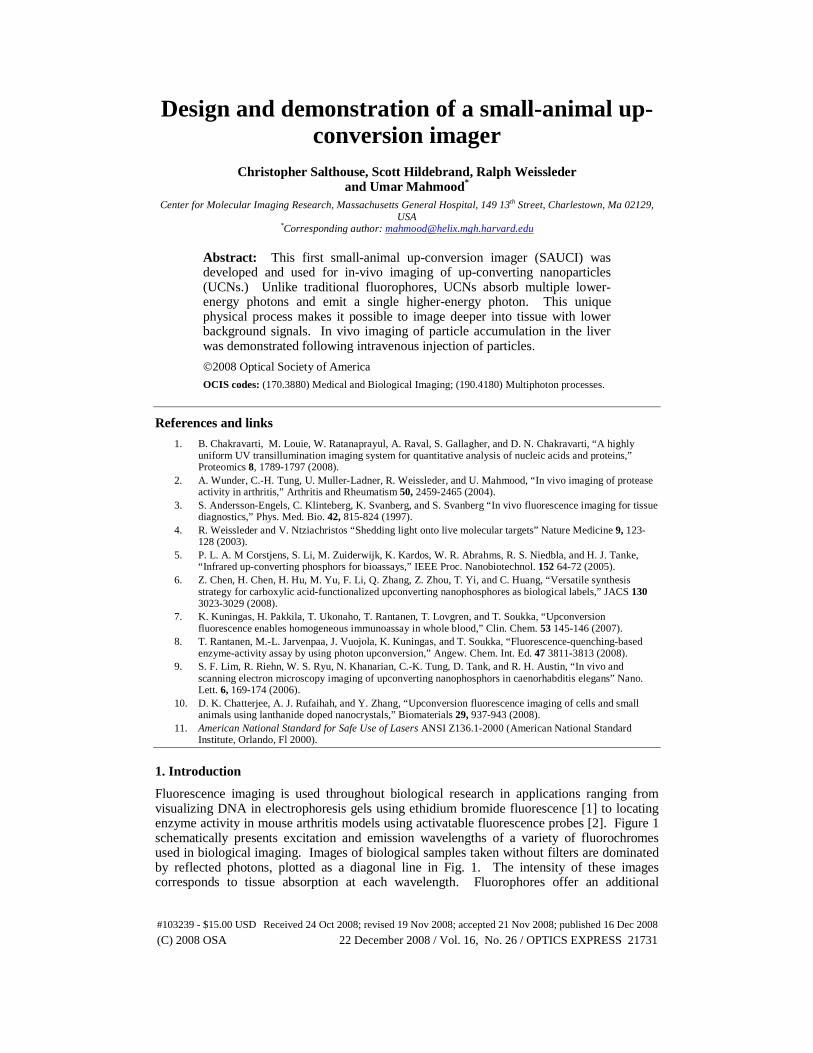
Fluorescence imaging is used throughout biological research in applications ranging from visualizing DNA in electrophoresis gels using ethidium bromide fluorescence [1] to locating enzyme activity in mouse arthritis models using activatable fluorescence probes [2]. Figure 1 schematically presents excitation and emission wavelengths of a variety of fluorochromes used in biological imaging. Images of biological samples taken without filters are dominated by reflected photons, plotted as a diagonal line in Fig. 1. The intensity of these images corresponds to tissue absorption at each wavelength. Fluorophores offer an additional
#103239 - $15.00 USD Received 24 Oct 2008; revised 19 Nov 2008; accepted 21 Nov 2008; published 16 Dec 2008
(C) 2008 OSA 22 December 2008 / Vol. 16, No. 26 / OPTICS EXPRESS 21731
contrast mechanism. Fluorophores are excited by light at one wavelength, and emit photons at another lower-energy wavelength. The excitation and emission peaks of a number of common fluorophores are plotted as circles, for exogenous fluorophores, and diamonds, for endogenous fluorophores, in Fig. 1. The close proximity of endogenous and exogenous fluorophores in the plot highlights the common problem of unwanted endogenous fluorescence signals in measurements of exogenous fluorescence [3]. The clustering of fluorophores in the lower right portion of the graph highlights a second problem, excitation and emission light for these fluorophores is at short wavelengths that are highly absorbed by tissue [4].
Fig. 1. Excitation and emission wavelengths of luminescence sources are plotted in a graph. The diagonal line shows that illumination photons are reflected off the sample into the imager. Fluorophores are below the reflectance line because they absorb a higher energy photon and emit a lower energy photon. Upconverting Nanoparticles are fundamentally different; a high-energy photon is emitted following absorption of two low energy photons.
Upconverting nanoparticles (UCNs) appear in the upper triangle of Fig. 1 because a
single higher-energy photon is emitted following absorption of multiple lower-energy photons. The background signal in in vivo measurements of UCNs is very low for two reasons. First, biological samples exhibit essentially zero upconversion. Second, 980nm excitation excites very few other sources of luminescence. The long excitation and emission
#103239 - $15.00 USD Received 24 Oct 2008; revised 19 Nov 2008; accepted 21 Nov 2008; published 16 Dec 2008
(C) 2008 OSA 22 December 2008 / Vol. 16, No. 26 / OPTICS EXPRESS 21732
wavelengths demonstrated by the plotting of UCNs in the upper left portion of the plot are less absorbed by tissue allowing for deeper tissue penetration [4].
These two advantages have led to the development of a variety of in vitro assays using UCNs including: DNA detection [5-6], histological staining [5], immunoassays in blood [7], and enzyme activity assays [8]. The probes used in those experiments parallel many of the fluorescence probes used for in vivo imaging including: affinity ligands [5], antibody targeting [7], and even activatable probes [8]. Despite the advances in probe development, applications to in vivo imaging have been limited. One group has reported imaging at high illumination powers of 10W/mm^2 of C. Elegans that ingested UCN[9]. A second group has demonstrated spot measurements of subcutaneously injected UCN without reporting illumination area or power [10].
In this paper, we present the first demonstration of UCN imaging in live mice. First, we present the development of biocompatible upconverting nanoparticles. Then, we describe the small animal up-conversion imager (SAUCI). Characterization of SAUCI is next explained. Finally, the protocol and results for imaging of particle accumulation in the liver of a live mouse are shown.
2. Up-Converting Nanoparticle (UCN) preparation and characterization
2.1 Particle Preparation
Red-emitting yttrium oxide nanoparticles are commercially available, however, they are not suitable for in vivo imaging since they immediately precipitate from aqueous suspension. These particles can be coated with hydrophilic polymers to render them water suspendible. Red-emitting yttrium oxide particles (Lot 1LZL062A2) were purchased from Nanocerox Inc. and used for preparation of the soluble nanoparticles. Upconverting particles (500 mg) were suspended in ethylene glycol (15 mL) and sonicated in a water bath for 8 h, giving a white suspension. To this suspension was added 500 mg of 15,000 mW polyacrylic acid (free acid form) and the suspension was further sonicated for 20 h. After sonication, 20 mL of MeOH was added and the polyacrylic acid coated particles were isolated by centrifugation for 30 min at 10,000 G. The solid particle pellet was resuspended and washed 3 times with 25 mL of 0.1 M phosphate buffer, pH 7.4. After the final wash, the polyacrylic acid coated particles were suspended in 2.5 mL of the phosphate buffer, giving a final particle concentration of 190 mg/mL, as determined by lyophylization of a 50 uL aliquot of this suspension. Subsequently to coat the surface of the particles with polyethylene glycol, the polyacrylic acid-modified nanoparticles (400 mg, 2.1 mL) were diluted in 4 mL of 0.1 M bicarbonate buffer, pH 7.4. To this mixture, was added 2000 mW mPEG-NH2 (320 mg in 16 mL of 0.1 M bicarbonate buffer, pH 7.4) from Creative PEGWorks and the suspension was further diluted by addition DMSO (60 mL). Following sonication of this suspension for 1 h, 4.00 g of 1-ethyl-3-(3-dimethylaminopropyl) carbodiimide hydrochloride (EDC) was added and sonication was continued for 30 min. An additional 4.00 g portion of EDC was then added and the mixture was sonicated for a further 30 min. The coated particles were isolated by centrifugation for 20 min at 10,000 G. The nanoparticle pellet was resuspended and washed 3 times with 25 mL of bicarbonate buffer, pH 7.4. After the final wash, the polyacrylic acid coated and polyethylene glycol modified particles were suspended in 2.0 mL of the bicarbonate buffer, giving a final particle concentration of 80 mg/mL, as determined by lyophylization of a 100 uL aliquot of this suspension.
2.2 Particle Characterization
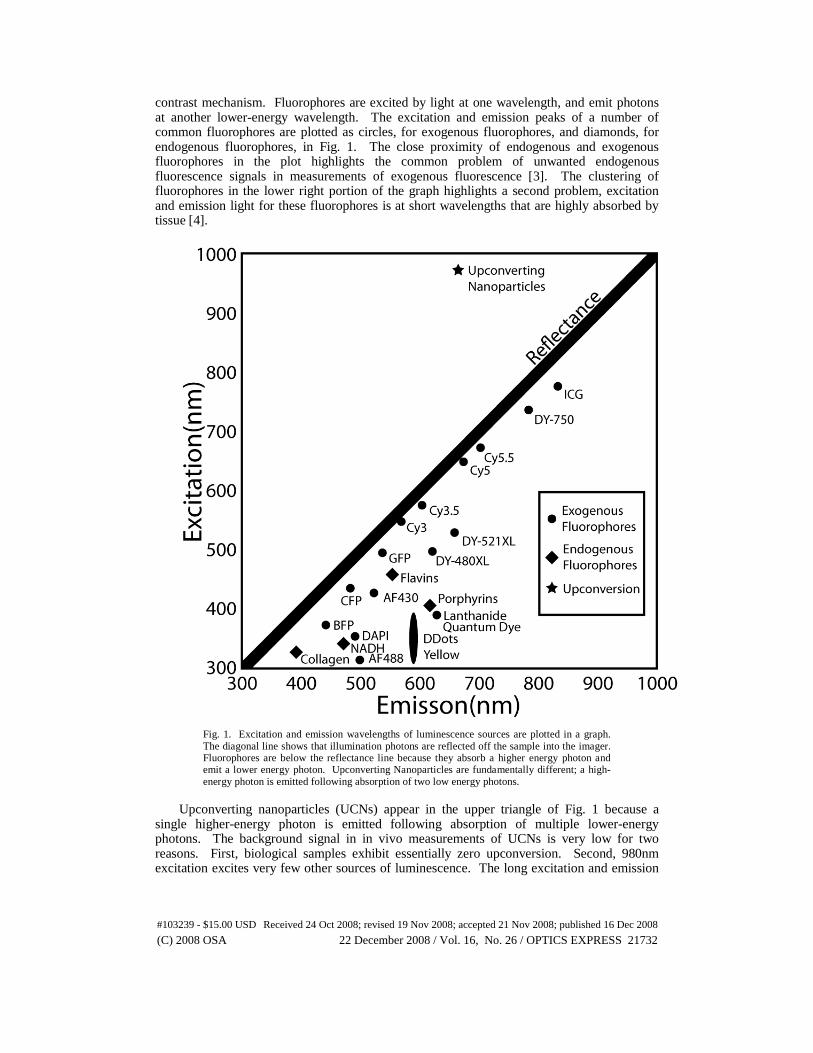
The UCN particles were characterized following functionalization for biocompatibility. The coated particles were 175nm in diameter as measured by dynamic light scattering. These particles maintained the emission characteristics consistent with the uncoated particles as shown in Fig. 2.
#103239 - $15.00 USD Received 24 Oct 2008; revised 19 Nov 2008; accepted 21 Nov 2008; published 16 Dec 2008
(C) 2008 OSA 22 December 2008 / Vol. 16, No. 26 / OPTICS EXPRESS 21733
Fig. 2. Up-converting nanoparticle emission spectrum. A 0.2 mg/mL solution of UCNs was excited by a 300mw 980nm laser diode. The emission is characterized by a collection of sharp peaks, with the strongest peak at 660nm.
Emitted luminescence was measured using modified Horiba Jobin Yvon Fluorolog-3
spectrophotometer. Excitation was provided by a 300mW 980nm laser diode (Roithner Lasertechnik) filtered by a 980nm band-pass filter. The emission is filtered through a 750 nm short-pass filter to remove the excitation light prior to entering the monochromator. Fluorimeter measurements were then made following the standard protocol for the instrument.
3. Imager design
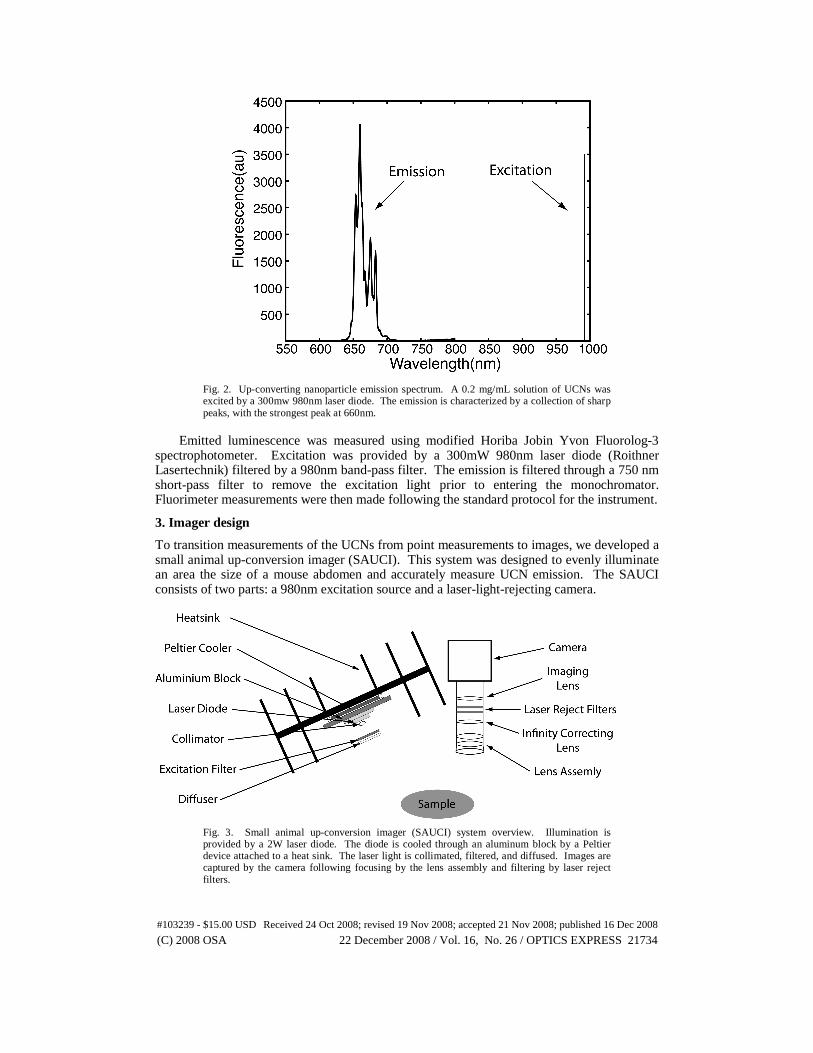
To transition measurements of the UCNs from point measurements to images, we developed a small animal up-conversion imager (SAUCI). This system was designed to evenly illuminate an area the size of a mouse abdomen and accurately measure UCN emission. The SAUCI consists of two parts: a 980nm excitation source and a laser-light-rejecting camera.
Fig. 3. Small animal up-conversion imager (SAUCI) system overview. Illumination is provided by a 2W laser diode. The diode is cooled through an aluminum block by a Peltier device attached to a heat sink. The laser light is collimated, filtered, and diffused. Images are captured by the camera following focusing by the lens assembly and filtering by laser reject filters.
#103239 - $15.00 USD Received 24 Oct 2008; revised 19 Nov 2008; accepted 21 Nov 2008; published 16 Dec 2008
(C) 2008 OSA 22 December 2008 / Vol. 16, No. 26 / OPTICS EXPRESS 21734
The illuminator was constructed around the brightest 980nm laser diode widely available,
a 2W laser in a TO3 package (Roithner Lasertechnik). The laser diode was converted to an illuminator with three additions: cooling, filtering, and diffusing. Active cooling in the form of a Peltier solid-state heat pump extracts heat from the small laser diode. The diode is mounted on an aluminum block. Heat is drawn from the block by the Peltier device and pumped into the heat sink. During operation of both the laser and cooling stage, this system cools the aluminum block to 15°C in a 23°C ambient environment when the cooler is biased at 6V drawing 200mA.
Filtering of the laser light begins with collimation by an aspherical lens (Thorlabs) to ensure proper operation of the interference filters. The collimated light is then filtered by a 980nm band-pass filter (Semrock.) A square diffuser (Thorlabs) then diffuses the light. The illumination variation of a standard Gaussian diffuser is amplified by the polynomial dependence on illumination intensity for the up-conversion process, so the square diffuser’s design with less than 10% intensity variation over a twenty-degree illumination area is essential. This chain of collimation, filtering, and diffusing reduces the laser power, but the measured power is still an acceptable 135mW with the laser diode biased safely at 1.7A and 1.9V. Under these conditions, the imager illuminates an area 4cm by 5cm with 2.6mW/cm2 of power. This is well below even the conservative limits set for human skin exposure of 726mW/cm2 at 980nm[11].
The light in the laser-light-rejecting camera first travels through a c-mount lens assembly (Schneider Optics) that is used to adjust focus and aperture. A single 30mm achromatic lens (Edmund Optics) extends the focal length of the lens assembly from 17.5mm to infinity for filtering. The 980nm excitation light is filtered out by a cascade of a 950nm short-pass filter (Omega Optics) and a 750 short-pass filter (Semrock). A second 30mm achromatic lens (Edmund Optics) then creates an image on a Pixelfly QE (Cooke Corporation), a 12-bit CCD camera designed for high quantum efficiency.
Three techniques are used to reduce noise in the up-conversion images. First, the camera is configured to bin pixels by a factor of two in each dimension. Combining four pixels before digitization reduces the photon referred noise added by digitization by a factor of two. Second, each time an up-conversion image is taken a second “black image” is taken with the illumination turned off. The “black image” is subtracted from the up-conversion image to remove the effect of “hot pixels”, pixels that have high values independent of light. Third, noise is further reduced at the cost of resolution by applying a Gaussian blur to the up-conversion image.
4. Imager verification
The illumination area, illumination dependence, and concentration dependence were verified in separate experiments. The illumination area can be measured by imaging the 980nm light directly if the 750 short-pass filter is removed from the light path. The remaining 950nm short-pass filter allows a small fraction of the excitation light to pass through to the CCD. The intensity profile along a line across the illumination area is plotted in the top graph of Fig. 4(a). Illumination area can also be measured with the 750 short-pass filter in place by imaging an area uniformly covered with up-converting material. The lower graph in Fig. 4(a) is the intensity profile along the same line when imaging photons emitted from a 6cm by 5cm card formed by joining two 3cm by 5cm IR detector cards (Roithner Lasertechnik). Because the up conversion increases the effects of illumination variation, a better measure of the evenly illuminated area is obtained by imaging an upconverting material. Imaging of the up-converting area during 980nm excitation revealed a 4cm by 5cm rectangle of illumination.
Comparison of 980nm reflection intensity profile with up-conversion intensity profile qualitatively demonstrates the nonlinearity of up-conversion, to quantify the non-linearity of the UCNs developed in section 2, UCN emission was measured at different laser power levels. The relationship between laser power and up-conversion emission plotted in Fig. 4(b) was measured while varying the laser diode current from 500mA to 1.5A. Theoretically, the
#103239 - $15.00 USD Received 24 Oct 2008; revised 19 Nov 2008; accepted 21 Nov 2008; published 16 Dec 2008
(C) 2008 OSA 22 December 2008 / Vol. 16, No. 26 / OPTICS EXPRESS 21735
laser power should increase linearly with increases in current above the threshold current, but temperature variations can change the efficiency of the laser diode, so laser power was measured at each current setting by taking an image of the reflected light with the 750nm short-pass filter removed. The up-conversion luminescence was then measured using our UCNs with the short-pass filter replaced. The sweep from low current to high current was repeated three times for the calculation of the standard error bars shown in Fig. 4(b). The plot demonstrates that the laser power can be linearly controlled with laser diode current and the UCN emission increases faster than linear with increasing illumination intensity.
Fig. 4. (A) Illumination profiles as measured via reflection and up conversion. (B) Laser intensity measured by pixel intensity varied linearly with laser current. UCN emission increased at a rate greater than linear, denoting a multiphoton process. (C) UCN emission increases linearly with particle concentration.
Up-conversion emission is nonlinear with illumination intensity, but should be linear with
particle concentration for low concentrations where particles only absorb small portions of the excitation and emission light. This linearity was demonstrated by imaging UCNs in aqueous solution. Microcentrifuge tubes were loaded with 500μL of 10mg/mL, 5mg/mL, 2.5mg/mL, 1mg/mL, and 0.5mg/mL solutions. The up-conversion image was taken and the mean pixel intensity was measured for each sample using ImageJ. The linear emission dependence on concentration is shown in Fig. 4(c).
5. Mouse imaging
In vivo imaging was performed on three female nude mice. Five milligrams of UCNs were diluted in 250μL of physiological saline in preparation for injection. The probe was then injected into the tail vein of mice anesthetized with isofluorane. The following day, the mice were anesthetized for imaging with an intraperitoneal injection of Ketamine and Xylazine. The mice were imaged with the SAUCI after the skin and fascia were surgically removed to expose the abdominal organs. A representative mouse is shown in Fig. 5. The illuminated area is outlined by a rectangle in Fig. 5(a-b) and the liver illumination is clearly visible. Analysis in ImageJ measured the signal-to-background ratio at 20. The organs were removed and imaged separately to verify particle localization as shown in Fig. 5(c-f).
#103239 - $15.00 USD Received 24 Oct 2008; revised 19 Nov 2008; accepted 21 Nov 2008; published 16 Dec 2008
(C) 2008 OSA 22 December 2008 / Vol. 16, No. 26 / OPTICS EXPRESS 21736
Fig. 5. In vivo up-conversion imaging. (A) White light picture of prepared mouse showing the up-conversion imaging area. (B) Up-conversion image of mouse showing liver uptake of particles. (C, E, G) White light images of spleen, kidney, and liver respectively. (D, F, H) Up-conversion images corresponding to the white light images in C, E, and G.
6. Conclusion
Up-converting nanoparticles use a unique two-photon process to emit a higher-energy photon after absorbing multiple lower-energy photons. Because tissue does not perform up conversion, imaging of UCNs does not have the high background signals caused by endogenous fluorophores in fluorescence imaging. The wavelengths of excitation and emission of UCNs offer the further advantage of low tissue absorption. Recently, other groups have developed a variety of in vitro applications for UCNs including antibody targeting and enzyme activation. In this work, we took the next step by imaging UCNs in live mice. Particle accumulation in the liver is visible in both whole animal imaging and in the removed organs. The technology is uniquely suited to now develop next generation targed nano-materials with molecular specificity.
Acknowledgments
The authors would like to thank Fangwei Shao for her assistance in this work. This research was supported by NIH grants R01EB001872 “In vivo Multichannel Fluorescence Imaging”, U01-HL080731 “Translational Program of Excellence in Nanotechnology”, and T32EB002102 training grant “Postgraduate Program in Radiological Sciences.”
#103239 - $15.00 USD Received 24 Oct 2008; revised 19 Nov 2008; accepted 21 Nov 2008; published 16 Dec 2008
(C) 2008 OSA 22 December 2008 / Vol. 16, No. 26 / OPTICS EXPRESS 21737