IOSR Journal of Electrical and Electronics Engineering (IOSR-JEEE) vol.10 issue.3 version.4
7
IOSR Journal o f Electrical and E lectronics E ngineering ( IOSR-JEEE ) e-ISSN: 2278-1676,p-ISSN: 2320-3331, Volume 10, Issue 3 Ver. IV (May–Jun. 2015), PP 47-53 www.iosrjournals.org DOI: 10.9790/1676-10344753 www.iosrjo urnals.org 47 | Page Design and Development of Low Cost and Portable Microcontrolle r B ased Hygrometer Kazi Golam Martuza 1 , Humayun Kabir1* , Farhana Hafiz 2 , Fahmida Akter2 , Mahbubul Hoq 2 , Mahedee Hasan 1 , Md. Abdul Mannan Chowdhury 1 , 1 Department of Phys ics, Jahangirnagar Uni versity, Savar, Dhaka-1342, Bangladesh . 2 Institute of Electronics (IE), AER E, Savar, Dhaka, Bang ladesh. 1*Addr es s f or cor r es pondence:Humayun Kabir, Abstract: The hygrometer is widely used in air conditioner, humidity data logger, humidifier & dehumidifier etc. The aim of this research work is to design and development of a low cost, portable microc ontroller based hygrometer. The hygrometer has b een designed using the sensor module HSM-20G. The se nsor operates in capacitive principle, i.e. changes in relative humidity (RH) of the surrounding air cause a change in dielectric constant of the polymer film leading to a change of sensor capacitance. The module converts this capacitance change into analog voltage. The HSM-20G sensor provides analog voltage for both temperature and humidity. The sensor is connected with PIC16F876A microcontroller, which converts the analog voltage into digital and display the result into 16 X 2 alphanumeric LCD display. The program is written in C language using mikro C PRO. The measuring accuracy of the humidity reading of our desig ned meter is negligible. Keywords:Hygrometer, m icrocontroller, relative humidity, sensor capacitanc e, LCD display, and C program . I.Introduction Hygrometry is the part of physics, which deals with the measurement of the amount of water vapour present in a given volume of ai r. Condensation of t his aqueous vapour present in th e atmosphere is responsible for various phenomena like formation of clouds, fogs, rains, snows, hails, etc [1]. The capacity of air to hold water vapour is limited and is controlled by temperature only. If the air in any place and time contains the maximum amount of water vapour that it can hold, it is said to be saturat ed, otherwise it i s unsaturated [2]. Dew point is the temperature at which water vapour actually present in the air just reaches saturatio n. We may, therefore, define dew point as that temperature at which the pressure of water vapour actually present in the atmosphere is equal to the saturation pressure of water vapour corresponding to dew point. Knowledge of dew point enables us to find out the pressure of water vapour actually present in the atmosphere. For example, dew point today is 20 at a particular p lace at the time of observation. From Regnault‟s chart, it is found that the saturation pressure of water vapour at 20 0 C is 17 mm. Hence today at t he particular place, the pressure of water vapour actually present in the atmosphere is 17 mm [3]. The term „humidity‟ signifies the dampness or wetness of the atmosphere due to its holding of water vapour. It is the concentration of water vapor in the air. The concentration can be expressed as absolute humidity, specific humidity, or relative humidity [4]. Relative humidity (R.H.) or hygrometric state of air is defined to be the ratio of the quantity of water vapour actually present in a certain volume of air at a particular temperature to the quantity of water vapour that would be required to saturate the same volume of air at the same temperature [5]. So R.H.= C at air ofvolume same the saturate to necessary our water vap ofMass C at air ofany volum e in p rese nt actually our water vap ofMass 0 0 Since pressure of water vapour is proportional to the amount of water vapour present in a given volume of atmosphere, we may define relative humidity as R.H.= C at air the saturate to necessary our water vap ofPressure C at air in the present actually our water vap ofPressure 0 0 Since the saturation vapour pressure of water at dew point is the actual pressure of water vapour contained in the atmosphere at a particular temperature, so relative humidity can be written as R.H.= ai rthe ofC) ( re temperatu at the p ressure vapour Saturation p oin t dew at the p ressure vapour Saturation 0
Transcript
7/18/2019 Design and Development of Low Cost and Portable Microcontroller Based Hygrometer
1 Department of Physics, Jahangirnagar University, Savar, Dhaka-1342, Bangladesh.2 Institute of Electronics (IE), AERE, Savar, Dhaka, Bangladesh.
1* Address for cor respondence: Humayun Kabir,
Abstract: The hygrometer is widely used in air conditioner, humidity data logger, humidifier & dehumidifier
etc. The aim of this research work is to design and development of a low cost, portable microcontroller basedhygrometer. The hygrometer has been designed using the sensor module HSM-20G. The sensor operates incapacitive principle, i.e. changes in relative humidity (RH) of the surrounding air cause a change in dielectricconstant of the polymer film leading to a change of sensor capacitance. The module converts this capacitance
change into analog voltage. The HSM-20G sensor provides analog voltage for both temperature and humidity.The sensor is connected with PIC16F876A microcontroller, which converts the analog voltage into digital anddisplay the result into 16 X 2 alphanumeric LCD display. The program is written in C language using mikro C
PRO. The measuring accuracy of the humidity reading of our designed meter is negligible.
Keywords: Hygrometer, microcontroller, relative humidity, sensor capacitance, LCD display, and C program.
I. IntroductionHygrometry is the part of physics, which deals with the measurement of the amount of water vapour
present in a given volume of air. Condensation of this aqueous vapour present in the atmosphere is responsible
for various phenomena like formation of clouds, fogs, rains, snows, hails, etc [1]. The capacity of air to holdwater vapour is limited and is controlled by temperature only. If the air in any place and time contains themaximum amount of water vapour that it can hold, it is said to be saturated, otherwise it is unsaturated [2]. Dew
point is the temperature at which water vapour actually present in the air just reaches saturation. We may,therefore, define dew point as that temperature at which the pressure of water vapour actually present in theatmosphere is equal to the saturation pressure of water vapour corresponding to dew point. Knowledge of dew point enables us to find out the pressure of water vapour actually present in the atmosphere. For example, dew point today is 20 at a particular place at the time of observation. From Regnault‟s chart, it is found that the
saturation pressure of water vapour at 200C is 17 mm. Hence today at the particular place, the pressure of water
vapour actually present in the atmosphere is 17 mm [3].The term „humidity‟ signifies the dampness or wetness of the atmosphere due to its holding of water
vapour. It is the concentration of water vapor in the air. The concentration can be expressed as absolutehumidity, specific humidity, or relative humidity [4]. Relative humidity (R.H.) or hygrometric state of air isdefined to be the ratio of the quantity of water vapour actually present in a certain volume of air at a particulartemperature to the quantity of water vapour that would be required to saturate the same volume of air at the
same temperature [5]. So
R.H.=C atairof volumesamethesaturatetonecessaryourwater vapof Mass
Catairof any volumein presentactuallyourwater vapof Mass0
0
Since pressure of water vapour is proportional to the amount of water vapour present in a given volume ofatmosphere, we may define relative humidity as
Catairin the presentactuallyourwater vapof Pressure0
0
Since the saturation vapour pressure of water at dew point is the actual pressure of water vapour contained in theatmosphere at a particular temperature, so relative humidity can be written as
R.H.= air theof C)(retemperatuat the pressurevapourSaturation
Relative humidity is generally expressed as a percentage and is calculated by applying any of the above
equation. For example, if f denotes the saturation vapour pressure at the dew point and F the saturation vapour pressure at the temperature of air, then,
R.H.=F
f 100%
The feeling of dampness or dryness depends upon the factor „Relative humidity‟. A low relativehumidity encourages evaporation and, therefore, the air will appear dry and high value of it will discourage
evaporation, and the air will appear damp. This is why wet clothes are found to dry up more quickly if relativehumidity of the atmosphere is low [6].
The hygrometric state of the air or its relative humidity is of great service in weather forecasting. Dew point predicts minimum temperature at night. Information regarding relative humidity is necessary by the Public
Health Department, as germs of certain diseases multiply very quickly in moist atmosphere. Proper humiditynecessary for health and comfort can be produced artificially. The humidity of the air in refrigerators storingmeat must not exceed a definite value, otherwise the meat deteriorates; artificial seasoning of timber takes place
under pre-arranged value of air humidity. Tobacco deteriorates unless the air in the storeroom has a specifiedhumidity. Thus, it is very important to measure the relative humidity [7]. Table-1 shows the specification of thedesigned temperature and humidity monitor.
Table-1: The specification of designed temperature and humidity monitor.
Features Specifications
Main voltage 220V, 50Hz
Temperature ranges 5 0C-60 0C
Temperature accuracy 1.00C
Humidity sensor HSM-20G
Humidity ranges 20 to 95%
Humidity accuracy 5% RH
II.
MethodologyTo design a system, the first attempt has been taken is to design the block diagram of the desired
system. The block diagram of the complete units consists of several blocks. Fig. 1 shows the complete blockdiagram of the designed humidity monitor. The roughly operation of this device is that when the on off button is
pressed by the user, the device will activated and LCD will display both the reading of humidity level withtemperature level and also that the readings is displayed by output measured by the sensor continuously . Thedevice will stop operating as the on/off button is pressed once again. The device will need a battery 0f 9V butthe voltage regulators will regulate the voltage to 5V for device usage. In order to load the program in the
microcontroller used which is PIC16F876A, MPLAB was used for this Portable humidity Reader. This softwarewill load all program made into internal memory of PIC16F876A. Once the HEX file was created in theMPLAB, this file will then be loaded into PIC16F876A using PIC Kit2. To ensure the sensor works in the
specified range, detailed programming must be taken into consideration since the sensor is sensitive towardsvapor produced by exhalation or water heater. The programming is modified so that the LCD display the
reading will continuously measure by Humidity sensor. There are many reasons for choosing HSM-20G as ourhumidity sensor. In this circuit designed, a diode (IN4007) is use to protect the circuit from wrong polaritysupply. Few capacitors is used to stabilizes the voltage at the output side of the voltage supply from the 9V battery. The LED is a green LED from over current which might burn LED. MCLR, RB6 and RB7 need to beconnected to the USB in circuit programmer to program the PIC microcontroller. At the same time, RB3 need to
be pull down to 0V to disable low voltage programming, because the programmer is using high voltage programming. The PIC16F876A will gather all analogue data senses by the humidity sensor and converted intodigital output and shows through thee LCD. The process is infinity loop operation as according to the programming loaded earlier into the PIC microcontroller [8].
7/18/2019 Design and Development of Low Cost and Portable Microcontroller Based Hygrometer
Fig. 1: Simplified block diagram of the developed system.
III.
Design and Circuit Description
3.1
HSM-20G Humidity Sensor Module
The module of HSM-20G is essential for those applications where the relative humidity can beconverted to standard voltage output. Humidity sensor is device consisting of special plastic material whosecharacteristics change according to the amount of humidity in air. Basically, this sensor senses the amount of
water vapor in air. For this research work, analogue input sensor we used. HSM-20G is essential for theobjectives and applications where the reading in terms of relative humidity was converted into standard voltageoutput. The applications include humidifiers and dehumidifiers, air conditioner, humidity data loggers and
automotive climate control [9, 10]. Table-2 shows the specification of the HSM-20G humidity sensor.
Table-2: The specification of the HSM-20G humidity sensor.
Characteristics HSM-20G
Input voltage range DC 5.0-0.2 V
Output voltage range DC 1.0-3.0 V
Measurement Accuracy 5%RH
Operating current(Maximum) 2mA
Operating RH range 20 to 95%(100%RH intermittent)
Temperature range 0c to 50c
Long term stability(typical drift per year) 1.5%
Time response(63% step change) 1 min
3.2 Low voltage power supply
Microcontroller and other electronic components, which are used in designing humidity monitor,require a dc voltage (+5V). A regulated dc power supply is designed for this purpose. The complete circuit of aregulated dc power supply is shown in Fig-2 using a 7805 IC as a voltage-regulating device. The power supply
is a combination of three sections [11, 12], namely: bridge rectifier, a capacitor filter and IC voltage regulator.
3.1.1 Bridge rectifier: The bridge rectifier converts the step-down transformer‟s secondary ac voltage into
pulsating dc voltage.
3.1.2. Capacitor filter: The pulsating dc voltage is applied to the capacitor filter. This filter circuit reduces the pulsations in the rectifier dc output voltage and the output voltage is 9V.
3.1.3 IC voltage regulator: The IC voltage regulator provides regulated output and C2 is used to improvetransient response. Although voltage regulators can be designed using op-amp, it is quicker and easier to use IC
voltage regulators [13, 14]. In this design a positive fixed voltage regulator L7805 is used. The voltageregulation curve for designed low voltage power supply is shown in Fig-3.
7/18/2019 Design and Development of Low Cost and Portable Microcontroller Based Hygrometer
Fig. 2 Schematic diagram of low voltage regulated power supply
Fig.3 Voltage regulation Curve for Low Voltage Power Supply
3.3
MicrocontrollerA microcontroller is a microcomputer in a single chip. A controller is used to control some process or
aspect of the environment. As the process of miniaturization continued, all of the components needed for acontroller were built right onto one chip. A microcontroller is a highly integrated chip, which includes on onechip, all or most of the parts needed for a controller. The microcontroller could be called a “one-chip-solution”
[15]. In this work, a PIC16F876A microcontroller has been used, which converts the analog voltage into digitaland display the result into 16 X 2 alphanumeric LCD display.
3.3.1 Peripheral Features of PIC16F876A microcontroller
Timer 0: 8-bit timer/counter with 8-bit prescaler
Timer1: 16-bit timer/counter with prescaler,can be incremented during Sleep via external crystal/clock
Timer 2: 8-bit timer/counter with 8-bit period register, prescaler and postscaler
Two Capture, Compare, PWM modules
Capture is 16-bit, max. resolution is 12.5 ns
Compare is 16-bit, max. resolution is 200 ns
PWM max. resolution is 10-bit•
Synchronous Serial Port (SSP) with SPI™(Master mode) and I2C™ (Master/Slave). •
Universal Synchronous Asynchronous Receiver Transmitter (USART/SCI) with 9-bit address detection.
• Parallel Slave Port (PSP) – 8 bits wide with external RD, WR and CS controls (40/44-pin only).
3.3.2 AnalogFeatures of PIC16F876A microcontroller• 10-bit, up to 8-channel Analog-to-Digital Converter (A/D)•
Brown-out Reset (BOR)•
Analog Comparator module with:
Two analog comparators
Programmable on-chip voltage reference(VREF) module
Programmable input multiplexing from device inputs and internal voltage reference
Comparator outputs are externally accessible
7/18/2019 Design and Development of Low Cost and Portable Microcontroller Based Hygrometer
3.3.3 Memory organizationThere are three memory blocks in each of the PIC16F87XA devices. The program memory and data
memory have separate buses so that concurrent access can occur and is detailed in this section. The EEPROMdata memory block is detailed in “Data EEPROM and Flash Program Memory”. Additional information on
device memory may be found in the PIC micro® Mid-Range MCU Family Reference Manual (DS33023).
3.3.4 Analog to digital converter moduleThe Analog-to-Digital (A/D) Converter module has five inputs for the 28-pin devices and
eight for the 40/44-pin devices. The conversion of an analog input signal results in a corresponding 10-bit digitalnumber. The A/D module has high and low-voltage reference input that is software selectable to somecombination of VDD, VSS, RA2 or RA3. The A/D converter has a unique feature of being able to operate whilethe device is in Sleep mode. To operate in Sleep, the A/D clock must be derived from the A/D‟s internal RC
oscillator.
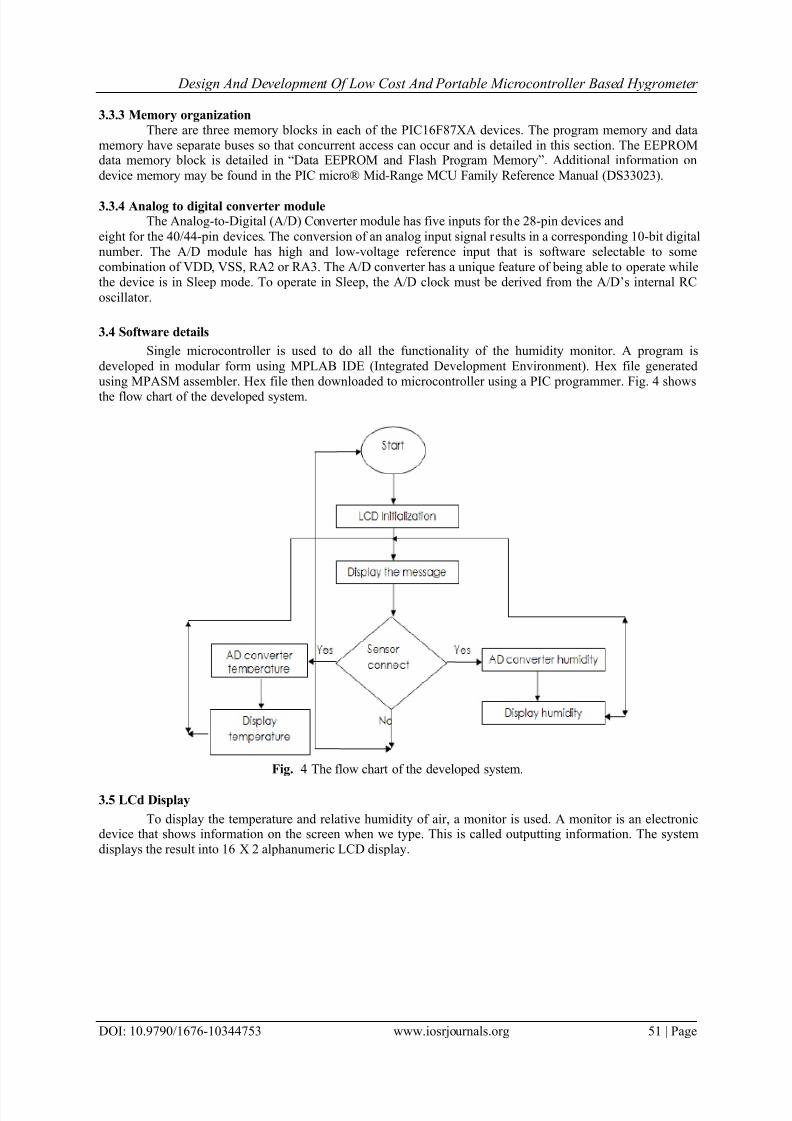
3.4 Software details
Single microcontroller is used to do all the functionality of the humidity monitor. A program is
developed in modular form using MPLAB IDE (Integrated Development Environment). Hex file generatedusing MPASM assembler. Hex file then downloaded to microcontroller using a PIC programmer. Fig. 4 shows
the flow chart of the developed system.
Fig. 4 The flow chart of the developed system.
3.5 LCd Display
To display the temperature and relative humidity of air, a monitor is used. A monitor is an electronicdevice that shows information on the screen when we type. This is called outputting information. The systemdisplays the result into 16 X 2 alphanumeric LCD display.
7/18/2019 Design and Development of Low Cost and Portable Microcontroller Based Hygrometer
3.6 Complete Circuit DiagramFig. 5 represents the schematic diagram of the developed temperature and relative humidity monitoring system.
Fig. 5: The schematic diagram of the developed hygrometer.
IV.
Results and DiscussionThe design of this work was planned in step-by-step and systematic way. At first the whole system was
outlined in a block diagram and then the different parts of the circuits of the block was designed and tested.Finally the whole system of the designed system was developed and following data‟s have been obtained. Table-4 represents the variation of experimental temperature with standard temperature, while Table-5 represents the
variation of experimental relative humidity with standard relative humidity.
Table 4: Comparison of temperature designed meter and temperature of Standardmeter.No of obs. Temperature in designed meter
0C Temperature in Standard meter
0C Error in %
01 26 26.4 1.5
02 27 27 0
03 27 27 0
04 27 27 0
05 27 28 3.5
Table 5: Comparison Of Humidity Of Designed Meter And Humidity Of Standard Meter.
No of obs.Humidity in Designed
meter (RH %)
Humidity in Standard
meter (RH %)Error in
%
01 69 69.5 0.71
02 66 66.1 0.15
03 62 62.5 0.80
04 61 61.7 1.13
05 61 61.3 0.48
7/18/2019 Design and Development of Low Cost and Portable Microcontroller Based Hygrometer