This work is protected by copyright and other intellectual property rights and duplication or sale of all or part is not permitted, except that material may be duplicated by you for research, private study, criticism/review or educational purposes. Electronic or print copies are for your own personal, non- commercial use and shall not be passed to any other individual. No quotation may be published without proper acknowledgement. For any other use, or to quote extensively from the work, permission must be obtained from the copyright holder/s.
Transcript
This work is protected by copyright and other intellectual property rights and duplication or sale of all or part is not permitted, except that material may be duplicated by you for research, private study, criticism/review or educational
purposes. Electronic or print copies are for your own personal, non-commercial use and shall not be passed to any other individual. No quotation may be published without proper acknowledgement. For any other use, or to
quote extensively from the work, permission must be obtained from the copyright holder/s.
Design and fabrication of hydrogel
scaffolds for osteochondral tissue
regeneration
Zaid Muwafaq Younus
Thesis submitted for the degree of Doctor of
Philosophy
June 2019
Keele University
I
Abstract
Osteochondral defects are serious clinical problems relating to damaged articular cartilage
within joints, usually resulting from acute traumatic injury or an underlying bone disorder. A
variety of therapeutic options have been investigated, with several commercial products
addressing this problem, but with limitations in the technology used in terms of biomaterials
and construct presentation. Many of the current devices used to ‘plug’ the osteochondral defect
presents a laminated structure which will interact with bone and cartilage layers within the
damaged site. These devices do not offer reconstruction of normal tissue architecture and may
delaminate in worse cases resulting in pain and repeated surgical intervention.
Advances in biomaterial design and tissue engineering offer promise for the development of
new approaches to direct cell architecture and tissue formation. The current work focuses on
testing the impact of biomaterial chemistry and presentation in 3D, using a poly
(N-isopropylacrylamide) (pNIPAM), and slightly less wettable poly (N-tert-butylacrylamide)
(pNTBAM) to support spatial control of osteogenic and chondrogenic growth. Both materials
were demonstrated as single component hydrogel, and presented in gradient form, in order to
steer attachment of these two cell types.
Both materials were prepared using ion transfer radical polymerization. FTIR spectroscopy
and water droplet angle measurements used to describe main chemical variations and the
wettability profile. Mechanical testing determines materials strength and stiffness, while
scanning electron microscopy (SEM) defines architectural and pore differences. Bio-glass
(BG) fibres were embedded within hydrogels to support mineral environment and aid in
cellular transportation. Histological staining using H&E stain together with confocal imaging
used to configure cell attachment upon each hydrogel. Cell survival was examined using
live/dead staining of hydrogel samples for immortalized cell lines (MG63, OK3H) and
primary cell lines including human osteoblasts (hOBs) and human chondrocytes (hCHs).
II
Osteogenic and chondrogenic potential of cells were investigated with alizarin red staining
and calcium assay. Alcian blue and dimethyl methylene blue were used to assess
glycosaminoglycan (GAG) production. Protein assessment was performed using
immunostaining and ELISA assay for collagens I, and II as a marker for cell function in
addition to collagen X and ELISA quantification of annexin A2 as a markers for
mineralization.
Results indicated more hydrophobic stiffer mass for pNTBAM compared to pNIPAM.
Espinosa & Cooper-White 2017). Many of these materials were capable of supporting
osteogenic cell behaviour and mineralization owing to their porous architecture and surface
features (Karageorgiou & Kaplan 2005; Durante 2012). Promoting chondrogenic behaviour
has been reported using materials with nano surface features or nano-fibres scaffolds (Puppi
et al. 2010a; Izadifar et al. 2012). A hydrophilic versus hydrophobic surface functional groups
is another factor that impacted chondrogenic or osteogenic cell differentiation (Glennon-Alty
et al. 2013; Li et al. 2018). Tailoring of these materials by altering surface chemistry or
incorporating certain cues had impacted cellular functions for instance bio-active glass and
carbon nono-tubes enhanced mineralization and osteogenic cell behaviour (Fu et al. 2011;
Gajendiran et al. 2017)
94
Distilling the above introduction further we aim to fabricate materials for use in 3D culture
systems enabling a sophistication of architecture greater than that achievable with standard
2D culture alone. In doing so, we seek to enable cells to sense their surrounding 3D
environment and to communicate more efficiently. The selected method of biomaterial
production will also impact the manner in which cells interact with the final material shape. It
has been hypothesized that manufacturing of materials into hydrogels would support
appropriate biological function owing to their water content and having a porous structure that
is closely related to that seen in a number of tissues (Hoffman 2012).
In this chapter the basic characteristics of pNIPAM and pNTBAM on cell survival and
behaviour are explored. We hypothesize that the differences between these hydrogels (as
described in Chapter 3) will result in variable cellular responses. This will rely on the type of
cells to be seeded upon tested hydrogels, which in this case will be bone and cartilage cells as
we are aiming at regenerating osteochondral region. The outcome results should enable us to
identify the biological responses of cells and to make judgment upon the best cartilage- and
bone-matched environment based on the previously identified materials properties.
4.2. Chapter aims
The current chapter aims to examine the following
• Cell attachment and distribution on each hydrogel surface.
• Cell survival and proliferation rate for immortal and primary cell lines seeded at the same
density and tracked for 21 days.
• The capability of cells to migrate towards the core of hydrogel connecting this to the porous
structure of each hydrogel.
• Osteogenic and chondrogenic behaviour of primary human osteoblasts (hOBs) and primary
human chondrocytes (hCHs) upon each hydrogel tracked for 21 days.
4.3. Materials and methods
All Materials and Methodology utilised in this Chapter are fully detailed in Chapter 2.
95
Hydrogels were prepared for cell culture by 3 X PBS washes at 37o C for 48 hours each
followed by sterilization with 99% ethanol for 30 minutes at room temperature before being
washed again with PBS for 24 hrs at 37o C with PBS changed every 6-8 hrs (mentioned in
detail in section 2.5 of Chapter 2).
Primary human chondrocytes (hCHs) and human osteoblasts (hOBs) were seeded on the top
of hydrogels at 104 cells /15 µL of cell suspension and topped with either basic or specialized
(osteogenic and chondrogenic) media. Samples were examined after 7, 15, and 21 days for
specific cells responses (mentioned in detail in section 2.5 of Chapter 2).
Confocal assessment of the cell-scaffold system was conducted to verify cell attachment,
viability, and specific protein expression by primary cells. Histological H&E staining of 3D
samples was an aid to confirm that cells had adhered to the hydrogel surface. Settings for
confocal imaging, including laser intensity, brightness and contrast, were adjusted at the same
levels for all hydrogel samples to minimize noise and auto-fluorescence obtained normally
gained due to hydrogel mass (details of confocal imaging are given in Chapter 2 sections 2.6
and 2.7).
Biochemical assessment of calcium minerals and GAGs was carried out via alizarin red and
alcian Blue staining. Images were captured on a EVOS light microscope. Quantitative
measures applied to samples were Calcium and DMMB assays (detailed in chapter 2 section
2.8.1)
Detection of protein and specific markers was quantified with ELISA immune assays
(procedures are mentioned in detail in chapter 2 section 2.8.2).
4.4. Statistics
All data were collected and analysed with Microsoft XL 2010 to calculate the mean, standard
deviation and resulting graphs. Results obtained were compared using one and two-way
ANOVA with Tukey’s multiple comparisons test. Statistics were analysed using Origin Pro
8, the level of significance was set at p≤ 0.05.
96
4.5. Results
4.5.1. Attachment and cell shape
4.5.1.1. Haematoxylin and Eosin (H&E) staining
The depth of the hydrogel samples created difficulties in viewing cells directly on their
surfaces. However, H&E staining revealed apparent cells, which were not present in control
samples, as dark spots on the hydrogel surface (Figure 4-1).
Figure 4-1. Haematoxylin and eosin staining of pNIPAM and pNTBAM hydrogel samples
indicates cell attachment. Images are showing pNIPAM (the top row) and pNTBAM (the
dawn row) both compared between MG63 seeded and control (without cells). Images were
captured at two magnifications (x10 and x60), scale bar measure 100 µm for the x10 images
and 40 µm for the x60.
97
4.5.1.2. Cytoskeletal actin filaments and nuclear stain
Confocal imaging of hydrogels indicated cell attachment to hydrogel surfaces with variable
morphologies as indicated from actin fibre staining. Images also revealed the difference
between the cells are attachment upon each hydrogel.
Figure 4-2. Cytoskeletal fibrin and nuclei staining of MG63 cells seeded on hydrogels at
day 21. Confocal images illustrating pNIPAM (top row) and pNTBAM (down row) hydrogels
in two magnifications (x10 and x60). Both hydrogels were stained with phalloidon ifluor (red)
indicating actin filaments and DAPI (blue) indicating cell nuclei. Scale bar measure 200 µm
for x10 and 50 µm for x60.
Image interpretation suggested that seeding upon pNIPAM tended to result in cell aggregates
or clusters. This was readily evident when images were captured at higher magnifications
indicating groupings of two to ten nuclei per aggregate. In contrast, cells seeded onto
pNTBAM displayed a tendency to distribute evenly across the hydrogel surface (Figure 4-2).
4.5.2. Viability and cell proliferation
Cell seeded hydrogel samples were live/dead stained to determine the prevalence of viable
versus dead cells after 21 days of culture. Cells were seeded at 105 cells/sample, this number
was replicated to all samples and was considered as the starting cell density to judge the rate
of cell proliferation upon each hydrogel. Confirming our previous observations cells on
pNIPAM samples formed aggregates or clusters unlike pNTBAM where cells spread out
98
across the hydrogel surface (Figure 4-3). This scenario was replicated across all monomeric
subgroups indicating hydrogel-specific behaviour. However, there were a significantly high
number of cells counted on pNTBAM vs. pNIPAM hydrogel which was consistent for both
MG63 and OK3H seeded samples (Figure 4-4).
Figure 4-3. Confocal imaging of live /dead stained hydrogels at day 21 seeded with MG63
and OK3H cells. Images are showing green fluorescent colour indicating live cells and red
fluorescent colour indicating dead cells (images columns) for pNIPAM and pNTBAM
hydrogels. Subgroups of multiple monomeric concentrations are represented by images rows
with the top 3 rows set (A) correspond to MG63 cells and the bottom 3 rows (B) are for OK3H
cells. Scale bar measures 500 µm.
99
Figure 4-4. Cell count of live/dead MG63 and OK3H cells seeded on hydrogels at day 21.
Figures are revealing the average number of cells counted per 3 mm2 of hydrogel’s surface.
The light blue colour bars represent the live cells number while the dark red colour bars are
the dead cells number. Each set of bars (live and dead) corresponds to the relevant monomeric
concentration of hydrogel. Both asterisks indicate significance at P ≤0.05, the light asterisk
(*) is for the live cell count and the dark one (*) is for dead cell count comparisons (results
represent the mean ±SD, n=3).
Tracking DAPI stained cells’ nuclei enabled us to determine whether the cells are traveling
towards the core of hydrogel. 3D image sections from confocal microscope were analysed via
ImageJ software to define DAPI fluorescent intensity across hydrogel thickness. A plot was
created to measure the pixel colour intensity of DAPI (blue) through an identified distance
(the depth) in micrometres (µm). The deepest distance at which a higher intensity obtained
was averaged and compared between hydrogel’s sub-groups (Figure 4-5).
0
100
200
300
400
500
600
700
800
0.0
42
g/m
L
0.0
58
g/m
L
0.0
79
g/m
L
0.0
42
g/m
L
0.0
58
g/m
L
0.0
79
g/m
L
Nu
mb
er o
f ce
lls /
1 m
m2
Live Dead OK3H
* *
pNIPAM pNTBAM
0
100
200
300
400
500
600
700
800
0.0
42
g/m
L
0.0
58
g/m
L
0.0
79
g/m
L
0.0
42
g/m
L
0.0
58
g/m
L
0.0
79
g/m
L
Nu
mb
er o
f ce
lls /
1 m
m2
Live Dead MG63
* *
pNTBAM pNIPAM
100
Figure 4-5. The assessment of MG63 cells migration within the hydrogel’s construct at day
21.Figure is showing hydrogels’ monomeric sub-groups arranged in columns and compared
between each other’s according to A, B, C, and D. (A, B) are confocal 3D image sections of
DAPI stained hydrogels illustrating cells (blue) position from hydrogels’ surface, scale bar is
100 µm, where (A) represent side view of sections, (B) 3D configuration of the scanned
sections. (C) Graph presentation of DAPI colour intensity obtained across the depth (distance
in µm) of each hydrogel’s monomeric group. (D) Is a bar figure representing the average
distance travelled by cells from hydrogel surface compared between each hydrogel’s
monomeric sub-groups. Graphs in (B) are created by ImageJ software. Asterisk (*) indicate
significance at P ≤0.05, results representing mean± SD, n=3.
Reviewing the whole set of samples, confocal images of 3D representation of sectioned
sample (Figure 4-5 A) and side view of sample (Figure 4-5 B) have shown how cells are
acting on hydrogels. The cells were obviously slicked to the surface of pNTBAM hydrogels
with all monomeric concentrations. In contrast, penetration was increased towards the lowest
monomeric sub-group of pNIPAM as the cells start infiltrating through surface. The colour
intensity was captured at the highest level only a few micrometres from the surface (averaged
101
15-20 µm) of pNTBAM hydrogel samples. The same result was obtained for pNIPAM 0.079
g/mL sample, however, evidence of higher colour intensity was witnessed at deeper distance
for the 0.058 and 0.042 g/mL monomeric concentrations (Figure 4-5 C). The far distance
measured was for pNIPAM 0.042 g/mL (averaged at 137±15 µm) which was significant (P
≤0.05) compared to the other hydrogels. The pNIPAM 0.058 g/mL has gained as well some
penetration of cells which was significant to the other measurements but less than the 0.042
g/mL sub-type. The pNIPAM 0.079 g/mL and pNTBAM subgroups were all parallel to each
other’s with no significant alteration (Figure 4-5 D). These results were compared with the
pore size measurements for each hydrogel to reflect the impact of porosity on enabling cell
penetration (Figure 4-5 E).
Our previously described compression testing and porosity (Chapter 3) coupled with the
viability and migration data provided crucial information to inform the final working hydrogel
monomeric subtypes suitable for further experimentation. As pNTBAM did not show signs of
cell migration using the lower monomeric concentrations we elected to utilise the higher
concentration subtype (0.079 g/mL). In contrast pNIPAM displayed strong of cell penetration
through the porous structure when using the lower monomeric subtype (0.042 g/mL) without
displaying any loss of mechanical strength vs. other subtypes which supported its selection.
We next confirmed the viability profile of hOBs and hCHs seeded on the chosen hydrogel
subtypes. Confocal images indicated the same growth profile difference between hydrogels as
observed with MG63 and OK3H (Figure 4-6). Similarly, live/dead cell counts were parallel
to previous results noting that significantly greater levels of proliferation were noted for hCHs
when compared to hOBs on pNTBAM. We again noted that pNIPAM displayed reduced cell
numbers when compared to pNTBAM while maintaining cell viability (Figure 4-7).
102
Figure 4-6. Live/dead staining of hydrogels at day 21 indicates viability profile of hOBs and
hCHs. Images showing live cells (green) and dead cells (red) in addition to a combination of
both (merged) represented in columns along figure. Each hydrogel staining profile (live, dead,
and merged) was indicated in rows with top two rows are for hCHs and the down two rows
for hOBs. Scale bar measure 500 µm.
103
Figure 4-7. Live/dead cells counting for primary hOBs and hCHs upon hydrogel constructs.
Figure is illustrating the number of cells counted per 3 mm2 of each hydrogel’s surface. Bars
are corresponding to each hydrogel seeded with specific cell type. Pie charts represent the
percentage of live/dead cells. The light colour corresponds to the number and percentage of
live cells while the dark colour is for the number and percentage of dead cells (reflected in
bars and pie chart figures). Both asterisks indicate significance at P ≤0.05, the light asterisk
(*) is for the live cell count and the dark one (*) is for dead cell count comparisons (results
represent the mean ±SD, n=3).
We wanted to check the chosen polymer concentrations on enabling the primay hOBs and
hCHs to penetrate through the hydrogel’s thickness. Tracking the blue fluorescent from DAPI
staining of these cells has come out with almost the same results as for the tested cell lines
(Figure 4-8). Confocal images are showing hOBs and hCHs cells infiltrating within pNIPAM
hydrogel while accumulating at the surface of pNTBAM hydrogel (Figure 4.8 A and B). The
blue colour intensity was higher at a deeper distance as measured with ImageJ for pNIPAM
hydrogel and indicating that cells and cells clusters are traveling within hydrogel structure. In
contrast, pNTBAM is still showing high colour intensity at the surface (Figure 4-8 C). Cells
0
100
200
300
400
500
600
700
800
pNIPAM hOB pNIPAM hCH pNTBAM hOB pNTBAM hCH
Nu
mb
er o
f ce
lls /
1 m
m2
Live Dead*
*
*
*
76%
24%
79%
21%
85%
15%
78%
22%
104
upon pNIPAM indicated evidence of migration within hydrogel construct at an average
distance of around 133 µm for both hOBs and hCHs which was significant to that obtained
for pNTBAM (Figure 4-8 D).
Figure 4-8. The impact of hydrogel’s internal porous structure on enabling primary hCHs
and hOBs penetration within pNIPAM and pNTBAM. showing pNTBAM and pNIPAM
hydrogels seeded with hCHs and hOBs arranged in columns while rows are (A, B) confocal
3D image sections of DAPI stained hydrogels illustrating cells (blue) position from hydrogels’
surface, scale bar is 100 µm, where (A represent side view of sections, (B) 3D configuration
of the scanned sections. (C) Graph presentation of DAPI colour intensity obtained across the
depth (distance in µm) of each hydrogel for hCHs and hOBs, and (D) a bar figure comparison
of the average distance travelled by cells measured in µm and showing results obtained for
each hydrogel with the corresponding cell type seeded upon surface. Graphs in (B) are
created by ImageJ software. Asterisk (*) indicate significance at P ≤0.05, results representing
mean± SD, n=3.
As per the above results, the number of cells count upon pNIPAM 0.042 g/ml sub-group may
be a little higher as some of the cell were infiltrated beneath the hydrogel surface. The viability
though still showing higher viable versus dead cell number.
105
4.5.3. Biochemical testing of specific cells behaviour
4.5.3.1. Alkaline phosphatase (ALP) activity
ALP activity assessment revealed wide variations between cell type and hydrogel (Figure 4-
9). Increased ALP activity was noted for hOBs, irrespective of hydrogel, relative to control
levels, which became detectable after 15 days of culture. Levels for hOBs indicated significant
increase with time and was significantly altered compared to control (P ≤0.05). The
chondrogenic media did not promote ALP activity in the hCHs with a gradual reduction
observed over time. The higher levels seen with basic media indicated that the chondrogenic
media was having a refractory role on ALP activity levels. For hCHs on pNTBAM samples,
the picture indicated a regression of ALP activity measured in media samples with significant
decline with time seen for samples with chondrogenic media and was significantly lower at
day 21 compared to control samples (Figure 4-9).
Comparing the activity levels of ALP at day 21, including all samples and cell types, have
shown a progress for pNTBAM with hOBs. Samples with hOBs were significantly higher
compared to their control peers of basic media and to that seeded with hCHs. In contrast,
samples with hCHs were significantly lower in ALP activity compared to their control peers
(Figure 4-10).
106
Figure 4-9. Monitoring ALP activity of hOBs and hCHs seeded upon hydrogels. pNIPAM (1), and pNTBAM (2), each with the corresponding
measurements of ALP activity for hCHs and hOBs. ALP activity was expressed in U/mL of media sample tracked for 7, 15, and 21 days. In each
measurement was comparing between samples in osteogenic or chondrogenic media (dark square mark lines) and control sample cultured with basic
media (light diamond mark lines). Asterisks indicate significance at P ≤0.05, the light asterisk (*) is the significance between sample and control at
each time point and the dark one (*) is indicative for significance with time (results represent the mean ±SD, n=3).
-0.001
0
0.001
0.002
0.003
0.004
7 Days 15 Days 21 Days
ALP
act
ivit
y U
/mL
Basic Osteogenic
**
* *
-0.001
0
0.001
0.002
0.003
0.004
7 Days 15 Days 21 Days
ALP
act
ivit
y U
/mL
Basic Osteogenic
**
*
-0.001
0
0.001
0.002
0.003
0.004
7 Days 15 Days 21 Days
ALP
act
ivit
y U
/mL
Basic Chondrogenic
*
**
*
-0.001
0
0.001
0.002
0.003
0.004
7 Days 15 Days 21 Days
ALP
act
ivit
y U
/mL
Basic Chondrogenic
*
*
1
2
hCHs hOBs
107
Figure 4-10. Levels of ALP activity for hCHs and hOBs seeded on pNIPAM and pNTBAM
hydrogels compared at day 21. The levels of ALP activity in U/mL of samples media. Bars are
representing each sample with specific cell type presented with its control (basic media) and
compared to other hydrogel samples. Asterisks indicate significance at P ≤0.05. (Results
represent the mean ±SD, n=3).
4.5.3.2. Alizarin Red and Calcium Ion evaluation
Histological staining of Alizarin Red-stained cell-seeded hydrogels via microscopic image
revealed positive staining on both pNIPAM and pNTBAM samples indicating active mineral
production. This was strongest with hOBs seeded on either hydrogel after 21 days. Samples
seeded with hCHs showed low levels of staining with pNIPAM but no clear staining observed
with pNTBAM (Figure 4-11). Calcium assay results similarly showed higher levels of calcium
ion association with pNTBAM compared to pNIPAM samples seeded with hOB (P ≤0.05).
We also observed significant increases of calcium ion association after 21 days of culture.
Hydrogel samples seeded with hCHs showed some elevation of calcium mineral levels over
time for pNIPAM samples, but these were not significantly increased with pNTBAM
(Figure 4-12).
0
0.001
0.002
0.003
0.004
0.005
ALP
act
ivit
y (
U/m
L)
pNIPAM hCHs pNTBAM hCHs pNIPAM hOBs pNTBAM hOBs
*
*
*
*
108
Figure 4-11. Mineral association illustrated by alizarin staining of hydrogels. Images were
captured at x2 and x10 magnifications and were arranged in columns for each hydrogel.
Images rows correspond to the cell types (hOBs and hCHs) in addition to control hydrogel
(no cells). Images scale bar measure 2 mm for x2 and 200 µm for x10.
Results from calcium assay showed significant calcium ions association with hOBs samples,
more often with pNTBAM samples and significantly higher level (P ≤0.05) with osteogenic
media samples. In contrast, hCHs were at the minimum level of calcium minerals with
pNTBAM hydrogels. However, more tendencies for calcium mineralization were observed
for hCHs in pNIPAM samples with no significant differences between basic or chondrogenic
media samples (Figure 4-12 A).
109
Figure 4-12. Assessment of calcium ions associated with hydrogel samples seeded with
hOBs and hCHs. Figure is illustrating the amount of calcium ions in µg/µL of sample lysate.
(A) is the comparison of levels at different time points (7, 15, 21 days), bars are indicating
each sample set with specific media (osteogenic or chondrogenic) and basic media (control)
and indicated by letters (A-G) defined in the top right list. (B) Is the comparison between
calcium ions associated with hydrogels at day 21. The bars are representing each sample
compared to its control (basic) samples compared at day 21. Asterisks indicate significant
levels at P ≤0.05 (Results are representing mean ±SD, n=3).
Results of calcium ions were then compared between hydrogels at day 21 to observe the main
differences between cells behaviour upon each hydrogel type. A significant increase was noted
for pNTBAM samples with hOBs vs their controls and compared to pNIPAM samples as well.
Levels with pNIPAM were significant to their control and when compared to the hCHs
0
0.5
1
1.5
2
2.5
3
Cal
ciu
m µ
g/µ
l sam
ple
lysa
te
7 Days 15 Days 21 Days
A B C D E F G
A= pNIPAM control no cellsB= pNTBAM control no cellsC= hOB cells on plastic surface (TCP)D= pNIPAM hOBsE= pNTBAM hOBsF= pNIPAM hCHsG= pNTBAM hCHs
*
***
*
*
*
* =P≤0.05
0
0.5
1
1.5
2
2.5
3
Cal
ciu
m io
ns
µg/
µL
sam
ple
lysa
te
pNIPAM hOBs pNTBAM hOBs pNIPAM hCHs pNTBAM hCHs
*
*
*
*
*
A
B
110
samples. Evidence of calcium minerals was noted for pNIPAM with hCHs which was
significant when compared to pNTBAM-hCHs (Figure 4-12 B).
4.5.3.3. Assessment of GAGs
Histological staining with alcian blue and subsequent evaluation via microscopic images was
utilised to evaluate cell response to hydrogel and chondrogenic differentiation. Positive
staining was readily observed with pNTBAM samples seeded with hCHs while hOB-seeded
and control samples showed little evidence (Figure 4-13).
To evaluate GAG levels, we next performed the DMMB assay. This revealed high levels of
GAGs in pNTBAM gels seeded with hCHs. As per the methodology, hydrogel samples where
incubated with 500 µL papain lysate buffer, thus the amount of GAGs was assessed per
500 µL of each sample. GAG levels gradually increased across the 21 days of culture.
Reduced amounts of GAGs were noted for pNIPAM hCHs seeded gels (vs. pNTBAM) which
gradually increased over the culture period (Figure 4-14 A). Notably, GAG levels in pNIPAM
samples were unaltered using either basic or chondrogenic cell culture media. In contract,
pNTBAM samples showed highly increased levels of GAGs when using chondrogenic
medium. The hCHs on TCP samples revealed some increased levels especially with
chondrogenic medium but still significantly lower than cells on hydrogel samples. Samples
with hOBs, included for control purposes, had significantly lower levels of GAGs. This was
to the greatest extent with pNIPAM samples while some increases were seen with pNTBAM.
When comparing the GAGs content between hydrogels with hCHs and hOBs, at day 21, the
results came out with significantly higher levels for hCHs upon pNTBAM hydrogels mostly
when using chondrogenic media (figure 4-14 B).
111
Figure 4-13. Alcian blue staining of hydrogel samples seeded with hCHs and hOBs. Images
were captured at x2 and x10 magnifications for each hydrogel and were arranged in columns
for each hydrogel. Images rows correspond to the cell types (hOBs and hCHs) in addition to
control hydrogel (no cells). Images scale bar measure 2 mm for x2 and 200 µm for x10.
112
Figure 4-14. Assessment of GAGs content in hydrogels seeded with hCHs and hOBs.
Figures are revealing the amount GAGs measured in µg/500 µL where (A) is the comparison
of levels at different time points (7, 15, 21 days), bars are indicating each sample set with
specific media (osteogenic or chondrogenic) and basic media (control) and indicated by
letters (A-G) defined in the top right list. (B) is a comparison between the levels of GAGs in
hydrogels where the bars are representing the hydrogel samples with hCHs and hOBs
compared at day 21. Asterisks indicate significant levels at P ≤0.05 (Results are representing
mean ±SD, n=3)
05
10152025303540
GA
Gs
µg/
50
0 µ
L sa
mp
le ly
sate
7 Days 15 Days 21 Days
A B C D E F G
A= pNIPAM control no cellsB= pNTBAM control no cellsC= hCH cells on plastic surface (TCP)D= pNIPAM hCHsE= pNTBAM hCHsF= pNIPAM hOBsG= pNTBAM hOBs
*
*
** =P≤0.05
05
10152025303540
GA
Gs
µg/
50
0 µ
L sa
mp
le ly
sate
pNIPAM hCHs pNTBAM hCHs pNIPAM hOBs pNTBAM hOBs
*
*
**
* =P≤0.05
A
B
113
4.5.4. Determining collagen expression in cell-seeded hydrogels
4.5.4.1. Immunostaining for collagens I, II, and X
Positive collagen immunostaining was evident across all samples to a variable extent
depending on cell type, hydrogel combination, and differentiation cocktail applied.
Collagen I expression was noted across both hOB and hCH-seeded hydrogel samples with a
qualitatively noted more intense colour expression was noticed with pNIPAM-hOBs samples
(Figure 4-15). Collagen II staining was more specifically-linked to hCH-seeded hydrogels
with strong staining noted with pNTBAM and to a lesser extent pNIPAM. hOB-seeded
hydrogels displayed low levels of collagen II expression in comparison (Figure 4-16).
Collagen X expression was seen with both hOB and hCH seeded on both types of hydrogels.
However, different rate of expression was observed between hydrogels rather than cell type,
with higher extent involving pNIPAM including both cell types. Expression on pNTBAM has
also been obvious with hCHs and hOBs with variable extents. Generally, this had involved
wide range of cells but sometimes looks more intense with pNTBAM (Figure 4-17).
114
Figure 4-15. Immune stained hydrogel samples for collagen I expression. Confocal images
of hydrogel samples with hOBs and hCHs captured using x40 magnifications and revealed in
columns separating channels for DAPI and collagen stain plus a merged channels image.
Samples were stained with DAPI (blue) for cell nuclei and TRITC (red) fluorescent for
collagen. Control samples involve hydrogels seeded with hOBs and incubated with secondary
antibodies coupled with TRITC red fluorescent stain without primary antibodies and DAPI
stained. scale bar measure 40 µm.
115
Figure 4-16. Immune stained hydrogel samples for collagen II expression. Confocal images
of hydrogel samples with hOBs and hCHs captured using x40 magnifications and revealed in
columns separating channels for DAPI and collagen stain plus a merged channels image.
Samples were stained with DAPI (blue) for cell nuclei and TRITC (red) fluorescent for
collagen. Control samples involve hydrogels seeded with hCHs and incubated with secondary
antibodies coupled with TRITC red fluorescent stain without primary antibodies and DAPI
stained. Scale bar measure 40 µm.
116
Figure 4-17. Immune stained hydrogel samples for collagen X expression. Confocal images
for hydrogel samples with hOBs and hCHs captured x40 magnifications and revealed in
columns separating channels for DAPI and collagen stain plus a merged channels image.
Samples were stained with DAPI (blue) for cell nuclei and FITC (green) fluorescent for
collagen. Control samples involve hydrogels seeded with hOBs and incubated with secondary
antibodies coupled with FITC green fluorescent stain without primary antibodies and DAPI
stained. Scale bar measure 40 µm.
117
4.5.4.2. ELISA-based collagen detection
ELISA testing was applied to determine and confirm collagen presence on cell-seeded
hydrogels. Collagen I production was elevated over time with osteogenic media compared to
control. This was observed to the greatest extent with pNTBAM and less so with pNIPAM.
Hydrogels seeded with hCHs displayed less robust collagen I production although some
increases were detected, particularly for pNTBAM (Figure 4-18).
Collagen II levels displayed significant increases over with time with hCHs upon pNTBAM
in the presence of chondrogenic factors compared to basic media samples. However, little
evidence of collagen II production by hCHs on pNIPAM was noted, irrespective of media
system. Similarly, hOB-seeded hydrogels displayed little evidence of meaningful change
irrespective of media/hydrogel pairing (Figure 4-19).
In tracing the levels for Annexin A2, as a marker for cell engagement in mineral activity,
hOBs indicated significant increase with time which was mostly evident with osteogenic
samples and for both hydrogels, although higher for pNTBAM. Lower levels were noticed for
hCHs samples especially with pNTBAM samples which showed less increase with time;
however, a significant increase was seen for pNIPAM samples even with chondrogenic media
samples (Figure 4-20). The measured quantities for all proteins were then compared at day 21
to examine the difference possibly concluded between tested hydrogels. Eventually collagen
I was significantly higher for hOBs seeded upon pNTBAM hydrogel. Levels were
significantly (P ≤0.05) higher using osteogenic media compared to the basic media control
set. (Figure 4-21 A). Collagen II levels were significantly higher for hCHs upon pNTBAM
samples using chondrogenic media and in comparison to other hydrogel samples.
(Figure 4-21 B). Annexin A2 was evidently significant with hOB but with higher level for
pNTBAM samples compared to other samples (Figure 4-21 C).
118
Figure 4-18. Assessment of collagen I on hydrogels seeded with hCHs and hOBs. The amount of collagen I in ng/g of total protein measured in
sample lysate, samples expressed in columns to indicate each cell type and in rows corresponding to each hydrogel where (A) is pNIPAM hydrogel
and (B) is pNTBAM both with hCH and hOB. The amounts were followed in three time points (7, 15, and 21) where the dark square marks line
represents specific media set (osteogenic or chondrogenic) while the light colour diamond marks line is the basic media set (control). Asterisks indicate
significance at P ≤0.05, the light asterisk (*) is the significance between sample and control at each time point and the dark one (*) is indicative for
significance with time (results represent the mean ±SD, n=3).
0
100
200
300
400
500
600
700
7 Days 15 Days 21 Days
Co
llage
n I
(ng/
g o
f to
tal
pro
tein
)
Basic media Osteogenic media
**
*
*
0
100
200
300
400
500
600
700
7 Days 15 Days 21 Days
Co
llage
n I
(ng/
g o
f to
tal
pro
tein
)
Basic media Osteogenic media
**
0
100
200
300
400
500
600
700
7 Days 15 Days 21 Days
Co
llage
n I
(ng/
g o
f to
tal
pro
tein
)
Basic media Chondrogenic media
*
0
100
200
300
400
500
600
700
7 Days 15 Days 21 Days
Co
llage
n I
(ng/
g o
f to
tal
pro
tein
)
Basic media Chondrogenic media
*
hCHs hOBs
A
B
119
Figure 4-19. Assessment of collagen II on hydrogels seeded with hCHs and hOBs. The amount of collagen I in ng/g of total protein measured in
sample lysate, samples expressed in columns to indicate each cell type and in rows corresponding to each hydrogel where (A) is pNIPAM hydrogel
and (B) is pNTBAM both with hCH and hOB. The amounts were followed in three time points (7, 15, and 21) where the dark square marks line
represents specific media set (osteogenic or chondrogenic) while the light colour diamond marks line is the basic media set (control). Asterisks indicate
significance at P ≤0.05, the light asterisk (*) is the significance between sample and control at each time point and the dark one (*) is indicative for
significance with time (results represent the mean ±SD, n=3).
hCHs hOBs
-500
500
1500
2500
3500
7 Days 15 Days 21 DaysCo
llage
n II
(n
g/g
of
tota
l p
rote
in)
Basic media Osteogenic media
-500
500
1500
2500
3500
7 Days 15 Days 21 DaysCo
llage
n II
(n
g/g
of
tota
l p
rote
in)
Basic media Chondrogenic media
-500
500
1500
2500
3500
4500
7 Days 15 Days 21 DaysCo
llage
n II
(n
g/g
of
tota
l p
rote
in)
Basic media Chondrogenic media
*
*
*
*
*
-500
500
1500
2500
3500
7 Days 15 Days 21 DaysCo
llage
n II
(n
g/g
of
tota
l p
rote
in)
Basic media Osteogenic media
* ***
A
B
120
Figure 4-20. Assessment of annexin A2 on hydrogels seeded with hCHs and hOBs. The amount of Annx A2 in ng/g of total protein measured in
sample lysate, samples expressed in columns to indicate each cell type and in rows corresponding to each hydrogel where (A) is pNIPAM hydrogel
and (B) is pNTBAM both with hCH and hOB. The amounts were followed in three time points (7, 15, and 21) where the dark square marks line
represents specific media set (osteogenic or chondrogenic) while the light colour diamond marks line is the basic media set (control). Asterisks indicate
significance at P ≤0.05, the light asterisk (*) is the significance between sample and control at each time point and the dark one (*) is indicative for
significance with time (results represent the mean ±SD, n=3).
0
10000
20000
30000
40000
7 Days 15 Days 21 DaysAn
ne
xin
A2
(n
g/g
of
tota
l pro
tein
)
Basic media Chondrogenic media
0
10000
20000
30000
40000
7 Days 15 Days 21 DaysAn
nex
in A
2 (
ng/
g o
f to
tal p
rote
in)
Basic media Chondrogenic media
0
10000
20000
30000
40000
7 Days 15 Days 21 DaysAn
ne
xin
A2
(n
g/g
of
tota
l pro
tein
)
Basic media Osteogenic media
*
**
0
10000
20000
30000
40000
7 Days 15 Days 21 DaysAn
nex
in A
2 (
ng/
g o
f to
tal p
rote
in)
Basic media Osteogenic media
*
*
*
hCHs hOBs
A
B
121
Figure 4-21. Comparing levels of collagens, I, II and annexin A2 between hydrogels at day
21. Levels are expressed in ng/g of total protein measured in sample lysate for (A) collagen I,
(B) collagen II, and annexin A2. Bars with different colours and patterns are indicating both
hydrogels with either hCH or hOB. Asterisks indicate significant levels at P ≤0.05 (Results
are representing mean ±SD, n=3).
0
100
200
300
400
500
600
700
800
Co
llage
n I
ng/
g o
f to
tal p
rote
in
pNIPAM hCHs pNTBAM hCHs pNIPAM hOBs pNTBAM hOBs
*
*
*
0
500
1000
1500
2000
2500
3000
3500
4000
Co
llage
n I
I ng/
g o
f to
tal p
rote
in
pNIPAM hCHs pNTBAM hCHs pNIPAM hOBs pNTBAM hOBs
*
*
*
*
0
10000
20000
30000
40000
50000
An
ne
xin
A2
ng/
g o
f to
tal p
rote
in
pNIPAM hCHs pNTBAM hCHs pNIPAM hOBs pNTBAM hOBs
*
**
A
B
C
122
4.6. Discussion
An important aspect of material intended for the promotion of tissue regeneration is the ability
to communicate with the biological system including the cells (Williams 2009). In our current
study we have displayed a positive association between cells and materials. H&E and confocal
imaging revealed cell attachment upon hydrogel surfaces which was distinct between
pNIPAM and pNTBAM (Figures 4-1, 4-2). Chemical and architectural differences between
the two materials, as outlined in Chapter 3, clearly impacted cell behaviour and potentially
their capacity for tissue regeneration. For instance, the promotion of aggregate formation on
pNIPAM vs. the cell spreading seen with pNTBAM could provide focus for when targeting
each material towards intended tissue regeneration. Reviews of material properties and their
effects on overall cellular behaviour indicate that materials with intermediate hydrophilic or
hydrophobic characteristics are generally supportive of cell adhesion and attachment
(Bačáková et al. 2004; Lynch et al. 2005). It is also proposed that materials with soft surfaces
promote a round shape, reduced attachment, and reduced proliferation compared to hard
surface materials (Bačáková et al. 2000; Bačáková et al. 2001; Bačáková et al. 2004).
Viability of cells on prospective materials is an important tool in determining material
eligibility and biomimetic, non-toxic characteristics for cells (Tsou et al. 2016; R. Yang et al.
2017). The current study established a higher rate of viable vs. dead cells for all cells involved
on both polymers (Figure 4-3). Cell number counts however indicated a dramatic difference
between pNTBAM and pNIPAM with higher cell numbers evident on pNTBAM (Figure 4-
4). Cells seeded on pNIPAM, although remaining viable at day 21, stayed at or around the
original seeding density. The soft surface features of pNIPAM may not be suitable for the
support of cell proliferation. These results have confirmed the impact of hydrogel chemistry
on different cell shape, growth pattern, and cell number. pNIPAM hydrophilic behaviour has
likely increased the percentage of water content forming a more flexible, soft surface,
promoting growth in clusters without an increase in cell number (Keselowsky et al. 2003;
Bačáková et al. 2004; Tan et al. 2005). The current finding were in agreement with certain
123
studies that indicated the effects of material stiffness on impacting cell shape and proliferation
in addition to cell attachment (Rehfeldt et al. 2007; V Thomas et al. 2017; Basu et al. 2018).
Engler et. al. studied the performance of cells in response to their mechanical
microenvironment. They revealed the importance of stiffness on having a flattened and higher
proliferation rate and viability versus a spherical cell shape and more aggregates using softer
surfaces. This is probably related to alter cell signalling when the cells are sensing their ground
matrix (Engler et al. 2004; Engler et al. 2006)
The ability of cells to migrate within the hydrogel construct is determined by the porosity and
internal architecture of the tested material. Several previous studies have indicated the
importance of interconnected porous structures on guiding cell behaviour. This enables
penetration of cells towards the core of the scaffold optimising signalling communication
throughout (Karageorgiou and Kaplan 2005; Murphy et al. 2010; Sobral et al. 2011; Turnbull
et al. 2018). The current data indicated that pNIPAM (0.042 g/mL) supported cell migration
below the surface region. This was observed with both primary human cells and immortal cell
lines (Figures 4-5, 4-8). In contrast pNTBAM did not support cell penetration, even with the
lower monomeric concentration, which may be due to the smaller average pore size obtained
for pNTBAM versus pNIPAM (Chapter 3). There may also be a correlation to the more
hydrophobic behaviour of pNTBAM. As the production of these hydrogels involves phase
separation, less monomeric concentration is associated with more water being incorporated
between polymer phase when using a hydrophilic polymer like pNIPAM with water solvent.
However, the more water repelling properties presented by pNTBAM in addition to the use
of methanol solvent ultimately promoted more dense mass with less water being enclosed
within polymer part and less interconnected porosity (Mane 2016; Remanan et al. 2018;
Khoryani et al. 2018).
Illustrating the above facts, it can be assumed that pNIPAM 0.042 g/mL may advice for a
higher number of cells compared to the other subgroups. this is possibly attributed to the cells
are being migrated within the hydrogel. The cell number may still lower than pNTBAM
124
relevant to the significantly increased cell population upon pNTBAM sub-groups. However,
this could be an added bonus to the pNIPAM 0.042 g/mL sub-group indicating more eligibility
for hosting vital number of cells in addition to allowing cells migration owing to its porous
structure.
In line with the main goal of creating an osteochondral scaffold, the current work proceeded
to examine primary cells responses to culture upon pNIPAM and pNTBAM hydrogels. The
findings from ALP and mineral association determined that the highest mineral association
was observed from hOBs seeded on pNTBAM, although a progressive increase was obvious
for pNIPAM. This is also noticeable from alizarin staining showing a clearly positive staining
with pNIPAM samples which was more evident with hOBs. Signs of active mineralization
were significantly lower with hCHs upon pNTBAM which again was evident from alizarin
staining (Figures 4-11, 4-12). In contrast, GAG content was highest for hCHs on pNTBAM
which progressively increased with time according to DMMB assay. These preliminary
findings might be an indication of each hydrogel’s possible trend towards supporting specific
cell behaviour (Figure 4-14). It is evident that both hydrogels were able to host mineralization
production with higher tendency for hOBs upon pNTBAM, whereas pNTBAM has supported
hCHs GAGs production to significantly higher degree compared to pNIPAM.
In an attempt to create an osteochondral scaffold, the above results are of importance as we
need to mimic the natural tissue. The region spanning the sub-chondral bone up to the articular
cartilage layers normally hosts a mineral gradient that gradually shifts from bone cells to
hypertrophic chondrocytes at the calcified cartilage layer. This gradient is restricted by the
tidemark junction before the middle cartilage zone where no further mineralization is formed
by cells (Burr 2004; Hoemann et al. 2012b; Pal 2014). The current results might suggest the
validity of these hydrogels to create a scaffold that will host variable mineralization tendencies
from variable cell types (bone and cartilage).
125
Immunostaining coupled with ELISA established that the level of collagen I showed
significant elevation with both hydrogels more specifically with pNTBAM. This was shown
as intense colour expression with immunostaining images (Figure 4-15). Collagen II indicated
higher expression with hCHs on pNTBAM and less with pNIPAM; confirmed by ELISA
which revealed significant levels of collagen II from hCHs on pNTBAM at day 21
(Figures 4-16, 4-21). The normal physiology of bone and cartilage highlights that these tissues
are associated with collagens I and II but to different extents. This is identified normally by
higher collagen I levels in bone which contrasts with cartilage tissues where collagen II is the
major matrix protein. Between these regions the level of matrix proteins will increase or
decrease along the tissue gradient depending on the cell type and the level of mineralization.
This is basically recognized at the calcified cartilage region where hypertrophic chondrocytes
started some increase in collagen II in addition to elevation of collagen X as an indicator of
mineral association activity by cells (Hoemann et al. 2012b; Pal 2014). In locating
mineralization parameters, the expression of collagen X was notably higher with hOBs and
hCHs on pNIPAM compared to pNTBAM (Figure 4-17). This was in line with annexin A2
that showed significant increases with hOBs and hCHs upon pNIPAM compared to pNTBAM
(Figures 4-20, 4-21). Annexins family are group of proteins of which annexin A2 is highly
expressed by hypertrophic chondrocytes and bone cells and is one among 6 proteins of the
same family whom are involved in promoting active matrix mineralization (Kirsch et al. 2000;
Gillette & Nielsen-Preiss 2004; Genetos et al. 2014). In view of the current results, we could
have a possible involvement of hCHs in a calcium mineralization process when seeded upon
pNIPAM which was opposite to their behaviour on pNTBAM that went for a more
chondrogenic activity.
Hydrogel surface chemistry and stiffness therefore have the potential to impact the final cell
behaviour. Studies have shown that increased hydrogel’s stiffness to beyond 33Kpa will
enhance GAGs production by chondrocytes while materials presenting more NH- and OH-
with less CH3- chemical groups are involved in promoting osteogenic cell activity (Wells
126
2008; Wang et al. 2016; Cao et al. 2017b). The present findings might predict our materials
properties as a factor in deciding cell behaviour owing to their different stiffness and variable
percentage of CH3- groups. All these facts might suggest the usefulness of the current
hydrogels in creating a gradient scaffold mass that will support osteogenic and chondrogenic
tissue regeneration at bone-cartilage interface.
4.7. Conclusion
The current results proven the ability of pNIPAM and pNTBAM polymers hydrogel construct
to support cells adhesion to their surfaces. It also indicates good percentage of viable cells,
including primary cell lines, upon their surfaces for up to 21 days. Calcium mineralization
was hosted to a certain degree by both hydrogels, but a high tendency was noted with
pNTBAM. Moreover, pNTBAM revealed higher tendency to promote chondrogenic
behaviour unlike pNIPAM. This might refer to the variable tendencies for pNIPAM and
pNTBAM to promote bone and cartilage cells respectively, and how the distinctive polymers
properties impacted their relevant biological performances. Moreover, this could give a clue
for a possible engagement of both hydrogel to create unique scaffold construct utilizing the
variable behaviours obtained to reconstruct osteochondral region.
127
Chapter 5
Generating 3D (pNIPAM-pNTBAM)
bio-glass enforced gradient scaffold to
regenerate osteochondral region
128
5.1. Introduction
Osteochondral region has a unique structural variation that includes cells and tissues. It ranges
from hard highly mineralised sub-chondral bone to a more flexible cartilage region. Within
this region, a gradual transformation is developed allowing for a mineral and structural
gradient that support the functional integrity of these tissues (Izadifar et al. 2012). Damage to
the osteochondral region eliminates the consistency of this structure causing serious functional
disabilities that demand medical intervention. Variable treatment strategies basically depend
on the inflammatory response and cellular ability to regenerate damaged tissues, showed some
positive results, however with certain limitations.
Tissue engineering approaches principally use an ECM substitute that will act as a template
to support cells’ growth and differentiation. A surplus range of materials with tissue-specific
features may support this goal by promoting cells’ specific functions to regenerate damaged
tissues. The complex multi-structure of the osteochondral region may require a combination
of two or more biomaterials in order to mimic the natural tissue construct. Studies have shown
some progress by joining materials together to create a multi (bi- or tri-phasic) scaffold to
guide the regeneration of certain tissues including the osteochondral region. However, the
main challenge is the combining of these materials together into one unit; many have used
protein glue to attach scaffold’s layers producing an integral multi-layered construct.
Problems from de-mixing or delamination were still existed and challenging such scaffold
production.
This Chapter focuses on testing the possibility of joining pNIPAM and pNTBAM hydrogels,
to produce a 3D gradient scaffold with multi-architectural features. As both hydrogels are
produced using the same technique, we will make use of this feature to generate the gradient
scaffold in a single manufacturing operation. The process of polymer elongation and cross-
linking will be the bonding step to join these materials and at the same time generating gradient
region while moving From one polymer to the other. The resultant scaffold construct will be
tested furtherly regarding cells behaviour by focusing on the gradient interface region.
129
In an attempt to promote optimum cell performance across the proposed scaffold construct,
bioactive glass (BG) fibres were introduced by vertically embedding them through the
scaffolds mass. The BG material is a known osteoconductive mass that will support further
mineralization and encourage osteogenic behaviour of cells (Hench 1996; Jones 2015).
Several types of BG materials were existed and applied for biomedical researches. The current
BG fibres are the phosphate based glass which their main constituents (calcium and
phosphate) are extremely important for bone mineralization once they degrade to release these
minerals (Hench 2006b; Hossain et al. 2018). The use of these fibres will aid the design of the
current scaffold in two dimensions; they will leave empty channels after degradation allowing
for cells migration; they will promote mineralization of this region enhancing bone cells
function and promoting calcification of chondrocytes with the hope for matching the calcified
cartilage region. These will be tested accordingly to assess the impact of BG fibres on cells
behaviour.
5.2. Chapter aims
The current Chapter aims for the followings
• Testing the possibility of joining pNIPAM and pNTBAM to generate a gradient scaffold
construct with further characterization.
• Embedding biodegradable glass fibres (BG) within scaffolds construct with evaluation of their
degradation profile.
• Biological assessment of osteogenic and chondrogenic cell behaviour across gradient scaffold
surface.
• Determining the impact of BG fibres on the resultant osteogenic and chondrogenic
performances of cells compared to the non-BG samples.
5.3. Materials and methods
A detailed methodology for the current Chapter experiments is mentioned in Chapter 2.
130
5.3.1. Generating gradient scaffold
The same synthesis procedure used for single hydrogel production was applied to obtain the
gradient hydrogel scaffold. The two main characteristics that differentiate between these
polymers in terms of synthesis are the type of solvent and the timing required for hydrogel
formation. These differences were used as a base to prepare gradient scaffold. Both polymers
solutions were prepared individually; pNIPAM polymer solution was added to the container
at the beginning and initiated for polymerization using TMED. After 40 seconds (enough time
for the polymerization to start) pNIPAM-pNTBAM mixture was added followed by adding
pNTBAM solution exactly after 1 minute. The timing was critical for obtaining the final
scaffold construct. Samples were sealed with a cover and left overnight at room temperature
for complete hardening (Chapter 2 section 2.2.3).
5.3.2. Characterisation of gradient scaffold regions
To identify regional differences across the resultant scaffold mass, an FTIR spectrum was
taken. Gradient scaffold was sliced into pieces and scanned for spectral gradual change from
the top to the bottom of the entire mass (Chapter 2 section 2.4.1.2). SEM imaging was
performed as well to architectural differences across gradient regions (Chapter 2 section 2.4.4)
5.3.3. The inclusion of bioactive glass (BG) fibres
A 3D printed model was proposed as a mould to hold the BG fibres in a vertical direction. The
mould was designed to host 16 fibres per sample evenly spaced throughout the base. Mould
dimensions were 15 mm diameter x 10 mm thickness and fitted with a cylindrical plastic
container. The polymer solution was prepared normally and cast over the mould; the whole
unit was then sealed with a cap and stored at room temperature. The degradation pattern for
BG fibres mass was tracked using a Raman microscope and micro CT scan (Chapter 2 section
2.3)
131
5.3.4. Biological assessment of gradient and BG enforced scaffolds
All complex scaffold structures (including combined polymers and BG enforced) were
inspected to monitor cells behaviour upon their surfaces. Samples generally were washed
several times with PBS at 37 °C before cell culturing upon their surfaces. Gradients samples
were sliced vertically into 2 halves and cells were seeded upon the surface of section basically
to the middle zone where polymer gradient is located. Alizarin red and alcian blue staining
were applied to observe mineral and GAGs distribution over gradient hydrogel surface.
Samples were tested furtherly for evidence of cell functional protein association including
immunostaining and ELISA testing. Samples with BG fibres followed the same washing steps
before cell culture, cells were seeded to the top of hydrogels. These samples were compared
with the previously tested BG free hydrogels including gradients to verify the impact of BG
fibres on cell overall behaviour (Chapter 2 sections 2.5.7, 2.7).
5.4. Statistics
All data were collected and analysed with Microsoft XL 2010 to calculate the mean, standard
deviation and resulting graphs. Results obtained were compared using one and two-way
ANOVA with Tukey’s multiple comparisons test. Statistics were analysed using Origin Pro
8, the level of significance was set at P ≤ 0.05.
5.5. Results
5.5.1. Gradient hydrogel architectural properties
The resultant scaffold appearance revealed the gradual change from one end to another,
basically showing predominant white colour mass from pNTBAM layer with gradual
transformation into transparent shape towards pNIPAM end layer (Figure 5-1 A).
The SEM imaging of three scaffold’s compartments showed relatively parallel architectural
features to the original hydrogels (Figure 5-1 B). This was mostly notable at both ends of the
scaffold that corresponds to pNIPAM and pNTBAM. The interface region though showed
variable pore shape and size, but mostly more dense, flake-like polymer aggregates.
132
The FTIR scan though revealed progressive change from one side of scaffold to the other one
detected by tracking the specific bands regions of spectra for each polymer at around
1200 cm⁻1 of FTIR spectra (two bands at 1131 cm⁻1 and 1171 cm⁻1 for pNIPAM and one big
band 1224 cm⁻1 for pNTBAM). The interface region spectra reveal the interference between
the two polymers with gradual spectral peak reduction as moving from pNTBAM to pNIPAM
area (Figure 5-1 C).
Figure 5-1. Characterisation and physical appearance of gradient hydrogel scaffold. (A)
Showing scaffold general appearance, arrows indicating the range of each polymer regions.
(B) SEM imaging showing architectural variations between scaffold compartments where
pNTBAM at the top and pNIPAM at the bottom layer and in between a mixed layer of the two
polymers. (C) The FTIR spectra of several regions across the length of gradient scaffold
starting from pNTBAM layer towards pNIPAM layer, the region marked with red rectangle
corresponds to the finger print region specific for each polymer where the elevated peak from
133
pNTBAM gradually transformed into two small peaks at the pNIPAM region. yellow dotted
marked region represents the mixed polymer regions and peaks transformation.
5.5.2. Bio-glass (BG) mass evaluation
5.5.2.1. Raman microscopy
Raman mapping of hydrogel surface, where BG fibres included, enables us to identify the
relevant regions of these components as a heat map. Raman spectra of pNIPAM-BG scaffold
show the BG and hydrogel’s spectral region indicating high peak elevation for the BG mass
at 700 cm⁻1 and 1150 cm⁻1 (Figure 5-2 A). The pNIPAM spectrum corresponds to the CH-
and NH- stretching bands at the higher Raman shift area (2800-3000 cm⁻1). The BG spectral
regions equivalent to to the P=O stretching bands at 1100-1170 cm⁻1 and P=O bending at 500-
700 cm⁻1. Mapping of sample surface, focusing on the BG region at 1150 cm⁻1, generates a
heat map that illustrates the Raman intensity of the BG band at this region (P=O stretch bands).
The heat map comprises coloured areas indicative to the components peaks where the red
reflects the higher Raman intensity (in this case the BG) down to the lowest intensity
represented by blue. Tracking the BG fibre with time showed expanding of the green zone
region across days 7 to 15 while shrinking of the red zone which reflects blending of these
elements with hydrogel. The principal component analysis (PCA) of Raman enables the direct
comparison of peaks within a number of ranges, in this case between 2800 and 3000 cm⁻1
(corresponding to the hydrogel) and 1100-1200 cm⁻1 (to illustrate the BG fibre band).
The starting point clearly shows that where there is BG present there is not hydrogel and vice
versa. From day 7 the distinction between BG and hydrogel becomes less apparent. Further
noticeably at day 15, where the correlation between the two peaks is unclear, indicating the
diffusion and thus interaction of the ions with pNIPAM as a function of time. The heat maps
illustrate the shrinking of the area where there is fibre as it degrades (Figure 5-2 B).
134
Figure 5-2. Raman mapping of BG mass embedded in hydrogel. The figure is showing (A)
spectral regions of pNIPAM and BG located in different regions, (B) heat map of sample
surface focusing on single BG fibre at 1200 cm⁻1 revealing the BG mass (red core), the green
zone spreading at days 7, and 15 is indicating BG mass disintegration with time, analysis
using PCA indicated mass shrinking from day 7 to 15.
5.5.2.2. Micro computed tomography (µCT)
The use of µCT enables us to recognize the degradation of BG fibres within hydrogels by
detecting the different densities between the hydrogel and BG fibres. As per the µCT, the
hydrogel-BG composite was analysed to show the dense BG mass (brown colour) in
transparent mass of hydrogel. The dense fibre mass was clearly fading with time reaching up
to 28 days of incubation in PBS at 37 °C (Figure 5-3 A). The condition was almost the same
for both hydrogels as both showed quite similar mass density. Density values assessed by the
µCT, was plotted against time to reveal the BG mass reduction. the BG mass ratio was
135
evaluated in percentage of BG per the total volume of sample. results showed the reduction of
BG fibres mass volume with time reaching the lowest level at day 28 (Figure 5-3 B).
Figure 5-3. µCT scanning of hydrogel embedded BG mass for pNIPAM and pNTBAM. A)
Images are showing BG mass (brown colour) threaded within hydrogels (transparent) using
µCT scanned with time (7, 15, 21, and 28 days). Images scale bar at 2 mm. B) BG fibres
percentage of density reduction tracked with time up to day 28 compared to hydrogel density.
5.5.2.3. Alizarin red stain as an evidence of BG degradation
hydrogel samples with BG fibres were assessed to locate BG fibres openings and evidence of
mineral traces by staining with alizarin red. samples were stained after being incubated with
PBS at 37 °C for 28 days. images from alizarin red stained sample revealed signs of BG
0
10
20
30
40
50
60
70
80
90
100
Day 0 Day 7 Day 15 Day 21 Day 28
De
nsi
ty p
erc
en
tage
%
BG fibres pNIPAM pNTBAM
A
B
136
channels appeared as a red stained mark on the top of hydrogels. pNIPAM-BG samples though
were easier to illustrate the BG channels when viewed microscopically, as it is transparent.
alizarin staining showed the linings of the BG channels and most of the core stained red
reflecting a diffused zone of redness surrounding the BG channel (Figure 5-4).
Figure 5-4. BG embedded hydrogels incubated with PBS at 37 °C and stained with alizarin
red at day 21. pNIPAM and pNTBAM hydrogels imaged at two magnifications (x2, and x10)
showing the magnitude of staining for BG fibres and their degradation elements for both
hydrogels. Scale bar measure 2 mm for x2 and 300 µm for x10 images.
5.5.3. Biological assessment of gradient scaffold
5.5.3.1. Quantification of minerals and GAGs
Staining of gradient scaffold sections showed the arrangements of minerals and GAGs across
the gradient area corresponding to each cell type. Alizarin stained hOBs samples obviously
pointed out the prevalence of red stained calcium minerals throughout the surface
(Figure 5-5). An increased minerals level towards pNIPAM region was noticeable by the
slightly enhanced redness. Gradient samples with hCHs obviously showed less alizarin red
137
staining for the whole sample surface, however, with evidence of calcium minerals association
observed at the interface region.
GAG contents, according to alcian blue stain, revealed fewer amounts associated with hOBs
samples mostly close to control samples. An enormous staining was clear with hCHs samples
towards pNTBAM region which seems to be opposed at the junction before pNIPAM side.
Quantifying calcium ions over 21 days of cell culture has shown significantly increased levels
with time when tracking hOBs samples mostly with osteogenic media which also was
significant compared to basic media samples (Figure 5-6 A). These results were obviously
significantly higher than samples with hCHs seeded at the same cells density. Gradient
samples with hCHs were not significantly different between basic and chondrogenic media
sample sets.
Figure 5-5. Alizarin and alcian blue stained gradient hydrogel sections seeded with hOBs
and hCHs. Images are illustrating gradients samples captured at two magnifications (x2) for
the whole sample and (x10) for the interface region (marked red square). Images rows are
referring to each cell type in addition to control samples at the bottom. The far right up-down
arrow key-figures are indicative for the scaffold’s regions between pNIPAM and pNTBAM for
images row. Scale bar measure 2 mm for the x2 and 300 µm for the x10 images.
138
Figure 5-6. Quantifying calcium ions and GAGs contents upon gradient hydrogels. (A)
Calcium ions in µg/µL of sample lysate, (B) the amount of GAGs in µg/500µL of sample
lysate. The top bar figures are comparing all samples with hOBs and hCHs for the levels of
calcium ions and GAGs, the bottom figures are the relevant monitoring of these levels per
each cell type compared to their control. Asterisks indicate significance at P ≤0.05, for the
bottom figures the light asterisk (*) is the significance between sample and control at each
time point and the dark one (*) is indicative for significance with time (results represent the
mean ±SD, n=3).
0
0.5
1
1.5
2
2.5
3
Basic Chondrogenic Basic Osteogenic
Cal
ciu
m io
ns
µg/
µL
sam
ple
ly
sate
7 Days 15 Days 21 Days
*
*
*
* =P≤0.05
0
0.5
1
1.5
2
2.5
7 Days 15 Days 21 Days
Cal
ciu
m io
ns
µg/
µL
sam
ple
ly
sate
Basic osteogenic
*
***
hOBs
0
0.5
1
1.5
2
2.5
7 Days 15 Days 21 Days
Cal
ciu
m io
ns
µg/
µL
sam
ple
ly
sate
Basic Chondrogenic
hCHs
0
5
10
15
20
25
30
Basic Chondrogenic Basic Osteogenic
GA
Gs
µg/
50
0 µ
L sa
mp
le o
f av
erag
e ce
ll n
um
ber
7 Days 15 Days 21 Days
*
*
*
*
* =P≤0.05
*
0
5
10
15
20
25
30
7 Days 15 Days 21 DaysGA
Gs
µg/
50
0 µ
L sa
mp
le ly
sate
Basic Osteogenic
**
hOBs
0
5
10
15
20
25
30
7 Days 15 Days 21 DaysGA
Gs
µg/
500
µL
sam
ple
lysa
te
Basic Chondrogenic
***
hCHs
A B
139
DMMB assay clearly revealed higher GAGs associated with gradient sample seeded with
hCHs (Figure 5-6 B). The levels were significantly higher with chondrogenic media compared
to basic media control samples and compared to other samples seeded with hOBs. Monitoring
GAGs amounts with time showed a progressive increase with time up to day 21 for all tested
samples including hOBs samples.
5.5.3.2. Immune staining for collagens I, II, and X
Images from immune-stained samples showed the expression of collagen I and II relevant to
each cell type in addition to collagen X (Figure 5-7). Red fluorescent level indicated intense
colour for collagen I in hOBs samples. Some staining was seen for hCHs which might be
higher when compared to the same cells upon original hydrogels (Chapter 4, Figure 4-15).
Expression for collagen II revealed less strength for hOBs and medium to low stages for hCHs
which is lower when compared to the previous imaging for individual hydrogels (Chapter 4,
Figure 4-16). The green fluorescent (FITC), indicative for collagen X, revealed higher
expression for both cell types observed at the middle zone of gradient samples. The fluorescent
level seems to be evenly expressed for hOBs and hCHs with a bit more intensity for hOBs.
140
Figure 5-7. Immune-stained gradients samples seeded with hOBs and hCHs for collagens
I, II, and X. Confocal images are explained in columns for the magnifications x40 showing
collagens expressions and cells nuclei plus a merged x40. Images rows are corresponding to
collagen types each with particular cell type. Controls are samples with hOBs and hCHs
incubated with secondary antibodies marked with TRITC (red) and FITC (green) without
primary antibodies. Images scale bar measure 40µm for the x40 and 200µm for the x10
images (Images were captured using Olympus U-TBI90 laser fluorescent confocal
microscope).
141
5.5.3.3. ELISA immune assay
Monitoring of collagen I level exposed a progressive significant increase with hOBs samples
using osteogenic media. Levels were apparently shifted to a greater value after day 15. Results,
however, were not significant using basic media with variable measures reaching day 21
(Figure 5-8 A). Some elevations in collagen I was recorded for hCHs gradient samples which
was not significantly altered, neither by day 21 nor between basic or chondrogenic media sets.
When compared at day 21, hOBs using osteogenic media clearly indicated significantly higher
levels compared to hCHs samples or other basic media samples.
Collagen II levels were very low at day 7 that barely can be recognized with both cell types.
However, gradient samples with hCHs evoked a significant increase from day 15 which was
parallel in terms of basic or chondrogenic media at this point. Levels with chondrogenic media
though were recorded to be significantly higher than basic control samples reaching day 21 of
culturing (Figure 5-8 B). Gradient hydrogels with hOBs had also shown significant (P ≤0.05)
elevation using osteogenic media which were plateaued after day 15 towards day 21, this was
significant compared to basic media sample set. When reviewing the whole results set at day
21, hCHs samples with chondrogenic media showed a significant amount comparing to the
other basic or hOBs samples.
Gradient samples with hOBs and hCHs revealed significantly increased annexin A2 levels
with time which might refer to increased mineral layout activity. Amounts were significantly
shifted to higher level with hOBs osteogenic media set compared to basic media
(Figure 5-8 C). The situation with hCHs indicated parallel increase with time for both
chondrogenic and basic media sample set with no significant difference. The final comparison
revealed significant amounts for hOBs samples compared to hCHs and controls at day 21.
142
Figure 5-8. Quantifying collagens I, II and annexin A2 on gradient hydrogels seeded with hOBs and hCHs. Figures rows represent each marker
level (1) collagen I, (2) collagen II, and (3) annexin A2. Figure columns are revealing marker level monitored with time for (A) hCHs and (B) hOBs
respectively with the final comparison of levels at day 21(C) illustrated in the right side column bar figure. Each marker quantified in ng/g of total
protein measured in sample lysate. Asterisks indicate significance at P≤0.05, for the time monitoring figures the light asterisk (*) is the significance
between sample and control at each time point and the dark one (*) is indicative for significance with time (results represent the mean ±SD, n=3).
-100
100
300
500
7 Days 15 Days 21 Days
Co
llage
n I
(ng/
g o
f to
tal
pro
tein
)
Basic Chondrogenic
* =P≤0.05
-100
100
300
500
7 Days 15 Days 21 Days
Co
llage
n I
(ng/
g o
f to
tal
pro
tein
)
Basic Osteogenic
*
* =P≤0.05
*
-100
100
300
500
Basic Chondrogenic Basic Osteogenic
Co
llage
n I
(ng/
g o
f to
tal
pro
tein
)
hCHs hOBs*
*
* =P≤0.05
-1000
0
1000
2000
7 Days 15 Days 21 Days
Co
llage
n II
(n
g/g
of
tota
l p
rote
in)
Basic Osteogenic
**
**
0
1000
2000
Basic Chondrogenic Basic OsteogenicCo
llage
n II
(n
g/g
of
tota
l p
rote
in)
hCHs hOBS
*
**
-1000
0
1000
2000
7 Days 15 Days 21 Days
Co
llage
n II
(n
g/g
of
tota
l p
rote
in)
Basic Chondrogenic
**
*
*
-5000
0
5000
10000
15000
7 Days 15 Days 21 DaysAn
nex
in A
2 (n
g/g
of
tota
l pro
tein
)
Basic Osteogenic
*
**
*
-5000
0
5000
10000
15000
7 Days 15 Days 21 Days
An
nex
in A
2 (n
g/g
of
tota
l pro
tein
)
Basic Chondrogenic
***
1
2
A B C
0
5000
10000
15000
Basic Chondrogenic Basic Osteogenic
An
nex
in A
2 (n
g/g
of
tota
l pro
tein
)
hCHs hOBs
**3
143
5.5.4. BG embedded scaffold assessment
5.5.4.1. Assessment of cells travelling through BG fibres channels
3D images from confocal microscope showed cells (DAPI stained MG63 cells) gathering into
BG fibre location with little evidence of infiltration through these channels for both pNIPAM
and pNTBAM hydrogels. Cells may appear forming clusters or accumulates at the openings
of these channels. pNIPAM samples also shows cells migration within porous structure
(mentioned in Chapter 4) surrounding BG fibres region. This was in contrast to pNTBAM
where cells set on the surface while some are clustering trying to migrate through BG openings
(Figure 5-9).
Figure 5-9. Assessment of MG63 travelling through degraded BG fibres channels of pNTBAM
and pNIPAM hydrogels. Confocal 3D image sections for pNIPAM and pNTBAM showing DAPI
stained MG63 cells (blue) to the surface of hydrogels and accumulating around BG fibre
and in line with that measured for non-BG samples when monitored with time (Figure 5-
13 A). The final comparison at day 21 showed no significantly altered results relevant to
introducing BG fibres (Figure 5-13 B).
Figure 5-12. Assessment of calcium ions in BG and non-BG gradient scaffolds seeded with
hOBs and hCHs. (A) Calcium ions level monitored with time for each cell type compared
between BG and non-BG samples, (B) comparing all samples for the level of calcium ions at
day 21. Asterisks indicate significant levels at P ≤0.05 (Results are representing mean ±SD,
n=3).
0
0.5
1
1.5
2
2.5
3
7 Days 15 Days 21 Days
Cal
ciu
m µ
g/µ
l sam
ple
lysa
te
hCHs hCHs-BG
hCHs
* =P≤0.05
0
0.5
1
1.5
2
2.5
3
7 Days 15 Days 21 Days
Cal
ciu
m µ
g/µ
l sam
ple
lysa
te
hOBs hOBs-BG
hOBs
* =P≤0.05 **
*
A
0
0.5
1
1.5
2
2.5
3
hCHs hCHs-BG hOBs hOBs-BG
Cal
ciu
m µ
g/µ
l sam
ple
ly
sate
Gradient-hCHs Gradient-hOBs **
* =P≤0.05B
148
Figure 5-13. The amount of GAGs in BG vs non-BG gradient scaffolds. (A) GAG contents
monitored with time for each cell type compared between BG and non-BG samples, (B) the
levels of GAG compared between all samples at day 21. Asterisks indicate significant levels
at P ≤0.05 (Results are representing mean ±SD, n=3)
5.5.4.3. ELISA detection of proteins for BG scaffolds
Results according to ELISA revealed the effects of embedding BG fibres within hydrogels
construct on the relevant cells’ activity. Collagen I showed an advanced level in pNIPAM-BG
samples seeded with hOBs compared to the non-BG samples. Results reported significant
amounts with time up to day 21, but a further increase was obvious in BG samples
(Figure 5-14 A). The pNTBAM-BG samples seeded with hOBs had also indicated a
significant increase of collagen I with time. The BG samples measured significantly higher
0
5
10
15
20
25
30
7 Days 15 Days 21 Days
GA
Gs
µg/
50
0 µ
L sa
mp
le
lysa
te
hCHs hCHs-BG
hCH
* =P≤0.05
*
*
0
5
10
15
20
25
30
7 Days 15 Days 21 Days
GA
Gs
µg/
50
0 µ
L sa
mp
le
lysa
te
hOBs hOBs-BG
hOBs
* =P≤0.05
*
0
5
10
15
20
25
30
hCHs hCHs-BG hOBs hOBs-BG
GA
Gs
µg/
50
0 µ
L sa
mp
le ly
sate
Gradient-hCHs Gradient-hOBs
*
* =P≤0.05
A
B
149
levels at day 7 reaching to day 15, but thereafter continue to rise to be in line with the non-BG
samples reporting around the same level at day 21 (Figure 5-14 B). The pNIPAM-BG samples
with hCHs have a little increase with time as previously monitored for non-BG samples,
though some elevation was observed at day 7 and 15 which then returned to be in line with
the non-BG samples at day 21. The pNTBAM-hCHs samples seem to present around equal
levels of collagen I for both the BG and non-BG samples, even though, fewer amounts were
noticed in general for BG samples.
In monitoring collagen II levels, non-significantly altered measures between BG and non-BG
samples were observed for pNIPAM samples seeded with hCHs (Figure 5-15 A). The situation
with pNTBAM-hCHs carried significant variation between BG and non-BG samples
manifested by extremely lowered collagen II levels compared to the non-BG. The levels
actually have significant elevation with time, but the amounts of collagen II retreated to be
less since day 7 and reaching day 21 (Figure 5-15 B). Hydrogel samples with hOBs had only
little elevation of collagen II manifested for pNIPAM and pNTBAM. Levels for BG samples
were in line with the non-BG samples with only some increase over the non-BG samples
observed with pNIPAM. Such increase was significant at some points notably from day 15-
21. The pNTBAM-BG samples were not significantly altered from the non-BG ones and were
fluctuated around the same levels.
Results of measuring annexin A2 clearly showed significant elevation with BG samples
relevant to non-BG. Altered levels were mostly obvious with hCHs weather pNIPAM
(Figure 5-16 A) or pNTBAM (Figure 5-16 B), these were notably started progressive
elevation away from non-BG samples since day 7. Samples with hOBs have shown overall
significantly higher levels for pNTBAM-BG compared to non-BG at all time points. The
pNIPAM-BG samples though had a significant increase at the early time points, it went to be
close to the level of non-BG samples.
150
Comparing results between BG and non-BG hydrogel samples at day 21, revealed the
variation between cells’ activities upon each specific hydrogel type and the impact of
embedding BG fibres to their construct. BG fibres obviously impacted a significant increase
in collagen I level for hOBs with pNIPAM-BG compared to non-BG but no significant
difference between pNTBAM-BG and non-BG. Other hydrogel samples indicated non-
significant variation of collagen I for BG introduction with hOBs or hCHs, lower level was
recorded to pNTBAM-hCHs (Figure 5-17 A). Collagen II has significantly lower value with
pNTBAM-BG samples of hCHs. Significantly increased level, however, were reported with
pNIPAM-BG samples weather hOBs or hCHs (Figure 5-17 B). Annexin A2 values had
significantly (P ≤0.05) elevated with pNIPAM-BG and pNTBAM-BG samples seeded with
hCHs. These value also witnessed significant elevation with hOBs upon pNTBAM-BG, but
still with no significant (P >0.05) variation revealed with hOBs on pNIPAM-BG samples
(Figure 5-17 C).
151
Figure 5-14. Comparing collagen I level measured in BG versus non-BG hydrogels seeded with hOBs and hCHs. The level of collagen I in ng/g of
total protein measured in sample lysate. The figures are arranged in columns indicating each cell type (hCHs and hOBs) and in rows representing
each hydrogel type where (A) is pNIPAM and (B) is pNTBAM. Each comparison was held between BG (red square marks line) and non-BG (blue
diamond marks line) samples monitored with time. Asterisks indicate significance at P ≤0.05, the light asterisk (*) is the significance between sample
and control at each time point and the dark one (*) is indicative for significance with time (results represent the mean ±SD, n=3).
-100
100
300
500
700
7 Days 15 Days 21 DaysCo
llage
n I
ng/
g o
f to
tal
pro
tein
pNIPAM pNIPAM-BG
**
*
-100
100
300
500
700
7 Days 15 Days 21 DaysCo
llage
n I
ng/
g o
f to
tal
pro
tein
pNTBAM pNTBAM-BG
* **
-100
100
300
500
700
7 Days 15 Days 21 DaysCo
llage
n I
ng/
g o
f to
tal
pro
tein
pNIPAM pNIPAM-BG
-100
100
300
500
700
7 Days 15 Days 21 DaysCo
llage
n I
ng/
g o
f to
tal
pro
tein
pNTBAM pNTBAM-BG
*
hCHs hOBs
A
B
152
Figure 5-15. Comparing collagen II levels measured in BG versus non-BG hydrogels seeded with hOBs and hCHs. The level of collagen II in ng/g
of total protein measured in sample lysate. The figures are arranged in columns indicating each cell type (hCHs and hOBs) and in rows representing
each hydrogel type where (A) is pNIPAM and (B) is pNTBAM. Each comparison was held between BG (red square marks line) and non-BG (blue
diamond marks line) samples monitored with time. Asterisks indicate significance at P ≤0.05, the light asterisk (*) is the significance between sample
and control at each time point and the dark one (*) is indicative for significance with time (results represent the mean ±SD, n=3).
-500
500
1500
2500
3500
7 Days 15 Days 21 DaysCo
llage
n I
I ng/
g o
f to
tal
pro
tein
pNIPAM pNIPAM-BG
-500
500
1500
2500
3500
7 Days 15 Days 21 DaysCo
llage
n I
I ng/
g o
f to
tal
pro
tein
pNIPAM pNIPAM-BG
*
A
hCHs hOBs
-500
500
1500
2500
3500
7 Days 15 Days 21 DaysCo
llage
n I
I ng/
g o
f to
tal
pro
tein
pNTBAM pNTBAM-BG
*
*
*
*
-500
500
1500
2500
3500
7 Days 15 Days 21 DaysCo
llage
n I
I ng/
g o
f to
tal
pro
tein
pNTBAM pNTBAM-BG
*
B
153
Figure 5-16. Comparing annexin A2 levels measured in BG versus non-BG hydrogels seeded with hOBs and hCHs. The level of annexin A2 in
ng/g of total protein measured in sample lysate. The figures are arranged in columns indicating each cell type (hCHs and hOBs) and in rows
representing each hydrogel type where (A) is pNIPAM and (B) is pNTBAM. Each comparison was held between BG (red square marks line) and non-
BG (blue diamond marks line) samples monitored with time. Asterisks indicate significance at P ≤0.05, the light asterisk (*) is the significance between
sample and control at each time point and the dark one (*) is indicative for significance with time (results represent the mean ±SD, n=3).
0
10000
20000
30000
40000
50000
7 Days 15 Days 21 Days
An
ne
xin
A2
ng/
g o
f to
tal
pro
tein
pNIPAM pNIPAM-BG
* * **
0
10000
20000
30000
40000
50000
7 Days 15 Days 21 Days
An
ne
xin
A2
ng/
g o
f to
tal
pro
tein
pNTBAM pNTBAM-BG
*
*
**
*
0
10000
20000
30000
40000
50000
7 Days 15 Days 21 Days
An
ne
xin
A2
ng/
g o
f to
tal
pro
tein
pNTBAM pNTBAM-BG
*
**
*
0
10000
20000
30000
40000
50000
7 Days 15 Days 21 Days
An
ne
xin
A2
ng/
g o
f to
tal
pro
tein
pNIPAM pNIPAM-BG
**
**
A
B
hCHs hOBs
154
Figure 5-17. The assessment of collagens I, II and annexin A2 in BG vs non-BG at day 21.
Comparison between (A) collagen I levels (B) collagen II levels and (C) annexin A2 levels
measured in ng/g of total protein of sample lysate. The bars in each figure are corresponding
to each hydrogel sample with a specific cell type with BG or without BG. Asterisks indicate
significant levels at P ≤0.05 (Results are representing mean ±SD, n=3).
In determining the final impact of embedding BG fibres within gradient scaffold, results
indicated significant alterations in almost all samples with BG fibres. Collagen I have shown
a significant increase with time for gradient-BG samples with hOBs and encountered for a
huge variation at all time points compared to non-BG samples. Gradient samples with hCHs
were not significantly altered (P >0.05) from the non-BG samples and both have only little
increase with time (Figure 5-18 A).
The levels of collagen II revealed a significant lower level for gradient-BG samples seeded
with hCHs compared to a higher level observed for the non-BG samples. The values were in
line together at the early time points, but the further elevation after day 15 witnessed some
retreat up to day 21 for the BG samples. For hOBs samples, collagen II had some variations
between BG and non-BG with higher levels for non-BG samples until day 15, however, levels
were back to be in line together at day 21 (Figure 5-18 B).
A significant elevation of annexin A2 was noticed for gradient-BG samples, this was inclusive
to all time points and with both cell types which might indicate the engagement of cells with
further mineral activities (Figure 5-18 C).
156
Figure 5-18. Quantifying collagens I, II and annexin A2 in BG vs non-BG gradient scaffolds seeded with hOBs and hCHs. Figures rows represent
each marker level (1) collagen I, (2) collagen II, and (3) annexin A2. Figure columns are revealing marker level monitored with time for (A) hCHs
and (B) hOBs respectively with the final comparison of levels at day 21(C) illustrated in the right side column bar figure. Each marker quantified in
ng/g of total protein measured in sample lysate. Asterisks indicate significance at P ≤0.05, for the time monitoring figures the light asterisk (*) is the
significance between sample and control at each time point and the dark one (*) is indicative for significance with time (results represent the mean
±SD, n=3).
0
500
1000
Gradient Gradient-BG Gradient Gradient-BG
Co
llage
n I
ng/
g o
f to
tal p
rote
in
hCHs hOBs
**
* = P ≤0.05
-200
300
800
1300
7 Days 15 Days 21 DaysCo
llage
n I
ng/
g o
f to
tal p
rote
in
Gradient Gradient-BG
*
*
* = P≤0.05
**
*
-200
300
800
1300
7 Days 15 Days 21 DaysCo
llage
n I
ng/
g o
f to
tal p
rote
in
Gradient Gradient-BG
* = P≤0.05
0
1000
2000
Gradient Gradient-BG Gradient Gradient-BG
Co
llage
n II
ng/
g o
f to
tal p
rote
in
hCHs hOBs
** * = P ≤0.05
-1000
0
1000
2000
7 Days 15 Days 21 Days
Co
llage
n II
ng/
g o
f to
tal p
rote
in
Gradient Gradient-BG
*
* = P≤0.05
*
-1000
0
1000
2000
7 Days 15 Days 21 Days
Co
llage
n II
ng/
g o
f to
tal p
rote
in
Gradient Gradient-BG
*
*
* = P≤0.05 *
0
10000
20000
Gradient Gradient-BG Gradient Gradient-BG
An
ne
xin
A2
ng/
g o
f to
tal p
rote
in
hCHs hOBs
**
* * = P ≤0.05
-5000
5000
15000
25000
7 Days 15 Days 21 Days
An
ne
xin
A2
ng/
g o
f to
tal p
rote
in
Gradient Gradient-BG
*
*
* = P≤0.05
*
*
-5000
5000
15000
25000
7 Days 15 Days 21 Days
An
ne
xin
A2
ng/
g o
f to
tal p
rote
in
Gradient Gradient-BG
*
*
* = P≤0.05
*
*
*
A B C
1
2
3
157
5.6. Discussion
In the physiological perspective, the cartilage-bone interface is a well-integrated region
offering a gradual transition between bone and cartilage tissues (Chan et al. 2012). In the
present work, the previously tested pNIPAM and pNTBAM hydrogels were assembled
together to produce a 3D multi-regional scaffold with the hope that this will advice for a
gradient tissue development.
Studies have been directed to explore the role of biomaterial scaffolds as a template to guide
the process of tissue regeneration. Several studies had established the usefulness of a multi-
layer scaffold to regenerate complex tissue constructs such as the osteochondral region
(Martin et al. 2007; Levingstone et al. 2014; Sartori et al. 2017). Materials of variable
characteristics have proven success to guide multiple tissue regeneration (Liu et al. 2013).
Recent trends are focusing on creating integrated materials scaffold making use of a functional
gradient between layers to perform as a natural tissue match (Leong et al. 2008; Sola et al.
2016; Kang et al. 2018).
The current scaffold design looks intact with no apparent margins to differentiate the two
polymers, apart from a thin transparent layer of pNIPAM at one ends of the scaffold
(Figure 5-1 A). Several techniques have been used to fabricate materials into gradient
constructs with variations as per materials different characteristics and the targeted tissue
regeneration (Chatterjee et al. 2011; Seidi et al. 2011; Sola et al. 2016; Di Luca, Ostrowska,
et al. 2016; Bracaglia et al. 2017). It was stated according to Matyjaszewski et al. 2000 that
atom transfer radical polymerization (ATRP) has been approved for gradient polymers
production making use of the polymerization process to blend variable materials properties.
The proposed method of joining the current materials had allowed for the development of
integrated regions between the two polymers. The timing of addition of each polymer layer
was set to be just after the polymerisation process had started in the previous layer i.e. while
polymer formation is in the midway. This had ensured that the process of polymerisation
initiated in the first layer will continue to build up polymer chains up to the next layer. Now,
158
the process of polymerisation will include chains from the second layer and continue onward
until forming the whole composite. Accordingly, the interface region between the layers was
integrated properly by infiltrating polymer chains together forming intact bonding region. This
has aided to create a single construct advised for three architectural regions avoiding the
problem of delamination that would occur when combining different materials in traditional
multilayer scaffolds (Izadifar et al. 2012). Current results illustrated the development of
multiregional scaffold as per SEM imaging and FTIR characterisation. SEM images revealed
similar architectural build to pNIPAM and pNTBAM at both ends. The interface part though
exposed some change in configuration presented by larger pores with flake-like shape polymer
boundaries (Figure 5-1 B). Variations between the two polymers in terms of wettability had
impacted the process of their production; this was clear as different solvent system is required
for each. Such a different property was reflected when both monomers solutions come in
contact with each other in preparing gradient scaffold. It was obvious according to Biswas et
al. that the presence of alcoholic component such as ethanol in pNIPAM solvent mixture will
affect the swelling properties of the polymer leading to formation of macro-porous hydrogel.
This could be interpreted by the different configuration observed in the interface region of the
combined polymers scaffold according to SEM image. The FTIR identifications showed the
gradual transition from pNTBAM to pNIPAM with a proposed interface section as indicated
from the spectral fingerprint region (Figure 5-1 C). Notably, prevalence from pNTBAM phase
was observed which might be related to the slower polymer formation speed. This is possibly
led to a wide area formed from pNTBAM region which has had gradually narrowed towards
pNIPAM. Accordingly, the current scaffold design indicated architectural integration
between the two polymers to form an intact scaffold unit. Although the FTIR measurements
reflect gradual transformation from one polymer region towards the other, the resultant
scaffold construct apparently may not show a gradient architectural development from
pNIPAM to pNTBAM region as indicated by the variable porosity at the interface. However,
the scaffold internal architecture refers to a multiregional porous characteristic. According to
the natural osteochondral interface architecture, the sub-chondroal bone region represents a
159
larger porous structure that is followed by the sub-chondral bone plate which is a more dense
bony region before moving to the calcified cartilaginous region (Burr 2004; Hoemann et al.
2012a; Madry et al. 2010). The current design could be useful as the interface region give rise
to a larger porous structure which can host higher rate of mineralization when tested with
cellular behaviour (Karageorgiou & Kaplan 2005).
Preliminary findings from histological staining of gradient samples, showed the gradual
alteration of cells response across the area between the two polymers (Figure 5-5). As a
general outcome, calcium minerals association was enhanced across a wide area of scaffold
regions including the interface, mostly with hOBs. The production of GAGs was distinctive
for hCHs at the pNTBAM side which has been interrupted at the interface towards pNIPAM
side. This might indicate the role of the background architecture of the current scaffold in
guiding cells behaviour i.e. cells are changing their behaviour accordingly while moving
across matrix layers. According to a study conducted by Di Luca et al. 2016 chondrogenic
differentiation was guided by a smaller pore architecture. They tested the differentiation of
human mesenchymal stem cells (hMSCs) on a scaffold with gradient porous structure; the
cells were showing an increased chondrogenic behaviour and GAGs production towards the
smaller pore gradient region. Both polymers were able to support mineral association either
with SBF solution or when seeded by cells (Chapters 3 and 4). The mineral activity though
was more pronounced with cells using osteogenic supported media. As such, the current
scaffold architecture has shown the propagation of mineralization across scaffold regions. Di
Luca et al. 2015 also stated that osteogenic differentiation coupled with increased
mineralization was enhanced by larger porous architecture of a gradient scaffold. An evidence
of mineral association with hCHs might be seen at the interface region, this was less observed
towards pNTBAM region. This is a possible finding that the mixed polymer interface region
provides a supportive background for a more mineral layout by hCHs. The latter may be
explained by the effect of macro-porous architecture of the region in allowing more
mineralisation activity by cells. It has been indicated that the larger porous architecture is an
160
excellent promoter for enhanced osteogenic and mineralization behaviour of cells
(Karageorgiou & Kaplan 2005). These results revealed the impact of the current structure and
porosity on influencing osteochondral cell behaviour. In this case, the mixed polymer region
of the current scaffold may advice for a dense mineral region owing to the larger porous
structure. The findings from immune staining and ELISA may support such a claim; this was
obvious in monitoring confocal images for collagen X expression that revealed intense green
fluorescent for both cells at the interface region. ELISA identification of annexin A2 in hCHs
has had an enhanced value as well when monitored with gradient scaffold for both cells, which
could be another evidence for these cells as being involved in the mineralization process.
Markers like annexin A2 and collagen X have been proven as indicators for calcium
mineralization of the extracellular matrix observed for hypertrophic chondrocytes and
osteoblasts. Annexin A2 normally expressed in matrix vesicles produced by these cells
(Bottini et al. 2018). Reviewing other markers, collagen I, II are both showing reasonable
amounts corresponding to hOBs and hCHs respectively on gradient scaffold (Figure 5-8). This
probably referring that the cells are still functioning normally relevant to their type.
In review of the above results, the produced multiregional scaffold presented a gradual mixture
of both polymers towards scaffold ends. The mixed region develops some changes to the
architectural structure. Accordingly, this had impacted cell’s behaviour differently when
compared to the individual hydrogels. Relevant to functional proteins levels, cells seeded on
the current combined polymers scaffold revealed intermediate levels of proteins as per the
same cells upon single hydrogels. The level of annexin A2, as an indicative of mineralization,
presented variable levels which was significantly lower with hOBs while no significant
difference with hCHs when compared to individual hydrogels (Figure 5-19).
161
Figure 5-19. Comparing mineralization activity presented by cells on hydrogels at day 21.
Mineral association as per alizarin red staining and annexin A2 protein level for hCHs and
hOBs. Bars are corresponding to each hydrogel type revealing annexin A2 level for each.
Scale bar 200 µm, asterisks represent significance at P ≤0.05, results indicate mean ±SD,
n=3.
This is probably referring to a more controllable aspect presented by the mixed polymer
interface which apparently hold mineralization process by cells within a specific limit. These
might explain the variable trends of cells as per the scaffold’s different characteristics which
will eventually help in designing scaffold to regenerate complex tissue interface.
Designing of osteochondral scaffold might necessitate a consideration regarding tissue
vascularization and further cellular nourishment, which might be a function of the porous
0 10000 20000 30000 40000
Annexin A2 ng/g of total protein
pNTBAM Gradient pNIPAM
0 10000 20000 30000 40000
Annexin A2 ng/g of total protein
*
*
162
architecture or may be improved by the inclusion of certain cues (Seo et al. 2014; J. Yang et
al. 2017; Camarero-Espinosa & Cooper-White 2017). Accordingly, the embedding of BG
fibres was proposed for the current scaffold design in the hope of enabling cells traveling and
further vascular infiltration from the sub-chondral layer. Furthermore, elements from these
fibres degradation were considered as potent stimulators for osteogenic activity and bone
matrix formation (Jones 2015; Turnbull et al. 2018). Diffusion of BG elements was described
by Raman mapping. The heat maps illustrate the diffusion of the BG mass by day 15 of
incubation at 37 °C (Figure 5-2 B). This was indicated by the expanded green zone band of
the BG mass and shrinkage of the red zone referring to the reduced Raman intensity while the
mass is disintegrating with time. This might indicate the formation of a hydroxyapatite layer
by dissolution of these fibres and diffusion of the main elements (calcium and phosphate) to
infiltrate the hydrogel phase (Turnbull et al. 2018). The potential of bioactivity of the BG
material is determined by the rate of comprising HA layer which is basically depend on BG
type and composition (Notingher et al. 2002; Kwiatkowska et al. 2012; Hossain et al. 2018).
Relevant to µCT density scanning, reduction of fibre mass reached the maximum at day 28;
however, remnants still can be sought within hydrogel’s construct revealed from last time
point images (Figure 5-3 A). This might reflect the existence of degradation elements from
BG fibres after complete dissolution which possibly confirms the findings from Raman
spectroscopy. Additional prove was the BG fibres mass volume reduction with time reaching
the lower level which was then appeared to be a little plateaued at day 28. This was furtherly
enforced by the alizarin stained BG channels after 28 days of PBS incubation at 37 °C
(Figure 5-3 B).
Testing cells traveling through BG fibres empty channels reveals no true evidence of cells
being migrated through these openings. Although BG fibres should leave about 60-70 µm
channels across hydrogel thickness, the cells were only accumulating around the beginning of
these channels at the top of hydrogels. It is possible that cells may lack enough oxygenation
or nutrition while traveling through toward the core of hydrogel whether through pores or
163
empty channels (Ahearne 2014). In this respect, it could be more reasonable to use fibres with
larger diameter thus enabling nutrients to infiltrate more across hydrogel. Additionally, testing
oxidative stress of cells on these hydrogels may be required in future prospective to assess this
condition.
The presence of BG fibres impacted for significant calcium minerals in samples with hOBs
seeded on pNTBAM while no significant levels observed with pNIPAM samples seeded with
the same cells (Figure 5-10). This has been reflected also in the level of annexin A2 which
revealed a significant increase with hOBs but only with pNTBAM seeded with hOBs
(Figure 5-17). Gradient scaffold seeded with hOBs though showed significantly higher
annexin A2 level compared to non-BG. This might be proving that these BG mass has
encouraged more cellular mineral activity thus expressing higher marker level.
In assessing samples with hCHs, little has been observed relevant to calcium ions evaluation
with no significant difference seen with BG samples for single or gradient hydrogels
(Figures 5-10, 5-12). However, ELISA measurements identify a significant increase in
annexin A2 level for BG samples with hCHs. It also showed that BG samples with hCHs had
witnessed some reduction, which was significant with pNTBAM, in collagen II levels for both
single hydrogels and gradients (Figures 5-16, 5-17). This is another clue which could possibly
indicate that these hCHs were engaged within active mineralization behaviour in the presence
of BG fibres. These findings agreed with the previous claims that BG material increase the
potential for mineral activity by cells (Jones et al. 2007; Jones 2015). This is important
especially when chondrocytes revealed the intention to associate with minerals (as per
increased annexin A2 levels) which is one of the characteristics of the hypertrophic
chondrocytes that forms the calcified cartilage matrix (Hoemann et al. 2012a). It is not
recognized whether these cells had been transformed into hypertrophic chondrocytes;
however the current data might indicate some of these aspects as referred to the mineralization
markers measured. Although the levels of calcium ions did not significantly increase with BG
164
samples seeded with hCHs, the expression of annexin A2 might reflect a future trend of these
cells to produce matrix vesicles and mineralize the surrounding matrix.
5.7. Conclusion
Joining pNIPAM and pNTBAM presented a multiregional scaffold between the two polymers
that showed different architectural regions including the polymers interface. Inspecting the
mixed scaffold region illustrate the ability to host osteoblastic and chondrocytes activities in
a way that reveal different cells attitude compared to individual hydrogels. The variations in
cell responses across this region refer to a gradual transformation in cell functions while
moving from one side to the other end of the scaffold. Introducing BG fibres into scaffolds’
construct encountered for an enhanced mineral activity mostly with hCHs. This might increase
the chance for establishing a mineralized interface by engaging chondrocytes to produce a
calcified matrix. This is a vital aspect when the main goal is to regenerate the osteochondral
interface as the current scaffold advised for a different potential of cells across its multi-
architectural regions.
165
Chapter 6
Summative discussion, conclusion, and
future work
166
6.1. Summative discussion
The prevalence of osteochondral defects, especially through the last decades, has brought it to
be one of the serious worldwide problems that adversely impacted individuals lifestyle
(Nukavarapu & Dorcemus 2013b; Pape et al. 2010). Treatment went through several options,
one of which is to stimulate further tissue growth by drilling and micro-fracture techniques.
These techniques are less invasive and have shown acceptable success rate, however some
concerns have been reported about the nature of tissues produced. These were manifested
mainly by the formation of fibrous cartilage that cannot withstand the normally applied
pressure on the joints resulting in further deterioration after specific period of treatment
(Swieszkowski et al. 2007; Steadman et al. 1997). Another treatment option, which is tissue
transplantation of osteochondral allo-grafts or auto-grafts, has shown a greater success rate
as being observed from a wide range of studies performed on animals and humans (Detterline
et al. 2005). However, the availability of the intended grafts in addition to donor site morbidity
have been regarded as a major limitations of these techniques (Detterline et al. 2005; J.S.
Temenoff & Mikos 2000). Autologous chondrocyte implantation (ACI) has been accepted to
be a superior solution for correcting osteochondral damage through utilizing a fresh
chondrocytes, which have been harvested from nearby cartilage, expanded in the laboratory.
The site of damage will be covered with a periosteal flap or membrane, then the cells injected
through this membrane (Brittberg 2008; Hangody et al. 2008). ACI proved effectiveness in
producing hyaline like articular cartilage, however, clinical studies have shown positive
results only to specific cartilage sites like the femoral condyle (J.S. Temenoff & Mikos 2000).
The limitations observed for the above mentioned treatment options, necessitate the existence
of a new therapeutic clues. Tissue engineering, as part of regenerative medicine, represents a
wide field of therapeutic strategies that utilizes a specific biomaterials to construct an artificial
extracellular matrix (ECM) or scaffolds, these scaffolds are designed and manufactured in a
way that preferably support cellular proliferation and further tissue growth so that mimicking
the natural tissue structure and property (Martin et al. 2007; Steinwachs et al. 2008; Chen et
167
al. 2009b; Vahdati & Wagner 2013). Engineering of the osteochondral interface should
consider the complex tissue transformation from the sub-chondral bone to the cartilage region
(Cancedda et al. 2003; Martin et al. 2007; Chiang & Jiang 2009). As such, studies was
performed utilizing multilayer scaffolds to simulate the variable bone-cartilage tissue
environment and the different stages of mineralization across this region (Dado & Levenberg
2009; Chen et al. 2014; Liu et al. 2013; Kon et al. 2014). The variable materials’ features were
explored such as the porosity, mechanical and surface chemistry to determine their impact on
relevant cell performances (Puppi et al. 2010a; Shapiro & Oyen 2013; Patterson et al. 2010;
Deb et al. 2018b). Indeed, challenge still existing as to establish an optimum scaffold design
that address for a gradient tissue regeneration and avoid the problem of delamination of a
multilayer construct (Sherwood et al. 2002; Liu et al. 2007; Steward et al. 2011; Chatterjee et
al. 2011; Castro et al. 2012; Chen et al. 2014).
The current thesis work aimed to search the suitability of certain biomaterials to fabricate a
multi-architectural scaffold unit to guide the regeneration of the osteochondral interface.
Investigating certain materials and materials combination revealed the effects of different
characteristics on guiding cell functions towards a specific tissue regeneration (Ito 1999;
Flemming et al. 1999; Arima & Iwata 2007; Patterson et al. 2010; O’Shea & Miao 2008;
Chang & Wang 2011). Material’s preferences were based on the intended tissue to be
regenerated with the synthetic materials gaining most interest because of their easily
controlled features (Williams 2009; Puppi et al. 2010b; Jones 2015; Hossain et al. 2018).
Accordingly, pNIPAM and pNTBAM were chosen for the current study relevant to their
background reports for being biomimetic, non-toxic, and tuneable materials (You et al. 2008;
Lynch et al. 2005; de Vries-van Melle et al. 2014; Haq et al. 2017; Ayat et al. 2016). Both are
synthetic polymers bearing the acrylamide group in their structure with slight variations in
chemical composition represented by additional methyl group in pNTBAM. These polymers
were investigated to advise the basic chemical, mechanical and architectural characteristics
that would possibly impacted the outcome biological results (Chapter 3). Findings elucidate
168
the main difference indicating more hydrophobic stiffer mass for pNTBAM compared to
pNIPAM. A wettable versus less wettable surface of materials is a function of surface charge
and chemical functional groups. Thus, pNTBAM revealed more hydrophobic surface
compared to pNIPAM. This was recognized from the drop shape and larger water contact
angle measured for pNTBAM (Figure 3-3). These findings were in agreement with certain
studies stated the wettability profile difference for pNIPAM and pNTBAM and its correlation
with their surface chemistry (Lynch et al. 2005; Muramatsu K Wada T, Hirai H, Miyawaki F
2012; Pelton 2010; Ayat et al. 2016). The C=O and NH- chemical functional groups presented
by materials promote more hydrophilic behaviour of polymer, such an aspect may be linked
to promoting osteoblastic cells activity and mineralization (Chang & Wang 2011; Keselowsky
et al. 2003). A more hydrophobic behaviour presented by pNTBAM is possibly connected to
the presence of higher percentage of CH3- groups (Chang & Wang 2011).
Results from compressive strength revealed stiffer mass presented by pNTBAM compared to
a more flexible soft pNIPAM. Mechanical strength is another criteria that impacted cells
proliferation and attachment which could be the result of material’s natural properties and
their method of production (Hollister et al. 2002; Wells 2008; Vijayavenkataraman et al.
2017). Studying architectural difference and porosity showed pNIPAM as having significantly
larger pore diameter compared to pNTBAM. The pore size variations measured for the current
materials might contributed to the difference in stiffness obtained as agreed with certain
studies stated the impact of increased porosity on decreasing material stiffness (Karageorgiou
& Kaplan 2005; Bandyopadhyay et al. 2010; O’Brien 2011; Turnbull et al. 2018).The
inspection of several monomeric sub-groups for each polymer declared the influence of
reducing monomeric concentration on having a larger pore diameter as reflected according to
SEM imaging. These were in accordance with studies that showed the influence of high
monomeric concentration of polymer solution on yielding a smaller pore size compared to a
lower concentration (Baugher et al. 1995; Karageorgiou & Kaplan 2005). Studies also
concluded the correlation between larger pore size and osteogenic cell behaviour and the
169
impact of this on promoting mineralization (Lee et al. 2012; Cooper et al. 2016; Karageorgiou
& Kaplan 2005). Both polymers showed a positive tendency to promote calcium minerals
association in vitro (relevant to SBF incubation) with variations that indicated a higher
tendency for pNTBAM (Figure 3-10). These relative differences in mineralization may be of
value when planning for an osteochondral scaffold, as this region physiologically originate a
mineral gradient between sub-chondral bone and cartilage (Bullough & Jagannath 1983;
Hoemann et al. 2012a; Bian et al. 2016). The above variable characteristics captured for both
hydrogels predisposed for the next observations in terms of cells attitude and biological
assessment that we carried out in chapter four.
The study proceeded forward to investigate the influence of hydrogels’ variable features
(outlined in Chapter 3) on relevant cell survival and their biological function. The chemical
and architectural differences between tested hydrogels revealed their impact on cells
attachment and viability. An obvious observation was the growth pattern of cells on each
hydrogel. It seems that cells grow in aggregates or clusters on pNIPAM while spread on
pNTBAM. Studying the viability of cells indicates higher rate of viable vs. dead cells for both
hydrogels. However, proliferation rate was quite different as the number of cells counted on
pNIPAM was around seeding density at day 21 unlike pNTBAM which showed significantly
increased number of cells. These results may be the outcomes from different materials’
characteristics including soft versus stiff surfaces and hydrophilic versus hydrophobic
properties obtained for pNIPAM and pNTBAM respectively. Certain studies proved the
impact of these variable features on cells behaviour, viability and growth pattern (Keselowsky
et al. 2003; Bačáková et al. 2004; Tan et al. 2005). Cells attachment can be improved using
materials with intermediate hydrophilic to hydrophobic surface characteristics. Results were
in agreement with other findings that indicated the impact of soft surfaces on affecting cell
attachment and proliferation rate compared to a stiffer surfaces (Bačáková et al. 2000;
Bačáková et al. 2001; Bačáková et al. 2004). The examined monomeric sub-groups of
hydrogels did not reflect any major differences in terms of viability and proliferation rate.
170
Though, an evidence of cells migration within hydrogel’s matrix of pNIPAM 0.042 g/mL sub-
type was spotted. This feature might reflect the development of interconnected porous
structure as per the lower monomeric concentration used which eventually could serve a better
3D environment and cells transportation. As such, the decision was made to move forward in
the present study with this concentration of pNIPAM. In case of pNTBAM, the highest
monomeric sub-type was chosen as no apparent variations in viability or migration had
recognized among pNTBAM sub-groups. This monomeric sub-type was stiffer in terms of
hardness compared to the others.
The outcome results from tracking osteogenic and chondrogenic cells behaviour revealed
some differences between these hydrogels. hOBs showed active mineralization when seeded
on both hydrogels, though, pNTBAM showed higher results. Findings regarding hCHs,
indicated little or no evidence of mineralization especially with pNTBAM. In evaluating
chondrogenic activity and GAGs production, pNTBAM was superior in revealing highest
GAGs content. These results were then confirmed with the findings from immunostaining of
hydrogels and ELISA assay for collagens. The levels of collagen I showed significant
elevation with hOBs sample of both hydrogels but mostly with pNTBAM. In contrast,
collagen II showed significant elevation with hCHs on pNTBAM samples whereas only little
evidence was noted with pNIPAM. Collagens I and II are normally associated with bone and
cartilage tissues but with different extents. This is identified normally by higher collagen I
levels in bone which is in contrast to cartilage tissues where collagen II is the major matrix
protein. Between these regions the level of matrix proteins will increase or decrease along the
tissue gradient depending on the cell type and the level of mineralization. This is basically
recognized at the calcified cartilage region where hypertrophic chondrocytes started some
increase in collagen II in addition to elevation of collagen X as an indicator of mineral
association activity by cells (Hoemann et al. 2012b; Pal 2014). The current results explain
how cells were reacted to the different configuration previously characterised for both
hydrogels. Hydrogels’ chemistry, stiffness, and porosity apparently revealed their impact on
171
overall cell proliferation, viability, and relevant functions. These were in accordance with
studies that described the increased stiffness of hydrogel to beyond 33 Kpa (evidenced with
pNTBAM) will enhance GAGs production by chondrocytes while materials presenting more
NH- and OH- with less CH3- chemical groups are involved in promoting osteogenic cell
activity (Wells 2008; Wang et al. 2016; Cao et al. 2017b). Another study by Di Luca et al.
2016 indicated the effect of smaller pore size of a material on guiding MSCs for more
chondrogenic differentiation.
The above results from Chapters 3 and 4 clearly revealed the variations between pNTBAM
and pNIPAM hydrogels in terms of basic characteristics reaching to biological observations.
Indeed, both hydrogels proved their tendency to host calcium mineralization in variable
degrees showing greater values with pNTBAM. The chondrogenic cell activity was supported
mainly by pNTBAM with little or no extent with pNIPAM.
In an attempt to regenerate the osteochondral region, making use of various properties
collected from the current materials as per mineralization and chondrogenic behaviour, these
two hydrogels were combined together in an attempt to produce a gradient scaffold unit.
Joining these polymers has had to follow the same synthesis procedures originally used for
each polymer. However, a stepwise addition of each polymer solution in one container was
regulated by a critical timing between the steps. The proposed method and timing of addition
was dependent on the speed of polymerization and the nature of each polymer’s solvent.
Accordingly, pNIPAM was added in the beginning followed by mixture of the two polymers
and finally pNTBAM layer. Initial characterization of the resultant scaffold showed the
development of a multiregional scaffold construct between the polymers. Each polymer
constitutes one end of the scaffold with mixed interface region that showed variable
architecture. the interface different architecture was related to the polymers variable solubility
properties and different solvent system. this had impacted polymer formation when the two
polymers met at the interface resulting in a macro-porous structure. Consequently, combining
the two polymers did not actually created a gradient architecture between them. This was
172
verified by SEM imaging, although the FTIR measurements across the scaffold’s regions
showed gradual polymer to polymer transformation (Figure 5-1).
Assessment of cells behaviour and biological activities on gradient scaffold showed increased
calcium mineralization for hOBs in gradient interface region with evidence also being noted
for hCHs. Chondrogenic cells activity was obviously increased towards pNTBAM side of the
scaffold, which was evident from GAGs assessment. These were confirmed as well via ELISA
measurements of collagens and annexin A2 as a mineralization marker. The activity of cells
at the gradient scaffold interface showed variable trends presented by expressing intermediate
levels of cell functional proteins when compared with the individual hydrogels. The level of
mineralization as well was measured at a lower level compared to individual hydrogels with
both cell types. This fact probably confirms that the gradient interface architecture resulted in
moderate activities of cells while moving from each side of the scaffold towards the other
side. Therefore, presenting three functional regions that will guide a gradual transformation
of cells activities.
BG fibres were included within hydrogels’ structure to aid the production of the final scaffold.
The proposed role of these fibres was to facilitate cellular transportation across scaffold
compartments or enabling vascularization and cells nourishment (Seo et al. 2014; J. Yang et
al. 2017; Camarero-Espinosa & Cooper-White 2017). Although the current observations
indicated evidence of cell migration for pNIPAM, limitations still existed with pNTBAM.
That’s why the use of these fibres might add additional significance. The other purpose of
using these fibres originates principally from their ability to degrade with time leaving traces
of minerals within the produced channels. These residues will support a mineral environment
that will encourage osteogenesis and mineralization activity of the cells (Jones 2015; Turnbull
et al. 2018). Degradation profile of BG fibres was described in Chapter 5 according to Raman
and µCT analysis. Indeed, results indicated diminished BG mass up to day 28 with evidence
of traces of these fibres still being measured after 28 days. Cells seeded on BG embedded
scaffolds revealed an elevation of calcium minerals and annexin A2 levels compared to the
173
non-BG samples. Results also indicated the positive engagement of hCHs in mineralization
activity with the presence of these fibres. This is probably evident by the increased annexin
A2 and calcium ions with reduction of collagen II levels observed in BG samples. Annexin
A2 has been proven as indicator for the involvement of cells in mineralization of the
extracellular matrix. This marker is mainly expressed in matrix vesicles (MV) observed in
hypertrophic chondrocytes and osteoblasts (Bottini et al. 2018). This could be a possible
indication of the development of a multifunctional scaffold’s regions that refer to a variable
mineral cell behaviour which involves both cell types. However, tracking penetration of cells
across the empty fibres’ channels showed no obvious signs of cell migration. Accordingly, the
current scaffold might serve the purpose of regenerating complex tissue construct, such as the
osteochondral interface, making use of the BG mass to potentiate osteogenic cell activity and
supporting the calcified matrix by chondrocytes.
6.2. Conclusions
Assessment of the current materials showed the development of hydrogels with different
criteria’s as relevant to their background chemistry. Results concluded that pNTBAM labelled
as more hydrophobic, stiffer hydrogel with smaller pore diameter. On the other hand,
pNIPAM was more hydrophilic, soft hydrogel with larger pores. These variations impacted
cells attachment and viability assessment. The two hydrogels supported higher percentage of
viable versus dead cells. However, cells were forming aggregates on pNIPAM with low
proliferation rate whereas on pNTBAM they spread on the surface showing significantly
increased number. The lowest monomeric concentration of pNIPAM indicated more
interconnected pore architecture. This was proven by the evidence of cell migration observed
with this sub-type compared to the other concentrations including pNTBAM monomeric sub-
groups. Both hydrogels’ architecture supported mineral association to variable tendencies.
The levels were high when tracked with hOBs while only little with hCHs mostly evident with
pNIPAM. Chondrogenic activity was promoted by pNTBAM compared to little or no
evidence with pNIPAM hydrogel. The final scaffold generated by joining the two hydrogels
174
showed the integration between the two polymers to form a joint interface region. The
resultant scaffold though may not actually refer to a gradient architectural development
between the two polymers regions. This was evident by the pore shape and architectural
difference at the interface. However, the resultant joined scaffold features a variable
mineralization and chondrogenic activity across the multi-architectural regions. The inclusion
of BG fibres within scaffold’s construct indicated enhanced mineralization activity of cells
whether with single or gradient hydrogels. Such a property would probably promote the
establishment of mineral gradient across the osteochondral interface. However, we couldn’t
establish evidence of cell transport through fibres openings. The current study proved that
materials with slight variation in chemistry advised for different materials’ features which in
turn impacted cell activities in the favour of multiple tissue regeneration. It also concluded the
possibility of joining these materials to produce gradient scaffold promoted for
multi-functional architectural regions. On the other hand, tuning of these materials by
changing the monomeric concentration or by introducing bio active materials (BG fibres) had
positively impacted some of their features including cell migration and enhanced mineral
activity. These outcome measures might be of interest when trying to regenerate complex
regions such as the osteochondral interface. The current scaffold design reveals variable cells
activities per the different scaffold zones. Although the gradient architectural feature of the
scaffold wasn’t completely achieved as required, the cells performances refer to an
interchangeable mineral and chondrogenic tendencies across scaffold multiple regions. This
was influenced further by the embedding of BG fibres which ultimately enhanced
mineralization tendency involving chondrocytes. Thus, it could be assumed that this had led
to an imitation to the calcified cartilage together with the sub-chondral bone.
6.3. Future work
Considering the current results, future trends would recommend the application of this model
study on other materials featuring the variable wettability, architectural and mechanical
properties. This could be helpful to present wide range of models that would serve the
175
regeneration of complex tissues such as the bone-cartilage interface. Further recommendations
suggest investigating gradient scaffolds’ regional characteristics on guiding cell
differentiation of mesenchymal stem cells (MSCs). This will clarify the osteogenic versus
chondrogenic alignment of cell behaviour across scaffold regions and would benefit from
addressing certain gene expression specific to cell functions.
It is also recommended to investigate BG fibres with larger diameter (100-150 µm). The
current work summarizes an enhanced mineral potential of cells with BG embedded samples.
However, fibre thickness may be not enough in enabling adequate cell migration across these
fibres’ openings. The proposed recommendation may probably provide an option that supports
a better cellular transportation by enabling cells to infiltrate through larger openings.
The application of bioreactor system while testing in vitro cell culturing of the current
materials. These probably involve hydrostatic pressure or shear stress which intended to
simulate the in vivo mechanical stimuli especially when targeting osteochondral tissues.
A future recommendation may also involve the application of this scaffold model in an animal
studies by subcutaneous implantation of the final gradient scaffold. This is a useful trend
towards investigating in vivo versus in vitro environment and the quality of tissues produced
under physiological conditions.
176
Chapter 7
References
177
Ahearne, M., 2014. Introduction to cell − hydrogel mechanosensing. Interface Focus, 4(2),
20130038..
Akiyama, Y. & Okano, T., 2015. Temperature-responsive polymers for cell culture and tissue
engineering applications. Switchable and Responsive Surfaces and Materials for
Biomedical Applications, pp.203–233.
Allo, B.A. et al., 2012. Bioactive and Biodegradable Nanocomposites and Hybrid
Biomaterials for Bone Regeneration. Journal of Functional Biomaterials, 3(4), pp.432–
463.
Ando, W. et al., 2007. Cartilage repair using an in vitro generated scaffold-free tissue-
engineered construct derived from porcine synovial mesenchymal stem cells.
Biomaterials, 28(36), pp.5462–5470.
Arima, Y. & Iwata, H., 2007. Effect of wettability and surface functional groups on protein
adsorption and cell adhesion using well-defined mixed self-assembled monolayers.
Biomaterials, 28(20), pp.3074–3082.
Armiento, A.R. et al., 2018. Biomaterials for articular cartilage tissue engineering: Learning


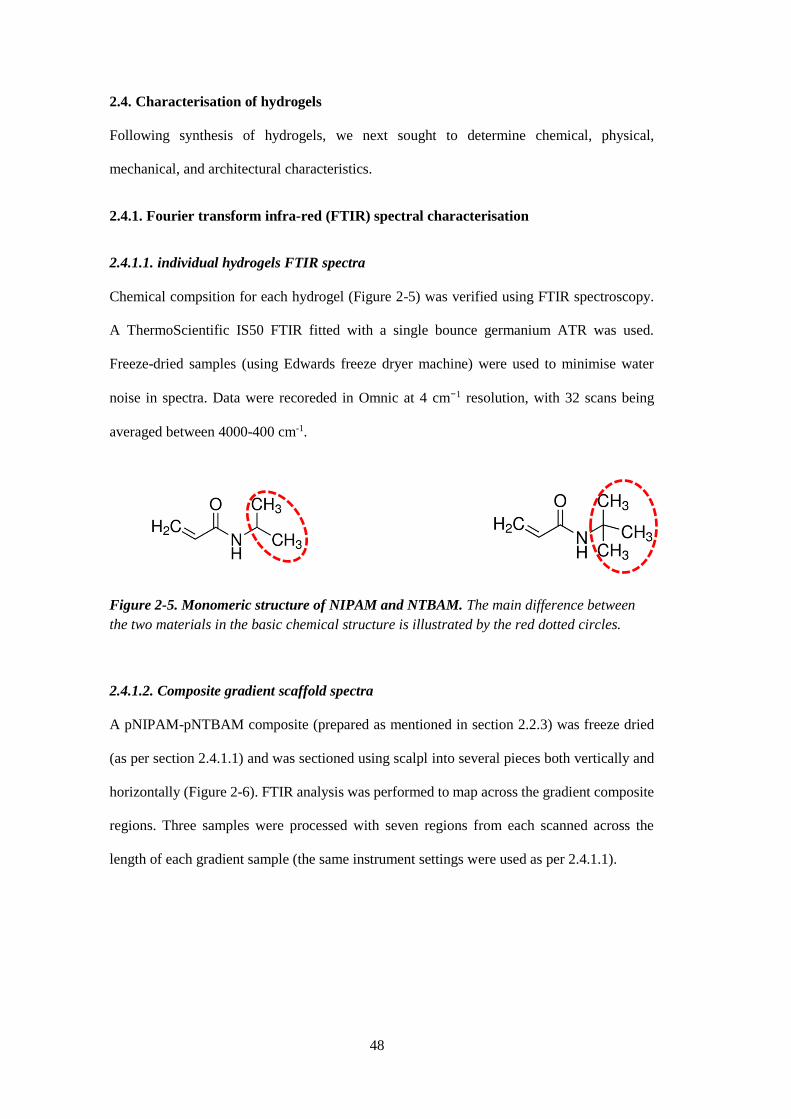


![Investigation of Tissue Engineering Scaffolds for ...doktori.bibl.u-szeged.hu/4158/1/phd_thesis_ zsedenyi.pdf · tissue engineering, especially for the fabrication of scaffolds [14].](https://static.documents.pub/doc/80x56/5f9136fac4be4300fb3b3c1b/investigation-of-tissue-engineering-scaffolds-for-zsedenyipdf-tissue-engineering.jpg)

