applied sciences Article Design and Implementation of an IoT-Oriented Strain Smart Sensor with Exploratory Capabilities on Energy Harvesting and Magnetorheological Elastomer Transducers Jorge de-J. Lozoya-Santos 1 , L. C. Félix-Herrán 2, * , Juan C. Tudón-Martínez 3 , Adriana Vargas-Martinez 1 and Ricardo A. Ramirez-Mendoza 1 1 Tecnologico de Monterrey, School of Engineering and Sciences, Ave. Eugenio Garza Sada 2501, Monterrey 64849, Nuevo Leon, Mexico; [email protected] (J.d.-J.L.-S.); [email protected] (A.V.-M.); [email protected] (R.A.R.-M.) 2 Tecnologico de Monterrey, School of Engineering and Sciences, Blvd. Enrique Mazón López 965, Hermosillo 83000, Sonora, Mexico 3 Universidad de Monterrey, División de Ingeniería y Tecnología, San Pedro Garza García, Nuevo León 66238, Mexico; [email protected]* Correspondence: [email protected]Received: 31 March 2020; Accepted: 5 June 2020; Published: 26 June 2020 Abstract: This work designed and implemented a new low-cost, Internet of Things-oriented, wireless smart sensor prototype to measure mechanical strain. The research effort explores the use of smart materials as transducers, e.g., a magnetorheological elastomer as an electrical-resistance sensor, and a cantilever beam with piezoelectric sensors to harvest energy from vibrations. The study includes subsequent and validated results with a magnetorheological elastomer transducer that contained multiwall carbon nanotubes with iron particles, generated voltage tests from an energy-harvesting system that functions with an array of piezoelectric sensors embedded in a rubber-based cantilever beam, wireless communication to send data from the sensor’s central processing unit towards a website that displays and stores the handled data, and an integrated manufactured prototype. Experiments showed that electrical-resistivity variation versus measured strain, and the voltage-generation capability from vibrations have the potential to be employed in smart sensors that could be integrated into commercial solutions to measure strain in automotive and aircraft systems, and civil structures. The reported experiments included cloud-computing capabilities towards a potential Internet of Things application of the smart sensor in the context of monitoring automotive-chassis vibrations and airfoil damage for further analysis and diagnostics, and in general structural-health-monitoring applications. Keywords: smart sensor; magnetorheological elastomer; energy harvesting; piezoelectric; IoT 1. Introduction Damage detection and further diagnosis via structural-health monitoring could be improved with smart sensors that periodically gather, order, and make data available to stakeholders. With the increase of Internet of Things (IoT) applications in the industry, smart sensors are becoming a crucial component, acting not only as transducers, but as an integral solution that incorporates various capabilities into the value chain. Moreover, smart sensors are being applied in several fields, such as healthcare, civil engineering, the automotive industry, and power generation by extending the traditional functions of sensors, i.e., a transducer plus signal conditioning. Appl. Sci. 2020, 10, 4387; doi:10.3390/app10124387 www.mdpi.com/journal/applsci
Transcript
applied sciences
Article
Design and Implementation of an IoT-Oriented StrainSmart Sensor with Exploratory Capabilities onEnergy Harvesting and MagnetorheologicalElastomer Transducers
Jorge de-J. Lozoya-Santos 1 , L. C. Félix-Herrán 2,* , Juan C. Tudón-Martínez 3 ,Adriana Vargas-Martinez 1 and Ricardo A. Ramirez-Mendoza 1
1 Tecnologico de Monterrey, School of Engineering and Sciences, Ave. Eugenio Garza Sada 2501,Monterrey 64849, Nuevo Leon, Mexico; [email protected] (J.d.-J.L.-S.);[email protected] (A.V.-M.); [email protected] (R.A.R.-M.)
2 Tecnologico de Monterrey, School of Engineering and Sciences, Blvd. Enrique Mazón López 965,Hermosillo 83000, Sonora, Mexico
3 Universidad de Monterrey, División de Ingeniería y Tecnología, San Pedro Garza García, Nuevo León 66238,Mexico; [email protected]
Received: 31 March 2020; Accepted: 5 June 2020; Published: 26 June 2020
Abstract: This work designed and implemented a new low-cost, Internet of Things-oriented,wireless smart sensor prototype to measure mechanical strain. The research effort explores theuse of smart materials as transducers, e.g., a magnetorheological elastomer as an electrical-resistancesensor, and a cantilever beam with piezoelectric sensors to harvest energy from vibrations.The study includes subsequent and validated results with a magnetorheological elastomer transducerthat contained multiwall carbon nanotubes with iron particles, generated voltage tests from anenergy-harvesting system that functions with an array of piezoelectric sensors embedded in arubber-based cantilever beam, wireless communication to send data from the sensor’s centralprocessing unit towards a website that displays and stores the handled data, and an integratedmanufactured prototype. Experiments showed that electrical-resistivity variation versus measuredstrain, and the voltage-generation capability from vibrations have the potential to be employed insmart sensors that could be integrated into commercial solutions to measure strain in automotiveand aircraft systems, and civil structures. The reported experiments included cloud-computingcapabilities towards a potential Internet of Things application of the smart sensor in the context ofmonitoring automotive-chassis vibrations and airfoil damage for further analysis and diagnostics,and in general structural-health-monitoring applications.
Keywords: smart sensor; magnetorheological elastomer; energy harvesting; piezoelectric; IoT
1. Introduction
Damage detection and further diagnosis via structural-health monitoring could be improved withsmart sensors that periodically gather, order, and make data available to stakeholders. With the increaseof Internet of Things (IoT) applications in the industry, smart sensors are becoming a crucial component,acting not only as transducers, but as an integral solution that incorporates various capabilities intothe value chain. Moreover, smart sensors are being applied in several fields, such as healthcare,civil engineering, the automotive industry, and power generation by extending the traditional functionsof sensors, i.e., a transducer plus signal conditioning.
A smart sensor is an electronic device that takes inputs from the physical world, converts the datafrom one physical domain to another, and contains a signal-conditioning stage. It also processes datathrough a central processing unit (CPU), and provides information from the gathered data for furtherdecision making. Recently, with the development of new material technologies, smart sensors havealso incorporated energy-harvesting, IoT, and cloud-computing capabilities.
Structural-health monitoring (SHM) and further diagnosis are activities that have benefitedfrom the development of smart sensors (including intelligent materials). The integrity of automotivestructures, e.g., vehicle chassis, aircraft-wing structures, or structural supports in buildings, is of greateconomic value, and require measurements of mechanical vibrations and signal conditioning for dataprocessing. Various approaches to monitoring structures have been reported.
Strain gauges are probably the most widely studied and applied transducers to measure strain andmechanical vibrations on structures, but they present some drawbacks. In general terms, strain gaugesgenerate a change in their electrical resistance that is proportional to the applied force that causesan elongation of the gauge. Moreover, the use of strain gauges requires a signal-conditioning stagecalled the Wheatstone bridge, an intensely studied electrical circuit to measure unknown electricalresistance [1]. Although they have been widely considered, the main disadvantages of conventionalstrain gauges are their high nonlinearity, temperature compensation, and the need for constantcalibration to correctly function [2]. For these reasons, researchers are motivated to replace straingauges with other materials that do not present these disadvantages.
In the last decade, a type of smart material that has been used as a force–electrical-resistancetransducer is the elastomer. Specifically, this work refers to magnetorheological elastomers (MREs)that, rather than cross-linked structures, were applied as force–electrical-signal transducers withinrubber molecules due to qualities such as high tensile strength, thermal stability, and increased numberof linear structures [3,4]. An MRE is a composite with sensitive magnetic particles that are suspendedon a polymeric matrix. MREs belong to a new group of composites that have physical or chemicalproperties that can be controlled by external stimuli such as magnetic or electric fields, stresses,temperature, moisture, and pH [5]. Magnetorheological (MR) phenomena in elastomers manifest asa change in the mechanical properties of a viscoelastic material by applying an external magneticfield [6,7].
The availability of required energy in smart sensors is an area of research that has become crucialin recent years. Batteries have been serving as the primary power source to drive these devices.Although batteries have their advantages, they are expensive, take up a significant amount of space,add weight to the sensor, need to be replaced or recharged, and, when discarded, they are highlypolluting. In this context, the results of innovative schemes have been focused on harvest energy as analternative to using batteries.
A promising approach that relies on power extraction from the ambient is known as energyharvesting. This approach is a potentially inexhaustible source of energy for low-power devices.Energy harvesting currently exploits four primary sources of energy—light, electromagnetic radiation,thermal gradients, and motion [8]. The significant drawbacks of energy harvesting are the difficulty ingathering energy and inconstant power generation; hence, different energy-harvesting approacheshave been investigated, and piezoelectric materials have yielded favorable results in harvesting energyfrom mechanical vibrations [9–12]. More specifically to the present study, different approaches toenergy harvesting oriented toward structural-health monitoring have been studied [13].
Energy harvesting, which takes advantage of the piezoelectric effect to gather mechanical energyfrom the environment and to convert it into electrical energy, has been reviewed. Piezoelectric elementshave been widely used to collect energy from mechanical vibrations, which make them appropriatefor use in ground-vehicle chassis and civil structures, where vibrations within a frequency rangeimpact on the piezoelectric item and generate an output voltage. The most common configurationand design used for piezoelectric-energy harvesting (PEH) employs a cantilever. A piezoelectriccantilever undergoes compression and tension cycles as it is being excited through vibration or cyclic
Appl. Sci. 2020, 10, 4387 3 of 28
forces; however, an important limitation of the cantilever is the limited frequency range in which thesedevices operate due to their resonant behavior (different beam dimensions); thus, different resonantfrequencies and operating bandwidths have been studied [14].
This study presents the design and implementation of a new low-cost prototype of a smart sensorat the macroscopic scale for the measurement of mechanical strain. In addition to measurement anddata-processing results, outcomes include an energy-harvesting subsystem with piezoelectric sensorsin a cantilever structure and IoT-oriented cloud-computing capabilities through an online dashboard.For the transducer, the ongoing applied approach is to replace strain-gauge arrays with an MRE thatcontains nanoparticles. Our experimental work was neither nano nor micro, but a macro hands-onendeavor with a prototype built with commercial resources that were not considered to be highlyspecialized. The use of open connectivity platforms to develop the wireless communication and IoTapplications is also highlighted. Moreover, this research includes exhaustive feasibility tests to converta polymer into a smart material. In this case, different types of nanoparticles were employed to converta strain signal (the difference between a nominal elongation and that generated when a force is appliedto it) into electrical resistance.
The motivation for this work was the monitoring of the chassis of ground vehicles.With information captured from the oscillations and measured strains of these structures, the next stepwould be to create a network of very efficient (accurate readings, energy harvesting, IoT capabilities)smart sensors to achieve better diagnoses of the state of the structures, including punctual fault locationand the remaining lifetime of the structure.
The rest of the article is organized as follows: Section 2 presents related reported work. Section 3develops the design and implementation methods of each subsystem of the smart sensor, and theemployed experiment material, and Section 4 describes the carried-out validation tests. Section 5presents the preliminary results from the experiment work. Section 6 discusses the results, and Section 7discusses our conclusions and future work.
2. Related Work
Reported efforts about monitoring integrity in automotive and aircraft structures have beenreported. One applied method is to track the inner vehicle’s chassis, looking for normal deformationof the car’s life cycle due to accidents, where a structure of smart sensors detects possible failures onthe chassis [15]. Moreover, a low-power-consumption smart sensor for SHM with four piezoelectrictransducers was tested to identify impact and damage in automotive and aircraft structures [16].Another reported outcome of SHM is a virtual test model to detect problems in airfoils [17].
Recently, a magnetoresistive actuator was tested to detect small amounts of damage in aircraft [18];moreover, a review was carried out on sensing technologies for structural-health monitoring (SHM),and included a case study for a commercial aircraft. Findings showed that the use of smart sensorsreduced the time required for aircraft maintenance, and therefore, the cost of maintenance. Contrarily,by increasing the number of sensors, the total weight of the aircraft increased as well as the lifetimecost. Thus, an aim is to create smart sensors that require fewer sensing points to perform structuralmonitoring [19], such as magnetorheological elastomers (MREs).
Among the different types of MRE, some contain nanoparticles. Due to their suitablecharacteristics to develop as transducers, this research explored MREs with iron oxide nanopowderand multiwall carbon nanotubes with iron. MR elastomers with iron particles have better mechanicalproperties and magnetic characteristics compared to those of MREs without the iron microparticles [20].Furthermore, including carbon nanotubes in the elastomer improves tensile strength, field-dependentstorage, loss moduli, and magnetorheological efficiency [21].
A variety of reported results on energy harvesting with piezoelectric elements can be foundin the literature. The use of cantilever beams in energy-harvesting systems was widely exploredand reviewed [22–26]. Studies focused on the different geometries that the cantilever couldhave, and, for example, experimental results recorded the generation of a greater voltage with a
Appl. Sci. 2020, 10, 4387 4 of 28
cantilever of triangular geometry against that of others of the rectangular and trapezoidal type [27].Another research work obtained higher levels of collected energy with a T-shape cantilever [28],whereas another result applied different configurations of the cantilever beam and its impactmechanism to generate electricity [29]. Additionally, there are reported experimental results where acavity was added to the cantilever beam to increase strain and generated voltage by approximately 75%compared with those of the option without the cavity [30]. Additional experimental results indicatedthat the use of multilayered piezoelectric sensors generated more voltage than that of a single-layeredstructure [31], and showed the use of a cantilever with a coupled pendulum to gather energy fromdisplacements in two degrees of freedom (DOF) [32]. In automotive applications, vibration frequenciesare generally very low (<100 Hz), and for a vehicle chassis and vertical dynamics of the vehiclestructure, they are approximately <15 Hz [33]. It can be seen from previous works that these frequencybandwidths have not been widely addressed with this kind of mechanism.
Recent smart-sensor applications include the IoT paradigm and taking advantage of cloudcomputing. Reported SHM results with IoT capabilities were proposed with a tendency to deploywireless communication as an option to solve wired-sensor technologies [34]. Some approacheshave developed remote sensing and a reconfigurable environment such as a wireless-sensornetwork (WSN) [35], whereas other achievements focused on technology to transfer informationamong heterogeneous platforms (middleware) within the context of IoT [36]. Moreover, new IoTremote-sensing technologies have been developed. One example is the Xnode wireless platform thathas been tested for SHM. On the basis of experimental work, this technology exhibited high reliabilityand accuracy, in addition to low power consumption. These results identify that this technology has ahigh potential for SHM with IoT capabilities [37]. Another result is a review on small smart sensorsthat are able to collect data with IoT technology. The aim of the study was to employ algorithms toinfer hidden information [38].
This investigation effort was based on a reported work in progress about smart sensors to measurestrain [39], and the developing proof of concept of a smart elastomer for sensing force and vibration [40].The preliminary experiments that were carried out and the obtained results were extended to obtainbroader results that allowed for stronger conclusions. Additionally, the present effort went further intothe design and manufacture of a complete prototype, which had not been developed by these previousoutcomes, and the energy-harvesting prototype was improved by including more tests, data analysis,and higher levels of generated voltage.
The motivation of this work was to improve reported achievements on the health monitoring ofstructures through smart sensors. A preliminary result of MRE application on structural monitoringwas recently reported [41]. Moreover, another study determined vibration levels and resonancefrequencies for vehicles. A Volvo FM12 with air suspension, driven at 30, 50, 70, or 90 km/h onthree road types, was used for transportation. Vehicle speed was measured with a global-positioningsystem (GPS), and vibrations were read with two accelerometers placed on the chassis and floor. As aresult, four main resonance frequencies were identified for the vertical movement at 1.3, 5.1, 12.6,and 23 Hz. The vibration-exposure values (considering an 8 h transport period) were 0.61 ± 0.12 m/s2,and amplitude of 0.019 ± 0.0037 m, respectively. According to the results, the energy-harvestingmechanism could be applied in the automotive industry [33]. To the best of the authors’ knowledge,there are no reported outcomes regarding energy harvesting with low-cost vibrating cantilevers withembedded piezoelectric sensors that reported generated voltage-peak values greater than 1.0 V forfrequencies of less than 10 Hz. Moreover, a review of the state-of-the-art research did not find reportedwork about SHM with MRE, IoT characteristics, and energy-harvesting capabilities.
3. Materials and Methods
This section presents the design and manufacturing process of the smart sensor, and includesthe materials that compose the sensor. Additionally, the tests performed on the finished prototype(transducer + central process unit (CPU) + communication unit + energy harvesting and storage) are
Appl. Sci. 2020, 10, 4387 5 of 28
described to validate and understand their operating characteristics and limitations. The list of usedmaterials (including the computational packages) in the manufacture of the prototype is presentedin each subsection that corresponds to the specific subsystem. The schematic of the manufacturedprototype is shown in Figure 1.
Figure 1. Schematic of the designed and implemented smart sensor. Red text—separately testedsubsystems with preliminary results.
3.1. Design and Manufacturing
This subsection explains all the work carried out to design and manufacture the smart sensor.The prototype comprised a transducer, a CPU, a wireless module, and a harvesting system.
A magnetorheological elastomer (MRE) was designed and manufactured to convert strainand vibration measurements into electrical resistance. A general mold was designed usingcomputer-aided-design (CAD) software, and different patterns to measure the strain were tested.Furthermore, this subsection explains, in detail, the manufacturing process used to create threeMRE prototypes.
The MRE transducer mold was designed as a 3-layer device. The floor layer contained cavitieswith a specific pattern based on a strain-gauge rosette. The middle layer was screwed to the floor,and it allowed the samples to be extracted. The top layer was screwed to the middle layer to close themold. The complete CAD mold is shown in Figure 2.
As part of the research activities, three different designs for the MRE transducer wereimplemented—a horizontal array with 4 lines, 4 lines in a rosette array with 90 among lines,and another rosette arrangement with 3 lines and 45 among them. These designs were modeled inAutodesk Inventor 2018, and printed in 3D with polylactic acid (PLA) material. The array of 4 lines had4 cavities in the floor layer, describing a pattern of four parallel lines to measure electrical-resistancevariations just in one axis. The rosette arrangement with 3 lines of 45 had a different pattern in the floorlayer; it had 3 cavities, one at 0, another line at 45, and the third at 90 to measure electrical-resistancevariations in two axes and their components at 45. The third pattern proposal had two pairs of lineson its floor layer that were placed oppositely and a 90 rosette strain gauge. The CAD drawings of allthe developed patterns are shown in Figure 3.
After the molds were manufactured, to continue the MRE preparation process, preliminary testsof silicon rubber adhesion were performed. Experiments were carried out to verify that a silicone layercould be adhered to another one without mixing. The goal of this experiment was to confirm thatboth layers were able to merge once they were fully cured. This procedure was applied to the MREpreparation process to combine a layer with a satisfactory percentage of nanoparticles to guarantee anaccurate measurement of electrical resistance, with another of lower concentration that served as the
Appl. Sci. 2020, 10, 4387 6 of 28
base material for the transducer. The employed materials for this task were a mold max 30 siliconerubber with its catalyst and the 3D printed molds fabricated from the designs in Figure 3.
Figure 2. Computer-aided-design (CAD) magnetorheological-elastomer (MRE) mold with 3 layers:floor, middle, and top.
Figure 3. CAD images of three implemented MRE patterns. (a) Horizontal array with 4 lines; (b) 3-linearray with 90 and 45 between them; (c) 4-line array with 90 between them. Figures taken from [39].
Silicone rubber and catalyst were applied to generate the MRE. The first experiment used aratio of 50:1 (98% silicone rubber and 2% catalyst). The results were not satisfactory because thelow-concentration of catalyst caused the sample to begin the curing process after 20 h. The secondand third experiments used a ratio of 10:1 (90% silicone rubber and 10% catalyst). The new resultsfrom the second and third experiments were acceptable because the mixture started to cure after 2 h,which complied with the reported reaction times during the MRE fabrication process [42]. After aseries of trials, the tests were carried out with 90% silicone rubber and 10% catalyst, and the resultswere satisfactory. The layers were successfully merged, and this ratio of rubber to catalyst was used inthe subsequent experiments. The manufactured transducers are shown in Figure 4.
The next step was to include nanoparticles in the MRE. An MR elastomer sample composed oftwo layers was made; the first had a higher concentration of nanoparticles to obtain better electricalconductivity and conduct electrical-resistance measurements in the material, and the second layer hada lower concentration of nanoparticles, with the aim of using it as the base layer.
The first elastomer was fabricated with iron (II and III) oxide nanopowder with a particle sizeof 50–100 nm, and 97% trace metal basis. For the preparation of the sample, the first layer had amass equal to 3 g consisting of 70% silicone rubber (ratio 10:1 of silicone rubber to catalyst) and30% iron oxide nanoparticles. For the second layer,the mass was equal to 10 g and it was composedof 90% silicone rubber (ratio 10:1 of silicone rubber to catalyst), and 10% iron oxide nanoparticles.
Appl. Sci. 2020, 10, 4387 7 of 28
Electrical-resistance measurements were carried out on the cured sample, but the relation betweenthe applied force and electrical resistance was not evident. The reason for this was that the electricalconductivity of the MRE with iron oxide nanoparticles was too small to exhibit the expected behavior ofa potential transducer. To mitigate this, and on the basis of laboratory availability, we used multi-wallcarbon nanotubes with iron (MWCNT-Fe). [43].
Figure 4. Examples of two generated MR elastomers with 90% silicone rubber and 10% catalyst.Depicted patterns are (a) 3-line array with 90 and 45 between them, and (b) 4-line array with 90
between them.
To overcome the aforementioned problem, rubber and catalyst percentages were changed. The firstlayer consisted of 97% silicone rubber (ratio 10:1 of silicone rubber to catalyst), and 3% MWCNT-Feparticles (some trials with a different percentage of particles were carried out before selecting thisrubber–nanoparticle percentage ratio). This ratio of silicone rubber to MWCNT-Fe particles was chosenbecause the second test had satisfactory results—the observed electrical-resistance characteristics weresuitable for sensing (i.e., the elastomer exhibited the required elastic behavior). The manufactured2-layer MR elastomer with nanoparticles is shown in Figure 5.
Figure 5. Manufactured 2-layer MR elastomer with nanoparticles.
A graphical way of presenting the set of methods and carried out experiments (planned andexecuted in sequence) is presented in Figure 6. The image depicts the ordered sequence of laboratorytests. It started with the CAD designs of the molds and continued with the implemented tests fordifferent concentrations of silicone rubber and catalyst. Later, the nanoparticles were added to thecorrect mixture among layers. In the first trial, the tests included different concentrations of iron (II andIII) oxide nano powder but results were not satisfactory, i.e., the relation force vs. electrical resistance
Appl. Sci. 2020, 10, 4387 8 of 28
was poor. Subsequently, the experiments were carried out with MWCNT-Fe and the relation cause(force)- consequence (electrical resistance) was obtained. Ohmmeter tests were applied to the generatedsamples and based on these measurements, it was validated that the sample with MWCNT-Fe had abetter force vs. electrical resistance relation than the iron (II and III) oxide nano powder. The outcomessupported the idea of applying the manufactured MRE as a transducer. With this lately result, threedifferent MRE instances were manufactured (4-lines in parallel, 4-lines in 90, and 3-lines in 90/45).
Figure 6. Sequence of experiments during the manufacture of the MRE.
The MRE output is the electrical resistance, which must go through a signal-conditioningstage prior to being processed by the CPU. For this purpose, two required circuits wereimplemented, a Wheatstone bridge and a signal amplifier with operational amplifiers [1]. Because thesignal-conditioning stage for the MRE is still in the development phase, the signal-conditioning circuitswere tested as a single subsystem and without the signals generated by the MRE, but with an inputsignal coming from a strain-gauge array, as explained in Section 5.2. With the obtained outcomes,the signal-conditioning circuits were placed and welded onto a perforated phenolic plate and insidea protective case designed using computer-aided-design (CAD) software.
The protective case consisted of two parts—base and cover—which were attached and secured byholes filled with M3 screws. Moreover, fixed headers were added to the case to connect the conditioningcircuit to the CPU module and the strain-gauge terminals. The connection with the CPU module was a6-pin cable, providing −5 V, electrical ground, and +5 V inputs. The last 3 pins were analog outputs, ofwhich only 1 was used, while the others remained just for symmetry with the CPU case. The case wasmodelled in 3D with Autodesk Inventor. To manufacture the case, it was printed with polylactic acid(PLA) filament, and all components were stored inside it. The performed phenolic plate was attachedwith double-sided foam to the bottom of the case, and the data cables were fixed with glue at the sidesof the case. The CAD model and the manufactured prototype are shown in Figure 7.
Appl. Sci. 2020, 10, 4387 9 of 28
Figure 7. (a) Exploded isometric view of computer-aided design (CAD). (b) Prototype with all thesignal-conditioning elements.
3.1.2. Central Processing Unit (CPU)
The CPU is the subsystem that administrates the smart sensor. A commercial development boardWEMOS-D1-R1 was employed because it met all the sensor requirements, including power supply,input and output pins, microprocessor capabilities, and wireless-communication characteristics.
The Arduino UNO integrated development environment (IDE) was employed to programWEMOS-D1-R1 CPU. This open-source, cross-platform application was compatible with WEMOS-D1-R1,and supported all the necessary features for reading sensor data (programming the 10-bit resolutionanalog-to-digital converter (ADC), sampling frequencies up to 9600 Hz, and input-pin configuration),and for the communication with the wireless ESP8266 module for data transmission to the cloud.
For safety reasons, the CPU and its connections were placed in protective housing designed with3D Autodesk Inventor CAD software. The case was divided into 2 parts, base and top, which werejoined and secured by screws. Moreover, fixed headers were added to the case to easily interconnectthe CPU with the other modules. The connection between the CPU and the energy and harvestingsubsystems, which is explained in the following subsection, was a 3-pin cable, providing −5 V,electrical ground, and +5 V. For the sensor connection, the case had a 6-pin interface with the previouslymentioned electrical signals and 3 analog inputs (A0, A1, and A2). The CAD design and the physicalcircuits are shown in Figure 8.
Figure 8. Central processing unit (CPU) subsystem and communication interfaces. (a) Isometric CADview; (b) manufactured circuit.
Appl. Sci. 2020, 10, 4387 10 of 28
The next task was to manufacture the protective case with PLA material in a 3D printer and toassemble the components. The WEMOS board was secured with 4 screws attached to the bottom faceof the case that were locked with metallic nuts. The communication interfaces were set inside the caseaccording to the array of headers established during the case-design phase.
3.1.3. Wireless-Communication Module and Setup
Wi-Fi communication was developed to provide Internet capabilities to the smart sensor.Various wireless technologies were reviewed, and the most suitable approach was Wi-Fi technology;therefore, we implemented the ESP8266 Wi-Fi module to allow the CPU to communicate with onlineservices. The ESP8266 Wi-Fi board can be powered with a 5 to 24 V direct current (DC), and has acurrent consumption of 170 mA when transmitting data.
In general terms, communication handling includes some tasks as part of the configuration anddata processing. The Wi-Fi keeps the session open; thus, IP address requests are only made once.The Arduino program prepares data to be sent to the data-logging script, which forwards the receivedinformation to Google spreadsheets. During these tests, the Wi-Fi achieved a time of 2 s betweeneach posted lecture. As mentioned before, WEMOS-D1-R1 was programmed with the Arduino IDE.Moreover, the program developed in the Arduino IDE was also required to set the service-set-identifier(SSID) name and its respective password, and to specify the ID of the Google Script to define where toupload the processed data.
A crucial task during this setup was to obtain a fingerprint for the connection session.This fingerprint is generally static for each host, but there are some hosts, such as Google, that deliverfingerprints depending on location services. After the fingerprint was obtained, the program verifiedthat the certificate matched the Google server identification and started sending the collected datafrom the analog input pin. For the conducted experiment, an open-source terminal was employed(CygWin64).
The next step was to modify the data-logging script. The script for logging data into Googlespreadsheets was written in a Google Script language based on JavaScript. There were only two thingsthat were configured in this script, the desired spreadsheet ID, and the selected worksheet inside whichthe data were to be written.
3.1.4. Dashboard—Cloud Computing
Tests were carried out to store some strain readings in a Google spreadsheet. Data were saved in acomma-separated-values (CSV) file, and the gathered data from the sensor were stored and displayedin the spreadsheet. The script read the last saved row that contained information, and then receivedthe information package and provided the needed format to post counter, timestamp, measurement ID,and the raw value in a separate column. At the end of this action, the script increased its counter by 1so that the correct order was maintained in the spreadsheet.
The IoT approach has information distributed among platforms in order to have offline andonline data-analysis capabilities. For this purpose, the dashboard was implemented using the ClicData website to upload the data log from the Google spreadsheet to the cloud and display it on anonline dashboard.
The indicator-panel programming included graphs and numerical variables for the applicationand a chart. A line chart was selected to present the measured strain as a function of time. Moreover,the dashboard also included columns Strain Value for the section Value, Timestamp for the sectionDates, and ID for the section Series. The Click Data website provided all these options within thegraph settings, including an update of the displayed data every minute.
To present the results on the dashboard, configuration was carried out within the webpage.The users had to schedule the updating periods or updating cycles for each desired information panel.The shortest time lapse between updates that Clic Data managed was 1 min. The Google spreadsheetneeded to be updated along with the dashboard, so the same schedule was set. After displaying
Appl. Sci. 2020, 10, 4387 11 of 28
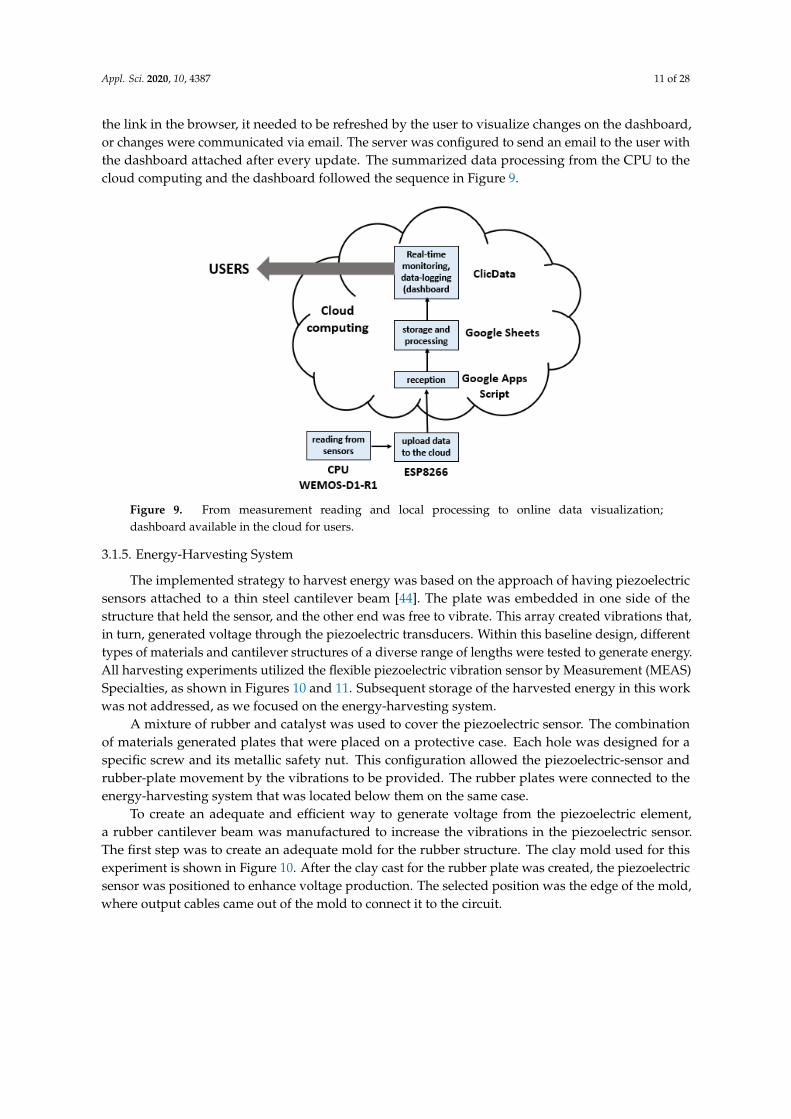
the link in the browser, it needed to be refreshed by the user to visualize changes on the dashboard,or changes were communicated via email. The server was configured to send an email to the user withthe dashboard attached after every update. The summarized data processing from the CPU to thecloud computing and the dashboard followed the sequence in Figure 9.
Figure 9. From measurement reading and local processing to online data visualization;dashboard available in the cloud for users.
3.1.5. Energy-Harvesting System
The implemented strategy to harvest energy was based on the approach of having piezoelectricsensors attached to a thin steel cantilever beam [44]. The plate was embedded in one side of thestructure that held the sensor, and the other end was free to vibrate. This array created vibrations that,in turn, generated voltage through the piezoelectric transducers. Within this baseline design, differenttypes of materials and cantilever structures of a diverse range of lengths were tested to generate energy.All harvesting experiments utilized the flexible piezoelectric vibration sensor by Measurement (MEAS)Specialties, as shown in Figures 10 and 11. Subsequent storage of the harvested energy in this workwas not addressed, as we focused on the energy-harvesting system.
A mixture of rubber and catalyst was used to cover the piezoelectric sensor. The combinationof materials generated plates that were placed on a protective case. Each hole was designed for aspecific screw and its metallic safety nut. This configuration allowed the piezoelectric-sensor andrubber-plate movement by the vibrations to be provided. The rubber plates were connected to theenergy-harvesting system that was located below them on the same case.
To create an adequate and efficient way to generate voltage from the piezoelectric element,a rubber cantilever beam was manufactured to increase the vibrations in the piezoelectric sensor.The first step was to create an adequate mold for the rubber structure. The clay mold used for thisexperiment is shown in Figure 10. After the clay cast for the rubber plate was created, the piezoelectricsensor was positioned to enhance voltage production. The selected position was the edge of the mold,where output cables came out of the mold to connect it to the circuit.
Appl. Sci. 2020, 10, 4387 12 of 28
Figure 10. Two implemented clay molds for rubber plates.
A rubber-based solution needs to have the correct amount of each component so that it can bepoured into the mold without having excess solution. This is very important due to the restrictionposed by the rubber plate’s width. If too much solution was poured into the mold, it would resultin an increase of the desired width of the rubber plate. After several tests, it was determined thatthe best components and quantities were white rubber and chemical catalyst, with a composition of80% rubber and 20% catalyst and a total mass of 20 g. The components were poured onto a Petri dishplaced on a digital balance to eliminate excess materials. After the masses were verified, elements weremixed with a sterile flat-end laboratory spatula.
Afterwards, the mixture was poured into the mold, maintaining a uniform mixture distributionaround the piezoelectric module to ensure that there was an equal amount of rubber around themodule to avoid incorrect performance. After the solution was poured, the mix in the mold neededaround 2 to 3 h to fully dry. When this process was completed, the rubber plate was taken out of
Appl. Sci. 2020, 10, 4387 13 of 28
the mold for the testing experiments. The mold when it was full of the mixture and the commercialpiezoelectric module is shown in Figure 11.
The harvesting system required a signal-conditioning stage to drive the gathered energy towardsthe sensor. Currently, proposals for gathering the generated energy from piezoelectric devices havebeen widely explored and solved, for example, see [45,46]. In this work, for the purpose of analysis,the output of the system, a simple circuit using a 1000 µF capacitor and a 1N4007 diode conditioned thevoltage signal as shown in Figure 12. The output voltage (Vout) was measured between the capacitorterminals that temporarily stored the generated energy.
Figure 12. Preliminary circuit to store and deliver harvested energy.
Figure 12 shows that the voltage that was produced by the piezoelectric sensors and temporarilystored in the capacitor passed through the circuit and fed the sensor’s batteries. The diode wasused to rectify half of the voltage that was going through the circuit. After the sinusoidal signal washalved when it went through the capacitor, it rectified the signal into an average of the signal voltage.This allowed the system to be charged by the voltage exiting the capacitor. To increase the amount ofharvested energy, we added two more piezoelectric sensors in parallel [44]. The improved solution isshown in Figure 13.
Figure 13. Improved circuit to store and deliver energy.
The next step was to design and implement a protective case for the energy-harvesting subsystem.The container was also designed in CAD software (3D Autodesk Inventor CAD) and 3D-printed withPLA technology. When the CAD was generated, it was ensured that the rubber plates were in contactwith the case to allow the piezoelectric sensor and rubber plate to take advantage of the vibrations andthereby increase the quantity of harvested energy. The case was designed with holes on the outsideof the box to tie the case to the chassis using belts. The CAD and manufactured solutions are shownin Figure 14.
The different subsystems of the smart sensor and the communication aspects between them wereinvestigated separately. The next step was to put all the parts together to create the complete prototype,as shown in Figure 15.
To validate the operation of the smart sensor, experiments were separately performed oneach subsystem. The following subsections explain the most important aspects regarding thevalidation tests.
4.1. Magnetorheological Elastomer
When the sample was cured, some electrical-resistance tests were carried out on the MRE sampleto verify if MWCNT-Fe particles increased the electrical conductivity. Electrical-resistance valueswithin a range from 500 kΩ to 10 MΩ were measured during the experiment; the results supported theuse of multiwall carbon nanotubes with iron (MWCNT-Fe) instead of iron (II and III) oxide nanopowder.This validation work considered some tension–compression tests with MRE reported in theliterature [47–49].
Appl. Sci. 2020, 10, 4387 15 of 28
An open-force-tester machine was used to measure the strain for MRE. The LYNX testing softwarefrom the machine measured the total applied force and the length by which the MRE could bestretched before becoming loose. For the setup, the machine was set at an initial position; then,the MRE was fixed into the open force tester—into the bottom and top sections of the center base of thetester—having been attached to measure resistance. The center base was where the test subjects wereplaced, with detachable lower and upper bases in order to adjust to the size of what was being tested.The bottom base was static, while the upper base was the one that moved upward and downward;for tension, it moved up. At the start, the LYNX software captured the force that was being applied tothe MRE while it was being stretched. At the same time, the program measured the elongating distance,and the multimeter read the electrical resistance. Twelve MRE samples were tested under tensionconsidering three different designs for each MRE (each with a different distribution of nanoparticles)to find which design exhibited the highest resistance measurement. With the gathered data, a graph ofapplied force vs electrical resistance was obtained. Tensile testing efforts included two replicas of thesame testing conditions to obtain more reliable results. The experimental setup for the tensile tests isshown in Figure 16.
Figure 16. Laboratory setup for MRE tensile tests.
Compression tests were also performed to validate the behavior of the electrical resistance of theMRE samples. In the laboratory, a hydraulic jack was used to apply force to a steel surface wherethe MRE samples were placed, resulting in their compression. The force applied by the hydraulicjack was measured with a dynamometer, and to register the measurements of electrical resistance.National Instruments (NI) Educational Laboratory Virtual Instrumentation Suite (NI ELVIS) II wasused with its multimeter function to measure electrical resistance. Measurements were taken anddisplayed in real time through a human–machine interface (HMI) in NI LabView. As performedwith the tensile testing, two replicas for the same testing conditions were registered to obtain morereliable results.
The gathered data were stored in an Excel file for additional processing. For the experiments,the three types of MRE samples in Figure 3 were tested. Each sample was fixed on a steel surface,and two crocodile clips connected the MRE sample to the data-acquisition (DAQ) system. With thissetup, a hydraulic jack was employed to apply the force to compress the MRE sample. The NI ELVISII took measurements of electrical resistance, and the HMI displayed the data in a waveform chart.When the test was finished, data were stored in an Excel spreadsheet. For the experiments, the appliedforce was in the range of 0 to 2250 N in steps of 250 N, with a total test duration of approximately 80 s.The compression-test equipment, including data acquisition, is shown in Figure 17.
Appl. Sci. 2020, 10, 4387 16 of 28
Figure 17. Laboratory setup for compression tests. Figures modified from [40].
4.2. Energy Harvesting—Preliminary Tests
To determine the most efficient way for the rubber plates to generate a voltage, certain tests wereperformed in the lab. For this analysis, the employed machine was able to vary the frequency of theapplied input.
For the experiments, the rubber plate had a length of 8 cm, and the machine was set to vibratein a frequency range from 4 to 9 Hz (in steps of 1 Hz), spending 35 s in each frequency attempt.The purpose of using several frequencies was to find a frequency that would generate the highestamount. For each sample, the test was done three times to avoid relying on just one test. After thethree tests were completed, the length of the rubber plate was reduced to 7.5 cm. Different lengths andfrequencies were tested with the aim of finding the combination that harvested the highest amount ofenergy. For each frequency range and the three tests per length, the length of the rubber plate wasdecreased to 5.5 cm (in steps of 0.5 cm).
Figure 18 shows that the rubber plate was placed beneath a metal structure and on the edge ofthe vibration machine to enable the rubber plate to move freely. The circuit was connected to a DAQsystem and a human–machine interface (HMI) developed using the National Instruments LabViewsoftware. The HMI had the option to export the data to an Excel spreadsheet. Further analyses in Excelallowed for the length and frequency combination that produced the highest voltage to be determined.
Appl. Sci. 2020, 10, 4387 17 of 28
Figure 18. Experimental setup for energy harvesting: rubber plate and vibrating testing machine at thelab. Figure taken from [39].
4.3. Datalogging Tests—Information in the Cloud
Tests were carried out to store strain readings in a Google spreadsheet. Data were saved in acomma-separated-values (CSV) file, and the gathered data from the sensor were stored and displayedin the spreadsheet. The process worked as follows: the script read the last saved row with information;then, it received the package of information and provided the needed format to post counter, timestamp,measurement ID, and the raw value in a separate column. At the end of this action, the script increasedits counter by 1 to maintain the correct order in the spreadsheet. An example of a test where the sensorreading was sent and stored in a Google spreadsheet is shown in Figure 19.
Figure 19. Google spreadsheet with 11 readings (stored in the cloud) coming from the smartstrain sensor.
The implemented panel depicted the average strain measured by the smart sensor. During thedashboard-development process, certain tests were carried out to validate the displayed data.Important features of the dashboard and the displayed data during the tests are shown in Figure 20.
Appl. Sci. 2020, 10, 4387 18 of 28
Figure 20. Graph settings for the implemented dashboard. Figure modified from [39].
5. Results
This section presents the results of the performed tests on the MRE, the energy-harvesting systems,and the information processed and shared on applications over the Internet.
5.1. Tensile and Compression Results
For each of the three designed and manufactured MRE patterns, tensile and compressionexperiments were performed, and the setup is described in Section 3. For the tensile test, this wascarried out for two different instances of the same MRE arrays. Therefore, two results (Replicas 1and 2) were obtained, as shown in Figure 21.
Figure 21. Tensile tests. Electrical resistance vs applied force for three manufactured MRE transducersshown in Figure 3. For each transducer, two tests were carried out (Replicas 1 and 2). (a) Four lines inparallel; (b) four lines in 90; and (c) three lines in 90/45.
Appl. Sci. 2020, 10, 4387 19 of 28
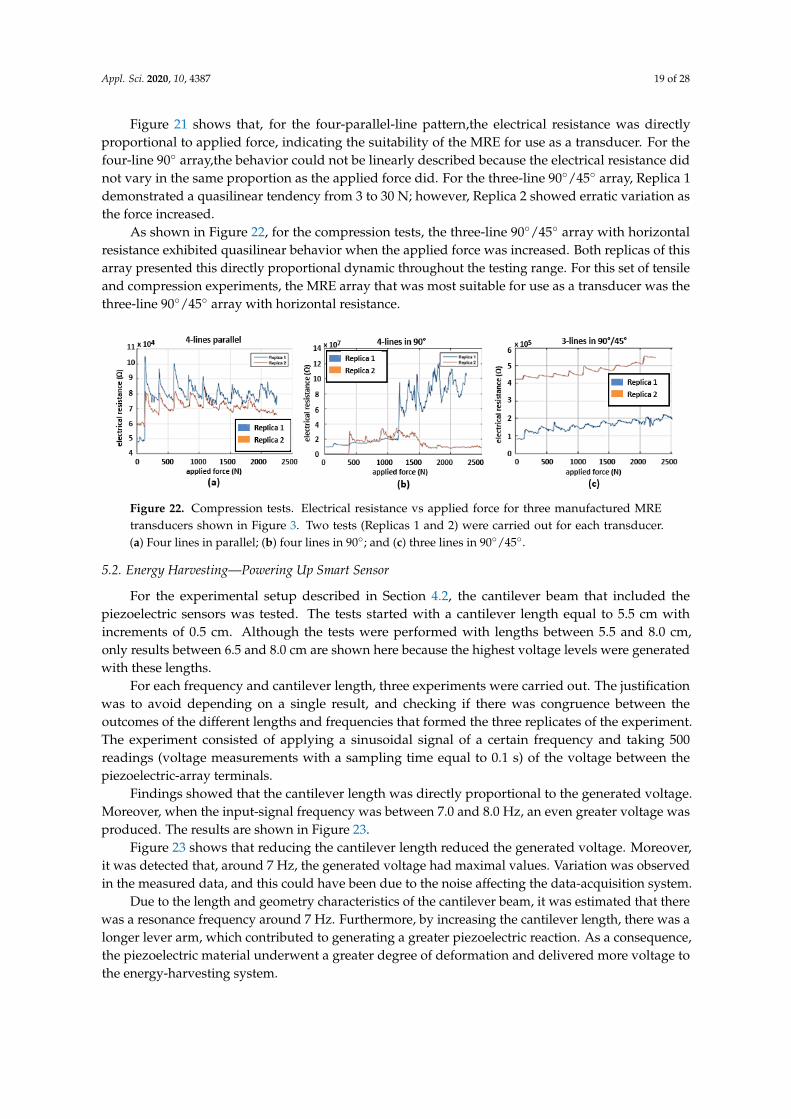
Figure 21 shows that, for the four-parallel-line pattern,the electrical resistance was directlyproportional to applied force, indicating the suitability of the MRE for use as a transducer. For thefour-line 90 array,the behavior could not be linearly described because the electrical resistance didnot vary in the same proportion as the applied force did. For the three-line 90/45 array, Replica 1demonstrated a quasilinear tendency from 3 to 30 N; however, Replica 2 showed erratic variation asthe force increased.
As shown in Figure 22, for the compression tests, the three-line 90/45 array with horizontalresistance exhibited quasilinear behavior when the applied force was increased. Both replicas of thisarray presented this directly proportional dynamic throughout the testing range. For this set of tensileand compression experiments, the MRE array that was most suitable for use as a transducer was thethree-line 90/45 array with horizontal resistance.
Figure 22. Compression tests. Electrical resistance vs applied force for three manufactured MREtransducers shown in Figure 3. Two tests (Replicas 1 and 2) were carried out for each transducer.(a) Four lines in parallel; (b) four lines in 90; and (c) three lines in 90/45.
5.2. Energy Harvesting—Powering Up Smart Sensor
For the experimental setup described in Section 4.2, the cantilever beam that included thepiezoelectric sensors was tested. The tests started with a cantilever length equal to 5.5 cm withincrements of 0.5 cm. Although the tests were performed with lengths between 5.5 and 8.0 cm,only results between 6.5 and 8.0 cm are shown here because the highest voltage levels were generatedwith these lengths.
For each frequency and cantilever length, three experiments were carried out. The justificationwas to avoid depending on a single result, and checking if there was congruence between theoutcomes of the different lengths and frequencies that formed the three replicates of the experiment.The experiment consisted of applying a sinusoidal signal of a certain frequency and taking 500readings (voltage measurements with a sampling time equal to 0.1 s) of the voltage between thepiezoelectric-array terminals.
Findings showed that the cantilever length was directly proportional to the generated voltage.Moreover, when the input-signal frequency was between 7.0 and 8.0 Hz, an even greater voltage wasproduced. The results are shown in Figure 23.
Figure 23 shows that reducing the cantilever length reduced the generated voltage. Moreover,it was detected that, around 7 Hz, the generated voltage had maximal values. Variation was observedin the measured data, and this could have been due to the noise affecting the data-acquisition system.
Due to the length and geometry characteristics of the cantilever beam, it was estimated that therewas a resonance frequency around 7 Hz. Furthermore, by increasing the cantilever length, there was alonger lever arm, which contributed to generating a greater piezoelectric reaction. As a consequence,the piezoelectric material underwent a greater degree of deformation and delivered more voltage tothe energy-harvesting system.
Appl. Sci. 2020, 10, 4387 20 of 28
Figure 23. Generated voltage for different cantilever-beam lengths. Three replicas were applied foreach test (length and frequency), and 500 measurements were gathered per tested frequency: (a) 6.5 cm;(b) 7.0 cm; (c) 7.5 cm; and (d) 8.0 cm.
For each of the 3 experiments carried out, the cantilever length was set and a signal was appliedso that the metallic beam started to vibrate. Considering the length and frequency ranges specifiedin Section 4.2, for each replica, the results of the series of experiments are depicted in Figures 24–26.Of the three experiments, the maximum generated voltage occurred when the cantilever beam lengthwas 7.5 cm and the excitation signal had a frequency equal to 8.0 Hz.
Length [cm] Frequency [Hz]
Vo
ltag
e [V
]
Maximum 1.652 V
at 8 Hz and 7.5cm
Figure 24. Energy harvesting for Replica 1. The maximum generated voltage was 1.625 V.
Appl. Sci. 2020, 10, 4387 21 of 28
Length [cm] Frequency [Hz]
Vo
ltag
e [V
]
Maximum 1.621 V
at 8 Hz and 7.5cm
Figure 25. Energy harvesting for Replica 2. The maximum generated voltage was 1.621 V.
Length [cm] Frequency [Hz]
Vo
ltag
e [V
]
Maximum 1.487 V
at 8 Hz and 7.5cm
Figure 26. Energy harvesting for Replica 3. The maximum generated voltage was 1.487 V.
The energy harvesting outcomes, which are depicted in Figures 24–26, were concentrated in the2D graphs shown in Figure 27. The graph of the generated voltage, which is function of the beamlength and the input signal frequency, shows the maximum generated voltage with an input signalaround 8.0 Hz and with a length equal to 7.5 cm. For all the tests run, these two combinations ofindependent variables contributed to harvest the highest amount of energy with values between 1.20and 1.625 V.
The generated voltage by the cantilever beam went through a diode for rectification, and it wastemporarily stored in a capacitor. For the performed tests, the Vout obtained from the best result inFigure 23 is illustrated in Figure 28.
Because the energy-harvesting system was not able to generate sufficient voltage to power up thesensor, and there were only preliminary results for the MRE transducer regarding signal conditioning,the presented outcomes that measured strain inputs and sent them to the dashboard on a website
Appl. Sci. 2020, 10, 4387 22 of 28
were completed on the basis of a strain-gauge sensor with a Wheatstone bridge and a signal amplifier.Moreover, the executed tests for the dashboard considered a powered-up smart sensor with a regularlaboratory power supply.
For this experiment, a commercial rosette-array strain gauge arrangement SGD-6/350-RYT21 byOmega Engineering was employed (Figure 29). The strain gauge was used to measure the strain inthe area subjected to deformation by the application of force. To successfully install the strain gauges,there was a preparation and installation process, and for this experiment, an installation kit for straingauges was employed. It is outside the scope of this report to describe the materials and cementingprocess regarding the strain-gauge transducer.
Figure 27. Energy-harvesting tests for the implemented piezoelectric system. (a) Replica 1; (b) Replica 2;and (c) Replica 3.
Due to the nature of strain gauges, signal conditioning is usually required to read the outputsignal and to send it to the CPU. To solve this problem, two circuits were implemented, a Wheatstonebridge and a signal amplifier with operational amplifiers. As part of the design effort, both circuitswere simulated in the Proteus Design Suite to validate their functioning.
A Wheatstone bridge circuit is typically employed to measure the difference in electrical resistanceof a strain gauge when a force is applied on the surface where the strain gauge is located. This type ofcircuit needs a power supply to excite the circuit, and an output voltage signal that is proportional tothe applied force is produced. For this research, just one strain gauge of the 0/45/90 three-elementstrain rosette was used to measure uniaxial stress. The utilized Wheatstone bridge configuration wasthe quarter-bridge three-wire array. This array with one strain gauge and three resistors with the sameelectrical resistance value (350 Ω in this instance, cancels the thermal effects generated for the leadwires. The second circuit that constituted the signal-conditioning section was a differential amplifierto increase the voltage. The voltage signal coming from the Wheatstone bridge was in the order of
Appl. Sci. 2020, 10, 4387 23 of 28
mV, and it had to be amplified to be read by the microcontroller. The employed operational amplifierwas the LM741 integrated circuit powered with −5 and 5 V to keep the amplified voltage withinthese limits. After the preliminary tests, the signal-conditioning circuits were placed and weldedonto a perforated phenolic plate and inside a protective case designed using computer-aided-design(CAD) software. For more information on Wheatstone bridges and signal conditioning (amplification),refer to [1,2].
Figure 28. Measured output voltage (Vout) for a 7.5 cm length cantilever beam with three piezoelectricsensors, as shown in Figure 13. Three samples were applied for each test (length and frequency).Small black numbers, accumulated voltage measurements.
Figure 29. Rectangular rosette 0/45/90 strain-gauge array; model: SGD-6/350-RYT21; 350 Ω ofnominal resistance, 16.3 mm per side with a gauge factor of 2.13.
5.3. Dashboard—Towards an IoT approach
The dashboard was able to show the information obtained by a Google spreadsheet, and the datain the graph were refreshed every minute. The line chart with the average strain over time is depictedin Figure 20.
6. Discussion
This study provided important knowledge with regard to the manufacturing process of MREtransducers and the addition of nanoparticles. Experimental tests were performed to cure the MRElayers. Some of them did not work, and acceptable results were obtained when both layers were cured,and the nanoparticles were added in the correct proportion. Furthermore, the mold max 30 siliconerubber with its catalyst worked well for the 3D printing of MRE molds. It was crucial to keep in mindthe goal of replacing the strain-gauge transducer with an MRE transducer.
After several tests, the composition of 90% silicone rubber and 10% catalyst generated asatisfactory result; on that basis, the nanoparticles were included in the MRE. The initial tests werecarried out with iron (II and III) oxide nanopowder, but the relationship between strain and electrical
Appl. Sci. 2020, 10, 4387 24 of 28
resistance was not proportional to allow strain measurement, so it was decided to use multiwall carbonnanotubes with iron, and the experiment delivered satisfactory results. Regarding the ratio of siliconerubber and multiwall carbon particles, the ratio of 97% silicone rubber (ratio 10:1 of silicone rubberand catalyst) and 3% MWCNT-Fe particles presented satisfactory electrical-resistance characteristics,as shown in Figures 21 and 22.
On the basis of the MRE transducer results, from the tensile tests in Figure 21, for the four-lineparallel lines pattern, the replicas showed similar behavior. At the beginning of the test, a lineartendency was observed, but the slopes of the graphs were different. The rate of resistance change washigher in Replica 2 than that in Replica 1. For the 90-degree array, similarity between the two replicaswas observed. The behavior could not be linearly described because, in Replica 2, electrical resistancedid not vary as much as that in Replica 1 did. For the 45-degree array, Replica 1 had an almost perfectlylinear tendency throughout the whole test. However, Replica 2 showed an increase in resistance as theforce went up, but some noise was present from 5 to 35 N.
According to the results of the compression tests shown in Figure 22, a high increase in electricalresistance was instantly observed when the load was applied; then, it declined as the system remainedat rest. This behavior was detected for all arrays and with both replicas. Moreover, Replica 1 ofthe 90-degree array showed the most straightforward relation between applied force and electricalresistance before crossing the 1000 N border. Electrical resistance technically remained the same whenthe load was static. For the horizontal resistance of the 45-degree array, Replicas 1 and 2 showed almostequal behavior, although there was an offset between the two responses. A possible justification forthis is that the base resistance of each was different, but the increasing steps were similar. In addition,there was some noise in the output resistance when the forces were applied; however, variation wasvery low and output resistance could be considered as being at a constant value throughout theforce-step increase.
The observed results in Figures 21 and 22 were dependent on the hands-on manufacturingof the MRE transducers. The MREs were manually manufactured without following rigorousindustrial standards, and this led to variations in the electrical resistance. For example, distributionof the multiwall carbon nanotubes with iron (MWCNT-Fe) following the guidelines in Figure 5 wasnot the same in all three lines, and this affected the relationship between electrical resistance andapplied force. Additionally, by measuring the electrical resistance with a multimeter instead of usingspecialized electrodes, variations in the readings could have been generated. These peculiarities inMRE construction were part of the behavior of the prototypes.
With regard to the energy-harvesting tests with the piezoelectric sensor merged with a cantileverbeam, data in Figure 27 show that the cantilever with a 7.5 cm length generated the highest voltagelevels when the input signal had frequencies of 7 and 8 Hz. Under these conditions, the piezoelectricarray was able to generate 1.60 V, which was the highest obtained voltage. The experimental trialsincluded testing with an array of three piezoelectric transducers in parallel (Figure 13), and thisconfiguration allowed for generation of a greater voltage than that generated with a single piezoelectricelement. The detected opportunity area was the signal-conditioning circuit with the diode and capacitor.The required voltage to energize both elements was too high compared to the voltage generated bythe cantilever, and all the collected energy was lost. Although the voltage signals contained noise,a decrease or increase in voltage was observed for the different experiments, and, owing to thatbehavior, preliminary conclusions could be generated. Moreover, having generated similar maximumvoltage values for the testing conditions contributes to the reproducibility of the experiments.
Even though the complete prototype was tested with a strain-gauge transducer and poweredup with a power supply, the results were promising and reinforced two research lines in smartsensors—how to increase the collected energy in a cantilever beam with embedded piezoelectricsensors, and how to reduce the required energy to rectify and retain the gathered voltage for furtherstorage in the smart sensor.
Appl. Sci. 2020, 10, 4387 25 of 28
For the CPU, wireless communication, and IoT capabilities, this study offers a manner of passingthe data of the smart-sensor subsystems and data post-processing to cloud computing. For thetests, decisions were made regarding the CPU, and the best option was WEMOS-D1-R1, which wasprogrammed in the familiar Arduino development environment. The ESP8266 Wi-Fi module was theimplemented wireless approach, which was compatible with the WEMOS-D1-R1 through the Arduinointegrated development environment. Moreover, IoT capabilities included the revision of commercialoptions to send data to the cloud, store them in Google sheets, and display them on a dashboarddeveloped in ClicData software.
The complete prototype (Figure 15) included the design and manufacture of protective cases andthe communication connection among the subsystems. Although these last two activities were notthe contribution of this research, they were also important due to the time dedicated to design and tomanufacture the complete prototype of the smart sensor.
7. Conclusions and Future Work
A low-cost macro-smart-sensor prototype manufactured with commercial technology,connected to the Internet for strain monitoring on metallic surfaces, was designed and fabricated.An alternative approach for well known and applied strain gauges was manufactured, i.e., an MRelastomer, which responded with electrical-resistance variation when force was applied to it. Moreover,the research outcomes included preliminary but relevant results on energy harvesting, and completetests with a smart sensor that included IoT capabilities.
An energy-harvesting system was explored. The research objective included the design andmanufacture of a beam in cantilever-containing piezoelectric sensors fused in a special rubber.The system demonstrated that it was able to generate up to 1.6 V under the employed testing conditions;however, there was a strong opportunity area regarding voltage rectification and holding.
The benefits of processing data in the cloud and presenting them graphically on the Internet werealso shown. The dashboard was able to show the obtained information from the Google spreadsheet,connected to the smart sensor via a wireless protocol through the Internet, and taking only one minuteto refresh the data on the dashboard.
Preliminary results showed the potential of this smart sensor for health monitoring in theautomotive, aeronautical, and construction industries. For these applications, smart sensors couldbe embedded in structures, and thus constantly monitor the state of the system and detect potentialfailure conditions.
The prototype presented areas of opportunity for improvement. Better control to create MRelastomer samples and maintain a uniform number of nanoparticles could be tested. Moreover,the amount and array of nanoparticles could be improved to obtain a more linear and directlyproportional relation between MRE strain and electrical resistance. The energy-harvesting system couldalso have a better design, and different cantilever geometric shapes could be tested to harvest moreenergy from the environment. Another area of opportunity was detected in the validation experiments,since some measurements were made with a multimeter. This condition could be improved by usingembedded electrodes in the cantilever or the MRE to measure electrical resistance or generated voltagefollowing another sensing paradigm.
As future work, a potential research direction is to increase the harvested energy, and improvevoltage rectification and holding efficiency. In this context, noise in the voltage measurements offersan opportunity for improvement. A possible solution would be to apply a low-pass filter or to employelectrodes for measuring electrical resistance in the MRE. The latter option was studied with dielectricelastomer sensors that had two electrodes and showed the potential to be applied in SHM and robotics,among others [50].
In addition, the signal-conditioning stage needs to be implemented. An option is to connectelectrodes to the MRE and process the signal to make it suitable for the CPU. Other potentialwork is comparing the smart sensor with other approaches that could be developed (to the best
Appl. Sci. 2020, 10, 4387 26 of 28
of authors’ knowledge, there is no reported product with similar attributes to the one we havereported). Additionally, after improving the characteristics and capabilities of the prototype,a digital twin could be generated to complement the monitoring and diagnoses of the system.The experiment-validation results highlighted the potential of the smart-sensor for use in diversestructural-health-monitoring applications.
Author Contributions: Conceptualization and design, J.d.-J.L.-S.; experiment development and validation-testtutoring, J.d.-J.L.-S., J.C.T.-M., and R.-A.R.-M.; state-of-the-art revision update and original-draft writing, L.C.F.-H.;paper writing—revision and editing, A.V.-M. and R.A.R.-M. All authors have read and agreed to the publishedversion of the manuscript.
Funding: Authors are grateful to Tecnologico de Monterrey, through Campus City Research and Technology forfunding the publication cost of this research.
Acknowledgments: The authors are grateful to Universidad de Monterrey, through the Center for Innovation inthe Design of Packaging, ABRE for allowing the tensile, compression, and energy-harvesting tests to be carried outin its laboratories. Moreover, the authors would like to thank all the undergraduate students for their participationand commitment to carrying out the experiment work of this research. The authors are also grateful to the Metalsacompany for its collaboration in carrying out this work.
Conflicts of Interest: The authors declare no conflict of interest.
References
1. Alciatore, D.G.; Histand, M.B. Sensors. In Mechatronics and Measurement Systems; McGraw-Hill: New York,NY, USA, 2007; pp. 354–361.
2. Doebelin, E.O. Force, Torque, and Shaft Power Measurement. In Measurement Systems: Application and Design;McGraw-Hill Education: London, UK, 2003; pp. 446–451.
3. Perales-Martínez, I.A.; Palacios-Pineda, L.M.; Lozano-Sánchez, L.M.; Martínez-Romero, O.;Puente-Cordova, J.G.; Elías-Zúñiga, A. Enhancement of a magnetorheological PDMS elastomer with carbonyliron particles. Polym. Test. 2017, 57, 78–86. [CrossRef]
4. Li, W.H.; Zhang, X.Z.; Du, H. Magnetorheological elastomers and their applications. In Advances in ElastomersI: Blends and Interpenetrating Networks; Visakh, P.M., Thomas, S., Chandra, A.K., Mathew, A.P., Eds.; Springer:Berlin, Germany, 2013; pp. 357–374.
5. Liu, T.; Xu, Y. Magnetorheological Elastomers: Materials and Applications. In Smart and Functional SoftMaterials; Dong, X., Ed.; IntechOpen: Berlin, Germany, 2019; pp. 3–23.
6. Kumbhar, S.R.; Maji, S.; Kumar, B. Dynamic mechanical analysis of Magnetorheological Elastomer.In Proceedings of the 2013 International Conference on Energy Efficient Technologies for Sustainability,Nagercoil, India, 10–12 April 2013; pp. 870–873.
7. Li, Y.; Li, J.; Li, W.; Du, H. A state-of-the-art review on magnetorheological elastomer devices.Smart Mater. Struct. 2014, 23, 1–24. [CrossRef]
8. Beeby, S.P.; Tudor, M.J.; White, N.M. Energy harvesting vibration sources for microsystems applications.Meas. Sci. Technol. 2006, 17, 1455–1556. [CrossRef]
9. Nayan, H. Power generation using piezoelectric material. J. Mater. Sci. Eng. 2015, 4, 1–4.10. Lopes, C.M.A.; Gallo, C.A. A review of piezoelectrical energy harvesting and applications. In Proceedings of
the 2014 IEEE 23rd International Symposium on Industrial Electronics (ISIE), Istanbul, Turkey, 1–4 June 2014;pp. 1284–1288.
11. Zheng, J.C.; Ruan, T.; Zhu, M.; Marise Bafleur, M.; Dilhac, J.-M. Single Piezoelectric Transducer as StrainSensor and Energy Harvester Using Time-Multiplexing Operation. IEEE Trans. Ind. Electr. 2017, 64, 9646–9656.
12. Shirvanimoghaddam, M.; Shirvanimoghaddam, K.; Abolhasani, M.M.; Farhangi, M.; Barsari, V.Z.; Liu, H.;Dohler, M.; Naebe, M. Towards a Green and Self-Powered Internet of Things Using Piezoelectric EnergyHarvesting. IEEE Access 2019, 7, 94533–94556. [CrossRef]
13. Mo, C.; Davidson, J. Energy harvesting technologies for structural health monitoring applications.In Proceedings of the 2013 1st IEEE Conference on Technologies for Sustainability (SusTech), Portland,OR, USA, 1–2 August 2013; pp. 192–198.
14. Dahkar, L. Overview of Energy Harvesting Technologies. In Triboelectric Devices for Power Generation andSelf-Powered Sensing Applications; Springer: Singapore, 2017; pp. 9–34.
15. Silva, A.F.; Mendes, P.M.; Correia, J.H.; Goncalves, F.; Ferreira, L.A.; Araujo, F.M. Inner car smart flooringfor monitoring chassis deformation. In Proceedings of the IEEE Sensors, Christchurch, New Zealand,25–28 October 2009; pp. 1584–1587.
16. Perelli, A.; Caione, C.; De Marchi, L.; Brunelli, D.; Marzani, A.; Benini, L. Design of an ultra-low powerdevice for aircraft structural health monitoring. In Proceedings of the 2013 Design, Automation & Test inEurope Conference & Exhibition (DATE), Grenoble, France, 18–22 March 2013; pp. 1127–1130.
17. Liu, F.; Xiao, L.; Peng, J.; Yang, X. Visual monitoring research of airfoil structural based on virtual testtechnology. In Proceedings of the 2015 IEEE International Conference on Mechatronics and Automation(ICMA), Beijing, China, 2–5 August 2015; pp. 600–605.
18. Leong, Z.; Al-Taher, A.; Chan, L.; Walters, N.; McGahan, M.; Hayes, S.; Lupu, N.; Murgulescu, I.; Morley, N.Structural Health Monitoring using Magnetostrictive Sensors. In Proceedings of the 2017 IEEE InternationalMagnetics Conference (INTERMAG), Dublin, Ireland, 24–28 April 2017; pp. 1–5.
19. Dong, T.; Kim, N.H. Cost-Effectiveness of Structural Health Monitoring in Fuselage Maintenance of the CivilAviation Industry. Aerospace 2018, 5, 87. [CrossRef]
21. Aziz, S.A.A.; Mazlan, S.A.; Ismail, N.I.N.; Choi, S.-B.; Ubaidillah; Yunus, N.A.B. An enhancement ofmechanical and rheological properties of magnetorheological elastomer with multiwall carbon nanotubes.J. Intell. Mater. Syst. Struct. 2017, 28, 3127–3138. [CrossRef]
22. Liu, H.; Zhong, J.; Lee, C.; Lee, S.-W.; Lin, L. A comprehensive review on piezoelectric energy harvestingtechnology: Materials, mechanisms, and applications. Appl. Phys. Rev. 2018, 5, 041306. [CrossRef]
23. Li, H.; Tian, C.; Deng, Z.D. Energy harvesting from low frequency applications using piezoelectric materials.Appl. Phys. Rev., 2014, 1, 041301. [CrossRef]
24. Safaei, M.; Sodano, H.A.; Anton, S.R. A review of energy harvesting using piezoelectric materials:State-of-the-art a decade later (2008–2018). Smart Mater. Struct. 2019, 28, 113001. [CrossRef]
25. Pozo, B.; Garate, J.I.; Araujo, J.Á.; Ferreiro, S. Energy Harvesting Technologies and Equivalent ElectronicStructural Models. Electronics 2019, 8, 486. [CrossRef]
26. Kim, H.S.; Kim, J.H.; Kim, J. A review of piezoelectric energy harvesting based on vibration. Int. J. Precis.Eng. Manuf. 2011, 12, 1129–1141. [CrossRef]
27. Chen, Z.S.; Yang, Y.M.; Deng, G.Q. Analytical and experimental study on vibration energy harvestingbehaviors of piezoelectric cantilevers with different geometries. In Proceedings of the 2009 InternationalConference on Sustainable Power Generation and Supply, Nanjing, China, 6–7 April 2009; pp. 1–6.
28. Uddin, M.N.; Islam, M.S.; Sampe, J.; Wahab, S.A.; Ali, S.H.M. Vibration based T-shaped piezoelectriccantilever beam design using finite element method for energy harvesting devices. In Proceedings ofthe 2016 IEEE International Conference on Semiconductor Electronics (ICSE), Kuala Lumpur, Malaysia,17–19 August 2016; pp. 137–140.
29. Kuwano, H.; Van Minh, L.; Nguyen, H.H.; Asanuma, H.; Oguchi, H. Vibration-driven micro energyharvesting with piezoelectric materials. In Proceedings of the 2018 IEEE/ASME International Conference onAdvanced Intelligent Mechatronics (AIM), Auckland, New Zealand, 9–12 July 2018; pp. 395–400.
30. Reddy, A.R.; Umaphaty, M.; Ezhilarasi, D.; Gandhi, U. Improved energy harvesting from vibration byintroducing cavity in a cantilever beam. J. Vib. Control 2016, 22, 3057–3066. [CrossRef]
32. Xu, J.; Tang, J. Modeling and analysis of piezoelectric cantilever-pendulum system for multi-directionalenergy harvesting. J. Intell. Mater. Syst. Struct. 2017, 28, 323–338. [CrossRef]
33. Gebresenbet, G.; Aradom, S.; Bulitta, F.S.; Hjerpe, E. Vibration levels and frequencies on vehicle and animalsduring transport. Biosyst. Eng. 2011, 110, 10–19. [CrossRef]
34. Yan, S.; Ma, H.; Li, P.; Song, G.; Wu, J. Development and Application of a Structural Health MonitoringSystem Based on Wireless Smart Aggregates. Sensors 2017, 17, 1641. [CrossRef]
35. Rekha, K.S.; Sreenivas, T.H.; Kulkarni, A.D. Remote Monitoring and Reconfiguration of Environment andStructural Health Using Wireless Sensor Networks. J. Intell. Mater. Syst. Struct. 2018, 5, 1169–1175. [CrossRef]
36. Alonso, L.; Barbarán, J.; Chen, J.; Díaz, M.; Llopis, L.; Rubio, B. Middleware and communication technologiesfor structural health monitoring of critical infrastructures: A survey. Comput. Stand. Interfaces 2017, 56,83–100. [CrossRef]
37. Fu, Y.; Mechitov, K.; Hoang, T.; Kim, J.R.; Lee, D.H.; Spencer, B.F., Jr. Development and full-scale validationof high-fidelity data acquisition on a next-generation wireless smart sensor platform. Adv. Struct. Eng. 2019,22, 3512–3533. [CrossRef]
38. Masoud, M.; Jaradat, Y.; Manasrah, A.; Jannoud, I. Sensors of Smart Devices in the Internet of Everything(IoE) Era: Big Opportunities and Massive Doubts. J. Sens. 2019, 2019, 1–26. [CrossRef]
39. Lozoya-Santos, J.d.-J.; Tudón-Martínez, J.C.; Vargas Martinez, A.; Morales Menendez, R.;Ramírez-Mendoza, R.A. A smart sensor for the measurements of strain and vibrations: A work in progress.In Proceedings of the SPIE 10967: Active and Passive Smart Structures and Integrated Systems XIII 109672B,Denver, CO, USA, 21 March 2019; pp. 1–7.
40. De Lozoya-Santos, J.-J.; Vargas Martinez, A.; Tudón-Martínez, J.C.; Morales Menendez, R.;Ramírez-Mendoza, R.A.; Roman-Flores, A. Smart elastomers for the sensing of force and vibration: A proofof Concept. In Proceedings of the 30th International Conference on Adaptive Structures and Technologies(ICAST2019), Montreal, QC, Canada, 7–11 October 2019.
41. Yarra, S.; Gordaninejad, F.; Behrooz, M.; Pekcan, G. Performance of natural rubber and silicone-basedmagnetorheological elastomers under large-strain combined axial and shear loading. J. Intell. Mater.Syst. Struct. 2018, 30, 1–15. [CrossRef]
42. Rezaie, E.; Hajalilou, A.; Rezanezhad, A.; Abouzari-Lotf, E.; Arsalani, N. Magnetorheological studies ofpolymer nanocomposites. In Rheology of Polymer Blends and Nanocomposites: Theory, Modelling and Applications;Sabu, T., Sarathchandran C., Nithin C., Eds.; Elsevier: Amsterdam, The Netherlands, 2020; pp. 263–294.
43. CTR Scientific. Monterrey, Nuevo León, México. Available online: www.ctr.com.mx (accessed on 10 January2020).
44. Castagnetti, D. Comparison Between a Wideband Fractal-Inspired and a Traditional MulticantileverPiezoelectric Energy Converter. J. Vib. Acoust. 2014, 137, 1–7. [CrossRef]
45. Chen, C.H.; Chen, H.C.; Huang, Y.S.; Hsieh, P.H.; Wu, P.H.; Shu, Y.C. A series-SSHI-Phi interface circuit forpiezoelectric energy harvesting with 163% improvement in extracted power at off-resonance. In Proceedingsof the 2016 IEEE Asian Solid-State Circuits Conference (A-SSCC), Toyama, Japan, 7–9 November 2016;pp. 29–32.
46. Chen, B. Introduction to energy harvesting transducers and their power conditioning circuits Low-PowerAnalog Techniques. In Sensors for Mobile Devices, and Energy Efficient Amplifiers; Springer: Cham, Switzerland,2019; pp. 3–12.
47. Norouzi, M.; Gilani, M.; Sajjadi Alehashem, S.M.; Vatandoost, H. Dynamic Characterization and Modelingof Isotropic Magnetorheological Elastomers Under Tensile-Compressive Loadings. IEEE Trans. Magnet. 2017,53, 1–12. [CrossRef]
48. Kukla, M.; Górecki, J.; Malujda, I.; Talaska, K.; Tarkowski, P. The Determination of Mechanical Properties ofMagnetorheological Elastomers (MREs). Procedia Eng. 2017, 177, 324–330. [CrossRef]
49. Schubert, G.; Harrison, P. Large-strain behavior of Magneto-Rheological Elastomers tested under uniaxialcompression and tension, and pure shear deformations. Polym. Test. 2015, 42, 122–134. [CrossRef]
50. Ni, N.; Zhang, L. Dielectric Elastomer Sensors. In Elastomers; Çankaya, N., Ed.; IntechOpen: Rijeka, Croatia,2017; pp. 231–253.