Appendix A: Thermodynamics of the Electrochemical Energy Conversion ..................... 209
Appendix B: Matlab® Code for Plotting the Polarisation Curve ........................................ 218
Appendix C: Major Components of the Test Facility ........................................................ 220
vii
Table of Figures
Figure 1-1 World Primary Energy Consumption by Fuel Type, 1970-2025 .................. 1
Figure 1-2 Pressure-Volume diagram of a combustion cycle and Carnot efficiency ....... 5
Figure 2-1 Exploded View of a PEM fuel cell stack ...................................................... 14
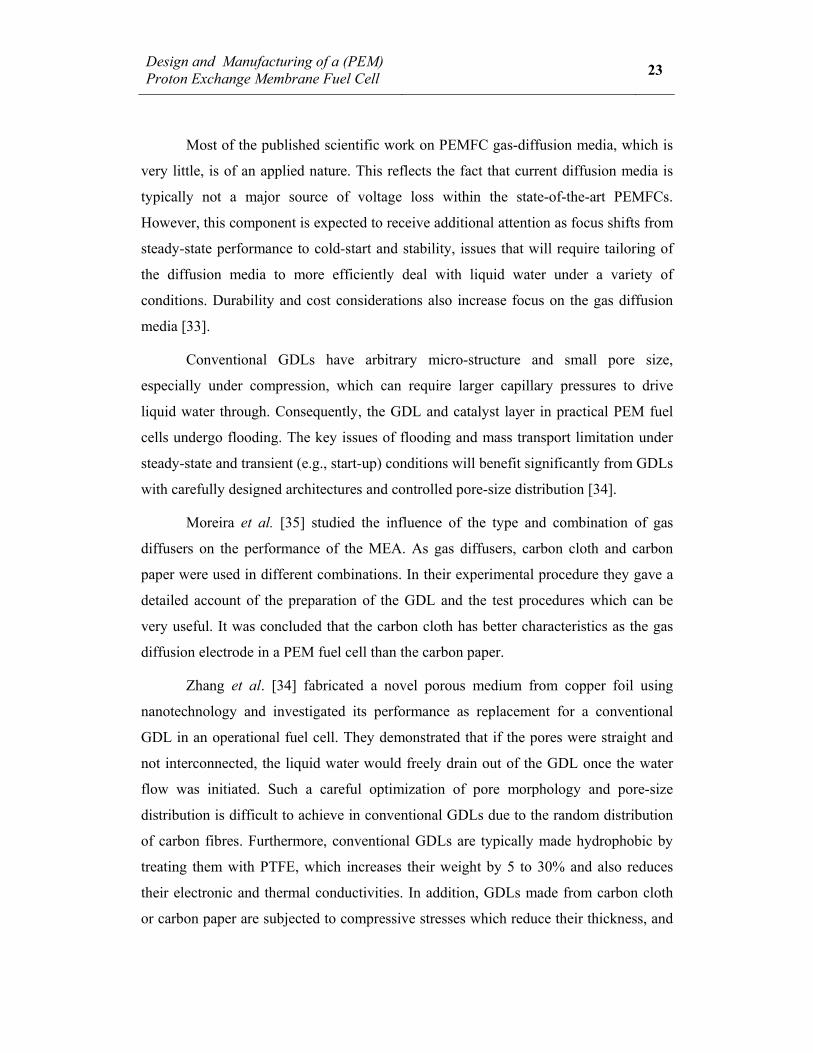
Figure 2-2 Microscopic image depicting the random fibre structure of a GDL formed of Toray® carbon paper ....................................................................................................... 22
Figure 2-3 Classification of Bipolar plate materials and manufacturing alternatives .... 26
Figure 2-4 Metal-based materials for potential application in PEM fuel cells ............... 27
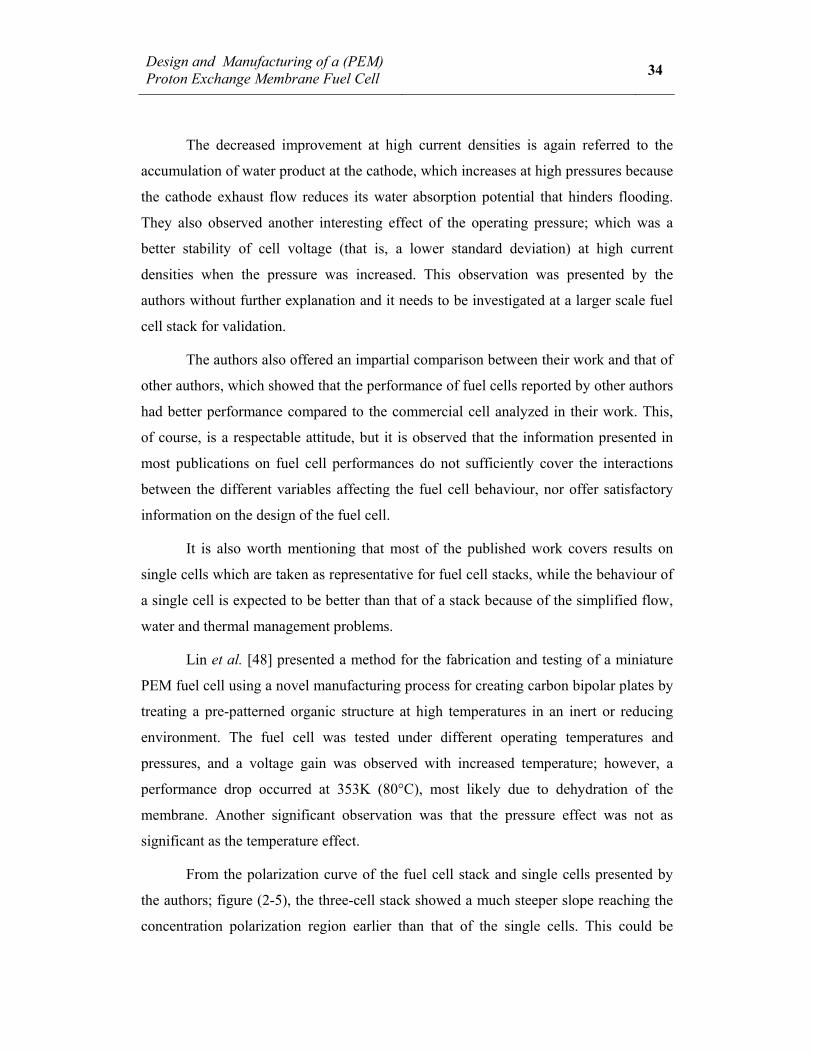
Figure 2-5 Polarization curve of a PEM fuel cell stack and single cells ........................ 35
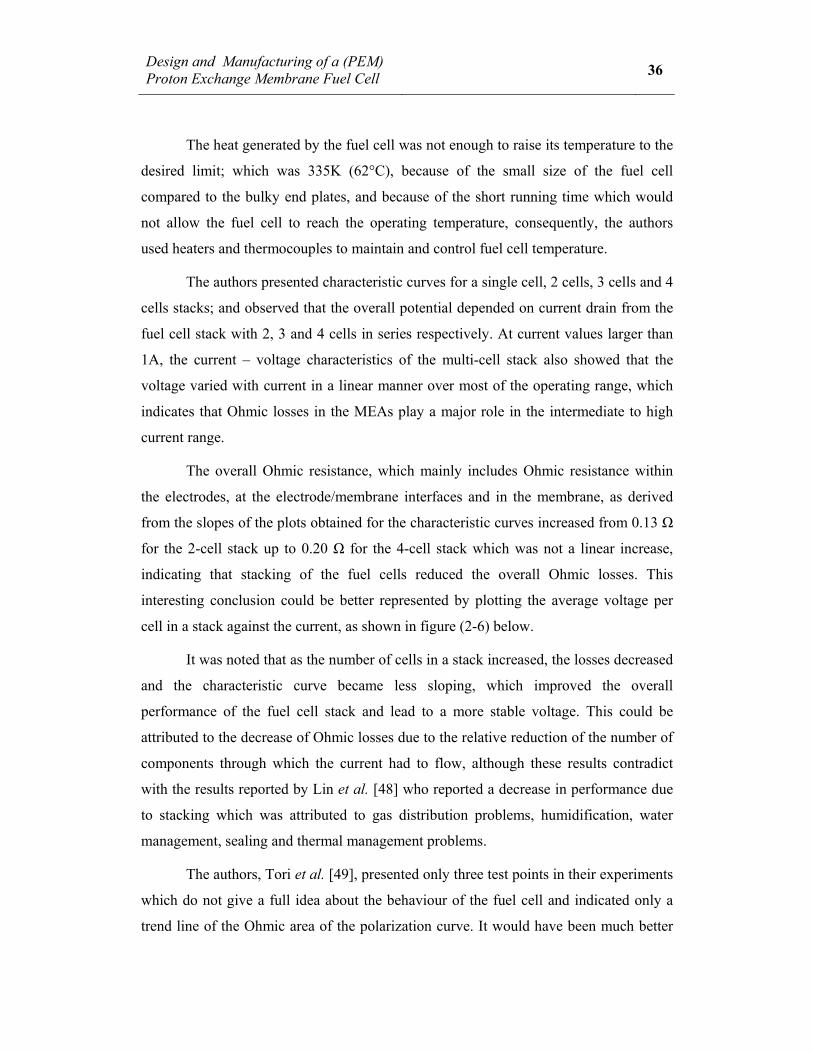
Figure 2-6 Characteristic curves for three fuel cell stacks ............................................. 37
Figure 2-7 Effects of pressure and gas concentration on the performance of the PEM fuel cell, based on the work of Amphlett et al. ............................................................... 40
Figure 3-1 Schematic representation of a Proton exchange membrane fuel cell (PEMFC), not to scale .................................................................................................... 50
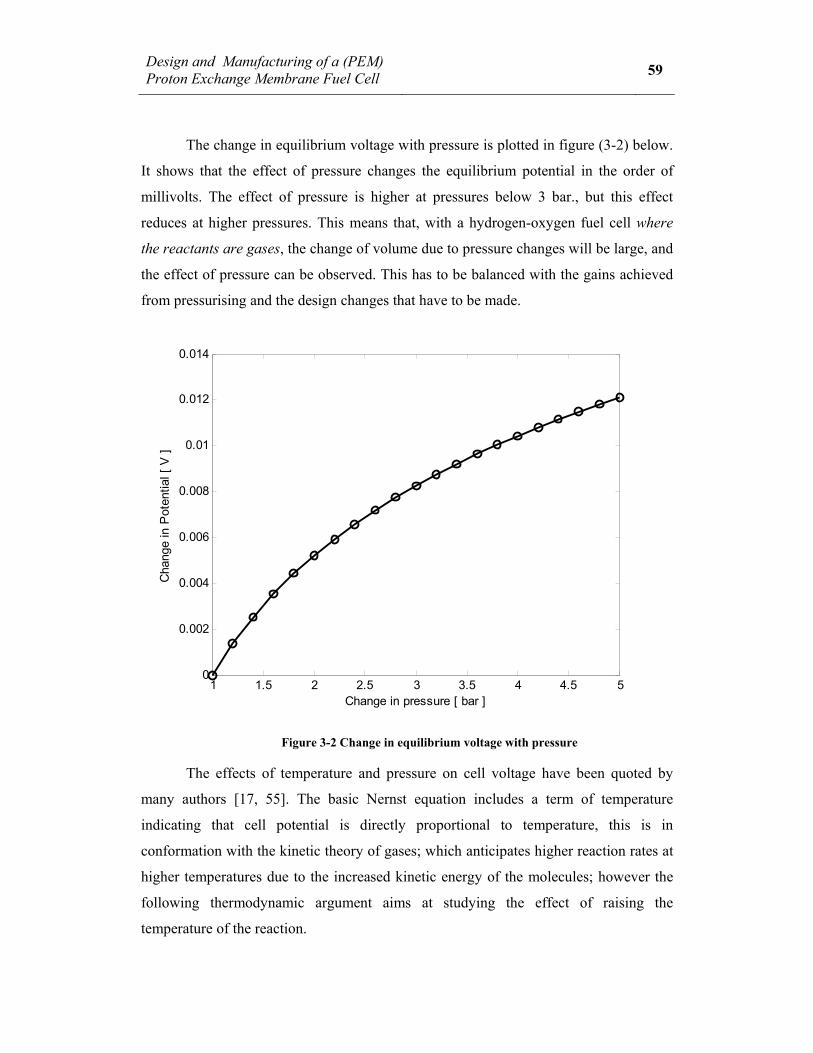
Figure 3-2 Change in equilibrium voltage with pressure ............................................... 59
Figure 3-3 Variation of EΔ with temperature using different values for the polytropic index ............................................................................................................................... 61
Figure 3-4 Schematic of a polarization curve ................................................................. 64
Figure 3-5 Variation of activation overvoltage with exchange current density ............. 69
Figure 3-6 Dependence of the exchange current density of oxygen reduction reaction (ORR) on oxygen pressure. ............................................................................................ 70
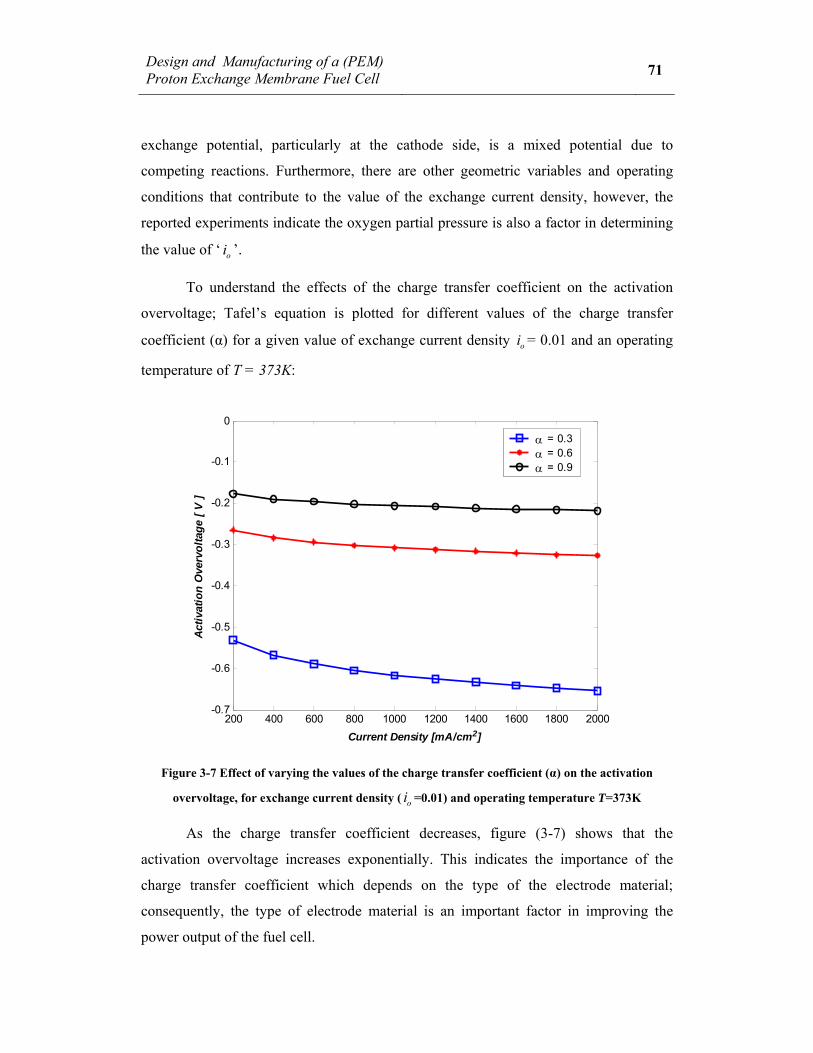
Figure 3-7 Effect of varying the values of the charge transfer coefficient (α) on the activation overvoltage .................................................................................................... 71
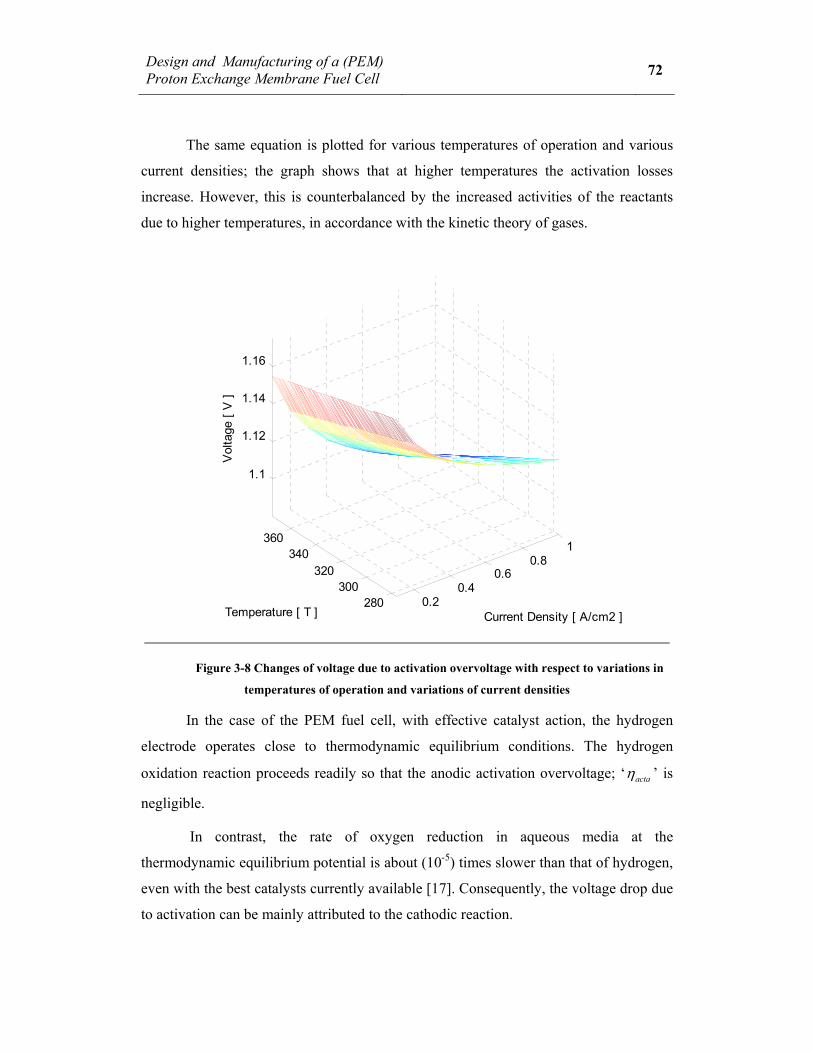
Figure 3-8 Changes of voltage due to activation overvoltage with respect to variations in temperatures of operation and variations of current densities ........................................ 72
Figure 3-9 Assumed variation of current density with concentration pressure .............. 76
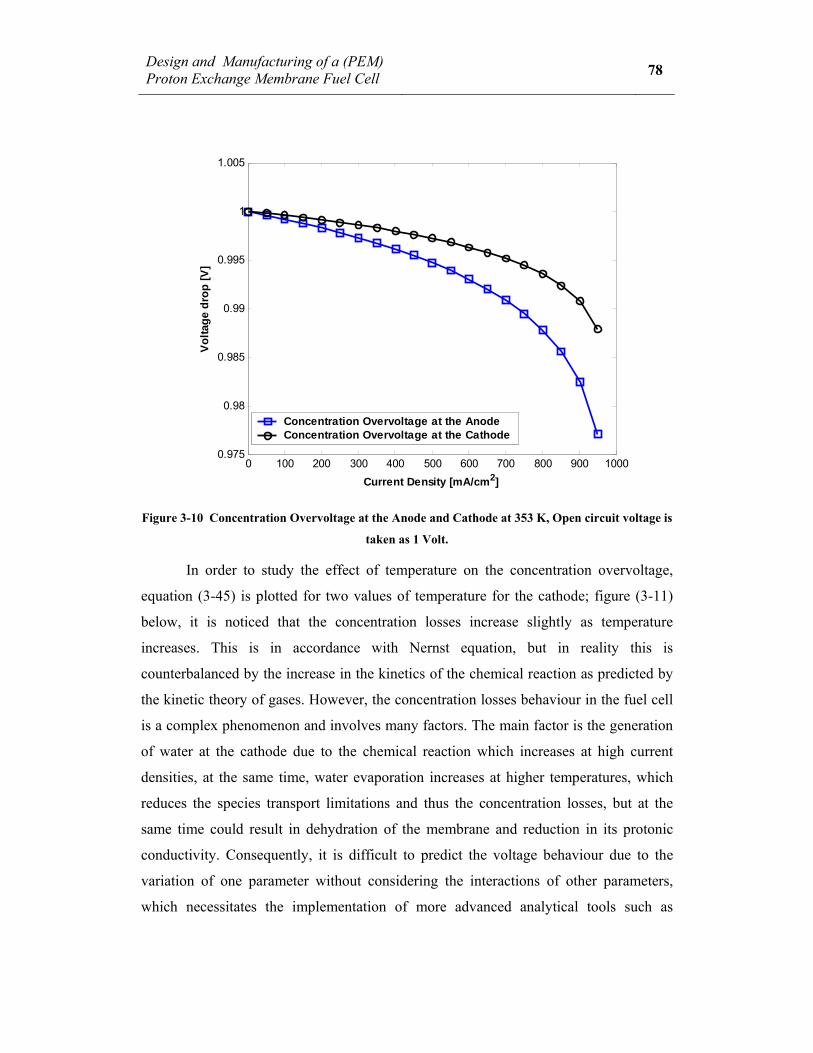
Figure 3-10 Concentration Overvoltage at the Anode and Cathode at 353 K. .............. 78
Figure 3-11 Concentration Overvoltage at the Cathode at various temperatures........... 79
viii
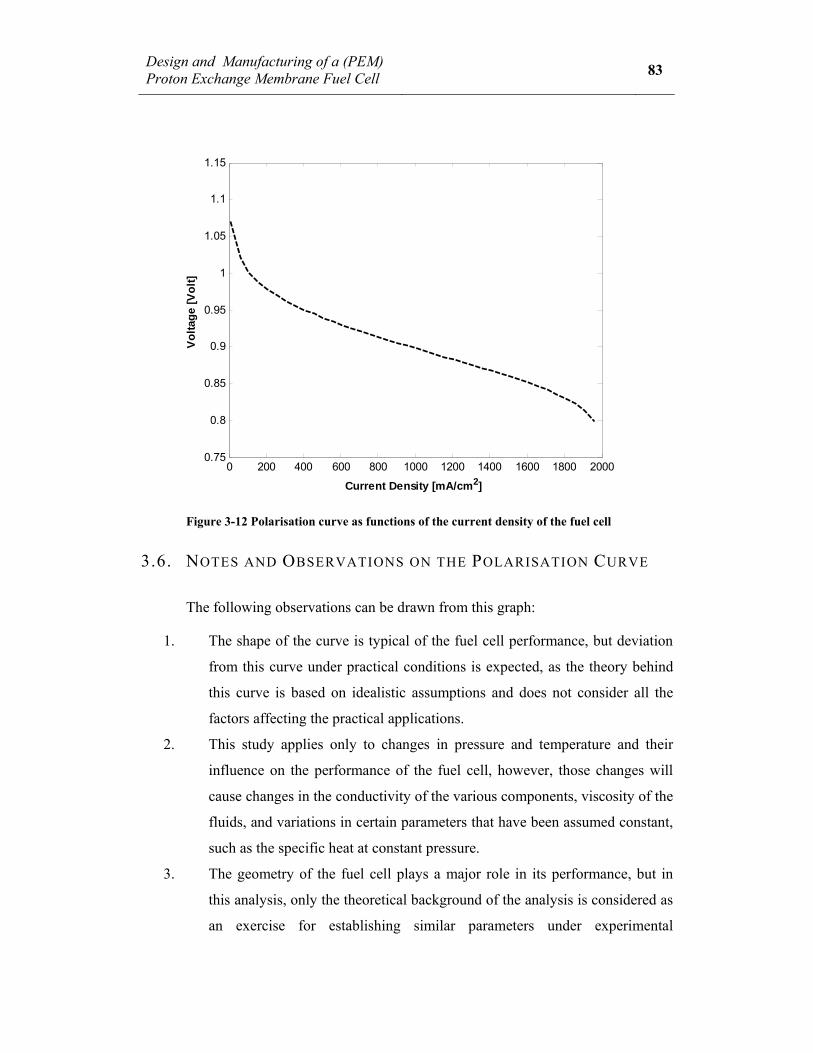
Figure 3-12 Polarisation curve of the fuel cell ............................................................... 83
Figure 3-13 Efficiency and cell voltage as functions of current density ....................... 88
Figure 4-1 Estimated percentage cost of each of the major components of PEM fuel cells based on graphite bipolar plates ............................................................................. 91
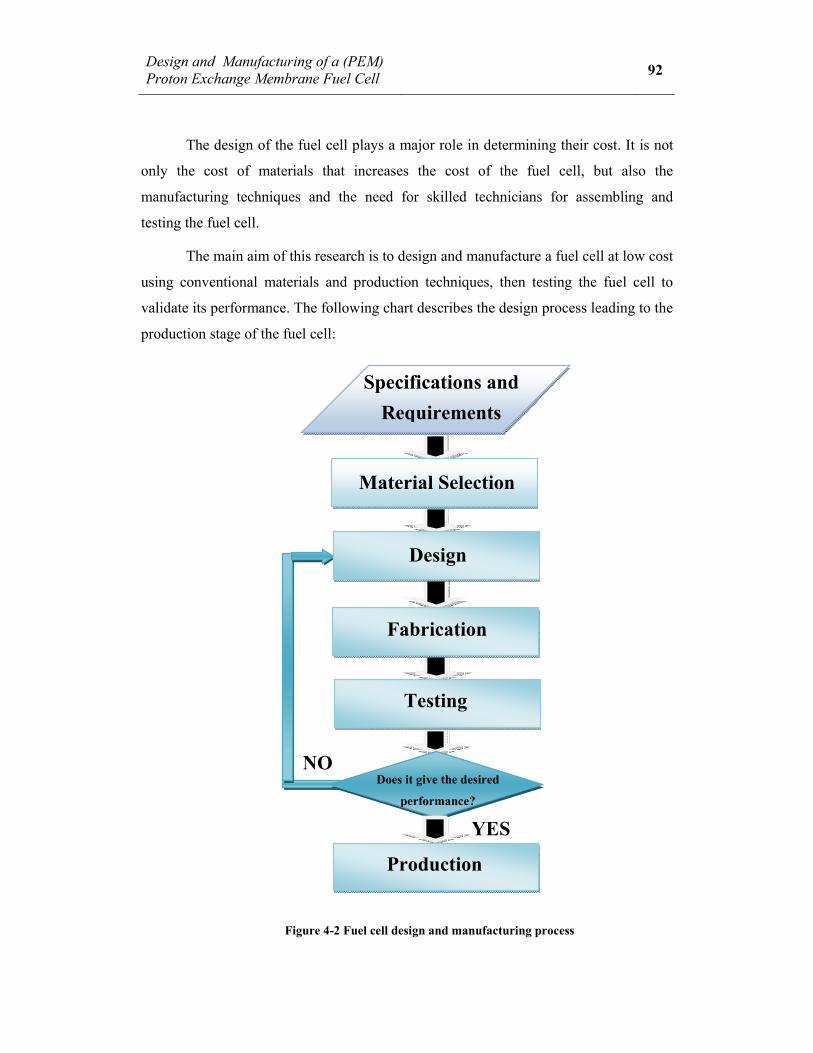
Figure 4-2 Fuel cell design and manufacturing process ................................................. 92
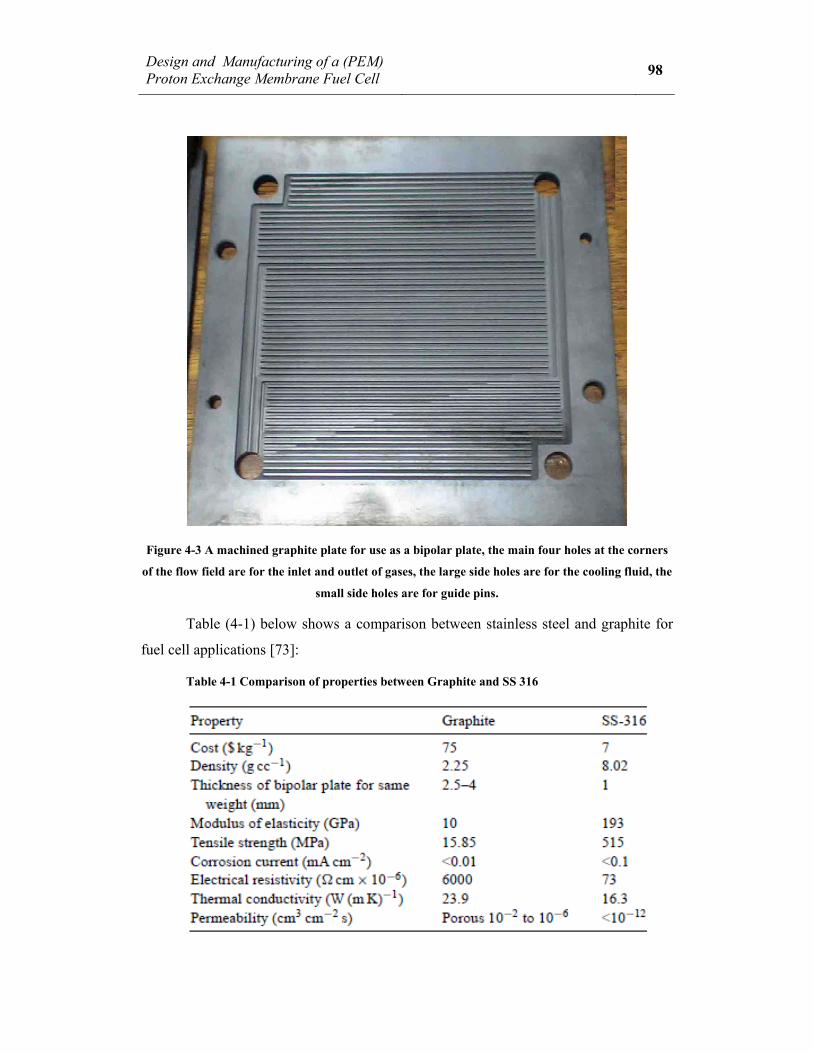
Figure 4-3 A machined graphite plate for use as a bipolar plate .................................... 98
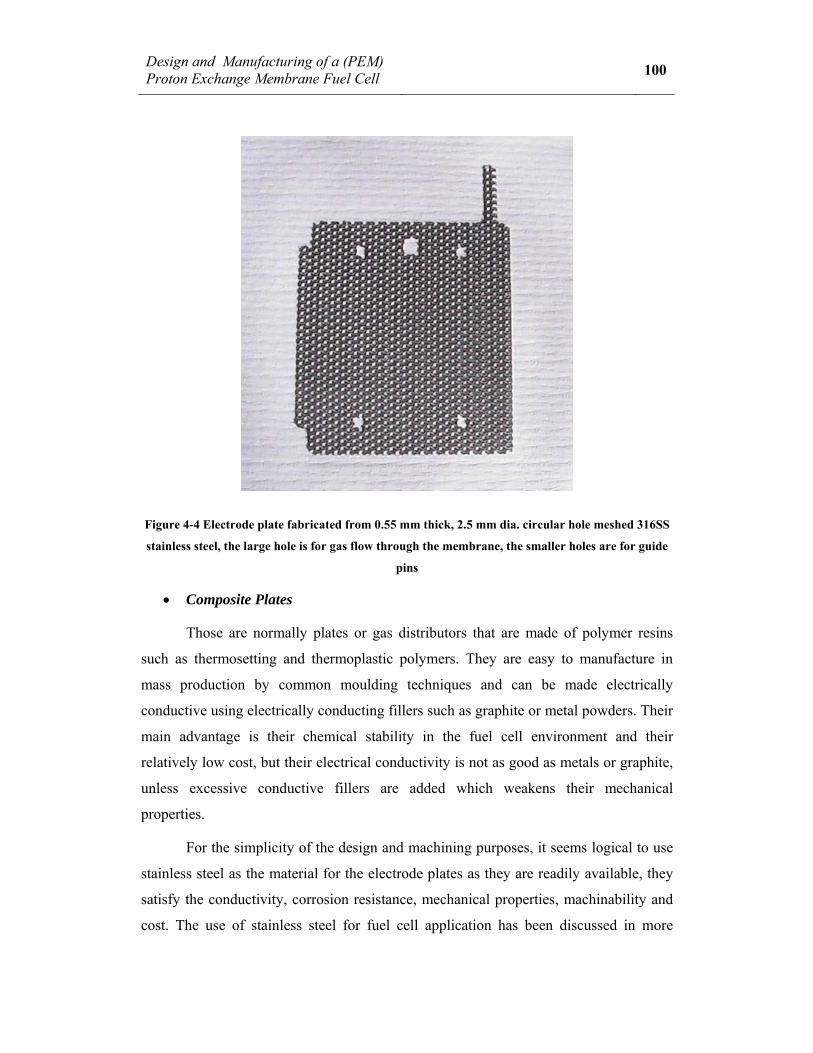
Figure 4-4 Electrode plate fabricated from 0.55 mm thick, 2.5 mm dia. circular hole meshed 316SS stainless steel ........................................................................................ 100
Figure 4-5 A graph of fuel cell area against the number of cells in a 0.1kW and 1 kW fuel cell stacks. ............................................................................................................. 104
Figure 4-6 Estimated temperature drop in fuel cell components ................................. 117
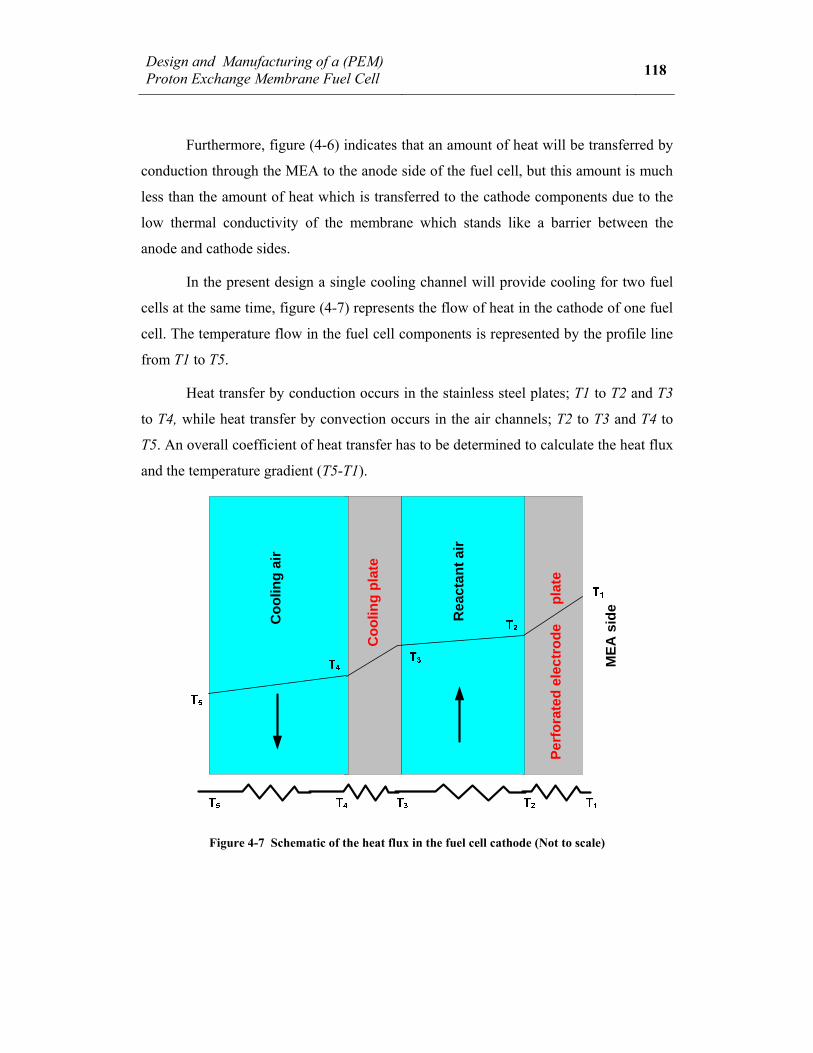
Figure 4-7 Schematic of the heat flux in the fuel cell cathode (Not to scale) ............. 118
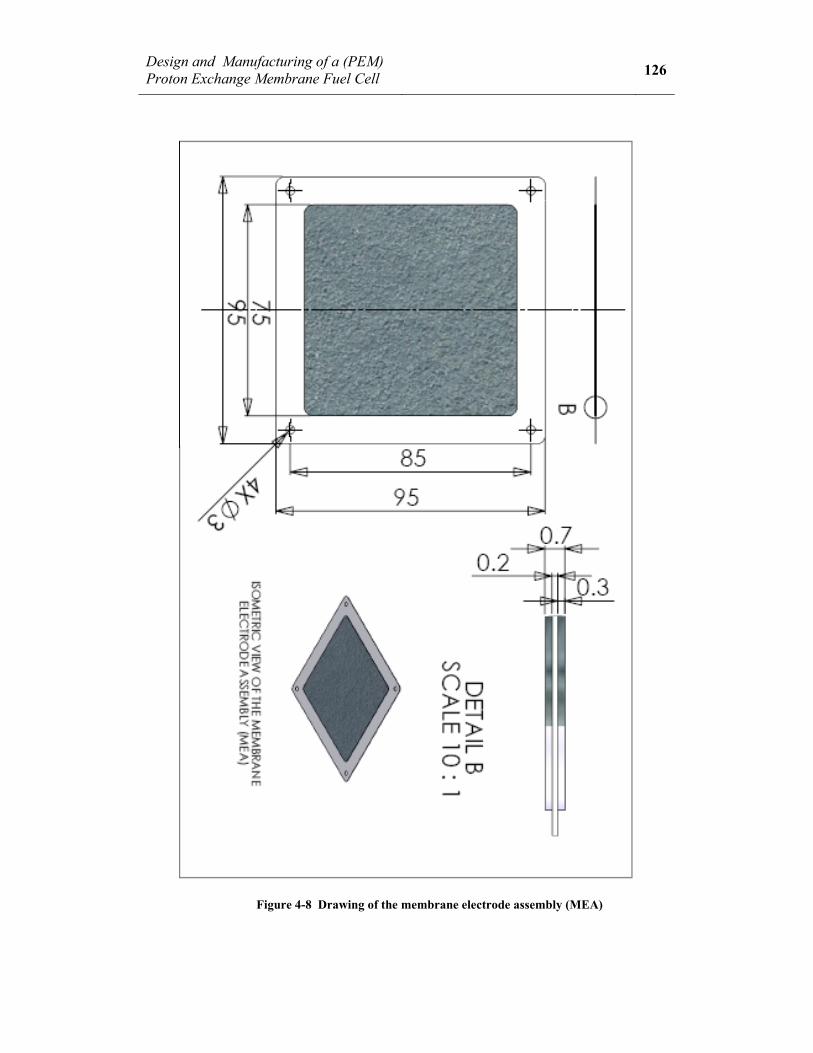
Figure 4-8 Drawing of the membrane electrode assembly (MEA) ............................. 126
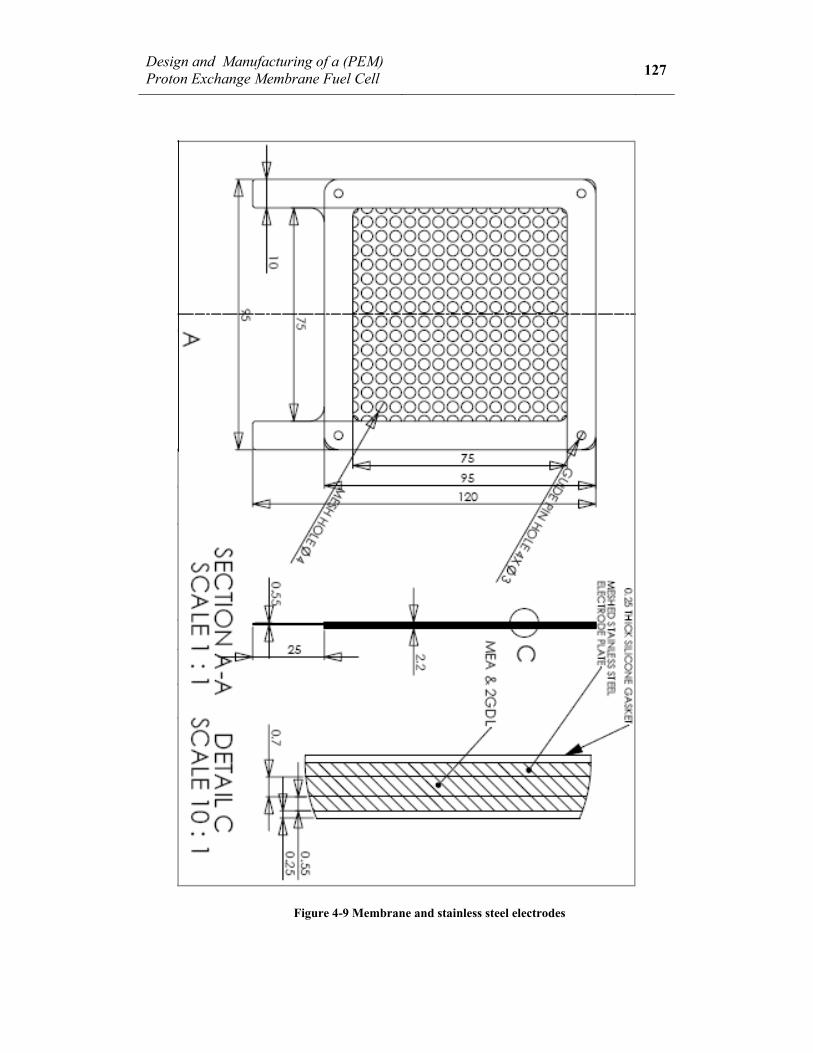
Figure 4-9 Membrane and stainless steel electrodes .................................................... 127
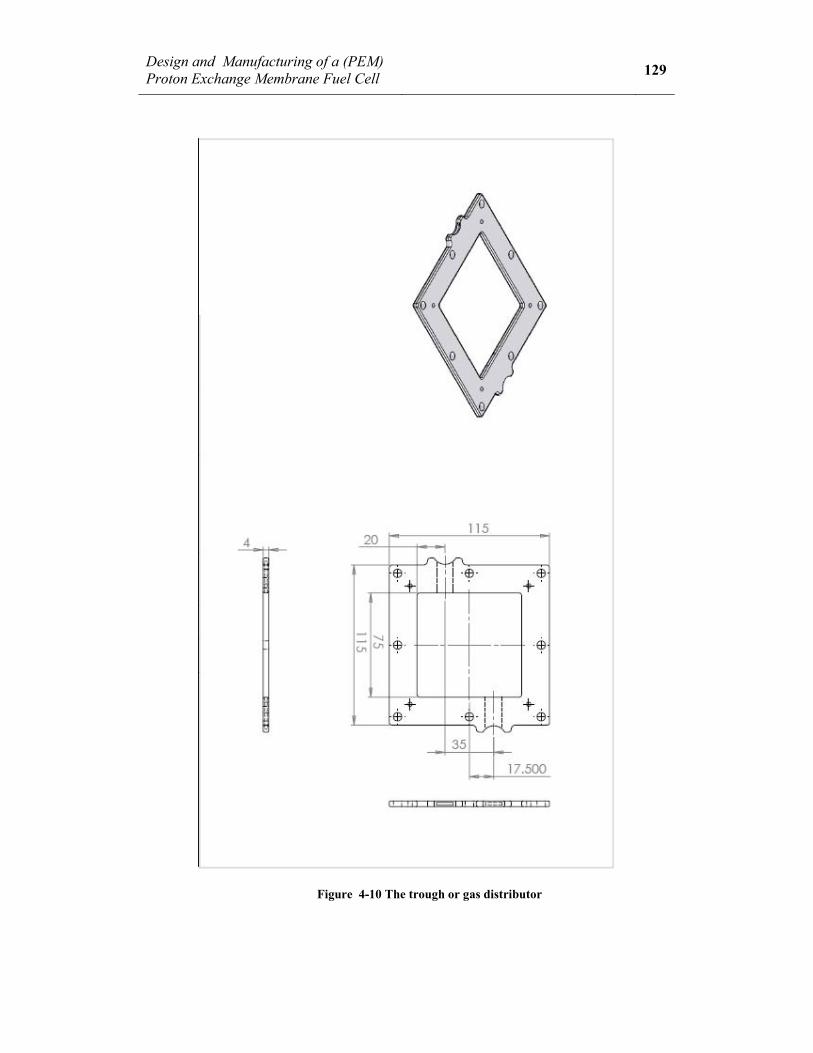
Figure 4-10 The trough or gas distributor ................................................................... 129
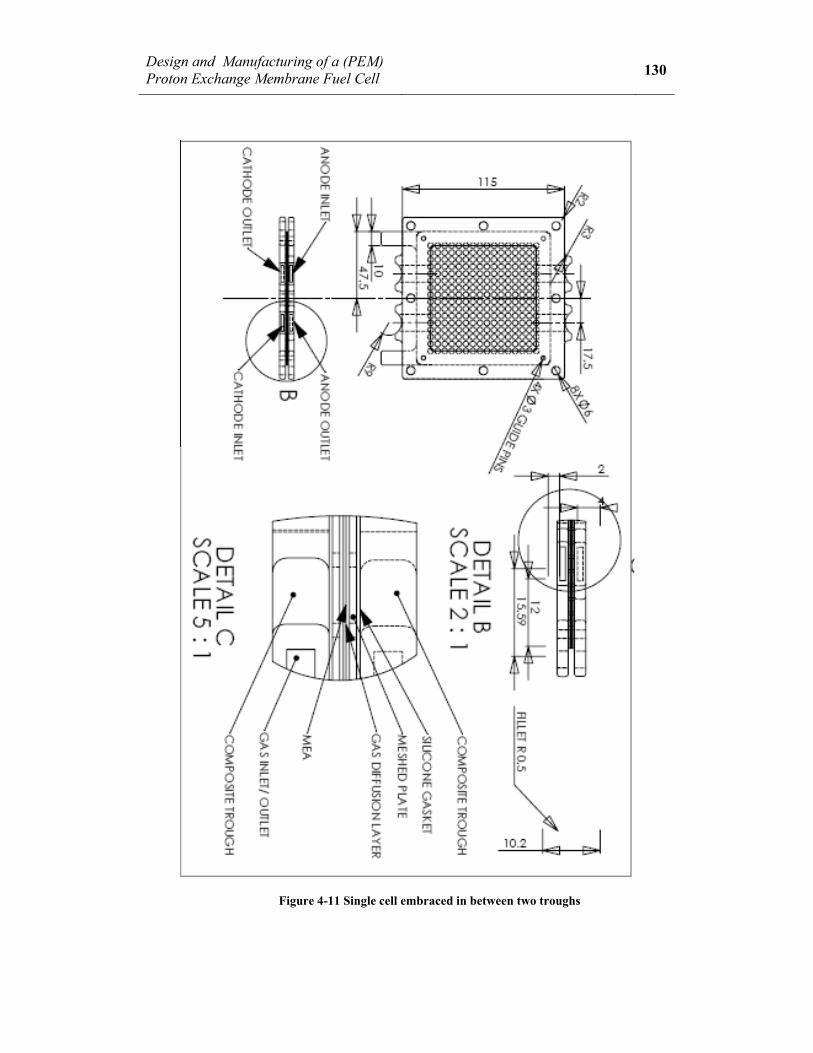
Figure 4-11 Single cell embraced in between two troughs .......................................... 130
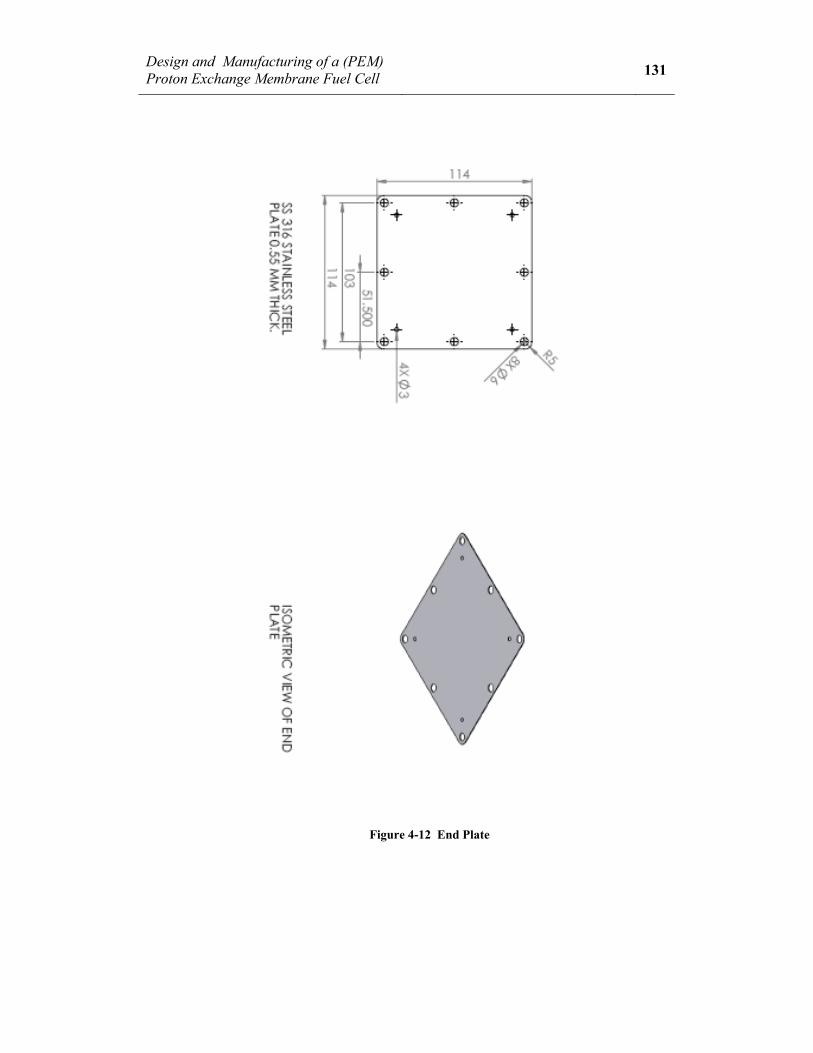
Figure 4-12 End Plate .................................................................................................. 131
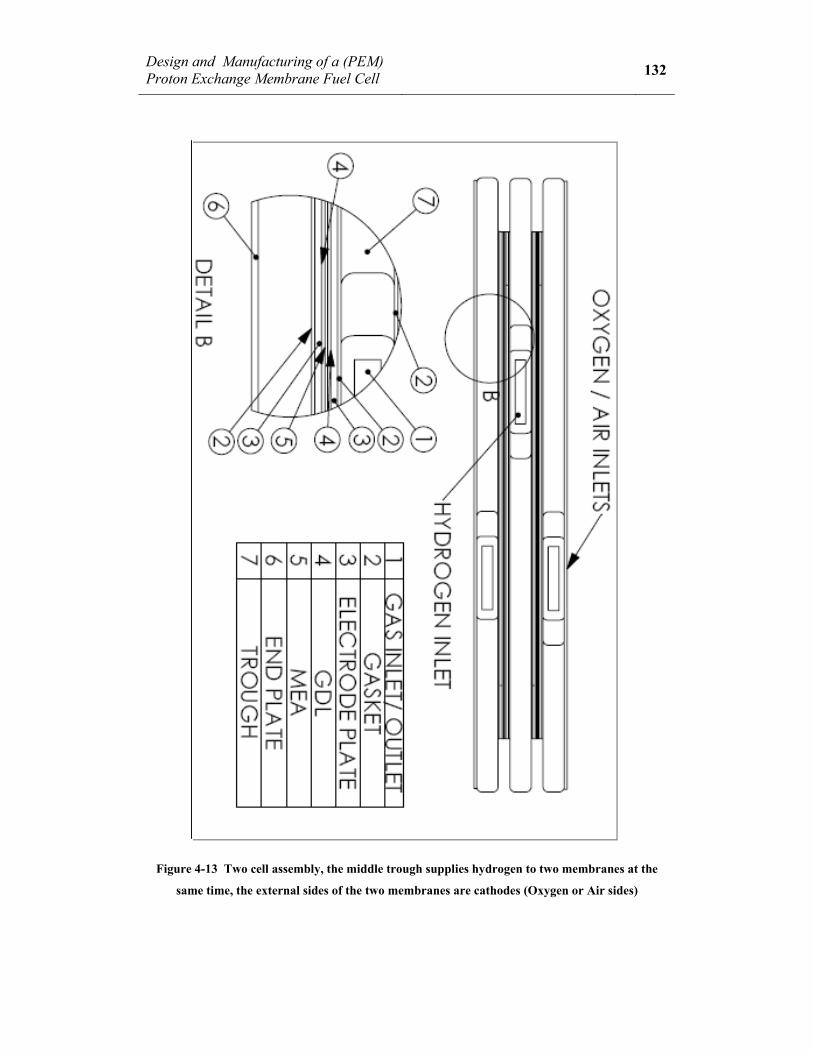
Figure 4-13 Two cell assembly ................................................................................... 132
Figure 4-14 The separator which is used to separate two-cell units ........................... 134
Figure 5-1 Saturation vapour pressure as a function of temperature ............................ 139
Figure 5-2 Schematic diagram of the experimental set up .......................................... 140
Figure 5-3 Front panel of the LabView application ..................................................... 142
Figure 5-4 Block diagram for the mathematical model on LabView®. ........................ 145
Figure 5-5 Block diagram for the display of experimental results using LabView® ... 147
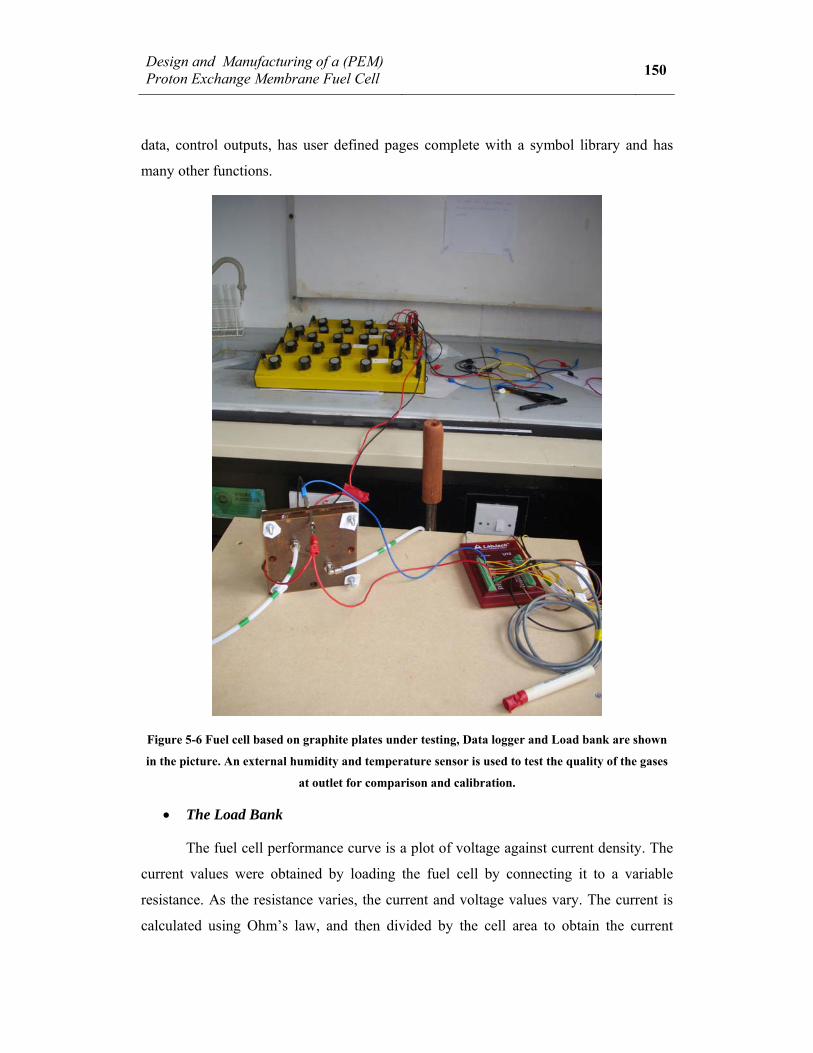
Figure 5-6 Fuel cell based on graphite plates under testing ......................................... 150
ix
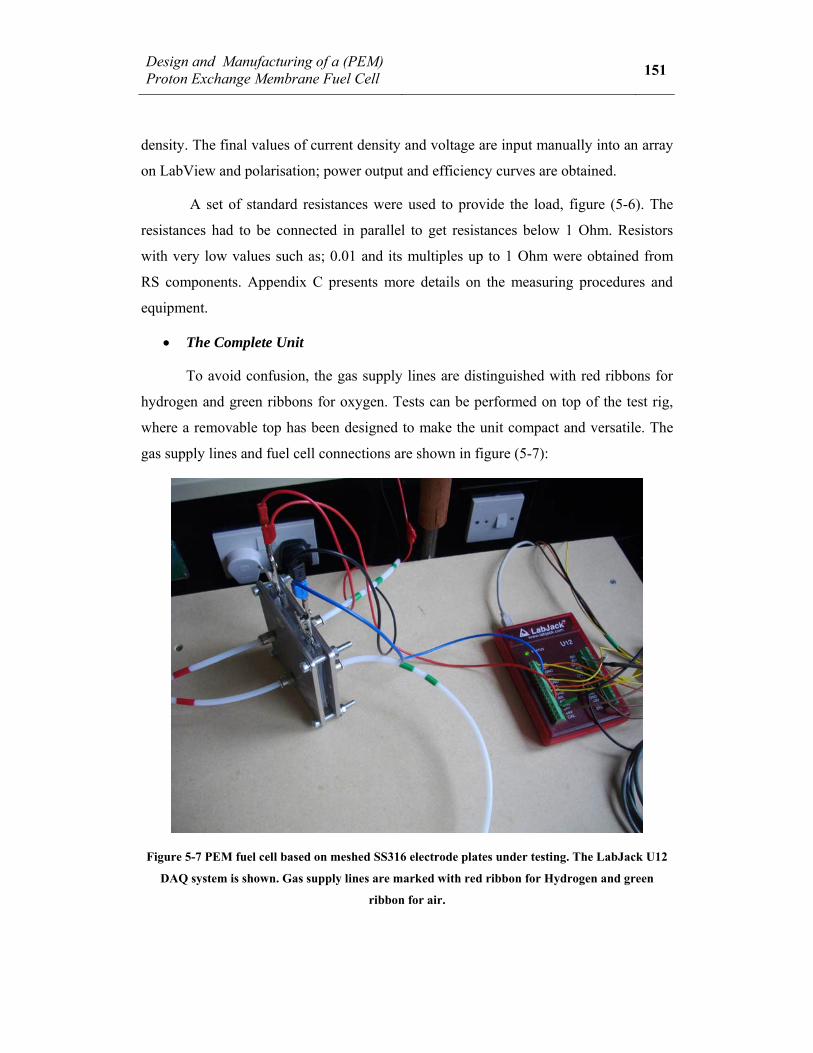
Figure 5-7 PEM fuel cell based on meshed SS316 electrode plate under testing.. ...... 151
Figure 5-8 The test rig (under construction), a view from the front panel. .................. 152
Figure 6-1 CAD isometric drawing of a single cell fuel cell........................................ 155
Figure 6-2 Actual experimental single cell fuel cell using Hexagonal type meshed SS 316 stainless steel electrode plates ............................................................................... 156
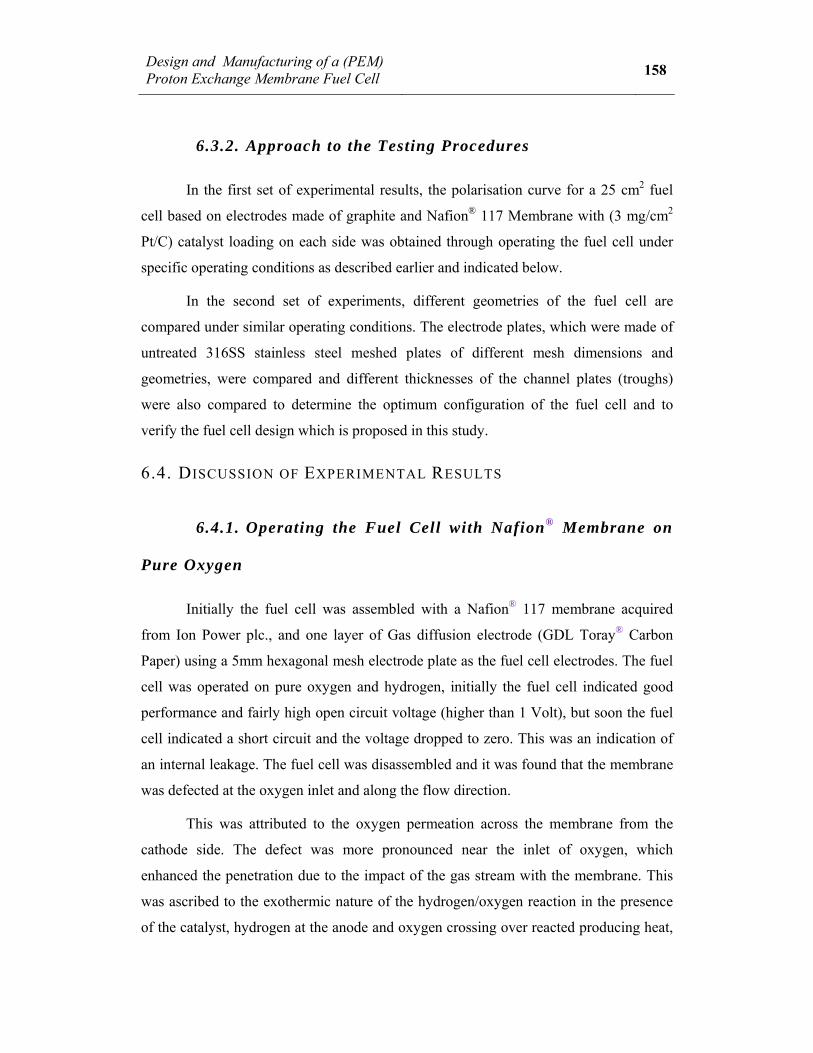
Figure 6-3 Damaged Nafion® 117 membrane used in fuel cell operated on pure oxygen and hydrogen using stainless steel meshed electrodes ................................................. 159
Figure 6-4 Schematic of the fuel cell............................................................................ 160
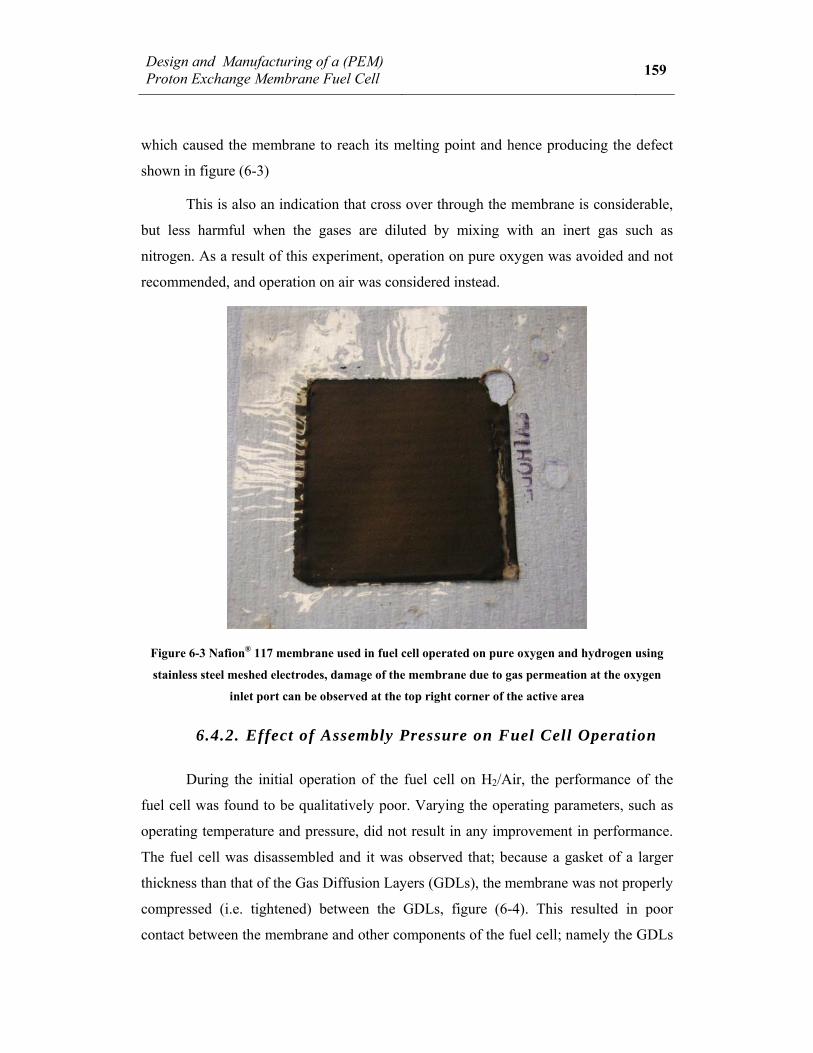
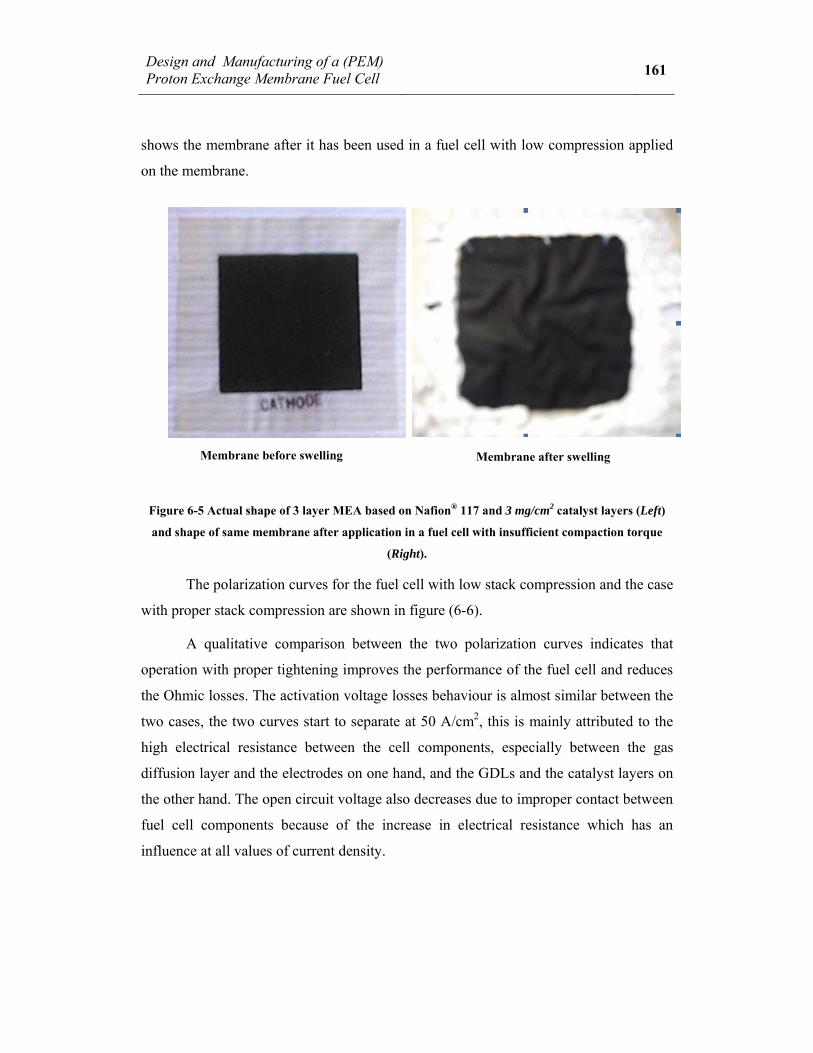
Figure 6-5 Actual shape of 3 layer MEA based on Nafion® 117 and 3 mg/cm2 catalyst layers (Left) and shape of same membrane after application in a fuel cell with insufficient compaction torque (Right). ........................................................................ 161
Figure 6-6 Performance of a properly compacted fuel cell as compared to a fuel cell with high contact resistances due to poor compression ................................................ 162
Figure 6-7 Molar inlet composition of the cathode side gas stream as a function of temperature and pressure .............................................................................................. 166
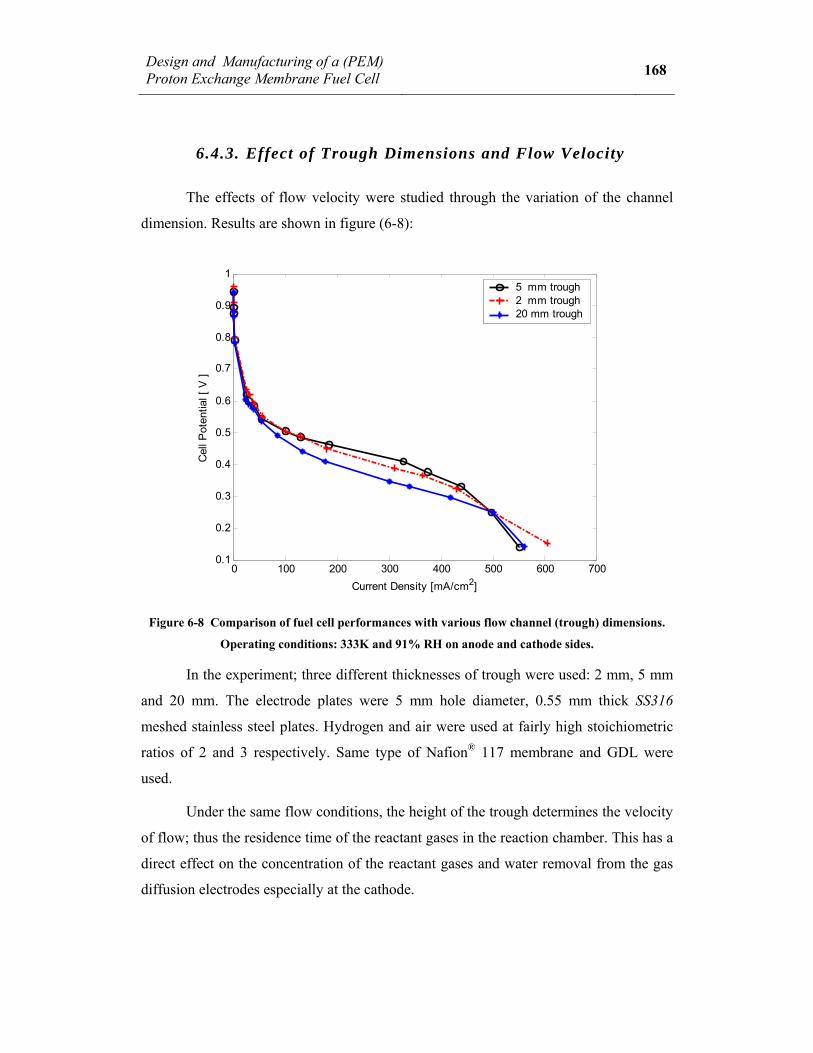
Figure 6-8 Comparison of fuel cell performances with various flow channel (trough) dimensions. ................................................................................................................... 168
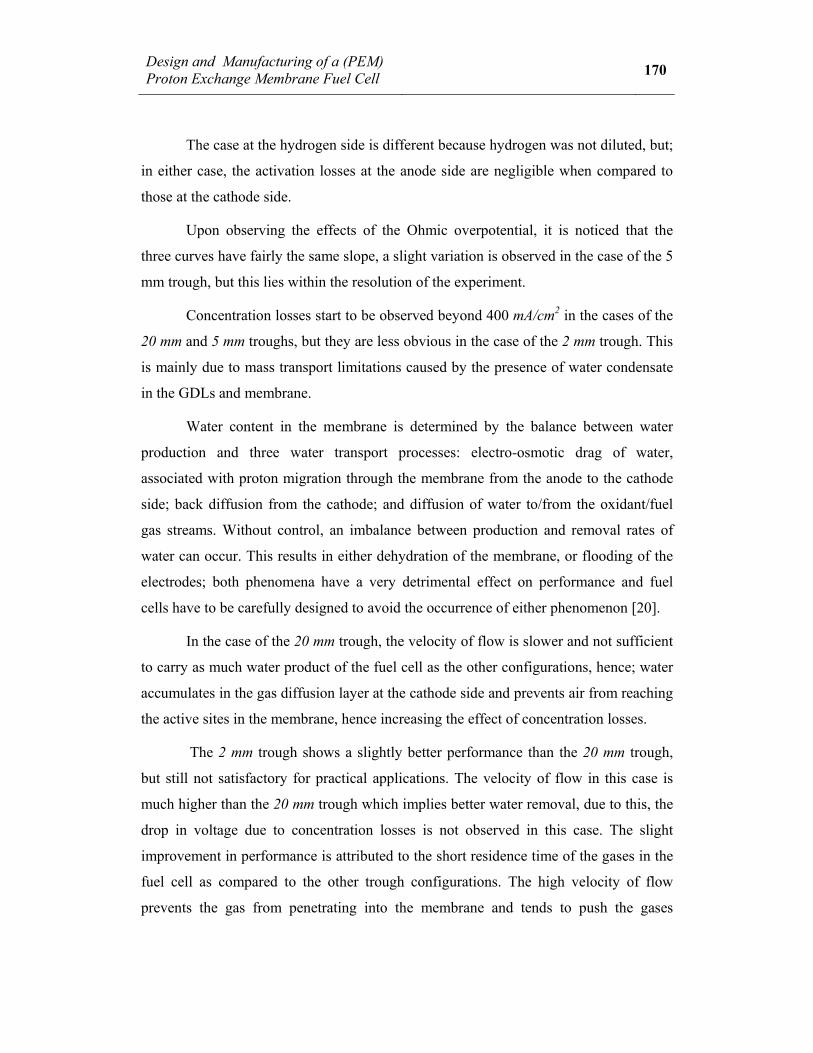
Figure 6-9 The activation region of the polarisation curves for various meshed stainless steel electrode fuel cells and one fuel cell based on parallel channel graphite plates as electrodes ...................................................................................................................... 172
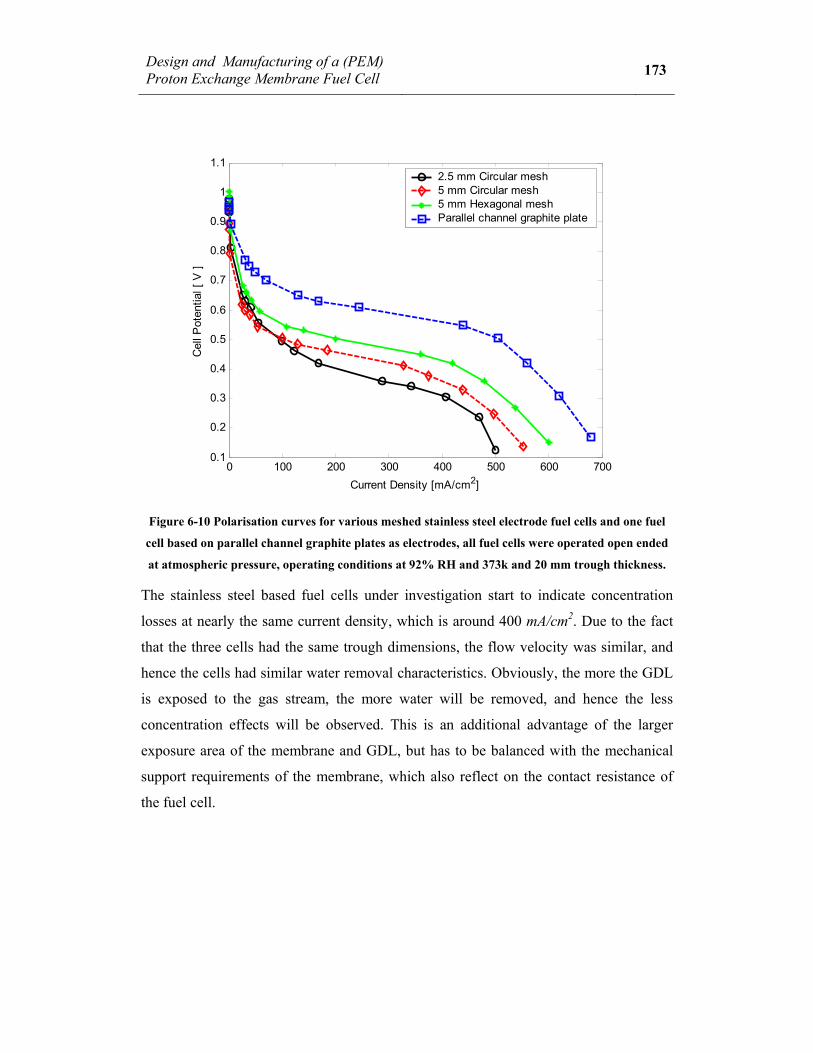
Figure 6-10 Polarisation curves for various meshed stainless steel electrode fuel cells and one fuel cell based on parallel channel graphite plates as electrodes .................... 173
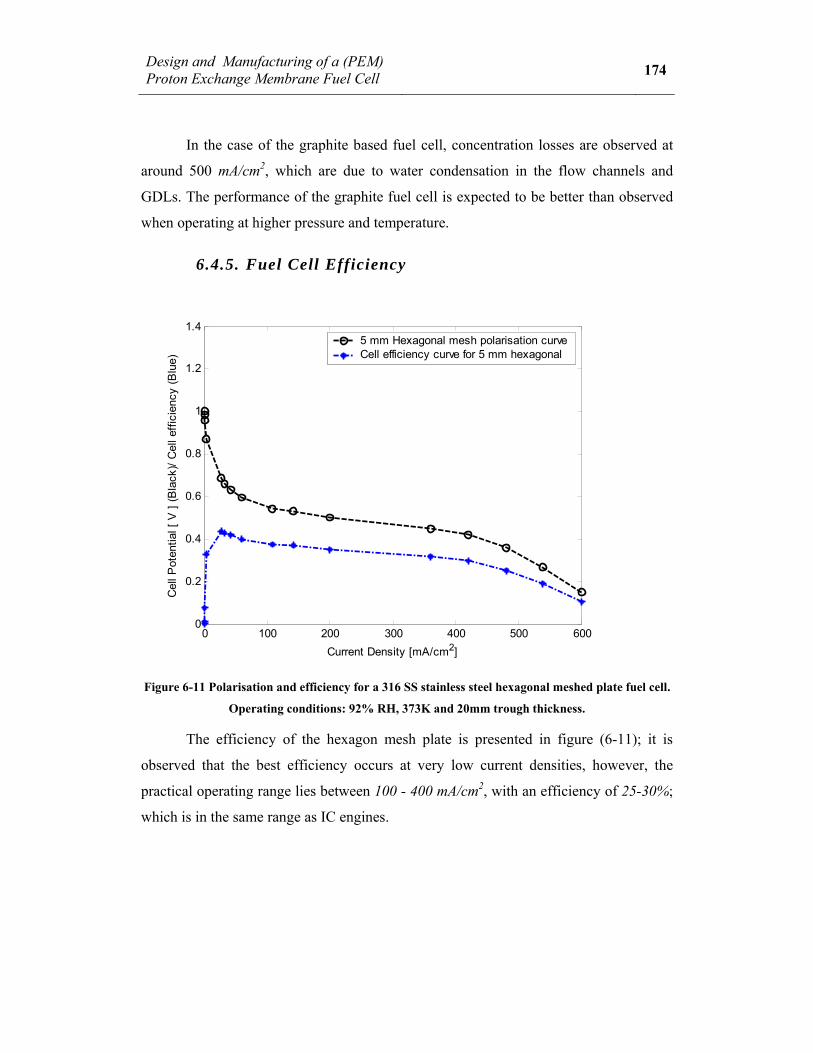
Figure 6-11 Polarisation and efficiency for a 316 SS stainless steel hexagonal meshed plate fuel cell. ............................................................................................................... 174
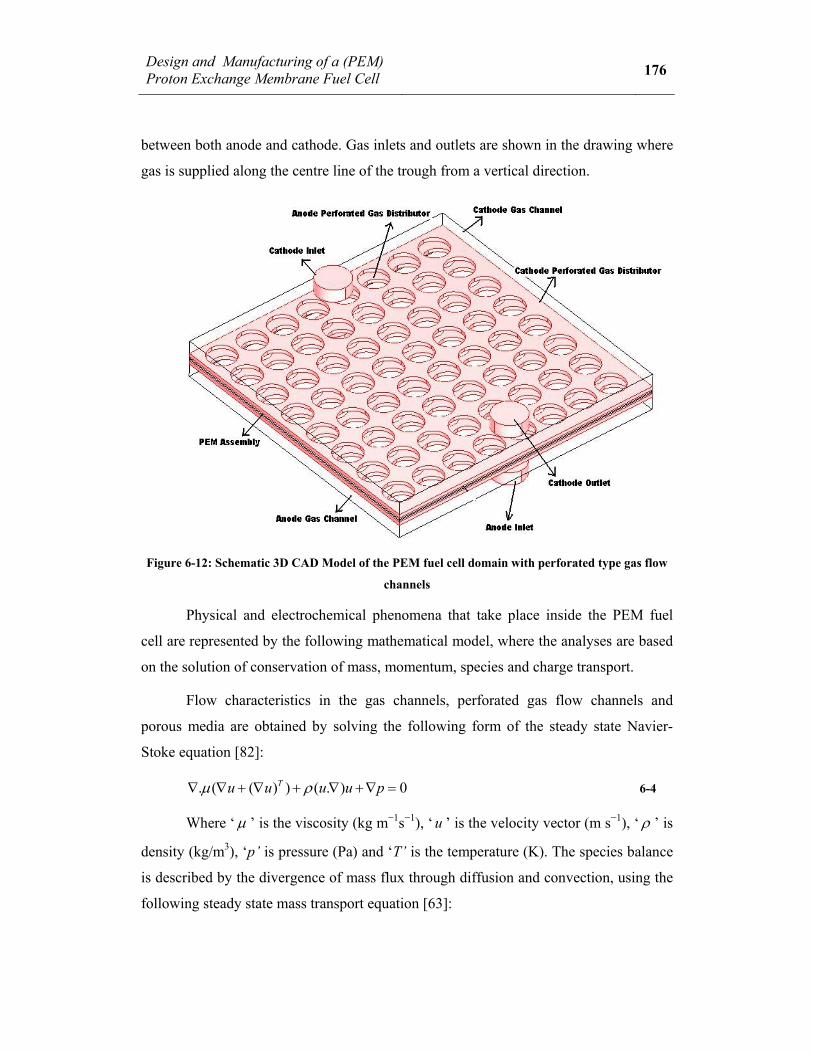
Figure 6-12: Schematic 3D CAD Model of the PEM fuel cell domain with perforated type gas flow channels .................................................................................................. 176
Figure 6-13 Comparison of PEM fuel cell performance polarization curves for Conventional parallel channel graphite gas distributor and perforated Stainless Steel gas distributor at T = 333K ................................................................................................. 184
Figure 6-14 Distribution of oxygen and water mole fractions along the cathode catalyst layer at T = 333K, RH = 95% and V = 0.4V. ............................................................... 186
x
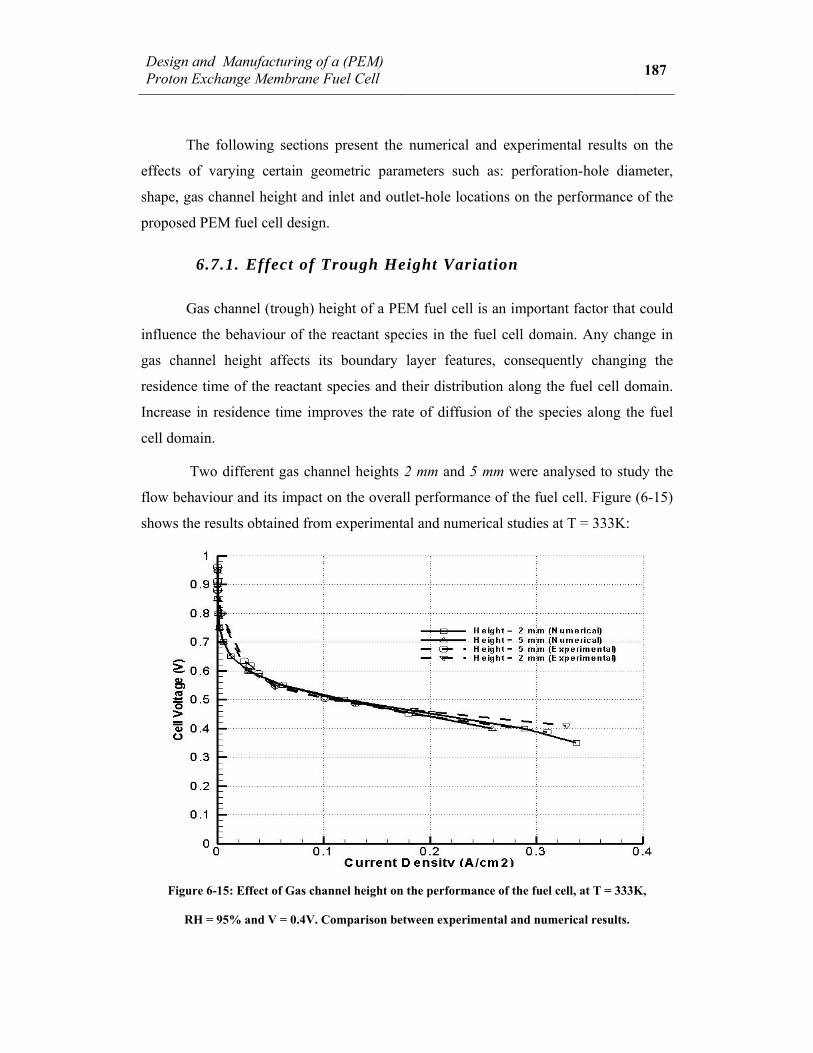
Figure 6-15 Effect of Gas channel height on the performance of the fuel cell, at T = 333K, ... .........................................................................................................................187
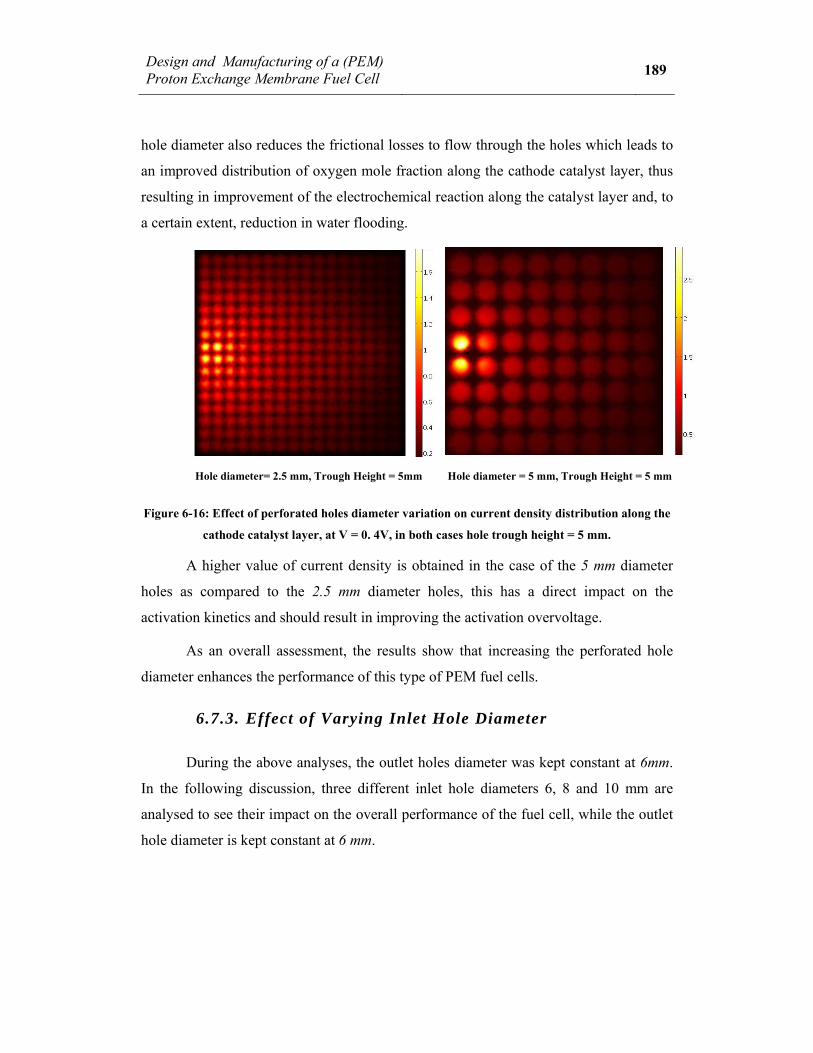
Figure 6-16 Effect of perforated holes diameter variation on current density distribution along the cathode catalyst layer .................................................................................... 189
Figure 6-17 Oxygen Mole fraction distribution along the cathode side of PEMFC ... 190
Figure 6-18 Water Mole fraction distribution along the Cathode side of the PEM fuel cell ................................................................................................................................ 191
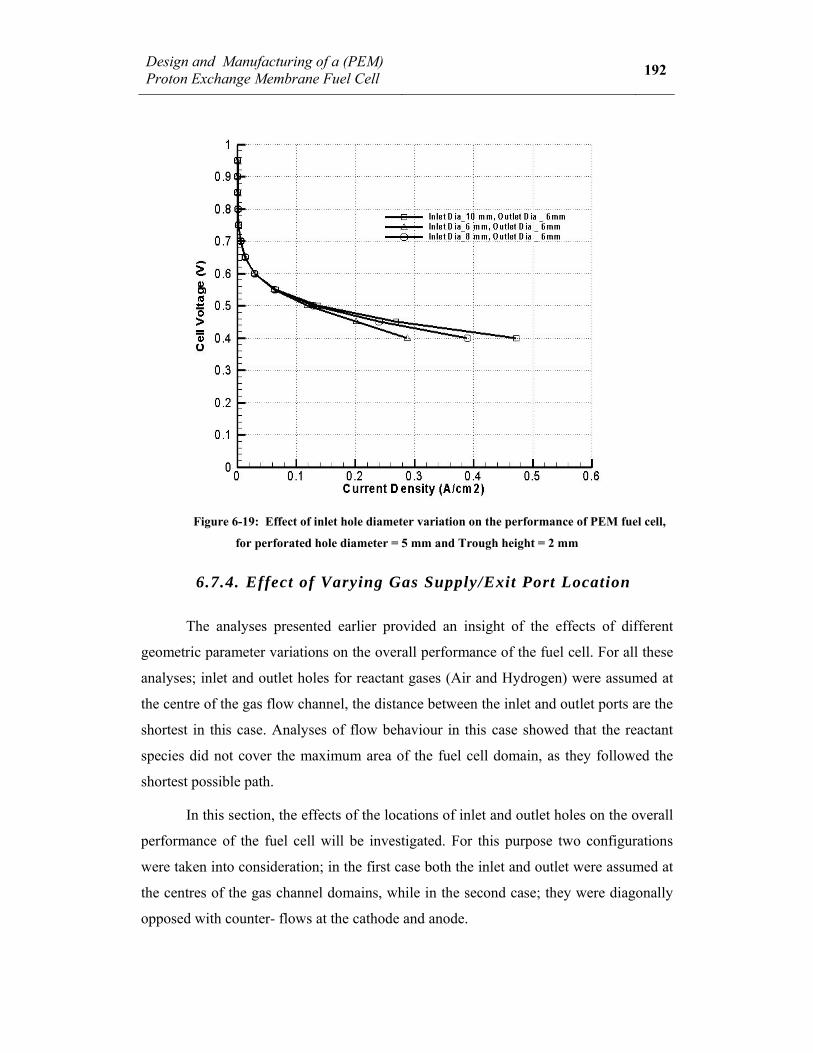
Figure 6-19 Effect of inlet hole diameter variation on the performance of PEM fuel cell ...................................................................................................................................... 192
Figure 6-20 Effect of Inlet/Outlet hole locations on oxygen mole fraction distribution ...................................................................................................................................... 193
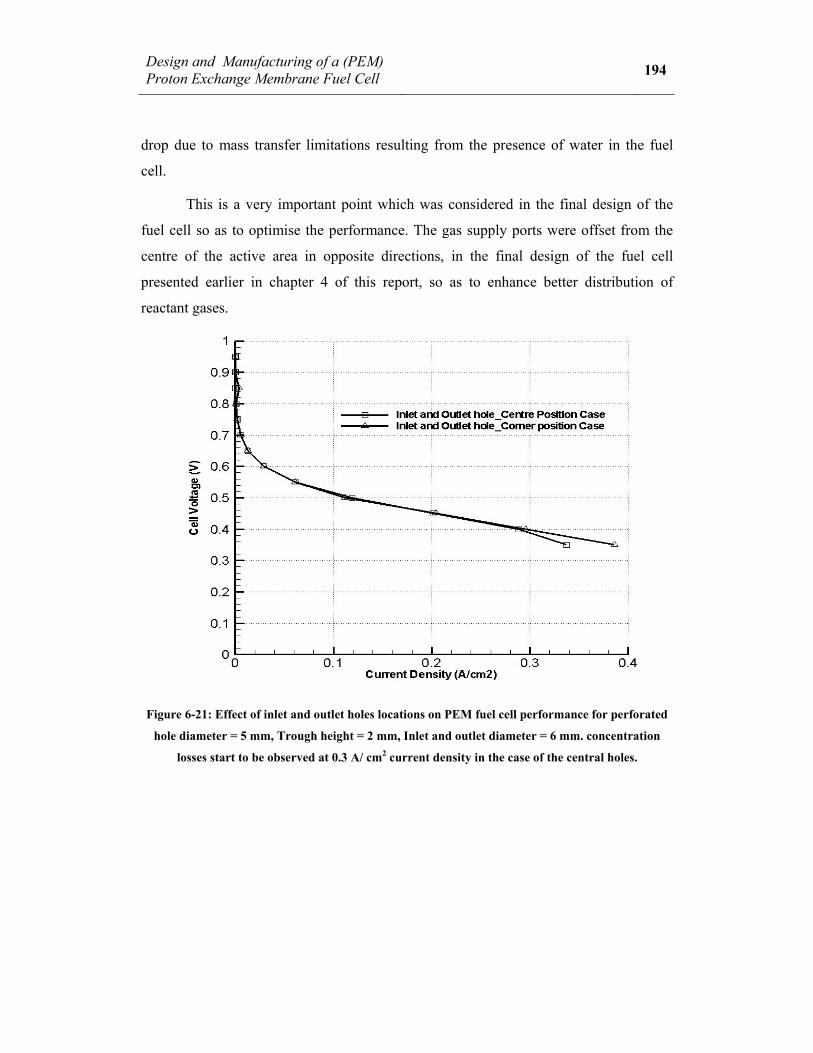
Figure 6-21 Effect of inlet and outlet holes locations on PEM fuel cell performance for perforated hole diameter = 5 mm, Trough height = 2 mm ........................................... 194
Figure 6-22 Experimentally obtained polarization curves for various cathode side pressures at a temperature of 343K and a stoichiometric flow ratio of 1.5. ................. 195
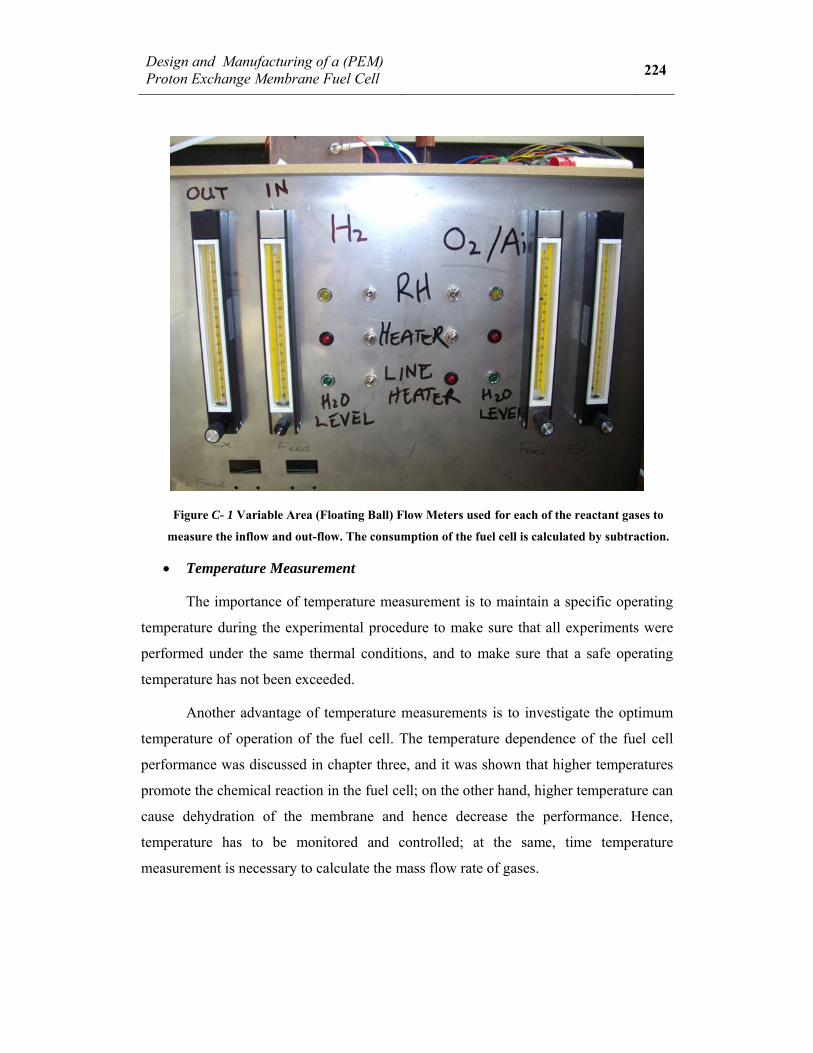
Figure C- 1 Variable Area (Floating Ball) Flow Meters used for each of the reactant gases to measure the inflow and out-flow. ................................................................... 224
Figure C- 2 Probe fitted to plug and sealed with silicone. ........................................... 225
Figure C- 3 Fittings used in mounting test probes ....................................................... 226
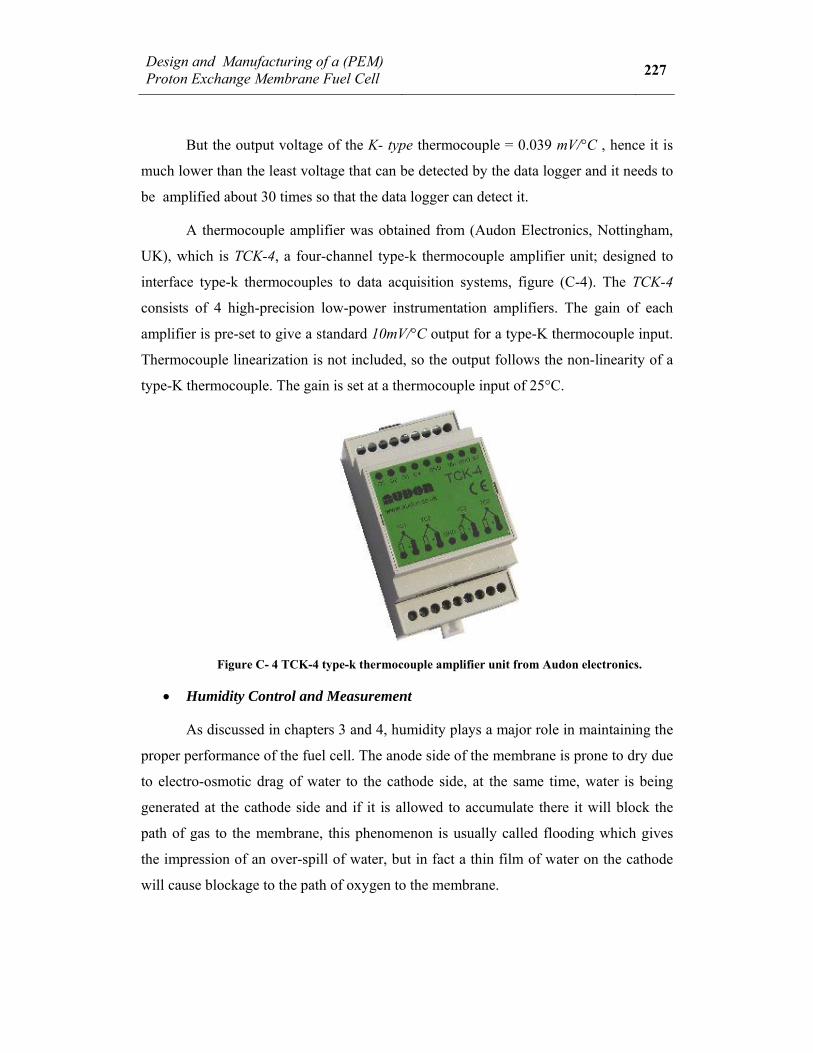
Figure C- 4 TCK-4 type-k thermocouple amplifier unit from Audon electronics. ...... 227
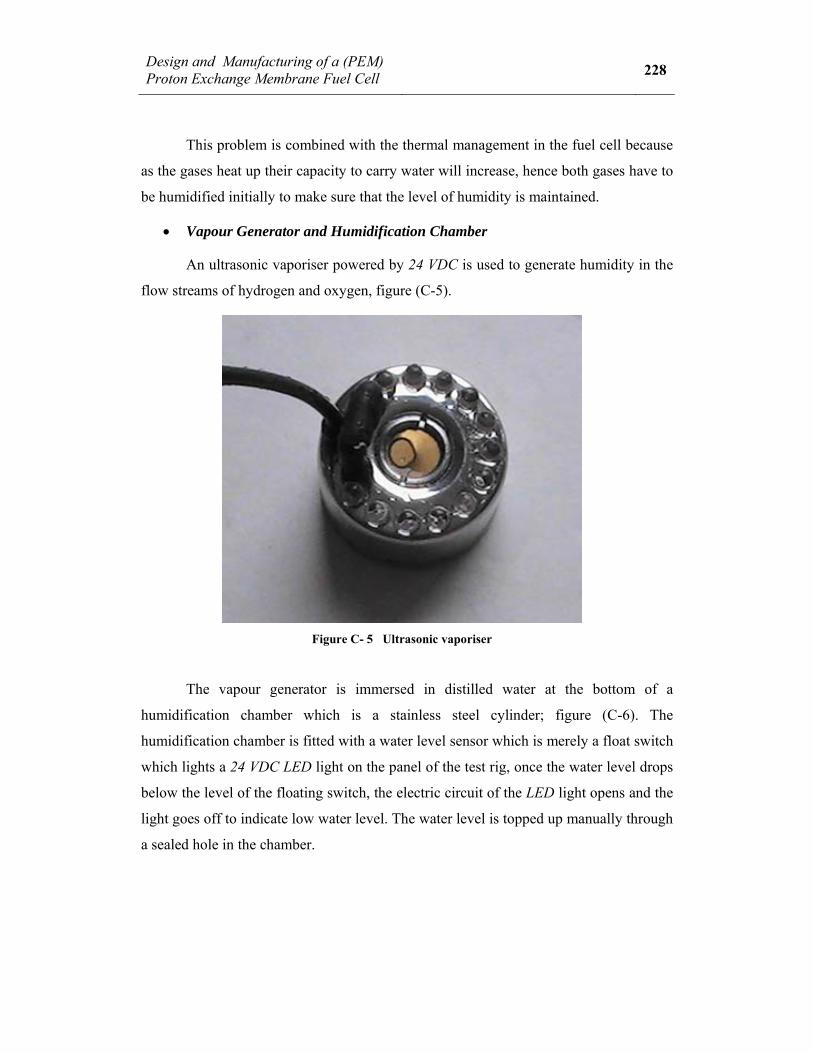
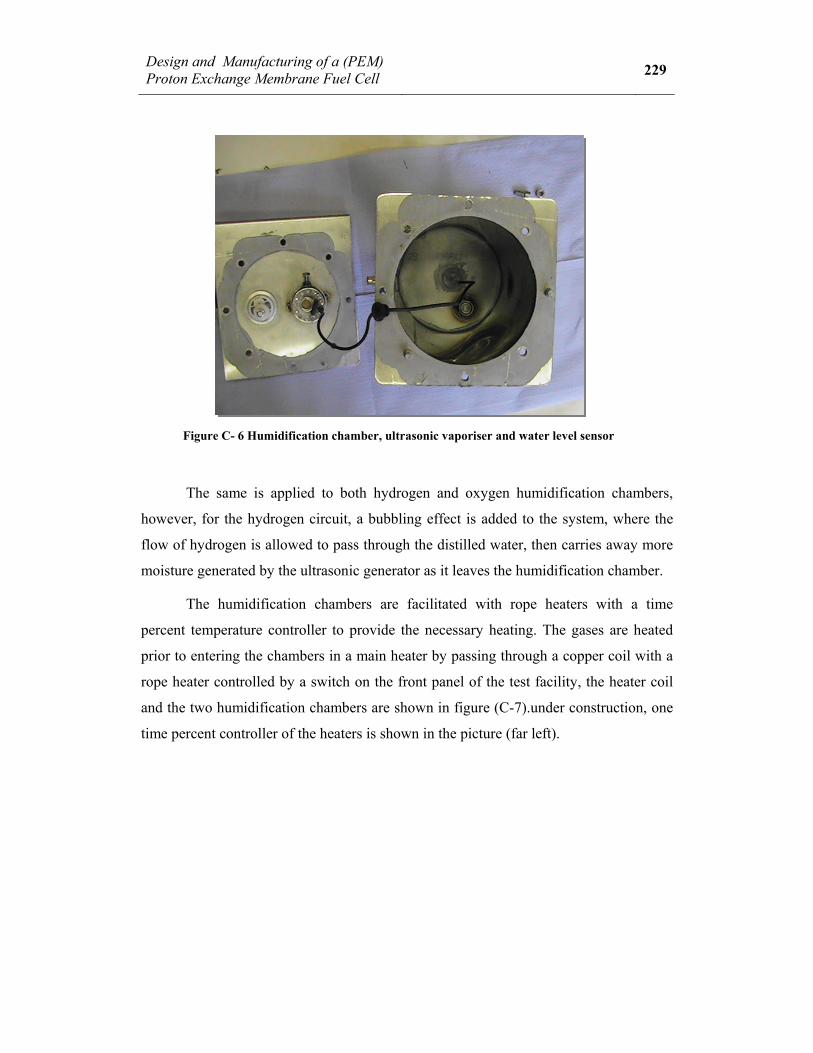
Figure C- 6 Humidification chamber, ultrasonic vaporiser and water level sensor ..... 229
Figure C- 7 The two humidification chambers and main heater under construction ... 230
Figure C- 8 Top view of the test facility. ..................................................................... 231
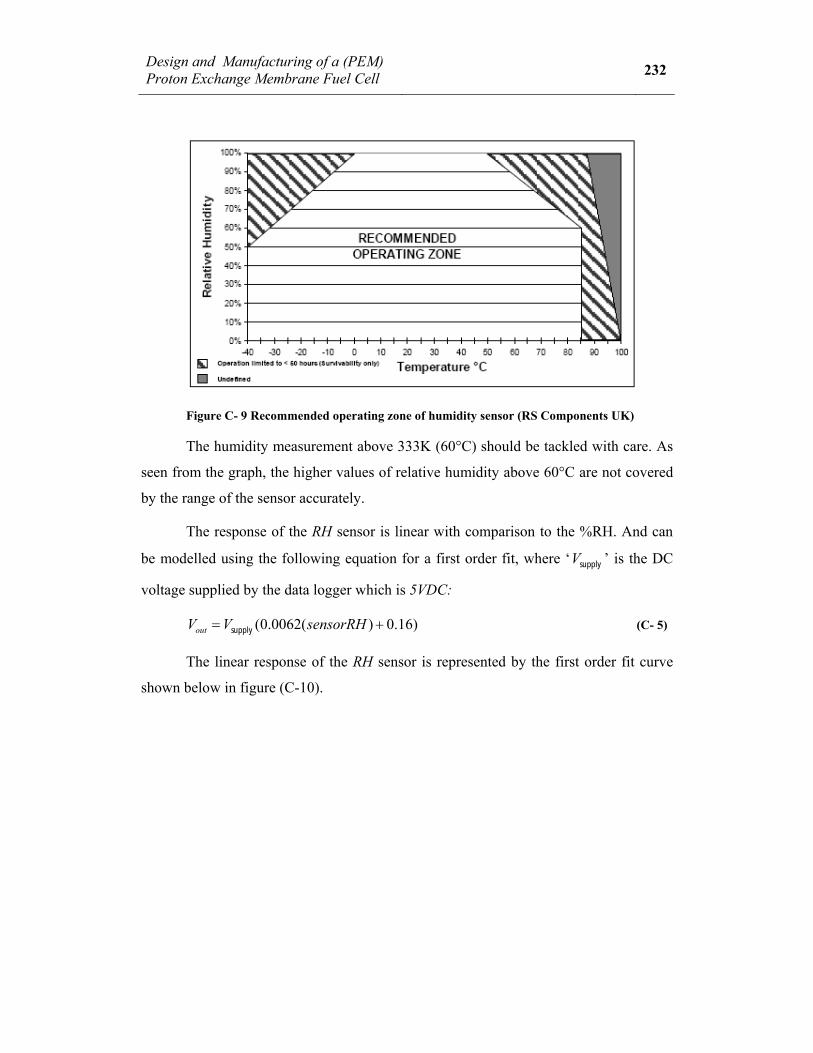
Figure C- 9 Recommended operating zone of humidity sensor ................................... 232
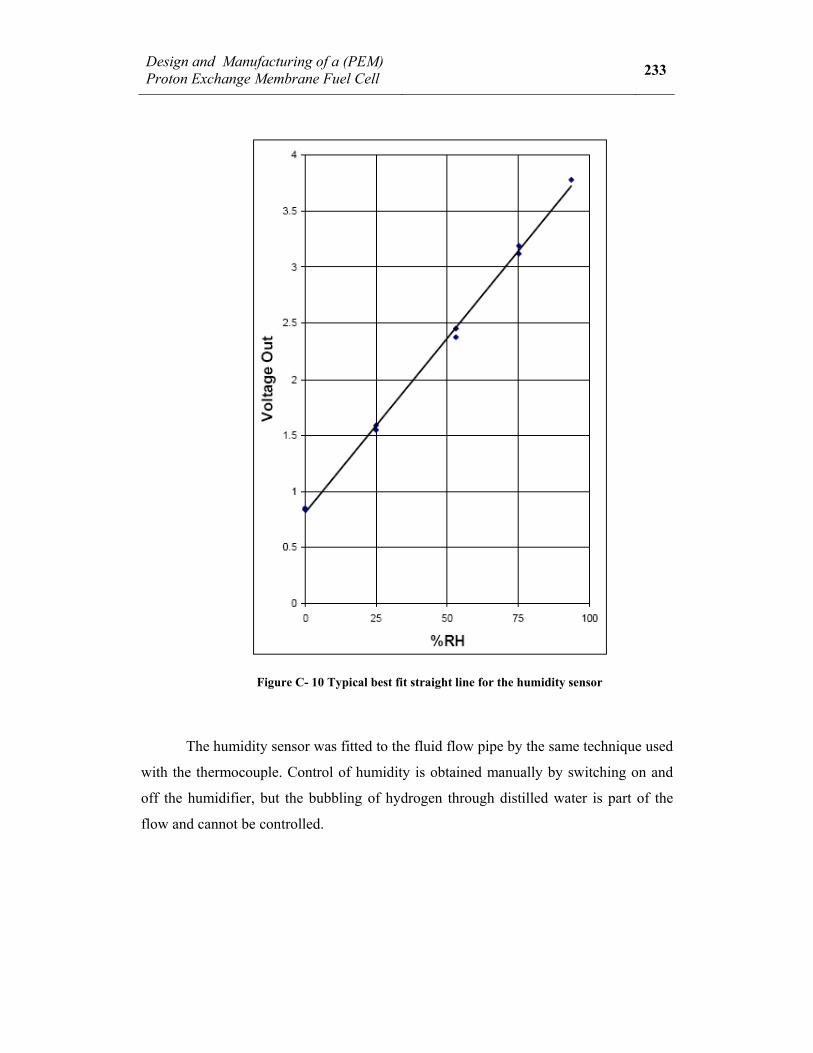
Figure C- 10 Typical best fit straight line for the humidity sensor .............................. 233
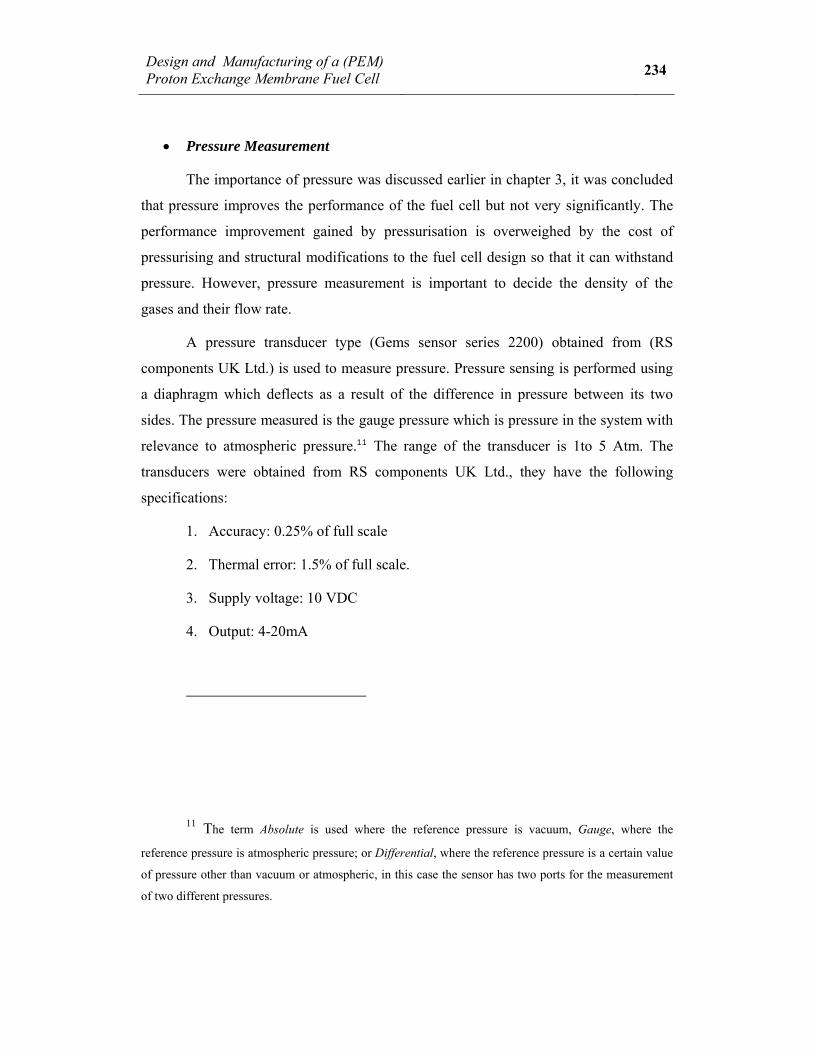
Figure C- 11 Measurement points for pressure, temperature and humidity along the inlet and outlet gas supplies, the pressure transducers are not fitted. ................................... 235
xi
Figure C- 12 The complete fuel cell test facility and gas conditioning unit ................ 236
Figure C- 13 Schematic of the front panel with identification numbers ...................... 237
Figure C- 14 Gas handling unit with analogue controls. .............................................. 240
Figure C- 15 Labjack® U12 data logger, a USB based analogue and digital I/O unit for data logging, data acquisition, measurement and control applications. ....................... 241
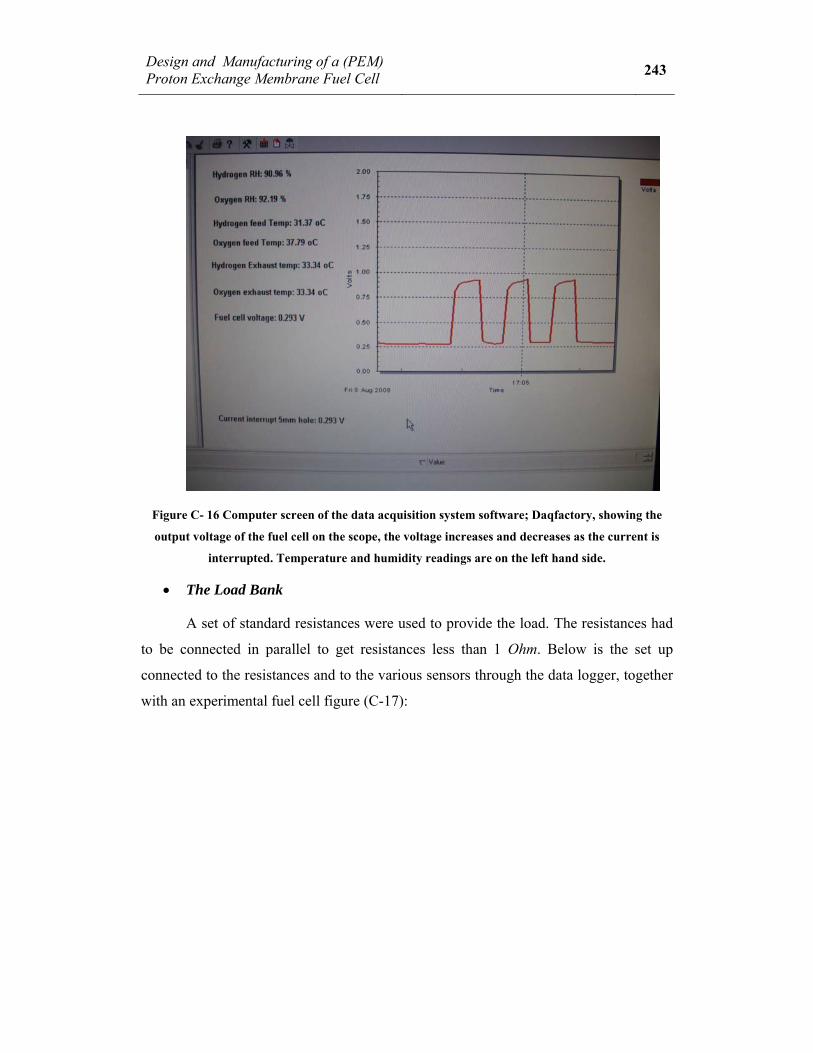
Figure C- 16 Computer screen of the data acquisition system software ...................... 243
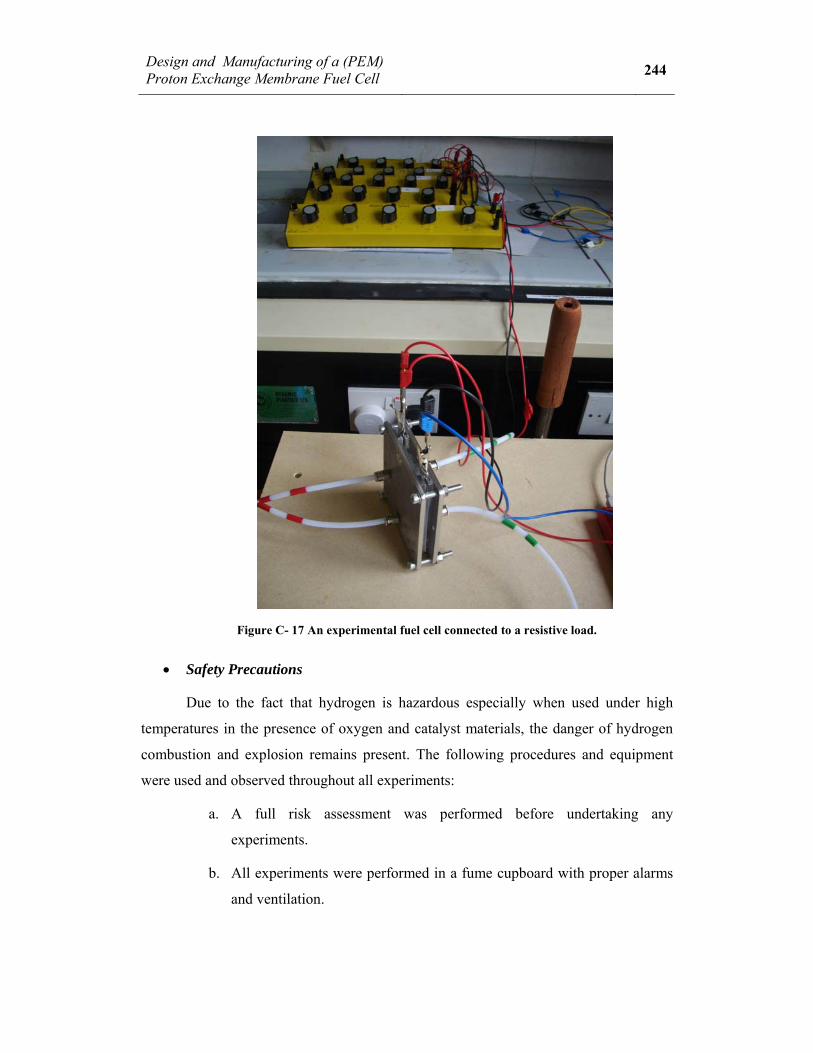
Figure C- 17 An experimental fuel cell connected to a resistive load. ......................... 244
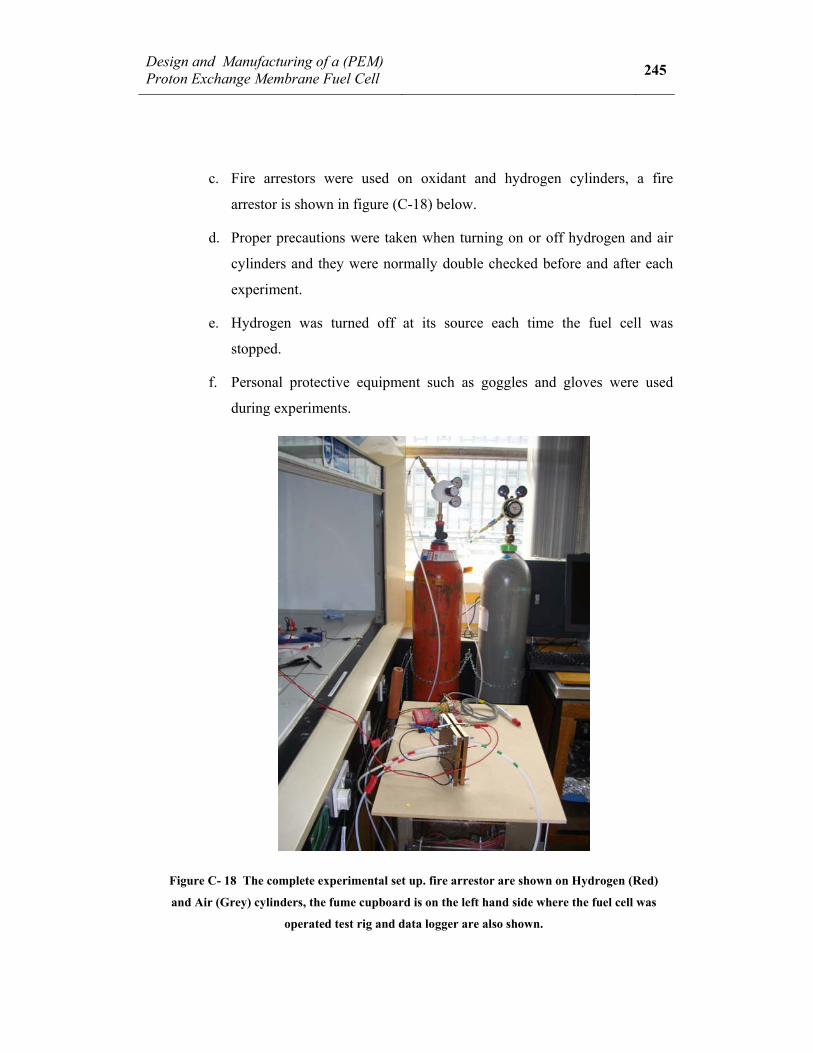
Figure C- 18 The complete experimental set up. fire arrestor are shown on Hydrogen (Red) and Air (Grey) cylinders. .................................................................................... 244
List of Tables
Table 1-1 Major types of fuel cells and their main features. ............................................ 6
Table 3-2 Values of constant parameters used to plot the polarisation curve ................ 82
Table 3-3 Gibbs free energy, enthalpy and calorific value for hydrogen ...................... 85
Table 4-1 Comparison of properties between Graphite and SS 316 .............................. 98
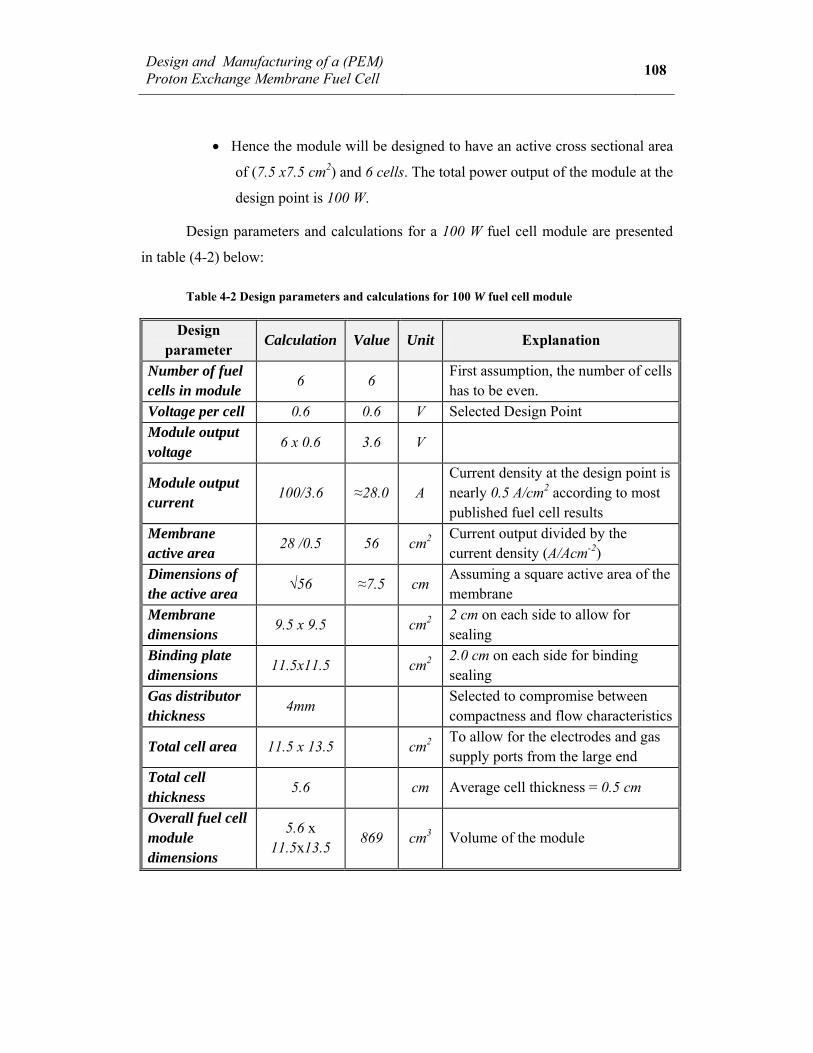
Table 4-2 Design parameters and calculations for 100 W fuel cell module ................. 108
Table 4-3 A summary of the inputs and outputs of the 100 W Fuel Cell Module ........ 115
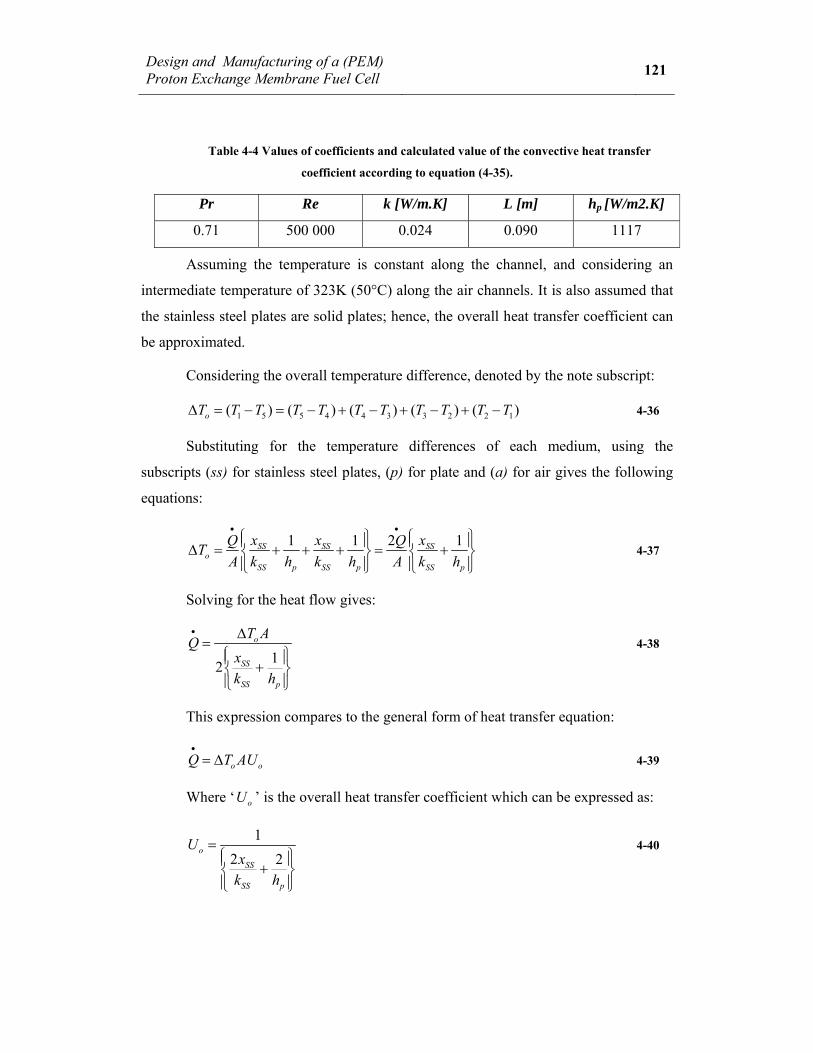
Table 4-4 Values of coefficients and calculated value of the convective heat transfer coefficient ..................................................................................................................... 121
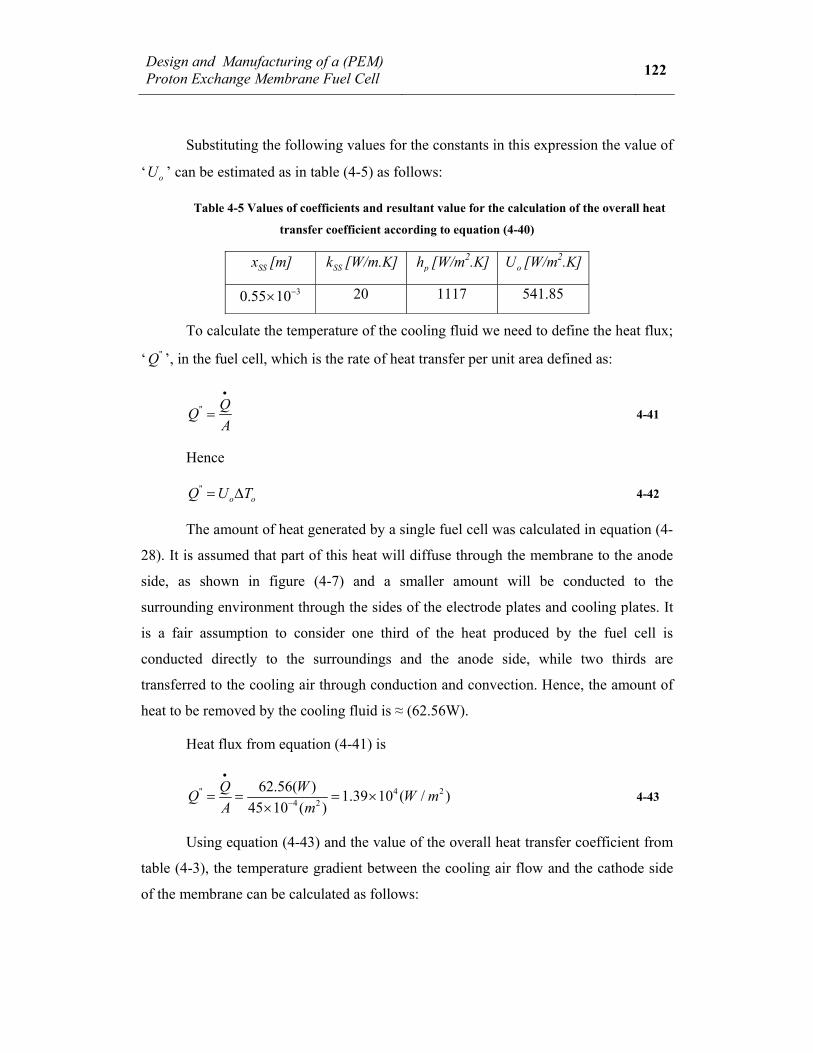
Table 4-5 Values of coefficients and resultant value for the calculation of the overall heat transfer coefficient ................................................................................................ 122
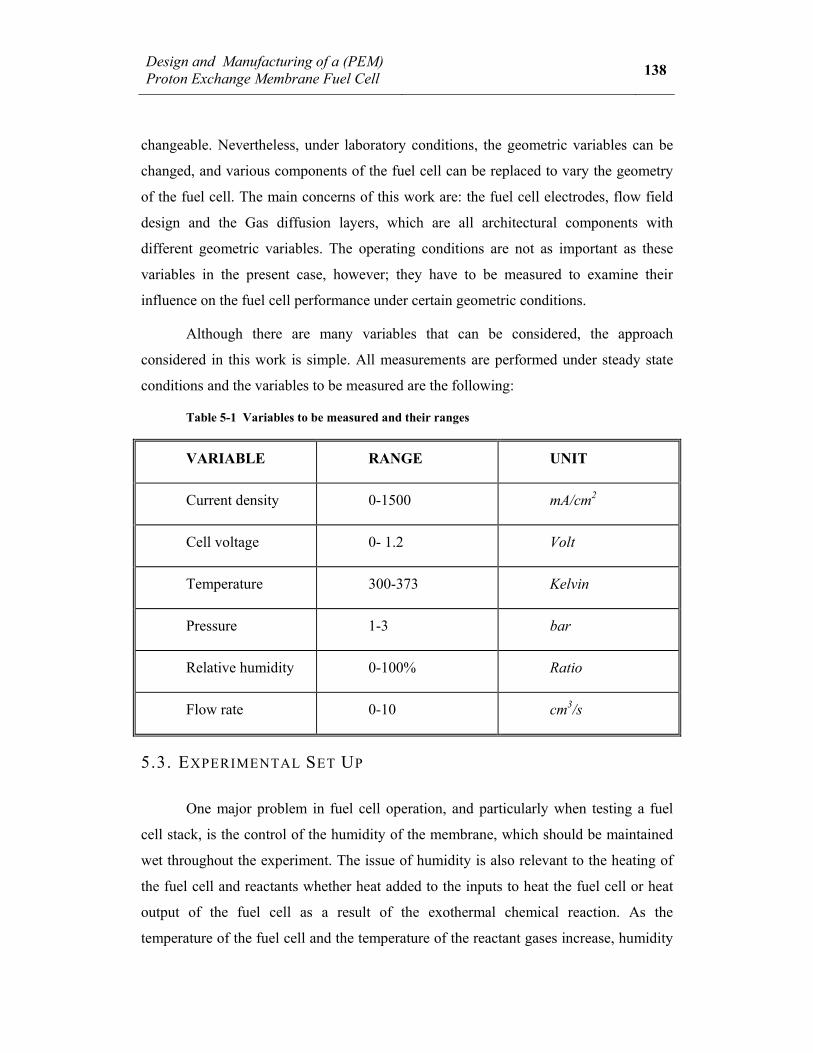
Table 5-1 Variables to be measured and their ranges .................................................. 138
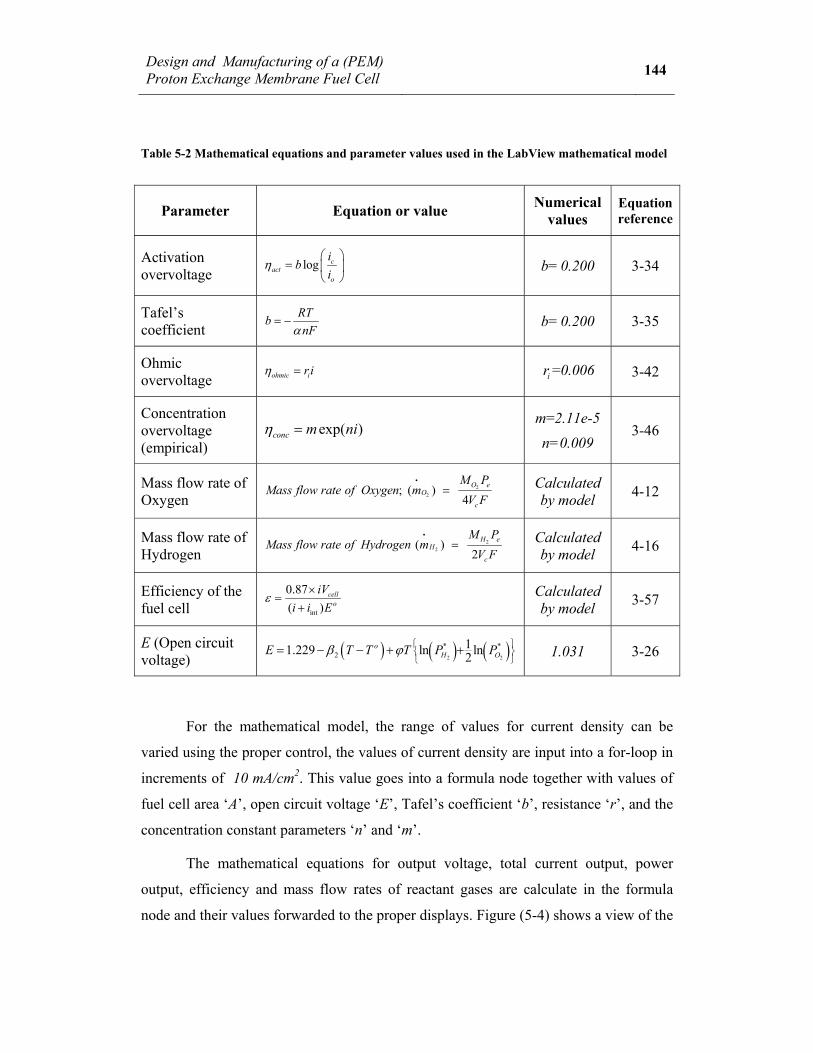
Table 5-2 Mathematical equations and parameter values used in the LabView mathematical model ...................................................................................................... 144
Table 6-1 Model parameters and physical properties of fuel cell components ............ 183
xii
Nomenclature
P,p Electrical power, Pressure V Voltage of the system/ Volume/ Atomic diffusion volume I Current drawn by the electrical load i Current density in Amperes per squared centimeter; (A/cm2) io Exchange current density A Cross sectional area/ Active area of the fuel cell in (cm2) n, c Number of cells in a fuel cell stack/ Number of electrons transferred per
Molecule in the reaction/ Constant parameter cellV Single cell voltage
F Faraday’s constant = 96485 (Coulomb/mole) e
n − The amount of electron transfer (kmol) t Time in (seconds) m Mass of fuel (kg)/ Constant parameter
•m Mass flow rate M Molar mass of fuel (kg/kmol) z Number of electrons transferred per molecule in the reaction
rGΔ Gibbs free energy (J/g. mole 2H ).
oE The electrode potential at equilibrium (also called the reversible potential or theoretical Open Circuit Potential or Open Circuit Voltage, i.e. OCP or OCV)
ooE Standard equilibrium potential gΔ Gibbs free energy change for the reaction defined on a per mole basis of
one of the reactants ogΔ Standard Gibbs free energy change for the reaction defined on a per mole
basis of one of the reactants T Temperature (K)
TΔ Temperature difference
hΔ Change in enthalpy
l Length (of membrane)
S, s Entropy, specific entropy
H, h Enthalpy, specific enthalpy
Eocv Open circuit voltage
b Parametric value in Tafel equation
m−
Molar flow rate of fuel
xiii
j Local transfer current densities
x Thickness of the medium/ Mole fraction
k Thermal conductivity of the medium.
ph Heat transfer coefficient of the plate
Nu Nusselt number
Re Reynold’s number
oT Overall temperature difference
q Amount of heat per second
u Velocity vector (m s−1), ‘
w Mass fraction
dn Drag coefficient
C Concentration
e− Charge of an electron= 191.602 10−× (Coulomb)
aN Avogadro's number= 236.022 10×
Q ,q Amount of heat
L Latent heat
sΔ Change in entropy
fgΔ Gibbs free energy of formation
a Activity
P* Partial pressure of a reactant gas(es)
R Universal gas constant (8.314 kJ/kmol.K), Resistance
Pr Prandtl number
oU Overall heat transfer coefficient
"Q Heat flux in the fuel cell
pc Specific heat capacity
D Diffusion coefficient (m2/s)/ Constant parameter
catR Volumetric current density, (Am−3)
EW Equivalent molecular weight
S Source or sink term/ Entropy
W,w Work (Joule)
xiv
U Internal energy of a system
2Oc∗ Effective concentration of oxygen at the cathode catalyst sites
NernstE Thermodynamic potential
Ci Reactant concentrations
2HCV Calorific value (Hydrogen)
Subscripts a Anodic/ air
c Cathodic
o Equilibrium state
act Voltage Losses Due to Activation
Ohmic Voltage Losses Due to Ohmic Resistances
conc Voltage Losses Due to Concentration Losses
int Voltage Losses Due to Internal Currents
M,m Membrane
electronic Electronic portion of the total resistance
protonic Protonic portion of the total resistance
i Internal Current Resistance
l The Limiting Current Density
wr Water Removal
w Water
ss Stainless Steel
p Plate
o Overall Temperature Difference
r Reversible
i Denotes Oxygen at the Cathode and Hydrogen at the Anode Sides
j Denotes Water Vapour at the Cathode and Anode Sides
2H O Water
2O Oxygen
λ Pertaining to Water Content of the Membrane
s Gas Distribution Along the Electrode
xv
OC, OCV Open Circuit, Open Circuit Voltage
cell Cell
rev Reversible
f Free Energy of Formation
remain Remaining heat in the fuel cell
Superscripts avg Average
hum Humidified o Standard State
electronic Electronic Portion of the Total Resistance
protonic Protonic Portion of the Total Resistance
i Internal
eff Effective
ref Reference
Greek symbols α Charge transfer coefficient
actcη Activation overvoltage at the cathode
actaη Activation overvoltage at the anode
ohmicη Ohmic overvoltage
concη Concentration overvoltage
ρ Specific resistivity ( ohm cm⋅ )
λ Effective water content of the membrane per sulphonic group ( 2 3/H O SO− )
1β Constant coefficient
2β Constant coefficient
ϕ Constant coefficient/ potential (Volt)
thε Thermal efficiency of the fuel cell
ϑ Polytropic index
xvi
γ Ratio between the specific heat capacities ( p
v
ccγ = )
μ Viscosity (kg m−1 s−1)
σ Effective conductivity
ξ Constant parametric coefficients ρ Density (kg/m3)
This research addresses the manufacturing problems of the fuel cell in an applied industrial approach with the aim of investigating the technology of manufacturing of Proton Exchange Membrane (PEM) fuel cells, and using this technology in reducing the cost of manufacturing through simplifying the design and using less exotic materials.
The first chapter of this thesis briefly discusses possible energy alternatives to fossil fuels, arriving at the importance of hydrogen energy and fuel cells. The chapter is concluded with the main aims of this study.
A review of the relevant literature is presented in chapter 2 aiming to learn from the experience of previous researchers, and to avoid the duplication in the current work.
Understanding the proper working principles and the mechanisms causing performance losses in fuel cells is very important in order to devise techniques for reducing these losses and their cost. This is covered in the third chapter of this thesis which discusses the theoretical background of the fuel cell science.
The design of the fuel cell module is detailed in chapter 4, supported with detailed engineering drawings and a full description of the design methodology.
So as to operate the fuel cell; the reactant gases had to be prepared and the performance and operating conditions of the fuel cell tested, this required a test facility and gas conditioning unit which has been designed and built for this research. The details of this unit are presented in chapter 5.
In addition to the experimental testing of the fuel cell under various geometric arrangements, a three dimensional 3D fully coupled numerical model was used to model the performances of the fuel cell. A full analysis of the experimental and computational results is presented in chapter 6. Finally, the conclusions of this work and recommendations for further investigations are presented in chapter 7 of this thesis.
In this work, an understanding of voltage loss mechanism in the fuel cell based on thermodynamic irreversibility is introduced for the first time and a comprehensive formula for efficiency based on the actual operating temperature is presented.
Furthermore, a novel design of a 100W (PEMFC) module which is apt to reduce the cost of manufacturing and improve water and thermal management of the fuel cell is presented. The work also included the design and manufacturing of a test facility and gas conditioning unit for PEM fuel cells which will be useful in performing further experiments on fuel cells in future research work.
Taking into consideration that fuel cell technology is not properly revealed in the open literature, where most of the work on fuel cells does not offer sufficient information on the design details and calculations, this thesis is expected to be useful in the manifestation of fuel cell technology.
It is also hoped that the work achieved in this study is useful for the advancement of fuel cell science and technology.
Design and Manufacturing of a (PEM) Proton Exchange Membrane Fuel Cell 1
Chapter 1 INTRODUCTION
1.1. ENERGY OPTIONS
Our primary source of energy is fossil fuel in the form of coal, oil and natural
gas. Other sources of energy such as solar, wind and wave energy may make a
significant contribution to our needs, but this contribution would be very limited and is
not expected to exceed 10% of the total demand for energy as projected by the Energy
Information Administration, the official energy review from the U.S. Government
figure (1-1):
Figure 1-1 World Primary Energy Consumption by Fuel Type, 1970-2025 [1]
Design and Manufacturing of a (PEM) Proton Exchange Membrane Fuel Cell 2
Although these predictions are not necessarily very accurate, and the trend of oil
consumption could change due to social and political reasons, the fact remains that
fossil fuels are running out at a considerable rate. Views that they will finish in a
specific number of years may differ, but there is no disagreement that they will be
exhausted one day. In contrast, the demand for energy is growing due to the rapidly
increasing population, rising standards of living and the emergence of new industrial
economies [2].
Finite fossil fuel resources are not the only problem. The use of fossil fuels has
created other difficulties, mainly environmental pollution and global warming.
Nevertheless, there have been some remedial efforts to reduce the impact of
environmental pollution, such as the Kyoto Protocol in 1997, which compels industrial
societies to gradually reduce the levels of production of harmful emissions, particularly
carbon dioxide, in an effort to reduce the green house emissions causing global
warming dilemma and its predictable tragic consequences.
This, however, creates further problems, such as the increasingly stringent
legislations directed to the control of harmful emissions. Yet, it fosters the efforts for
exploring cleaner sources of energy.
In the light of these circumstances, it is very important to find a clean and
reliable substitute for fossil fuels. Fuels produced from biological waste (bio-fuels) for
instance, are becoming very popular; but considering the demand for energy in a typical
power plant, such as a 500 MW power station, and considering the average efficiency of
a power plant which is in the range of 40%, the necessary power supply for such a
station is 1,250 MW, which means a consumption of nearly 32 kg/s of natural gas (the
calorific value of natural gas is 10.83 kWh/kg) or nearly 62.5 kg/s of biofuels (taking
the calorific value of sunflower oil; 5.56 kWh/kg, as an average value for biofuels) [3].
And considering an average yield of 1200 kg/acre of biofuel crops, it is obvious that
enormous land area is needed to run a station of that moderate size.
Although plants grown for the production of biofuels may not be human food
plants, increased plantation of biofuel plants occupies part of the agricultural land used
for growing crops in addition to consuming water resources and affecting the wild life,
Design and Manufacturing of a (PEM) Proton Exchange Membrane Fuel Cell 3
not to mention the green house gases that will be emitted in the process as a result of
using fuels containing carbon. Furthermore, the biofuel solution would not be
acceptable when the world is running out of food and, in terms of priority; agricultural
land and water cannot be sacrificed for running cars when the majority of people are
suffering from scarcity of food supplies.
The most abundant source of energy on planet earth is hydrogen; it is available
in almost infinite quantities in water, which covers two thirds of the surface of earth, in
hydrocarbons and it is part of every organic material, but it is not freely available as a
substance due to its high reactivity with other materials. Hydrogen is distinguished by
its high energy density and its clean reaction with oxygen in a combustion or oxidation
process where the only by-product is water, which renews the cycle of hydrogen
production.
Energy is required to extract hydrogen from hydrogen-rich materials such as the
electrolysis of water or thermal cracking of hydrocarbons and, as such, the economy of
hydrogen extraction has a direct impact on the energy efficiency of the system where it
is used. However, the same argument applies to hydrocarbon fuels, and the comparison
between the two should involve a well-to-wheels analysis.
Hydrogen is the smallest atom, and it is fairly easy, using the appropriate type of
catalyst, to divide it to an electron and a proton, which can be utilised in a fuel cell to
generate electrical energy.
1.2. FUEL CELLS AND HEAT ENGINES
The fuel cell, which is the subject matter of this research, is an electrochemical
energy conversion device that converts the chemical energy of its inputs to electrical
energy in a chemical reaction without the need for combustion, thus eliminating the
high energy losses and harmful emissions which are usually combined with the
combustion process.
The energy waste in the combustion process is an important factor that renders
the efficiency of the process low (28 - 45%) although this can be higher value in the
Design and Manufacturing of a (PEM) Proton Exchange Membrane Fuel Cell 4
case of heat recovery in a combined heat and power plant (CHP) or combined cycle gas
turbine (CCGT).
The efficiency of a heat engine is limited by the rise in temperature which is
limited by the Carnot efficiency. This implies that in order to achieve high values of
efficiency, the heat engine has to be operated at very high temperatures which places
severe demands on the material and equipment used and wastes energy. High
temperatures have another disadvantage which is the production of Nitrogen oxides,
which are likely to form at elevated temperatures.
Nevertheless, heat engines and particularly the internal combustion engine, are
credited with being the workhorses of our modern-day civilization, however their main
problems can be summarised as follows:
1. Whether they are operated on Hydrogen or hydrocarbon fuels, harmful exhaust
emissions which pollute the environment will be produced. In the case of
hydrocarbons, carbon monoxide, carbon dioxide and Nitrogen oxides will be
produced together with water vapour. In the case of pure Hydrogen, Nitrogen
Oxides will be produced at high temperatures together with water vapour. In
both cases the harmful emissions cannot be avoided.
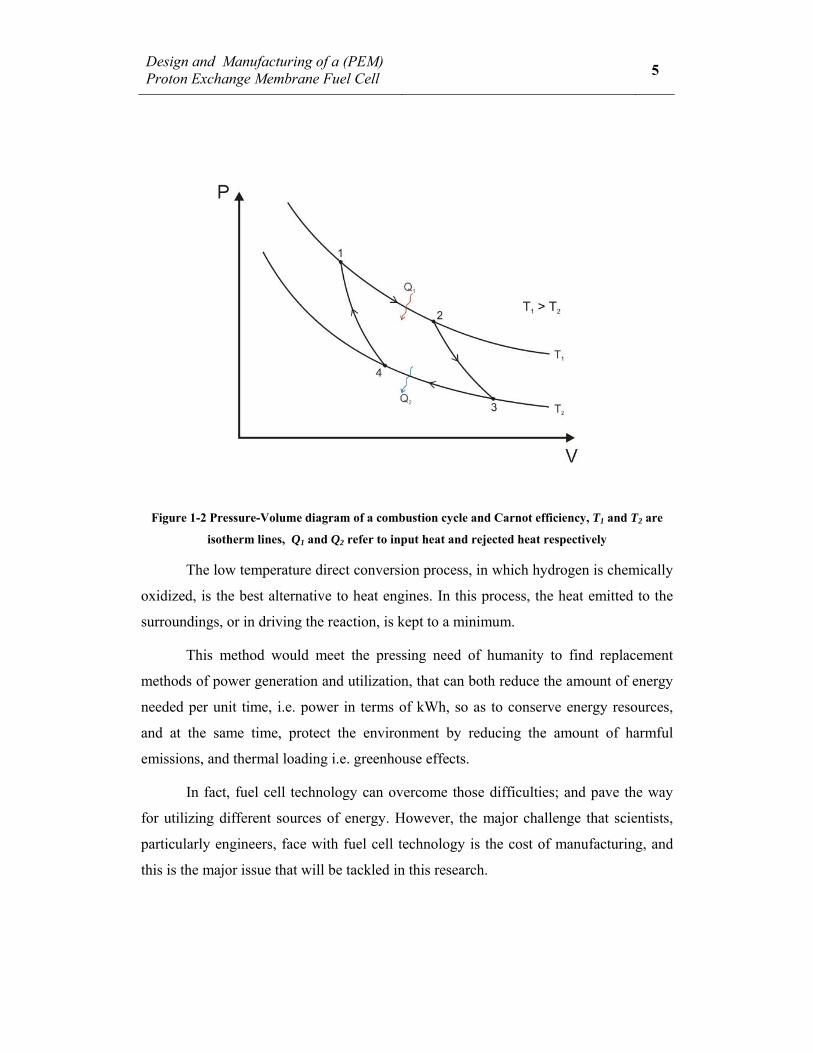
2. They are limited by the Carnot efficiency and have to be operated at high
temperatures; hence a lot of the energy used in them is wasted. The pressure
volume diagram below; Figure (1-2), shows the heat losses combined with the
combustion cycle and Carnot efficiency.
3. The use of Hydrogen in a combustion process creates more technical problems.
For instance, the blow-by gases containing water vapour will condense in the
engine compartment and cause deterioration of the lubricating oil which will
reduce the life-time of the engine.
Heat engines are severely criticised for their detrimental effect on the
environment, added to this is the fact that they are dependant on the rapidly depleting
resources of energy, which are not being utilized properly due to the poor efficiency of
heat engines.
Design and Manufacturing of a (PEM) Proton Exchange Membrane Fuel Cell 5
Figure 1-2 Pressure-Volume diagram of a combustion cycle and Carnot efficiency, T1 and T2 are
isotherm lines, Q1 and Q2 refer to input heat and rejected heat respectively
The low temperature direct conversion process, in which hydrogen is chemically
oxidized, is the best alternative to heat engines. In this process, the heat emitted to the
surroundings, or in driving the reaction, is kept to a minimum.
This method would meet the pressing need of humanity to find replacement
methods of power generation and utilization, that can both reduce the amount of energy
needed per unit time, i.e. power in terms of kWh, so as to conserve energy resources,
and at the same time, protect the environment by reducing the amount of harmful
emissions, and thermal loading i.e. greenhouse effects.
In fact, fuel cell technology can overcome those difficulties; and pave the way
for utilizing different sources of energy. However, the major challenge that scientists,
particularly engineers, face with fuel cell technology is the cost of manufacturing, and
this is the major issue that will be tackled in this research.
Design and Manufacturing of a (PEM) Proton Exchange Membrane Fuel Cell 6
1.3. TYPES OF FUEL CELLS
There are different types of fuel cells and different approaches in their
classification. Fuel cells are classified according to the type of electrolyte used in them,
fuel type, temperature of operation and physical nature of the electrolyte whether solid
or liquid. Almost all types of fuel cells run on hydrogen as a fuel, but other types of ions
can also be used in some fuel cells. Table (1-1) represents the major types of fuel cells:
Table 1-1 Major types of fuel cells and their main features.
Proton Exchange Membrane Fuel Cell (PEMFC)
Electrolyte Solid Polymer Operating Temp. °C 20 - 180
Anode Reaction 2H 2H 2e+ −→ +
Cathode Reaction 2 2½ O 2H 2e H O+ −+ + →
Mobile ion H +
Alkaline Fuel Cell (AFC)
Electrolyte (KOH) solution Operating Temp. °C 60 – 120
Anode Reaction ( ) 2 2H 2 OH H O 2e− −+ → +
Cathode Reaction ( )2 2½ O H O 2e 2 OH −−+ + →
Mobile ion ( )OH −
Phosphoric Acid Fuel Cell (FAFC)
Electrolyte Phosphoric Acid Operating Temp. °C 160 – 200
Anode Reaction 2H 2H 2e+ −→ +
Cathode Reaction 2 2½ O 2H 2e H O+ −+ + →
Mobile ion H +
Molten Carbonate Fuel Cell (MCFC)
Electrolyte Molten Carbonate Operating Temp. °C 500 – 650
Anode Reactions 2
2 3 2 2H CO H O CO 2e− −+ → + + 2
3 2CO CO 2 CO 2e− −+ → +
Cathode Reaction 2 2½ O 2H 2e H O+ −+ + →
Mobile ion 23CO−
Solid Oxide Fuel Cell (SOFC)
Electrolyte Ceramic Compound Operating Temp. °C 600 - 1000
Anode Reactions
2 2 2H O H O 2e− −+ → +
22CO O CO 2e− −+ → +
24 2 2CH 4O 2H O CO 8e− −+ → + +
Cathode Reaction 2 2 2 3½ O CO 2e CO− −+ + →
Mobile ion 2O−
Design and Manufacturing of a (PEM) Proton Exchange Membrane Fuel Cell 7
1.4. AIMS OF THIS RESEARCH
In view of the energy scenario given earlier in this chapter, the aims of this
research can be stated as follows:
1. To carry out a comprehensive critical review of the relevant literature with
focus on issues pertaining to the design of the fuel cell and theoretical
models of fuel cells available in the open literature.
2. To analyze current fuel cell designs in order to expose the areas of these
designs which can be developed to reduce the manufacturing cost of a
Proton Exchange Membrane Fuel Cell (PEMFC).
3. To design and produce selected components of the (PEMFC), such as the
electrode plates, gas distributors and their geometry.
4. To put forward the design details of a 100W fuel cell module based on the
design methodology adopted in this research with the aim of reducing the
cost of manufacturing.
5. To design and manufacture a fuel cell with variable configurations for
carrying out experimentation of the fuel cell in order to validate the design
methodology.
6. To develop a numerical model of the proposed fuel cell design so as to
perform parametric and optimisation studies on the fuel cell using
computational techniques, and to use the obtained experimental results for
validating the numerical model.
7. To design and build a test rig for operating the necessary experiments on the
manufactured fuel cell under various operating conditions, and to obtain
experimental results to validated the proposed design and mathematical
model.
8. To summarise the experience gained in this exercise and disseminate this
knowledge through reporting this research.
Design and Manufacturing of a (PEM) Proton Exchange Membrane Fuel Cell 8
Chapter 2 LITERATURE REVIEW
2.1. INTRODUCTION
In today's world, the need for more energy seems to be ever-increasing. Both
households and industries require large amounts of power. At the same time, the
existing means of energy production face new problems. International treaties aim to
limit the levels of pollution, global warming prompts action to reduce the output of
carbon dioxide and several countries have decided to decommission old nuclear power
plants and not build new ones. In addition, the unprecedented global increase in energy
demand has meant that the price of conventional energy sources has risen dramatically
and that the dependence of national economies on a continuous and undistorted supply
of such sources has become critical. Such development brings about the need to replace
old energy production methods with new ones. These new sources of energy have some
indisputable advantages over the older methods. At the same time, they present new
challenges [4].
Essentially, energy from these sources must come from a sustainable supply of
energy or else it will be exhausted, and must not involve combustion. The reason for
this is that the combustion process has a limited efficiency and produces unsafe gases.
These undesirable effects are apt to increase as demand increases, humanity must go for
direct conversion of energy which is combustion free. These criteria are met by
hydrogen when used in an electrochemical direct conversion process to produce
electrical energy.
Hydrogen has a major advantage over fossil and biological fuels. It can be used
in a direct conversion device to produce electricity with efficiency higher than that of
the combustion process, and it has the potential to reduce the harmful emissions as the
only by product of the reaction of hydrogen with pure oxygen is water.
The conversion device which avoids combustion and uses hydrogen to directly
produce work is the fuel cell. Ever since its discovery in 1839 at the hands of the welsh
Design and Manufacturing of a (PEM) Proton Exchange Membrane Fuel Cell 9
barrister William Grove, fuel cells lay dormant until the early fifties when a clean,
reliable and a highly efficient energy converter was needed for space missions.
In today’s measures, fuel cells are still too expensive for commercial
applications and a lot of effort is spent by the research community to bring their price
down. Thus any efforts to achieve these goals would be a significant contribution to the
technology of the fuel cell.
The price of any product depends on materials, labour and the manufacturing
processes. Dealing with materials and labour costs are outside the scope of this research,
but the manufacturing processes, including design, are the areas where this research is
focused to achieve the desired objective of reducing prices.
The research presented in this thesis focuses on investigating the design and
manufacturing with the aim of simplifying the design, which may be helpful in lowering
the cost of the fuel cell. Because of the oil crisis, energy prices have gone up to
unprecedented levels and energy research is being taken very seriously almost
everywhere. Industrial countries, who are the major consumers of oil, are spending
considerable amounts of money to deal with energy related research, where most of the
investment is spent on energy itself and not the energy conversion systems and, very
often, reference is made to solar and wind energies as if they are the solutions to our
energy and environmental problems. Under these circumstances, engineering has a key
role to play to present a solution to the current problems. It is the only discipline which
can deal with the technical aspects of the energy problem, while other disciplines are
dealing with the science of energy.
Tracking the general trends of publications in the field of energy, it is greatly
noticeable that the fuel cell has attracted a great deal of interest; however, design data
information is very rare and in many cases has not been validated.
Industrial applications of the fuel cells were stimulated by the fuel crisis of the
seventies. Since then there has been a flurry of research in new sources of energy, and
because of the multidisciplinary nature of the fuel cell, there has been a lot of input from
a vast range of disciplines, without a unifying force to bring them together. For these
reasons, it is impossible to review all that literature in this brief attempt.
Design and Manufacturing of a (PEM) Proton Exchange Membrane Fuel Cell 10
The present research is concerned with the design of a PEM fuel cell, an area
which is not very well disclosed in the open literature. Mainly the publications which
are directly relevant to this area are picked up and reviewed very carefully; papers that
are partially relevant are reviewed briefly, while papers and publications that provide
useful reading are included in the bibliography. Another purpose of this literature
review is to find the current state of the art and to explore the areas where the effort
should be focused in order to simplify the design and manufacturing process.
Current researches are mainly concerned with bringing the prices of fuel cells
from space levels down to earth levels. Despite this, the cost is still a stumbling block
in accepting fuel cells for commercial use. These researches are mainly concerned with
developing new manufacturing techniques [5], reducing the amount of noble materials
needed for fuel cell operation, mainly the Platinum catalyst, through the implementation
of nano-technology and other techniques [6, 7], and investigating new types of polymer
membranes that can withstand temperatures higher than 100oC and that are cheaper to
produce than the currently used perfluorinated membranes [8, 9].
Throughout the published literature on fuel cells, a lot of research has been done
on small scale fuel cells; but papers that plainly deal with the technology of construction
of the various components of fuel cell stacks are scarce. Most of the published
investigations concentrate on modelling and simulating the effects of varying operating
conditions on the performance of the fuel cell. The majority of these are published by
researchers who attempt to investigate these performances analytically, and then try to
verify their findings on a ready made fuel cell.
While such investigations are very useful in simulating and predicting the
performance of the fuel cell, they are not the main focus of this study. The aim of this
research, in addition to investigating the technology of construction of various fuel cell
components, is to study the influence of principal design variables on the performance
of the (PEM) fuel cells by means of parametric and numerical modelling and simulation
studies. The observations from these studies would serve as a graphical tool for design
optimization.
Design and Manufacturing of a (PEM) Proton Exchange Membrane Fuel Cell 11
2.2. BRIEF HISTORY OF FUEL CELLS
As early as 1839; William R. Grove, a welsh barrister and amateur scientist,
performed his first experiments in Swansea, and reported the effects of electrochemical
reactions; where electric current was produced by the chemical reaction of hydrogen
and oxygen (reverse electrolysis); that were produced on two different electrodes by the
electrolysis of water. In his account of this experiment he reported that: “A shock was
given which could be felt by five persons joining hands, and which, when taken by one
person was painful” [10]. He called it: “The Gaseous Battery”.
In 1841 and 1842 Christian Friedrich Schoenbein of Switzerland, published
experiments of his own that were similar in subject, and had results closely connected to
those of Grove. Schoenbein had been trying to prove that currents were not the result of
two substances coming into “mere contact” with each other, but were caused by
chemical reaction.
In 1882 a new form of “Gas Battery” was developed by Lord Rayleigh, and was
an attempt to improve the efficiency of the platinum electrodes by increasing the surface
of action between the solid electrode, the gas and the liquid [11].
In 1889 another improved form of the “Gas Battery” was described by Mond
and Carl Langer, this was more than an improvement; it was the prototype for the
practical fuel cell, in which they used a matrix, basically a porous, non-conducting
diaphragm, to hold the sulphuric acid; thus solving the problem of electrode flooding
caused by the electrolyte.
In response to the demonstration of Mond and Langer’s Gas Battery, Alder
Wright and Thompson (1889) brought attention to their “Double Action Plate Cells”
which was claimed to have been developed earlier [12].
In (1896) William W. Jacques reported his experiments to produce electricity
from coal. A few years after that Haber and Bruner (1904) worked on direct coal fuel
cells, which were called: “The Jacques Element” [12].
In the 1920s the gas diffusion electrode was recognized as the key for successful
low temperature operation of the fuel cell. A. Schmidt was one of the pioneers, followed
Design and Manufacturing of a (PEM) Proton Exchange Membrane Fuel Cell 12
by F. K. Bacon, who worked on an alkaline fuel cell system with porous metal
electrodes; his fuel cell system was the first prototype of the later NASA Space Fuel
Cell, which enabled men to fly to the moon in 1968 [12].
Ever since their success in space missions, fuel cells have been gaining more
interest and more success, though slow, in bringing them down to earthly prices and
applications. To achieve this, many new companies and research groups have been set
up around the world.
The Clean Urban Transport for Europe (CUTE), which is a European Union
project initiative; to test three fuel cell buses each in nine cities in Europe, is an example
of fuel cell applications on a wider scale. The project started in 2003 with the aim of
demonstrating the feasibility of an innovative, high energy efficient, clean urban public
transport system [13].
Recently, Boeing Research & Technology Europe (BR&TE), based in Madrid,
successfully trialled a manned fuel-cell hybrid electric plane under their project: "Fuel
Cell Demonstrator Airplane" (FCDA), which had been under development since 2001.
The sole goal of the programme was to demonstrate for the first time that a manned
airplane can maintain a straight level flight with fuel cells as the only power source [14].
Due to the industrial nature of this research, focus is centred mainly on issues
pertaining to the design and operation of (PEM) Fuel cells. This entails the areas which
are dealing mainly with the fuel cell hardware. Literature pertaining to other types of
fuel cells is excluded at first hand.
It is worth mentioning at this stage; that some aspects of this technology have
been treated in a confidential manner by their authors, and some procedures and
techniques are referred to as proprietary [15-17]. Hence, information revealed in some
publications is incomplete, and cannot be considered useful.
In this chapter, a review of the studies relevant mainly to the materials and
design of the fuel cell components are presented. The operational issues will be covered
briefly.
Design and Manufacturing of a (PEM) Proton Exchange Membrane Fuel Cell 13
Publications on modelling and simulation will be covered and used in the
formulation of a numerical model representing the design approach proposed in this
study, which will be used for testing and optimising the proposed fuel cell design. A
summary of the main observations from the literature is included in the last section of
this chapter.
2.3. REVIEW OF THE RELEVANT PUBLISHED LITERATURE
Review of the relevant published papers related to the design, manufacturing
and testing of a working (PEM) fuel cell would entail the following areas:
1. Materials and design of the fuel cell components:
(a) The Proton Exchange membrane.
(b) The membrane electrode assembly (MEA).
(c) Flow Structure and Electrode plates.
2. Operational issues.
3. Modelling and simulation.
2.3.1. Materials and Design of Fuel Cell Components.
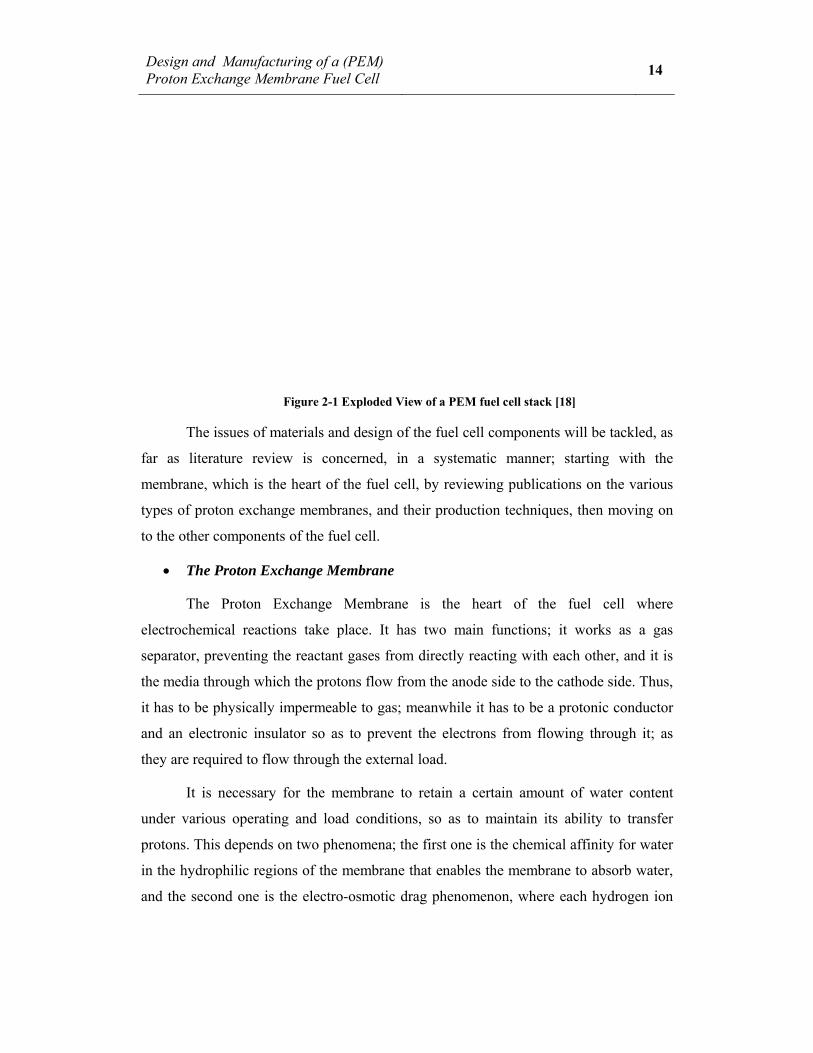
Figure (2-1) below shows an exploded view of a conventional Proton Exchange
Membrane (PEM) fuel cell where the electrode plates (denoted as bipolar plates and end
plates on the diagram) are made of graphite with machined channels for the flow of the
gases. The membrane, catalyst layers and gas diffusion layers are treated as one unit and
denoted the membrane electrode assembly (MEA).
Design and Manufacturing of a (PEM) Proton Exchange Membrane Fuel Cell 14
Figure 2-1 Exploded View of a PEM fuel cell stack [18]
The issues of materials and design of the fuel cell components will be tackled, as
far as literature review is concerned, in a systematic manner; starting with the
membrane, which is the heart of the fuel cell, by reviewing publications on the various
types of proton exchange membranes, and their production techniques, then moving on
to the other components of the fuel cell.
• The Proton Exchange Membrane
The Proton Exchange Membrane is the heart of the fuel cell where
electrochemical reactions take place. It has two main functions; it works as a gas
separator, preventing the reactant gases from directly reacting with each other, and it is
the media through which the protons flow from the anode side to the cathode side. Thus,
it has to be physically impermeable to gas; meanwhile it has to be a protonic conductor
and an electronic insulator so as to prevent the electrons from flowing through it; as
they are required to flow through the external load.
It is necessary for the membrane to retain a certain amount of water content
under various operating and load conditions, so as to maintain its ability to transfer
protons. This depends on two phenomena; the first one is the chemical affinity for water
in the hydrophilic regions of the membrane that enables the membrane to absorb water,
and the second one is the electro-osmotic drag phenomenon, where each hydrogen ion
Design and Manufacturing of a (PEM) Proton Exchange Membrane Fuel Cell 15
will travel accompanied with at least one molecule of water, hence causing a drag of
water molecules from the anode to the cathode [19].
The first phenomenon is a desirable one as it retains the water needed for proton
mobility in the membrane, while the second one causes a transfer of water molecules
from anode to cathode and hence reduces the protonic conductivity, and might lead to a
complete dry up of the anode side and flooding of the cathode side of the membrane.
Nevertheless, there is another problem affecting the water content of the membrane,
which is the evaporation of water. This is the main reason for operating the fuel cell at
temperatures below 100oC. If the membrane could be developed in such a way that
enables it to retain water or to retain its protonic conductivity at temperatures above
100oC, in the range of 100-200oC for instance, the performance of the fuel cell will be
improved substantially due to the following reasons:
1. Higher temperatures reduce the water management problem as the water
produced by the fuel cell will come out as vapour, which is easier to remove
from the fuel cell, as it can be driven out of the flow field channels by the stream
of gases.
2. Higher temperatures promote the chemical reaction in the fuel cell and improve
its output voltage.
3. The diffusivity of the hydrogen protons through the membrane electrolyte is
enhanced due to higher temperatures, thereby reducing membrane resistance
[20].
4. Catalyst tolerance to carbon monoxide and other impurities is enhanced at higher
temperature; they also promote the catalytic activity, hence reducing the
required amount of catalyst, which reduces the cost of the fuel cell.
The state of the art in the fuel cell technology membranes is the Nafion®
membrane (a registered trade mark of Du PontTM Co.), which is a perfluorinated
sulfonic acid (PFSA) membrane, however, there are other variants based on the same
type of membrane such as Flemion® and Aciplex® membranes, which are also well
known in the fuel cell industry [21].
Design and Manufacturing of a (PEM) Proton Exchange Membrane Fuel Cell 16
Up to now, these membranes have been the best choice for commercial low
temperature (<80°C) polymer electrolyte membranes. The advantages of (PFSA)
membranes are:
1. Their strong stability in oxidative and reduction media due to the structure of the
polytetrafluorethylene backbone.
2. Their proton conductivity, which can be as high as 0.2 S.cm-1 (Siemens per
centimetre)1 [22] in polymer electrolyte fuel cells.
When these membranes are used in (PEM) fuel cells at elevated temperatures
(higher than 80°C), the performance of the fuel cells decreases. This decrease is related
to the following reasons [23]:
1. Dehydration of the membrane.
2. Reduction of the ionic conductivity of the membrane.
3. Decrease in affinity with water.
4. Loss of mechanical strength through a softening of the polymer backbone.
5. Parasitic losses (the high level of gas crossover).
The work presented by Savadogo [23] was an exhaustive review of the various
aspects of works done recently on the developments of composite membranes for
polymer electrolyte fuel cell (PEMFC) applications. Research on alternative proton
conducting membranes to the per-fluorinated membranes for high temperature PEMFC
applications is shown. The following aspects of the researches on proton conducting
proton membranes were discussed:
1 Siemens per centimetre (S/cm) is a unit in the category of Electric conductivity and has a dimension of ‘M-1L-
3t3I2 ,where ‘M’ is mass, ‘L’ is length, ‘t’ is time, and ‘I’ is electric current.
Design and Manufacturing of a (PEM) Proton Exchange Membrane Fuel Cell 17
1. Macro- and Nano-composites per-fluorinated ionomer composite membranes
(PFICMs).
2. Partially per-fluorinated composite membranes.
3. Non-perfluorinated composite membranes.
Results based on the original works of the author were also presented. It was
concluded that two main characteristics of the current membranes were the causes of
high cost and operation intricacy; namely:
1. The perfluorination step, which is a costly process.
2. The low temperature operation (<80 °C), which is necessary so as to maintain
humidity of the membrane, and hence the proton transfer.
Genies et al. [8] presented a preparation method for soluble sulfonate
naphthalenic polyimides by polycondensation in m-cresol, using aromatic diamines
containing phenyl- ether bonds and / or bulky groups. The paper described the synthesis
procedures and related properties of new naphthalenic copolyimides. This was
supported later on by U.S Patent: 6,245,881 [24] by the same authors. It was claimed in
the publication that the proposed polymer was cheaper than Nafion®, but with similar
properties; especially durability and proton conduction. The originality of the author’s
approach stems from the introduction of ionic groups on to the polyimide backbone,
using a sulfonated monomer.
Despite the laborious work undertaken by the authors, it was concluded that the
ionic conductivity values were in the order of few mS.cm-1 at room temperature; these
values remain quite low compared to 0.1 S.cm-1 required for fuel cell application.
However, the methodology presented is worth following in the process of synthesizing
polyimide membranes for fuel cell applications. A similar approach can be followed by
introducing different ionic groups onto the same, or an alternative, polyimide backbone.
• The Catalyst Layer and Fabrication of the MEA.
A thin film of highly intermixed ionomer and catalyst (which is mainly
Platinum, Pt) is applied to the electrolyte membrane; the ionomer serves as a protonic
Design and Manufacturing of a (PEM) Proton Exchange Membrane Fuel Cell 18
conductor, while the catalyst, and another electrically conducting material like Carbon,
serve as an electronic conductor, thus making this film conductive for both protons and
electrons.
The focus of researchers in the context of catalysts for PEM fuel cells was
focused on two main issues:
1. Reducing the cost of catalyst per kW, either by the economic use of Platinum (or
its alloys), or by finding other cheaper catalyst materials [11].
2. Tolerance to Carbon Monoxide (CO), particularly when the hydrogen fuel is
produced from Hydrocarbons such as Methanol. This only applies to the anode
where the catalyst material can get poisoned when reacted with carbon
monoxide, while the cathode catalysts do not have to be CO tolerant. Mehta et
al. [25] classified the anode catalyst materials into three categories:
Single metal catalyst, based on a single element which is Platinum (Pt).
Binary catalysts, based on platinum and another material.
Tertiary catalysts, those are based on two elements added to Platinum, but in
these catalysts, Ruthenium (Ru) plays an important role. The authors listed
26 possible anode catalyst alloys.
However, for the cathode of the fuel cell, catalysts that can stimulate oxygen
reduction are needed. The authors pointed out that little information was available on
cathode catalysts for PEM fuel cells. Nevertheless, Pt/C is the main catalyst, although
non-platinum catalysts are being researched.
Two modes for the preparation of the (MEA) are reported in the work of Mehta
et al.[25]:
• Application of the catalyst layer to the Gas Diffusion Layer (GDL) followed by
membrane addition.
• Application of the catalyst layer to the membrane followed by (GDL) addition.
Design and Manufacturing of a (PEM) Proton Exchange Membrane Fuel Cell 19
However, several manufacturing options exist within these two modes of (MEA)
manufacturing.
As far as the application of the catalyst layers are concerned, there are various
methods published in the literature. Wilson et al. [7] presented two methods for the
application of catalyst and the preparation of the (MEA) for the perfluorinated type of
membranes. The technique presented was based on the preparation of a solubilised form
of the thermoplastic ionomer by simply converting the perfluorinated ionomer into the
thermoplastic form by the ion exchange inclusion of large, “hydrophobic” counter-ions
such as Tetrabutylammonium (TBA+). In this way, a solubilised thermoplastic form of
the ionomer was made available. Thus, thin-film catalyst layers are cast from inks that
consist of supported platinum catalyst and solubilised ionomer in the (TBA+) form. The
catalyst can then be applied to the membrane either directly; or via a decal transfer
process.
The work presented by Wilson et al. [7] is claimed to offer two advantages:
• The performance of the cells is claimed to be very good.
• The (TBA+) processed cells have a distinct advantage over the other low
platinum loading cells in the long-term performance.
Another method for the preparation of the catalyst layer was presented by
Shukla et al. [26], Pt/C (Platinum on Carbon) was prepared for the cathode and PtRu/C
(Platinum-Ruthenium on Carbon) for the anode. The Pt content in both cathode and
anode was maintained at about 5 mg cm-2. When applied to Nafion® 117 by compacting
under a pressure of 50 kg cm-2 at 125oC for 3 minutes, the (MEA) thus obtained was
about 1 mm in thickness. The paper presents a systematic approach to manufacturing
MEAs which is useful.
Atonolini et al. [27] aimed to evaluate the effect of Ruthenium (Ru) content on
carbon-supported PtRu (Platinum-Ruthenium) alloys, with respect to phase
composition, crystallinity, particle size, surface area of the alloy and metal-carbon
interaction, and to correlate them to fuel cell performance with H2 and H2+CO.
Design and Manufacturing of a (PEM) Proton Exchange Membrane Fuel Cell 20
The catalyst was prepared using a deposition and reduction process of Pt and Ru
precursors. The powders were fabricated by a spray technique into three-layer
electrodes for PEM fuel cells.
It was shown in this study that PtRu/C catalyst showed a better CO tolerance
than Pt/C, which is useful in the case when fuels with high content of carbon-monoxide
are used in the fuel cell such as reformed hydrocarbon fuel.
A promising technique for the application of the catalyst to the (PEM) is through
the syntheses of hexachloroplatinate (PtCl6) through chemical reaction where aqueous
(PtCl6) ions are transferred to non-polar organic solvents by phase-transfer molecules,
Mandal et al. [28] described a single step method for the synthesis of catalytically
active, hydrophobic (Pt) nanoparticles by the spontaneous reduction of aqueous (PtCl6)
ions at a liquid–liquid interface.
Zhang et al. [29] described another technique for the production and application
of the catalyst based on hexachloroplatinate, where Platinum–ruthenium catalysts were
prepared by incipient wetness co-impregnation of the carbon support with solutions of
RuCl3·xH2O and H2PtCl6·6H2O in a benzene and ethanol mixture (4:1 in volume) with
the appropriate concentrations to obtain different loadings. The authors were mainly
concerned with the characterization of highly dispersed (Pt/Ru) alloyed catalysts with
different Pt:Ru atomic ratios and uniform particle sizes. However, the main concern
here is the preparation technique of the catalyst for which this paper is useful.
• Gas Diffusion Media
In polymer electrolyte membrane fuel cell (PEMFC) electrodes, an effective
mass transport of reactants as well as products to/from the reaction zones is of utmost
importance to achieve high reaction rates with minimal efficiency losses. Accordingly,
Design and Manufacturing of a (PEM) Proton Exchange Membrane Fuel Cell 21
such electrodes include a porous Gas Diffusion Layer (GDL) between the flow field of
the bipolar plate and the reaction zone (the catalyst layer), to ensure a homogeneous and
efficient mass transport over the whole active area of the cell [30]. In most cases, the
Gas diffusion layer (GDL) consists of an anisotropic2 [31] fibrous structure, either in the
form of paper or woven cloth that allows the distribution of reactant gases through the
porous structure and the collection of current through the fibres. Figure (2-2) is a
microscopic view of Toray® paper GDL [32]:
2 Anisotropy is the property of being directionally dependent, as opposed to isotropy, which means
homogeneity in all directions. It can be defined as a difference in a physical property (absorbance, refractive
index, density, etc.) for some material when measured along different axes. An example is the light coming
through a polarizing lens.
Design and Manufacturing of a (PEM) Proton Exchange Membrane Fuel Cell 22
Figure 2-2 Microscopic image depicting the random fibre structure of a GDL formed of Toray®
carbon paper [32]
The (GDL) has several specific functions [33]:
• Reactant permeability: provides reactant gas access from the flow-field
channels to the catalyst layers including the in-plane permeability to regions adjacent to
lands.
• Product permeability: provides passages for the removal of product water from
catalyst-layer area to flow-field channels including in-plane permeability from regions
adjacent to lands.
• Electronic conductivity: provides electronic conductivity from the bipolar
plates to the catalyst layers including in-plane conductivity to regions adjacent to
channels.
• Heat conductivity: provides for efficient heat removal from the membrane
electrode assembly (MEA) to the bipolar plates where coolant channels are located; and
• Mechanical strength: provides mechanical support to the MEA in case of
reactant pressure difference between the anode and cathode gas channels; thus
maintaining good contact (i.e. good electrical and thermal conductivity) with the
catalyst layer, and preventing the MEA from compressing into the channels and
resulting in blockage to flow and consequently high channel pressure drops.
Design and Manufacturing of a (PEM) Proton Exchange Membrane Fuel Cell 23
Most of the published scientific work on PEMFC gas-diffusion media, which is
very little, is of an applied nature. This reflects the fact that current diffusion media is
typically not a major source of voltage loss within the state-of-the-art PEMFCs.
However, this component is expected to receive additional attention as focus shifts from
steady-state performance to cold-start and stability, issues that will require tailoring of
the diffusion media to more efficiently deal with liquid water under a variety of
conditions. Durability and cost considerations also increase focus on the gas diffusion
media [33].
Conventional GDLs have arbitrary micro-structure and small pore size,
especially under compression, which can require larger capillary pressures to drive
liquid water through. Consequently, the GDL and catalyst layer in practical PEM fuel
cells undergo flooding. The key issues of flooding and mass transport limitation under
steady-state and transient (e.g., start-up) conditions will benefit significantly from GDLs
with carefully designed architectures and controlled pore-size distribution [34].
Moreira et al. [35] studied the influence of the type and combination of gas
diffusers on the performance of the MEA. As gas diffusers, carbon cloth and carbon
paper were used in different combinations. In their experimental procedure they gave a
detailed account of the preparation of the GDL and the test procedures which can be
very useful. It was concluded that the carbon cloth has better characteristics as the gas
diffusion electrode in a PEM fuel cell than the carbon paper.
Zhang et al. [34] fabricated a novel porous medium from copper foil using
nanotechnology and investigated its performance as replacement for a conventional
GDL in an operational fuel cell. They demonstrated that if the pores were straight and
not interconnected, the liquid water would freely drain out of the GDL once the water
flow was initiated. Such a careful optimization of pore morphology and pore-size
distribution is difficult to achieve in conventional GDLs due to the random distribution
of carbon fibres. Furthermore, conventional GDLs are typically made hydrophobic by
treating them with PTFE, which increases their weight by 5 to 30% and also reduces
their electronic and thermal conductivities. In addition, GDLs made from carbon cloth
or carbon paper are subjected to compressive stresses which reduce their thickness, and
Design and Manufacturing of a (PEM) Proton Exchange Membrane Fuel Cell 24
decrease their porosity and permeability by up to 50%. These conditions also limit the
durability of the GDL and consequently the fuel cell. The small thickness and straight
pore feature of the proposed material provided improved water management even at low
flow rate which was an improvement from the conventional GDL; however, they
showed lower performance indicated by the sharp decline of the polarisation curve at
low flow rates. The developed copper GDL only had straight pores which restricted its
in-plane transport. As a result, the reaction could occur only under the flow channel
area, but not under the land area. The authors attempted to overcome this problem by
inserting a carbon paper GDL between the bipolar plate and the copper GDL for the
purpose of demonstration which improved the performance, but using GDLs again in
the fuel cell.
Other scopes of improvement were proposed by the authors which included
increasing the porosity of the GDL and changing the pore morphology and dimensions
for better water removal. The study presented an empirical study on the production
techniques and design of a metallic GDL. It also pointed out various avenues of
development in terms of the materials applicability to fuel cells and design optimization.
However, the justification presented for the declined performance did not take into
consideration the chemical behaviour of the metallic GDL.
• Flow Structure and Electrode Plates.
In this research it is intended to explore new approaches to design through which
the cost of the fuel cell can be reduced. The electrode plates contribute largely to the
high cost of the fuel cell and there is ample scope for reducing this cost through the use
of new materials and production and machining techniques. Hence, it is very important
to understand the main functions of the electrode plates and to study the various trends
in their design and manufacture as presented in literature.
Research in the area of Bipolar Plates (BPP) is focused on two main issues that
facilitate the functions of the bipolar plates: Materials and Topologies of the electrode
plates.
It is important to point out at this stage that the terminology used to describe the
electrode plates and flow field plates is ambiguous and sometimes confusing. The word
Design and Manufacturing of a (PEM) Proton Exchange Membrane Fuel Cell 25
electrode is used to describe many components of the fuel cell that include the catalyst
layer, the gas diffusion layer (GDL) and the bipolar plates. It is almost customary in the
literature to describe the electrode plates as Bi-polar or Uni-polar plates. It should be
noted here that the terms (Bi-polar or Uni-polar plates) apply only to plates that
incorporate flow fields for the flow of gases in a fuel cell where the cells are in series
and in direct contact with each other.
A comprehensive overview of the state of the art technology of the Electrode
Plates in a PEM fuel cell stack was presented by Xianguo et al. [36]. A variety of flow
channel configurations have been proposed in different designs, including pins, straight
channels, interdigitated channels and channels formed from sheet metals.
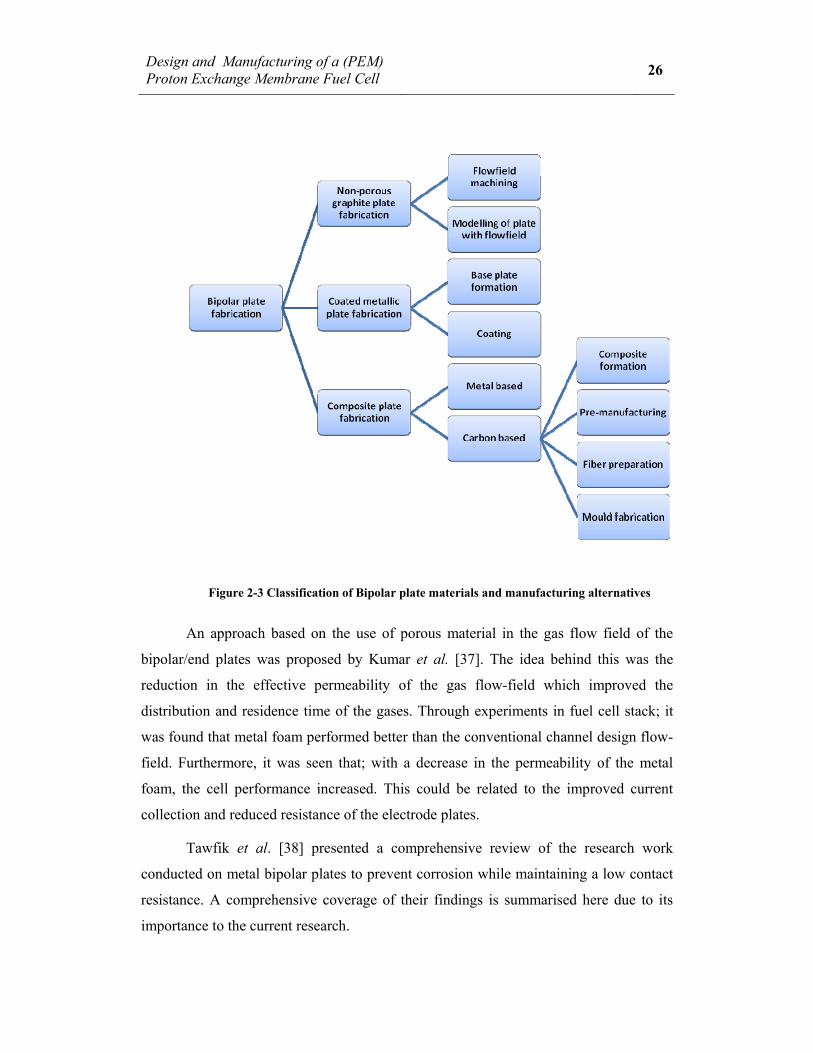
Mehta et al. [25] presented a review and analysis of bipolar plate design and
manufacturing. The plate materials were classified into three categories: Non-porous
graphite plates, coated metallic plates and composite plates. Graphite has been
traditionally used in fuel cells due to its chemical stability. The acidic environment of
the fuel cell, enhanced with high temperatures will cause metallic plates to corrode or
dissolve, consequently, metal ions will diffuse into the membrane; and they will get
trapped at the ion exchange sites, hence lowering the ionic conductivity of the
membrane. In addition, a corrosion layer on the surface of the bipolar plate increases the
electrical resistance in the corroded portion and decreases the output of the cell.
Because of these issues, metallic bipolar plates are designed with protective
coating layers. The authors presented an overview of plate materials and possible
coating materials for metallic plates. Figure (2-3) below summarizes the information
presented:
Design and Manufacturing of a (PEM) Proton Exchange Membrane Fuel Cell 26
Figure 2-3 Classification of Bipolar plate materials and manufacturing alternatives
An approach based on the use of porous material in the gas flow field of the
bipolar/end plates was proposed by Kumar et al. [37]. The idea behind this was the
reduction in the effective permeability of the gas flow-field which improved the
distribution and residence time of the gases. Through experiments in fuel cell stack; it
was found that metal foam performed better than the conventional channel design flow-
field. Furthermore, it was seen that; with a decrease in the permeability of the metal
foam, the cell performance increased. This could be related to the improved current
collection and reduced resistance of the electrode plates.
Tawfik et al. [38] presented a comprehensive review of the research work
conducted on metal bipolar plates to prevent corrosion while maintaining a low contact
resistance. A comprehensive coverage of their findings is summarised here due to its
importance to the current research.
Design and Manufacturing of a (PEM) Proton Exchange Membrane Fuel Cell 27
The authors stated that the ideal characteristics of a bipolar plate’s material are:
high corrosion resistance and low surface contact resistance, like graphite, and high
mechanical strength, no permeability to reactant gases and no brittleness like metals
such as stainless steel, aluminium, titanium, etc. The main challenge, however; is that
corrosion-resistant metals develop a passivating oxide layer on the surface that protects
the bulk metal from the progression of corrosion, but also causes the undesirable effect
of a high surface contact resistance. This causes the dissipation of some electric energy
into heat and a reduction in the overall efficiency of the fuel cell power stack. The
authors also presented a review of the different approaches in using non-coated and
coated metals, metal foams and non-metal graphite composites for potential application
in PEM fuel cells. The following chart; Figure (2-4), summarises the various
approaches described in this paper:
Figure 2-4 Metal-based materials for potential application in PEM fuel cells
Design and Manufacturing of a (PEM) Proton Exchange Membrane Fuel Cell 28
The authors reported that aluminium, stainless steel, titanium, and nickel BPP
when exposed to an operating environment similar to that of a fuel cell with a pH of (2–
3) at temperatures around 80 oC were prone to corrosion or dissolution (Dissolution is
most likely in the case of Aluminium). Moreover, a corrosion layer on the surface of a
BPP increases the electrical resistance and decreases the output of the cell. While this
surface oxide layer protects the metal and stops the corrosion from progressing further
through the lower layers (beneath the surface), it forms an electrically insulating
interfacial layer. As the thickness of the oxide layer increases the electrical surface
contact resistance also increases and accordingly causes a decrease in the electric power
output.
Furthermore, the authors reported that both austenitic 349TM and ferritic
AISI446 stainless steel with high Cr (Chromium) content showed good corrosion
resistance and could be suitable for fuel cell application as electrode plates; though
AISI446 requires some improvement in contact resistance due to the formation of a
surface passive layer of Cr2O3.
It was additionally verified by the same authors that (Cr) in the alloy forms a
passive film on the surface of stainless steel. Consequently, as the (Cr) content in
stainless steel increased, the corrosion-resistance improved, however; a thick non-
conductive surface passive layer of Cr2O3 will produce an undesirable low surface
contact resistance. Moreover, uncoated metal ions and oxides could directly foul the
electrolyte and tarnish the catalyst in the MEA which results in considerable adverse
effects on the cell performance. They also found that metal dissolution will occur as the
non-protected metal bipolar plates are exposed to the harsh operating environment
inside the fuel cell, which is very conducive to corrosion with relative humidity of more
than 90%, high acidity (pH 2–3) and temperature range of 60-80°C. The dissolved metal
ions diffuse into the membrane and then get trapped in the ion exchange sites inside the
ionomer, resulting in lowered ionic conductivity as described by Mehta et al. [25]. A
highly conductive corrosion resistance coating with high bonding strength at the
interfacial layer between base metal substrate and coating layer is required to minimize
this problem.
Design and Manufacturing of a (PEM) Proton Exchange Membrane Fuel Cell 29
As far as coatings for stainless steel are concerned, the authors reported that the
use of appropriate corrosion-resistant coatings on metallic components offers an avenue
to minimize material degradation and extend their lifetime. The results revealed that
(Tin) coating can offer SS316 stainless steel higher corrosion resistance and electric
conductivity than uncoated SS316. Further efforts to improve the coating quality and
evaluation of the long-term stability of SS316/Tin coating system under simulated
conditions are required. It was also indicated that Au-coated SS316 stainless steel
clearly demonstrated no difference between the metal-based and graphite plates. An
important speculation by the authors in a previous publication and reported here states
that a smoother surface finish may further reduce and/or improve the following bipolar
plate characteristics:
• The interfacial resistance.
• The micro potential difference between the (MEA) and the metallic bipolar
plates; which may further reduce localized corrosion of the metallic bipolar
plates.
• The surface characteristics became hydrophobic; which may improve the two-
phase flow of the reactant gases and water.
Another interesting piece of information regarding porous metals and metal
foam was presented in this work; in which it was indicated that metal foams performed
better than the conventional channel design flow-field. Furthermore, it was seen that
with a decrease in permeability of the metal foam, the cell performance increased (but
of course to a certain limit; after which the performance is expected to decline due to
transport limitations of the reactant species). The performance could be further
improved by carefully tailoring the size, shape and distribution of pores in the metal
foam. This agrees with the concept proposed by Kumar et al. [37] mentioned earlier in
this report. The authors confirm that an additional advantage will accrue as these metal
foams could possibly be used for catalyst support in the electrochemical reactions
within the fuel cell, thereby eliminating the need to use carbon electrodes.
Design and Manufacturing of a (PEM) Proton Exchange Membrane Fuel Cell 30
As regards uncoated stainless steel, it was pointed out by the same authors that
many types of alloys have been developed for applications where common stainless
steels such as SS304 or SS 316 did not provide adequate corrosion resistance.
In general, the compositions of these alloys are similar to their stainless steel or
nickel-base counterparts except that certain stabilizing elements, such as Ni, Cr, and Mo
are added or are present in much higher concentrations in order to obtain desirable
corrosion properties. However, in neutral to oxidizing media, a high Chromium (Cr)
content, which is often accompanied by the addition of Molybdenum (Mo), is
necessary.
In the same context, Wang and Turner [39] investigated various samples of
ferrite stainless steel in a simulated PEM fuel cell bipolar plate environment. The results
suggest that AISI446 could be considered as a candidate bipolar plate material in
polymer electrolyte membrane fuel cell anode and cathode environments, (AISI446)
steel underwent passivation and the passive films were very stable. An increase in the
interfacial contact resistance (ICR) between the steel and the carbon backing material
due to the passive film formation was noted, which agreed with results reported by
Tawfik et al. [38]. The passive film formed on the cathode side was found to be thicker
than that on the anode side, and both had a deteriorating effect on the interfacial
resistance between the plates and the gas diffusion material [40]. Further investigation
of the passive film on the AIS446 indicated that they were mainly chromium oxides and
the iron oxides played only a minor role.
Although the study showed that the performance of the AIS446 stainless steel
was superior to the other series AIS stainless steel investigated in this study under a
simulated chemical environment of the fuel cell, it should be noted that the simulated
environment takes into account only the chemical nature of the fuel cell environment,
which could vary due to the electrochemical reaction and fluid flow taking place in the
fuel cell.
Design and Manufacturing of a (PEM) Proton Exchange Membrane Fuel Cell 31
2.3.2. PEM Fuel Cell Operational Issues
Fuel cell systems are influenced by many issues and parameters that affect their
performance, amongst the most significant issues that influence the proper operation of
the fuel cell are the water management problem, gas distribution, temperature and
pressure variations, membrane conductivity and mass transport through the membrane
and gas diffusion layers.
Fuel cell performance can be adversely affected by the formation of water, the
dilution of reactant gases by water vapour, or by the dehydration of the solid polymer
membrane.
Fuel cell water management can be accomplished by a number of approaches
which include:
System design, such as utilizing the interdigitated flow-field design with
sequential exhausting of each cell in a PEM fuel cell stack, so as to ensure
that the gas will flow to each cell equally and provide the water management
necessary to achieve good performance [41].
Stack operating conditions, such as increasing the operating temperature and
reactants flow rate [42].
Stack hardware, such as; the use of interdigitated flow field design in
conjunction with direct liquid water injection to the anode [18].
Membrane electrode assembly design, such as; water transfer coefficient,
water permeability, specific conductivity and contamination by foreign
impurities [43].
Performance loss is mainly on the cathode and at high current densities,
typically greater than 0.8 Acm-2, where mass transport effects dominate. The low
concentration of oxygen in air, the reaction kinetics associated with oxygen reduction,
the formation of liquid water resulting in water flooding of active sites and restriction of
Design and Manufacturing of a (PEM) Proton Exchange Membrane Fuel Cell 32
oxygen transport to the active electrocatalyst layer, all result in substantial cathode loss
of voltage particularly at high current densities [44].
Voss et al. [45] reported a technique for water removal based on modifying the
water concentration profile (or gradient) of the solid polymer electrolyte membrane to
increase the back diffusion rate of water from the cathode to the anode, such that water
at the cathode electrocatalyst layer diffuses through the membrane and is removed via
the anode reactant gas stream. This was achieved by using a fuel flow rate which
resulted in an optimum pressure drop in the fuel flow channels and hence induced water
transport through the membrane from cathode to anode and into the fuel stream. The
pressure drop between the inlet and outlet of the anode flow field significantly increased
as the hydraulic radius of the flow channel decreased. This approach could be applicable
but will impose further complications and control effort on the fuel cell design.
Mennola et al. [46] performed experiments on a free breathing PEM fuel cell to
study the water balance in the fuel cell, focusing on the effect of anode conditions. The
methods used were current distribution measurements, water collection from the anode
outlet, and the measurement of cell polarization and resistance. The fraction of product
water exiting through the anode outlet was found to increase with increasing
temperature and hydrogen flow rate, which is expected due to the increased water
carrying capacity of the gas with temperature as well as the increased amount of water
available in a greater rate of flow. When the general direction of hydrogen flow was
against the direction of air flow, the percentage of water removal through the anode was
smaller and the current distributions were more even than in the cases where the
direction was the same as that of the air flow. This point is worth taking into
consideration when designing a fuel cell, whether air-fed or free air-breathing.
Santarelli and Torchio [47] performed experimental studies on a single cell PEM
fuel cell to observe the effects of varying the temperatures of the fuel cell, anode and
cathode flow temperatures in saturation and dry conditions; and reactants pressure on
the behaviour of a commercial single fuel cell. As expected, it was observed that a
higher cell temperature increased the membrane conductivity and exchange current
density with an improvement of cell behaviour. Of course the conductivity of the
Design and Manufacturing of a (PEM) Proton Exchange Membrane Fuel Cell 33
membrane and the exchange current density are geometric variables which cannot be
changed in operation, but the effect of temperature on these variables can be examined.
The protonic resistance in the fuel cell is inversely proportional to the ionic
conductivity of the membrane; the latter is a function of cell temperature, current
density, reactants temperature and humidification. The degree of humidification of the
membrane is linked to: the water produced by the reaction taking place at the cathode,
the inlet water content of the reactant gases and the mass transport phenomena
occurring in the membrane. Therefore, an improvement in the ionic conductivity is
expected at higher temperatures.
Moreover, a decrease in the activation overpotential can be observed at higher
temperatures. This could be due to the positive effect of the temperature increase on the
exchange current density at the electrodes, which, as a consequence, decreases the
activation overpotential and improves fuel cell performance.
The anode and cathode exchange currents are functions of several variables such
as: materials and porosity of the electrodes; concentration, distribution and dimensions
of the catalyst particles; and operating temperature. Among these variables, the
temperature is the only one that can be modified during cell operation. However, it is
concluded from this work that a balance between the temperature of the fuel cell and the
temperature and humidity of the inlet gases is very important. it is also shown that it is
difficult to evacuate the water product of the fuel cell with the exhaust cathode flow for
a fuel cell operating at 323K (50oC) fed with a fully humidified reactant flow at 353K
(80oC); because water production at the cathode at high currents is high and the effect is
that the diffusion layer could become flooded on the cathode side [47].
Regarding the effects of pressure on the performance of the single PEM fuel cell
under consideration, the authors noted that the increase of operating pressure did not
offer a significant improvement when the reactants were dry, while leading to
significant improvements when both anode and cathode reactants were humidified. It
was observed that there were good improvements up to 2.5 bar and slight improvements
between 2.5 and 3.1 bar, in particular with high current densities. This finding confirms
the theoretical study which will be presented in chapter 3 of this thesis.
Design and Manufacturing of a (PEM) Proton Exchange Membrane Fuel Cell 34
The decreased improvement at high current densities is again referred to the
accumulation of water product at the cathode, which increases at high pressures because
the cathode exhaust flow reduces its water absorption potential that hinders flooding.
They also observed another interesting effect of the operating pressure; which was a
better stability of cell voltage (that is, a lower standard deviation) at high current
densities when the pressure was increased. This observation was presented by the
authors without further explanation and it needs to be investigated at a larger scale fuel
cell stack for validation.
The authors also offered an impartial comparison between their work and that of
other authors, which showed that the performance of fuel cells reported by other authors
had better performance compared to the commercial cell analyzed in their work. This,
of course, is a respectable attitude, but it is observed that the information presented in
most publications on fuel cell performances do not sufficiently cover the interactions
between the different variables affecting the fuel cell behaviour, nor offer satisfactory
information on the design of the fuel cell.
It is also worth mentioning that most of the published work covers results on
single cells which are taken as representative for fuel cell stacks, while the behaviour of
a single cell is expected to be better than that of a stack because of the simplified flow,
water and thermal management problems.
Lin et al. [48] presented a method for the fabrication and testing of a miniature
PEM fuel cell using a novel manufacturing process for creating carbon bipolar plates by
treating a pre-patterned organic structure at high temperatures in an inert or reducing
environment. The fuel cell was tested under different operating temperatures and
pressures, and a voltage gain was observed with increased temperature; however, a
performance drop occurred at 353K (80°C), most likely due to dehydration of the
membrane. Another significant observation was that the pressure effect was not as
significant as the temperature effect.
From the polarization curve of the fuel cell stack and single cells presented by
the authors; figure (2-5), the three-cell stack showed a much steeper slope reaching the
concentration polarization region earlier than that of the single cells. This could be
Design and Manufacturing of a (PEM) Proton Exchange Membrane Fuel Cell 35
mainly due to water accumulation in the gas channels which prevented the gas from
reaching the membrane. Increasing the mass flow rate of air or oxygen in the fuel cell
can overcome this problem to a certain limit.
Figure 2-5 Polarization curve of the fuel cell stack and single cells as reported by Lin et al. [48]
This study indicated very clearly that the issues pertaining to the stack were very
much different from those pertaining to a single cell. In the case of the stack, special
consideration has to be paid to more complex challenges such as gas distribution
problems, humidification, water management, sealing and thermal management
problems.
Tori et al. [49] presented their results on designing and testing a 3-cell fuel cell
based on 112 Nafion® membranes and 0.4 mg/cm2 platinum loading on both sides,
which is relatively a high loading of catalyst. They used serpentine channels on graphite
plates, the dimensions of the channels and the type and specifications of the graphite
plates were not disclosed, the active area of the cell was 9 cm2. The authors used a
home-made data acquisition system for testing, but the calibration of various
instruments used was not given.
Design and Manufacturing of a (PEM) Proton Exchange Membrane Fuel Cell 36
The heat generated by the fuel cell was not enough to raise its temperature to the
desired limit; which was 335K (62°C), because of the small size of the fuel cell
compared to the bulky end plates, and because of the short running time which would
not allow the fuel cell to reach the operating temperature, consequently, the authors
used heaters and thermocouples to maintain and control fuel cell temperature.
The authors presented characteristic curves for a single cell, 2 cells, 3 cells and 4
cells stacks; and observed that the overall potential depended on current drain from the
fuel cell stack with 2, 3 and 4 cells in series respectively. At current values larger than
1A, the current – voltage characteristics of the multi-cell stack also showed that the
voltage varied with current in a linear manner over most of the operating range, which
indicates that Ohmic losses in the MEAs play a major role in the intermediate to high
current range.
The overall Ohmic resistance, which mainly includes Ohmic resistance within
the electrodes, at the electrode/membrane interfaces and in the membrane, as derived
from the slopes of the plots obtained for the characteristic curves increased from 0.13 Ω
for the 2-cell stack up to 0.20 Ω for the 4-cell stack which was not a linear increase,
indicating that stacking of the fuel cells reduced the overall Ohmic losses. This
interesting conclusion could be better represented by plotting the average voltage per
cell in a stack against the current, as shown in figure (2-6) below.
It was noted that as the number of cells in a stack increased, the losses decreased
and the characteristic curve became less sloping, which improved the overall
performance of the fuel cell stack and lead to a more stable voltage. This could be
attributed to the decrease of Ohmic losses due to the relative reduction of the number of
components through which the current had to flow, although these results contradict
with the results reported by Lin et al. [48] who reported a decrease in performance due
to stacking which was attributed to gas distribution problems, humidification, water
management, sealing and thermal management problems.
The authors, Tori et al. [49], presented only three test points in their experiments
which do not give a full idea about the behaviour of the fuel cell and indicated only a
trend line of the Ohmic area of the polarization curve. It would have been much better
Design and Manufacturing of a (PEM) Proton Exchange Membrane Fuel Cell 37
to define five points in each experiment to make sure the results reflected the actual
behaviour of the fuel cell and to reduce errors in the experiments.
Figure 2-6 Characteristic curves for three fuel cell stacks[49]
2.3.3. Modelling and Simulation
In order to understand the processes occurring within a PEM fuel cell and to
optimise its performance, models that predict PEM fuel cell performance based on input
parameters are required. Such models are advantageous because experimentation is
costly and time consuming. Furthermore, experimentation is limited to designs which
already exist, thus does not facilitate innovative designs [50].
Several models are available in the published literature, and can be classified as
either empirical (or semi-empirical) or mathematical (known as “mechanistic models”).
Empirical models calculate the cell voltage by using curve fitting schemes based on
experimental data, but these models are limited in that they are specific to a particular
fuel cell and operating conditions and many parameters that affect the performance of
PEM fuel cells; such as catalyst layer structure are not included in the model; hence
Design and Manufacturing of a (PEM) Proton Exchange Membrane Fuel Cell 38
parametric studies cannot be performed using these models. Therefore, mathematical
models have been developed which apply fundamental laws to describe the processes
occurring within the PEM fuel cell with mathematical equations, these equations are
solved to find either cell voltage or power density. The main limitations of this type of
models are that model development takes time and validation of the fuel cell stack
details can be difficult to achieve [51].
• Empirical and Semi Empirical Models
Publications on modelling and simulations of the fuel cell performance cover a
great deal of the published literature. The work of Amphlett et al. [52] stands out as one
of the most important and pioneering works in this field. They presented the activation
losses taking place in the fuel cell in parametric form, deduced from the Tafel equation
and empirical data as follows:
21 2 3 4[ln( )] [ln( )]act OT T c T iη ξ ξ ξ ξ∗= + + + 2-1
Where ‘i’ is the fuel cell operating current density (Acm-2), the ‘ξ ’ terms are
constant parametric coefficients and ‘2Oc∗ ’ is the effective concentration of oxygen at the
cathode catalyst sites and was defined as follows, where ‘2O
P∗ ’ is the partial pressure of
oxygen [52, 53]:
2
2 6 ( 498/ )5.08 10O
O T
Pc
e
∗
∗−=
× × 2-2
The expression for the activation overpotential presented in their work was
based on data that is specifically obtained from Nafion® PEM fuel cells and cannot be
implemented to fuel cells using other types of membranes. It is worth noting that the
expression is semi-empirical, which means that some functions serve as curve fitting
tools, but the authors present reasonable physical justification for the terms involved.
In their following work, [53] the same group developed a generalised steady-
state electrochemical model for a PEM fuel cell (GSSEM) which was largely
mechanistic, with most terms being derived from theory or including coefficients that
have a theoretical basis. This type of modelling differs from the empirical or non-
Design and Manufacturing of a (PEM) Proton Exchange Membrane Fuel Cell 39
mechanistic models which are based on empirical data. The model adopted the
following expression for the voltage of a single cell:
, ,cell Nernst act a act c ohmicV E η η η= + + + 2-3
where: ‘ NernstE ’is the thermodynamic potential, ‘ ,act aη ’ is the anode activation
overvoltage, a measure of the voltage loss associated with the anode, ‘ ,act cη ’ is the
cathode activation overvoltage, a measure of the voltage loss associated with the
cathode, and ‘ ohmicη ’ is the Ohmic overvoltage, a measure of the resistive losses
associated with the proton conductivity of the solid polymer electrolyte and electronic
internal resistances.
All quantities in the equation are in units of volts, the three overvoltage terms
are all negative in the above expression and represent reductions from ‘ NernstE ’ to give
the useful cell voltage, ‘ cellV ’. The model assumed an isothermal stack, and that the
excess water was totally removed due to gas flow rate and the design of the fuel cell. It
was also assumed that liquid phase concentration of hydrogen at the anode/gas interface
(mol/cm3) and water concentration at the cathode membrane/gas interface (mol/cm3)
were constant.
The aim of the work under consideration was to modify and generalise the terms
in their previous model, which were specific to the Ballard® Mark IV fuel cells, to
introduce cell dimensions and characteristics such as temperature, pressure and reactant
concentration as input parameters and to extend the useful range of the model to higher
current densities above about 0.5 A/cm2.
Fuel cell characteristic curves obtained using the two models are plotted in
figure (2-7) below for comparison. It is noted that the pressure effects in the (GSSEM)
are more significant compared to the previous model. This however indicates that there
is not a satisfying model that represents the behaviour of a range of fuel cells, and each
fuel cell design has to be characterised experimentally to verify its behaviour.
Design and Manufacturing of a (PEM) Proton Exchange Membrane Fuel Cell 40
0200
400600
8001000
0
1
2
3
0.7
0.8
0.9
1
1.1
1.2
1.3
Current Density [mA/cm2]Pressure [bar]
Vol
tage
[ V
]
0.65
0.7
0.75
0.8
0.85
0.9
0.95
1
1.05
1.1
1.15
GSSEM model (2000)
Amphlett et. al.(1995)
Figure 2-7 Effects of pressure and gas concentration on the performance of the PEM fuel cell,
based on the work of Amphlett et al.
However, as the (GSSEM) model was largely built on mechanistic bases; giving
it flexibility in application to a wide range of operating conditions, it should suffice in
modelling all cells using Nafion® membranes to current densities below 1 A/cm2.
Conversely, the model could not accurately predict the effect of temperature for a fuel
cell using Nafion® 117 membrane. Nevertheless, the authors stated the simplifications
and weaknesses of their model which is useful for understanding the model and its
applicability to different fuel cell configurations. Bearing in mind the complexity of the
processes that must be modelled to accurately predict fuel cell performance, the
approach and model presented by the authors is admirable.
Al-Baghdadi and Al-Janabi [54] presented a simplified mathematical model for
investigating the performance optimization of a PEM fuel cell containing some semi-
empirical equations based on the chemical-physical knowledge of the phenomena
occurring inside the cell. The model was compared to the experimental data given by
Design and Manufacturing of a (PEM) Proton Exchange Membrane Fuel Cell 41
another researcher and presented a good fit to the experimental data for the operation of
the fuel cell at various operating temperatures. The authors discussed the possible
mechanisms of the parameter effects and their interrelationships.
The authors related losses in output voltage at high current densities to the use of
part of the available reaction energy to drive the mass transfer due to diffusion
limitations which is a reasonable physical interpretation of the concentration losses.
The effects of pressure on the fuel cell performance were studied on the basis of
their model, however, no experimental data was presented to validate those results, and
the effects of humidity were not presented at all.
An interesting argument on the efficiency of the fuel cell was presented in this
paper to illustrate that the efficiency of a fuel cell may be “bought” by adding more
cells, driven by economic factors, such as the cost of individual cells, cost of hydrogen
and the resulting cost of generated power. However, this argument was based on the
characteristic curve of a single cell and should not be applied to a stack of multiple fuel
cells, without further consideration of the characteristics of the stack which are expected
to be different from those of a single cell.
In another publication by Al-Baghdadi [55]; a semi-empirical equation of the
performance of the fuel cell was presented. The model took into account not only the
current density; but also the process variations, such as gas pressure, temperature,
humidity, and fuel utilization to cover the operating processes. The modelling results
compared well with known experimental results, however, the paper did not focus much
on the relative humidity of the reactants and did not indicate the assumptions upon
which the model was based. Nevertheless, physical interpretations of the various causes
of losses in the fuel cell were presented. The empirical equation for the fuel cell
potential presented in the paper referred to the condition where the product water of the
fuel cell was in vapour form and, though not clearly indicated in the paper, ideal gas
behaviour for all the reactants and products was assumed. The paper is helpful in
understanding the behaviour of the fuel cell but does not add much to the work of
previous researchers.
Design and Manufacturing of a (PEM) Proton Exchange Membrane Fuel Cell 42
• Mechanistic Models
It is observed that mechanistic modelling has received most attention in the
published literature. In mechanistic modelling, differential and algebraic equations are
derived based on the physics and electrochemistry governing the phenomena internal to
the cell. These equations are solved using some sort of computational method [50].
Common issues with many computational models are the uncertainties
associated with values of various parameters that impact the transport processes in the
fuel cell. Rational models based on the fundamentals of chemical processes together
with experimental observations are used as essential tools to gain better understanding
of the operation of the fuel cell.
Initial efforts towards the development of numerical models were focused on
simply single phase 2D computational models with a lot of assumptions. But recent
developments in computational technology and improved transport models have made it
possible to simulate more accurate two phase computational models of the fuel cell
accounting for fluid, thermal and electrical transport. Models by Bernardi and Vebrunge
[56] and Springer and Gottesfeld [57] were based upon fundamental studies towards the
understanding of PEM fuel cell. They developed an isothermal one dimensional model
of a membrane electrode assembly, which considered mass continuity through the flow
channels, gas diffusion in the GDL, water transport through the membrane and proton
conduction in the membrane.
Design and Manufacturing of a (PEM) Proton Exchange Membrane Fuel Cell 43
Bernardi and Vebrunge [56] were able to couple a greater set of phenomena than
Springer and Gottesfeld [57]. They also implemented the Butler-Volmer equation to
model the electro-chemistry and Schlogl’s equation3 [58] for transport in the membrane.
The model presented by Springer and Gottesfeld [57] studied the net water flux
through the membrane and showed that the convective transport of water in the
membrane was limited to drag force on the water molecules due to proton flux.
Braden et al. [59] employed a novel method of reducing the computational effort
required to achieve a pseudo three dimensional solution by implementing a hybrid
numerical model. They resolved a two dimensional cross section of the fuel cell
perpendicular to the flow channel using finite difference method. In their model; the
membrane and the anode were not considered and the catalyst layer was modelled as a
boundary condition with flux determined from a first order reaction expression.
Although the model is very useful for setting up a two dimensional model of the fuel
cell and for reducing the computational effort required, it does not cover all the
phenomena taking place in the fuel cell.
Gurau et al. [60] developed the first real two dimensional model of a fuel cell
with flow channels and membrane, in which they studied the effect of composition
changes of the reactants within the fuel cell on fuel cell performance. They realised that
the governing differential equations in the gas flow channels and the gas diffusion
3 Schlogl’s model of the second order (or continuous) phase transition between the active phase
and the absorbing phase is frequently used to model phase transition-like phenomena in chemical
reactions, which are similar to the ferromagnetic phase transition observed in materials such as iron,
where global magnetization increases continuously from zero as the temperature is lowered below the
critical (Curie) temperature.
Design and Manufacturing of a (PEM) Proton Exchange Membrane Fuel Cell 44
electrodes were similar, and hence combined both regions into one domain.
Consequently, no internal boundary conditions or continuity equations needed be
defined. The only difference was that material properties and source terms assumed
different values for the two regions. This formed the basis of the single-domain
approach.
Instead of combining two regions into one domain, the single-domain approach
combines all the regions of interest into one domain. Conservation equations are defined
which govern the entire domain of interest, typically the entire fuel cell (gas flow
regions and membrane electrode assembly). In each region, the differences are
accounted for by source and sink terms. All equations are written in the form of generic
convection-diffusion equations, and all terms, which do not fit that format, are dumped
into the source or sink terms. This formulation allows for solution using known
computational fluid dynamics (CFD) methods [50].
Coppo et al. [61] developed a three dimensional computational model to
describe liquid water removal from the GDL surface by advection due to the interaction
of water droplets and gas stream in the gas flow channel. The model was validated for a
wide range of temperatures to study the effect of temperature dependant parameter
variation on cell performance and concluded that both liquid water transport within the
GDL and liquid water removal from the surface of the GDL played a critical role in
determining variations in cell performance with temperature. They used a simple
mechanical model to evaluate the interaction between gas stream and liquid water
droplets at the GDL/Gas Channel interface, where the flow surrounding the droplet is
assumed laminar and water droplets move along the GDL surface as a result of forces
acting on the droplets due to the viscous drag and surface tension. These forces can be
expressed in terms of droplet diameter, drag coefficient, gas-liquid velocity, surface
tension and contact angle. The model is useful for optimising the fuel cell design to
assist the removal of water droplets from the flow field, but should give more
consideration to the capillary action in the GDL which tends to restrain water droplets
within the GDL.
Design and Manufacturing of a (PEM) Proton Exchange Membrane Fuel Cell 45
Jung et al. [62] put forward a steady state, isothermal, two phase computational
model, in which key transport and electrochemical reactions inside the PEM and
catalyst layer were investigated. The results from this model showed that membrane
thickness was one of the crucial parameters for water transport between anode and
cathode, which severely affected the cell performance. For thin membranes such as
Nafion® 111 or Gore® membranes, water exchange between anode and cathode via
diffusion was so effective that both sides achieved equilibrium sufficiently downstream,
however, thick membranes such as Nafion® 112 made the water concentration on both
sides of the membrane diverge further. Detailed analysis showed that both anode and
cathode will be flooded by liquid water condensed from the gas for thin membranes,
while for thick membranes only the cathode was susceptible to flooding [63].
Most of these numerical models of PEMFC do not include the description of two
phase flow that actually takes place in the gas distribution channels. A comprehensive
flow transport electrochemical coupled model is still necessary to faithfully capture the
water transport characteristics of PEMFC. Wang and his co-workers [63] developed a
unified water transport model applicable throughout the PEMFC including the
membrane region. The model recognises that there are different phases of water existing
in various regions of the fuel cell. As a result; phase equilibrium is considered and
various modes of water transport, diffusion, convection and electro-osmotic drag are
incorporated in the unified water transport equation. Nevertheless, it is difficult for one
model to cover all the physical phenomena taking place in the fuel cell, and most of the
models reviewed in this study are good enough to give a clear idea about the
interactions of all the physical parameters in the fuel cell.
Design and Manufacturing of a (PEM) Proton Exchange Membrane Fuel Cell 46
2.4. SUMMARY OF MAIN OBSERVATIONS FROM PREVIOUS WORK
In the published literature on fuel cells, the input of researchers of various
disciplines can be found; where they try to find ways to advance fuel cell technologies
and make them compete with other power conversion devices. Throughout this
literature review, the following observations can be summarised:
The perfluorinated polytetrafluorethylene sulfonic acid (PFSA) polymer
membranes have been the best choice for (PEM) fuel cells due to their
significant stability in oxidative and reduction media owing to the structure of
the polytetrafluorethylene backbone and their fairly high protonic conductivity,
but they tend to lose their conductivity when used in the fuel cell at elevated
temperatures higher than 353K (>80°C) due to dehydration and loss of
mechanical stability. A breakthrough is needed in fuel cell technology to find
new materials which can serve as protonic conductors in the fuel cell at
temperatures higher than 373K (100°C).
The catalyst material is one important component of the (PEM) fuel cell which
affects its performance and cost. More research is needed in this area to reduce
the cost of catalyst per kW either by the economic use of Platinum (through
nano technology for instance) or by finding other materials that can replace
Platinum.
Research interests in fuel cell technology need to shift to more practical issues
such as cold start, transient performance, the investigation of new materials for
high temperature operation, novel designs and production technologies and the
solution of major problems such as water management through design and
tolerance to Carbon Monoxide .
The terminology used to describe fuel cell components is ambiguous and
sometimes confusing. For example, the word electrode is used to describe many
components of the fuel cell that include the catalyst layer, the gas diffusion layer
(GDL) and the bipolar plates. The term used to describe voltage losses are lent
Design and Manufacturing of a (PEM) Proton Exchange Membrane Fuel Cell 47
from many disciplines, such as the words voltage losses, polarisation and
overvoltage, which are all used to describe the same phenomenon. A unified
terminology has to evolve so that fuel cell science can advance more rapidly.
Performance losses, heat generation and product water generation all occur at
the cathode side of the fuel cell which should receive most attention in design
and modelling work.
Most of the experimental work published on fuel cells presents results obtained
from a single fuel cell; the results are then applied to a fuel cell stack. Different
conclusions are reported by researchers about the effect of stacking on fuel cell
performance. Therefore, long term testing of fuel cell stacks needs to be
performed and reported before a solid conclusion on the best configuration of
fuel cells can be reached.
Several empirical and mathematical models of (PEM) fuel cell are reported in
the published literature. Empirical models calculate cell voltage by using curve
fitting techniques based on experimental data, which limits those models to a
particular fuel cell and operating conditions, and cannot include many
parameters that affect the performance of the fuel cell especially geometric
conditions. On the other hand, there are many mathematical models which take
into consideration various phenomena occurring in the fuel cell and many
geometric conditions, but these models are based on many simplifying
assumptions which are usually not certain and in most cases they overlook
certain components or characteristics of the fuel cell. Although these models are
mathematically very elegant, the accuracy of these models needs to be validated
against some sort of experimental testing of actual fuel cells.
Design and Manufacturing of a (PEM) Proton Exchange Membrane Fuel Cell 48
Chapter 3 THEORETICAL BACKGROUND AND DEVELOPMENT
3.1. INTRODUCTION
In the first chapter of this thesis, the aims of this programme of research were
stated and, in chapter two, a review of recently published literature, particularly
pertaining to the design issues of the fuel cell has been presented. It became clear from
the literature study that fuel cell research was multidisciplinary and required a good
understanding of many topics, therefore, to help the reader understand fuel cell research
literature, it would be necessary to have a good grounding of the basics of a range of
subjects including electrochemistry, and thermodynamics.
The fuel cell, as a system, comprises a large number of variables which, for the
sake of analysis, maybe grouped into three groups [64]: design, operating conditions
and performance variables. The design specifications define the design variables; while
the operating variables define the prevailing ambient conditions; finally, the geometrical
quantities are grouped together as the design variables that would satisfy the specified
performance requirements. These three groups are shown in table (3.1) below:
Design and Manufacturing of a (PEM) Proton Exchange Membrane Fuel Cell 49
It should be noted that several combinations of operating conditions and design
variables can meet the design requirements, but in order to select a correct combination
of variables it is necessary to perform some form of optimisation.
For the purpose of analysis; it is necessary to develop equations relating the
three groups of variables. The graphical representations of the solutions of those
equations would help in finding the optimum combination of the design variables for
changing operating conditions. They can also be used to formulate a more complex
numerical model of the system which can be resolved using computational methods to
simulate the fuel cell performance and find avenues for optimisation. The said equations
are derived in the following sections.
3.2. THE WORKING PRINCIPLES OF THE (PEM) FUEL CELL
The principle of operation of fuel cells simply depends on the oxidation of
hydrogen to produce water. In this process, hydrogen, which is the simplest atom
composed of one proton and one electron only, and does not include any neutrons, is
split, with the help of a catalyst material, into its elementary constituents; the positive
proton ion and the negatively charged electron.
If this reaction is carried out through the direct mixing of hydrogen and oxygen
in the presence of a catalyst or ignition, the products will be water and heat only
because the process is exothermic; i.e. heat is produced rather than absorbed, by the
reaction. However, in the fuel cell this reaction needs to be controlled so that the two
flows of electrons and protons are separated to create a stream of electrons through an
external circuit; that will produce a current of electrical energy as required by the load.
To achieve this, hydrogen and oxygen are not allowed to mix directly in the fuel
cell. Instead, they are confined in two separate compartments, separated by a proton
conducting electrolyte membrane. This electrolyte membrane is not permeable, but it
allows protons to go through it through a transfer process similar to electrical
conductivity, and this is why it is called the proton exchange membrane (or solid
polymer electrolyte because it is a solid material).
Design and Manufacturing of a (PEM) Proton Exchange Membrane Fuel Cell 50
Figure (3-1) above is a schematic representation of a Proton exchange
membrane fuel cell (PEMFC) which represents this basic principle, briefly described as
follows:
Hydrogen is fed to the anode side of the fuel cell, this is the case in the Proton
Exchange Membrane Fuel Cells (PEMFC) where it is oxidized (loses electrons) by the
aid of a catalyst, mainly Platinum (Pt); one of the expensive materials used in the
construction of fuel cells. The advances in technology are in the area of applying the
thinnest layer of platinum in order to reduce the cost per unit area of the membrane.
Oxygen, taken from air or from an oxygen source such as a pressurised oxygen
or air cylinder, is fed to the other side of the fuel cell, which is the cathode, where it is
reduced (gains electrons); which are available from the external circuit. The electrolyte,
which is the membrane, constitutes a physical barrier between the two reactants,
(Oxygen and Hydrogen), that are fed to the fuel cell. Protons can pass through the
electrolyte due to the fact that it is a protonic conductor, but an electronic insulator,
Figure 3-1 Schematic representation of a Proton exchange membrane fuel
cell (PEMFC), not to scale
Design and Manufacturing of a (PEM) Proton Exchange Membrane Fuel Cell 51
while the electrons will be compelled to travel through an external circuit to supply the
load. This way; electrical energy is generated which can drive the load, at the same time
the result of combining hydrogen and oxygen produces water.
The reaction also produces some amount of heat; because it is an exothermic
reaction (releases heat), but this heat is much less than the heat produced in a direct
combustion of oxygen and hydrogen; because some of the energy of the reaction has
been released as electrical energy.
The fuel cell described above produces a voltage less than one volt under
practical conditions, and a current which depends on the active area of the membrane;
because the current depends on the amount of the protons and electrons transferred
during the reaction and the number of protons depends on the active area of the
membrane.
So as to achieve practical values of voltage, a certain number of fuel cells are
connected together in series; connection can be achieved internally, as is the case with
bipolar plates which provide internal connection of the cells, or externally. A group of
cells connected together is usually called a fuel cell stack. Stacks can also be connected
together in parallel to achieve higher values of current.
We have two options for increasing the current; either connect the fuel cells in
parallel, or increase the active area of a single cell. However, current and voltage can be
conditioned to the desired output values using power conditioning devices, which are
electronic equipment that can manipulate the output voltage and current values.
3.3. DESIGN SPECIFICATIONS
In order to carry out the task of designing a fuel cell, the chemical and
mathematical backgrounds of this research have to be understood. In this chapter; the
theoretical foundation for the design is established on the basis of the required
specifications.
This research aims at reducing the cost of manufacturing PEM fuel cells through
simplifying the design and reducing machining and assembling costs. As a
Design and Manufacturing of a (PEM) Proton Exchange Membrane Fuel Cell 52
demonstration of the design approach, the design specifications of a 100W fuel cell
module as the basic unit for a 5 kW fuel cell for stationary applications are put forward.
Where ‘P’ is the electrical power, ‘V’ is the voltage of the system and ‘I’ is the
current drawn by the electrical load, the electrical power output is given by Ohm’s law
as follows:
P I V= × 3-1
For the fuel cell, we have to decide the values of the voltage, current, number of
cells and area of the single fuel cell that would give us the required output.
The current in a single fuel cell is given by:
I iA= 3-2
Where ‘i’ is the current density in Amperes per squared centimetre; (A/cm2) and
‘A’ is the active area of the fuel cell in (cm2).
For a stack of ‘n’ number of cells, the voltage of the fuel cell stack, where the
cells are connected in series, is given by:
cellV nV= 3-3
Where ‘ cellV ’ is the single cell voltage which will be discussed later on in this
chapter.
Combining the equations for voltage and current, the total power output of the
fuel cell can be written as:
cellP iA nV= × 3-4
Under specific operating conditions, the cell voltage is a function of current
density, and the operating point on the characteristic curve has to be determined in the
light of the application for which the fuel cell is designed, as this will reflect on the
power density and efficiency of the fuel cell.
The number of cells and the active area of the fuel cell are also important
parameters that decide the power of the fuel cell and reflect on the power density.
Design and Manufacturing of a (PEM) Proton Exchange Membrane Fuel Cell 53
3.3.1. Fuel Cell Current
The current in the fuel cell depends mainly on two factors:
1. The number of electrons produced.
2. The number of protons transferred.
The first one depends on the efficiency of the catalyst, while the second one
depends on the protonic conductivity and the number of functional groups in the
membrane. The proton exchange capacity (usually known as the Ion Exchange
Capacity, IEC) or acidity of a polymer is measured by its Equivalent Weight; (EW),
which is the mass of polymer per active sulfonic acid group as measured by titration4.
For a given ion exchange polymer; a lower EW results in higher conductivity of the
polymer, and it is; therefore, important to be able to control the exact stoichiometry of
the polymer produced. For instance; Nafion® membranes, which are state-of-the-art
membranes for PEM fuel cells, are available with EWs ranging between approximately
900 and 1100 (g/mmol) and thicknesses between 1 and 7 mil (1 mil = 10-3 inch or 25.4
µm). These materials are particularly suitable for fuel cell applications, and they have
been shown to have a lifetime of more than 60,000 hours when operating in a fuel cell
stack at 80oC and with appropriate humidification. Nafion® 117 (the first two digits
denote a hundredth of the equivalent weight; here EW=1100 (g/mmol), and the last digit
denotes the thickness in mils; here 7 mil = 178 µm thickness) exhibits high ionic
conductivity at approximately 0.17 Scm-1 [11].
4 Titration is a technique where a solution of known concentration is used to determine the concentration of an
unknown solution. Typically, the titrant (the know solution) is added from a burette to a known quantity of the
analyte (the unknown solution) until the reaction is complete. Knowing the volume of titrant added allows the
determination of the concentration of the unknown. Often, an indicator is used to usually signal the end of the
reaction, the endpoint.
Design and Manufacturing of a (PEM) Proton Exchange Membrane Fuel Cell 54
The number of electrons and protons available in the fuel cell depend on the
amount of fuel supplied, namely hydrogen in the case of PEM fuel cell. The relationship
between current, which is the amount of flow of charge, and flow rate can be written
using the basic definition of current as follows:
edn
I Fdt
−= 3-5
Where ‘I’ is current (Amperes), ‘F’ is Faraday’s constant = 96473
(Coulomb/mole), ‘ne-’ is the amount of electron transfer (kmol) and ‘t’ is time in
(seconds).
The fuel consumption is related to the current drawn from the circuit during
operation through the following equation:
edndm 1 1 I= M = M
dt n dt n F−
⋅ ⋅ 3-6
Where ‘M’ is molar mass of fuel (kg/kmol) and ‘n’ is the number of electrons
transferred per molecule in the reaction.
Rearranging this equation yields an expression for current in terms of fuel usage
as follows, using ‘m’ for the mass of fuel (kg):
nF dmIM dt
= ⋅ 3-7
This equation can be used to calculate the flow rate of fuel and oxidant in the
fuel cell.
3.3.2. Fuel Cell Voltage
On each side of the fuel cell there is a potential difference between the electrode
and the electrolyte due to the electrochemical reaction taking place, the voltage of the
fuel cell is the resultant of these two potential differences. However, this voltage goes
through many losses and influences that determine the final voltage of the fuel cell.
Design and Manufacturing of a (PEM) Proton Exchange Membrane Fuel Cell 55
• Open Circuit Voltage
Considering the half cell reaction in which two hydrogen atoms are split into
two electrons and two protons, the total energy change, at equilibrium, for taking an
infinitesimal amount (that would not disturb the system) of 2H to 2 2H e+ −+ must be
zero [65]. Also when an infinitesimal amount of 2H at a fixed pressure is converted to a
fixed concentration of H + , a precise change in chemical free energy occurs, GΔ , which
is the change in the free energy of the reaction known as Gibb’s free energy and its
units are (J/g. mole 2H ).
The total free energy consists of two parts: the chemical free energy and the
effect of potential on the components. When a potential difference exists between the
electrode and the electrolyte, the reaction produces an electron on the electrode at one
potential and a positive ion, H + in the electrolyte at another potential.
Separation of charge at two potentials requires energy; this energy is oFE for 1
equivalent of electrons, where ‘ oE ’is the potential difference. Putting energy on a per g-
mole 2H basis, the total free energy change at equilibrium is:
0og nFEΔ + = 3-8
And more generally:
og nFEΔ = − 3-9
Where ‘ gΔ ’ is Gibbs free energy change for the reaction defined on a per mole
basis of one of the reactants, ‘n’ is the number of electrons participating in the reaction
of interest per molecule and ‘F’ is Faraday’s Constant.
For a change at constant ‘T’ and ‘P’, Gibbs free energy change is defined as:
,T Pg h T sΔ = Δ − Δ 3-10
Where ‘ hΔ ’ is the change in enthalpy; ‘ sΔ ’ is the change in entropy and ‘T’ is
the temperature in Kelvin.
Design and Manufacturing of a (PEM) Proton Exchange Membrane Fuel Cell 56
It is important to emphasize that several forms of the Gibbs free energy for a
given species exist, however, the most commonly used form is the Gibbs free energy of
formation, ‘ fgΔ ’. As long as a consistent form of Gibbs free energy and the reference
state are used, the numerical value of ‘ gΔ ’ will be the same. The derivation of the
thermodynamic relationships is presented in Appendix A.
oE in equation (3-8) is often referred to as: The electrode potential at
equilibrium or Equilibrium potential (also called the Reversible Potential or Theoretical
Open Circuit Potential or Theoretical Open Circuit Voltage), where it is understood to
be a difference in potential between electrode and electrolyte [65]. This represents the
maximum electrical work obtained in the reaction. These relationships will be used later
on to derive the expressions for the efficiency of the fuel cell.
• The Nernstian Voltage
Fuel cell reactions involve the movement of electrons from the oxidised species
to the reduced species. It is a reduction-oxidation reaction (known as redox reactions)
where hydrogen is oxidised at the anode (loses electrons) and oxygen is reduced at the
cathode (gains electrons). Nernst derived an equation correlating the electrode potential
E of the electrode and activities of the species involved in the reaction. For a general
reaction of the form:
jJ kK mM+ → 3-11
Where ‘j’ moles of ‘J’ species react with ‘k’ moles of ‘K’ species, to produce
‘m’ moles of ‘M’ product. Nernst’s equation can be generalised as follows:
.lnj kJ K
o mM
a aRTE EnF a
⎛ ⎞= + ⎜ ⎟
⎝ ⎠ 3-12
Design and Manufacturing of a (PEM) Proton Exchange Membrane Fuel Cell 57
In this equation, ‘ Ja ’ and ‘ Ka ’ being the activities5 [65] of the reactants, and
‘ Ma ’ the activity of the product. In the special case when the reactants and products
exist in the standard states of unit activity at a given temperature, potential in this case is
equal to equilibrium potential, i.e. oE E= , and in this case the equilibrium potential is
referred to as standard equilibrium potential, denoted as ( ooE ) and related to standard
Gibbs free change for the reaction as follows [17, 66]:
o oog nFEΔ = − 3-13
ogΔ , the standard free energy change for the reaction, must be expressed in
J/mole for ooE 6 to be in volts.
Some authors prefer to write the Nernst equation (3-12) in the form:
10.2.3 log
j kJ K
o mM
a aRTE EnF a
⎛ ⎞= + ⎜ ⎟
⎝ ⎠ 3-14
Using ‘ 10log ’ instead of ‘ln’; which makes it easier to interpret the departure
from the standard electrode potential. As an example; if the number of electrons ‘n’ is 2,
the value of 2.3 0.03RTnF = Volt, therefore, the Nernst equation predicts about 30
5 Activities are defined by 0
A Aca cγ= where Ac is the concentration of A, 0c is the concentration used for the
standard state and Aγ is the activity coefficient of A at a constant concentration of Ac . 1Aγ = at standard state; it
is a variable which makes the equation above applicable even for non-ideal systems. Since Ac and 0c are in the
same units, a and Aγ are dimensionless. 0c maybe taken as 1 atmosphere when a gas is involved, as 1 g-mole /
litre when a solute is involved or as 1 g-mole / cm3 when a surface concentration is involved.
6 Upper note denotes standard conditions and lower note denotes the equilibrium state.
Design and Manufacturing of a (PEM) Proton Exchange Membrane Fuel Cell 58
millivolts departure from ‘ oE ’ for each tenfold change from unit activity of the
reactants or products [65].
The Nernst equation shows precisely how raising the activity of the reactants
increases the voltage. On the other hand, raising the activity of the products decreases
the voltage.
For simplicity, it is safe to assume that water is produced as steam at
atmospheric pressure in the fuel cell, i.e. water has unity activity, and hence the value of
the fuel cell voltage relies mainly on the partial pressures of the reactants.
The value of ‘ oE ’ can be calculated from free energy data, and it is found that in
any cell comprising an oxygen electrode and a hydrogen electrode, both operating
reversibly, with the gases at one atmospheric pressure; ‘ oE ’ will have a voltage of
1.229Volt. This voltage will be independent of the hydrogen ion concentration of the
medium, provided the activity of water remains at unity [66].
By applying equation (3.12) at the cathode side (oxygen side) at two oxygen
pressures and constant temperature T, it is easily shown that:
22 1
1
ln4
PRTE E EF P
⎛ ⎞Δ = − = ⎜ ⎟
⎝ ⎠ 3-15
Where ‘ E ’ is the potential difference between the electrode and electrolyte and
the subscripts 1 and 2 define the states of operation at pressures ‘ 1P ’ and ‘ 2P ’
respectively. It is clear that ‘ EΔ ’ remains small because it is proportional to the log of a
ratio of ‘ 2P ’and ‘ 1P ’.
For a fuel cell of a fixed geometry, to supply air instead of oxygen at the cathode
means to reduce the pressure by a factor of 5, because the partial pressure of oxygen in
air is (0.21), in this case, the fuel cell will have a theoretical potential only a few
millivolts lower than a pure oxygen electrode (pure oxygen supplied at the same
pressure), the same argument applies to the hydrogen electrode in the case of supplying
pure hydrogen or diluted hydrogen.
Design and Manufacturing of a (PEM) Proton Exchange Membrane Fuel Cell 59
The change in equilibrium voltage with pressure is plotted in figure (3-2) below.
It shows that the effect of pressure changes the equilibrium potential in the order of
millivolts. The effect of pressure is higher at pressures below 3 bar., but this effect
reduces at higher pressures. This means that, with a hydrogen-oxygen fuel cell where
the reactants are gases, the change of volume due to pressure changes will be large, and
the effect of pressure can be observed. This has to be balanced with the gains achieved
from pressurising and the design changes that have to be made.
1 1.5 2 2.5 3 3.5 4 4.5 50
0.002
0.004
0.006
0.008
0.01
0.012
0.014
Cha
nge
in P
oten
tial [
V ]
Change in pressure [ bar ]
Figure 3-2 Change in equilibrium voltage with pressure
The effects of temperature and pressure on cell voltage have been quoted by
many authors [17, 55]. The basic Nernst equation includes a term of temperature
indicating that cell potential is directly proportional to temperature, this is in
conformation with the kinetic theory of gases; which anticipates higher reaction rates at
higher temperatures due to the increased kinetic energy of the molecules; however the
following thermodynamic argument aims at studying the effect of raising the
temperature of the reaction.
Design and Manufacturing of a (PEM) Proton Exchange Membrane Fuel Cell 60
Assuming a chemical reaction where variations in temperature are not too high
and the electron transfer is slow so that the reaction is not disturbed. From the equation
of state and using the relationship for a polytropic process; for a change of pressure
from ‘ 1P ’ to ‘ 2P ’ and temperature changes from ‘ 1T ’ to ‘ 2T ’:
12 2
1 1
P TP T
ϑϑ−⎛ ⎞ ⎛ ⎞
=⎜ ⎟ ⎜ ⎟⎝ ⎠ ⎝ ⎠
3-16
Where ‘ϑ ’ is the polytropic index. Assuming ‘ oP ’ is a standard unity pressure,
and substituting the pressure values at state 1 and 2, the Nernst equation becomes:
1 11 lno o
RT PE EnF P
⎛ ⎞= + ⎜ ⎟⎝ ⎠
3-17
2 22 lno o
RT PE EnF P
⎛ ⎞= + ⎜ ⎟⎝ ⎠
3-18
2 1 22 1
1
( ) lnR T T PE E EnF P
⎛ ⎞−Δ = − = ⎜ ⎟
⎝ ⎠ 3-19
Substituting for the pressure ratio using the temperature ratio in a polytropic
process from equation (3-16); equation (3-19) above yields:
12 1 2
1
( ) lnR T T TEnF T
ϑϑ−⎛ ⎞−
Δ = ⎜ ⎟⎝ ⎠
3-20
This equation is used to plot the variation of ‘ EΔ ’ with temperature over the
range of operation of a (PEM) fuel cell using different values for the polytropic index
ranging from 1.5 to 1.6; Figure (3-3) below :
Design and Manufacturing of a (PEM) Proton Exchange Membrane Fuel Cell 61
300 310 320 330 340 350 360 370 3800
0.2
0.4
0.6
0.8
1
1.2
1.4
1.6
1.8
2x 10
-3
Change in Temperature [ K ]
Chan
ge in
Pot
entia
l [ V
]
ν = 1.5ν = 1.6ν = 1.7
Figure 3-3 Variation of EΔ with temperature using different values for the polytropic index
Where ‘γ’ is the ratio between the specific heat capacities ( p
v
ccγ = ), the poly
tropic index can take one of the following values:
1 The process is isothermal The process is isentropic The process is a real process Cannot be realistic as the system is losing heat and entropy is negative
υυ γυ γυ γ
==><
The graph shows that there is a slight gain in potential due to the increase in
temperature, but this gain decreases as the polytropic index increases. This is due to the
fact that as the polytropic index increases, the system departs further from reversibility.
Now, considering the case where water is in the form of vapour at atmospheric
pressure with unit activity, equation (3-12) reduces to the form:
Design and Manufacturing of a (PEM) Proton Exchange Membrane Fuel Cell 62
( ) 2 2
1/2* *lno H ORTE E P PnF
= + 3-21
Where P* represents the partial pressures of the reactant gases denoted by the
respective subscript.
As mentioned elsewhere, the standard state (298.15K, and 1 atm.) defines a
standard state reference potential ooE =1.229 V and the equilibrium potential; ‘ oE ’ will
vary from the standard state reference in accordance with temperature as follows [52]:
( )o
o oo o
SE E T TnF
⎛ ⎞Δ= + − ⎜ ⎟
⎝ ⎠ 3-22
Where ‘ oT ’ is the standard state temperature (298.15 K). The entropy change of
a given reaction is approximately constant (assuming that the variation in specific heat
with the expected change in temperature is negligible) and can be set to the standard
state value. Rearranging equation (3-22) above and using standard values for
temperature and standard state equilibrium potential, the reference potential varies
directly with temperature as follows:
1 2oE Tβ β= + 3-23
Where:
1 1.229o oT SnF
β Δ= − 3-24
And,
2
oSnF
β Δ= 3-25
Using literature values for the standard-state entropy change, the value of 2β in
this equation can be calculated to be 3(0.85 10 )−× V/K [52], with further expansion;
equation (3-21) can now be written as:
( ) ( ) ( )2 2
* *2
11.229 ln ln2o
H OE T T T P Pβ ϕ ⎧ ⎫⎨ ⎬⎩ ⎭
= − − + + 3-26
Design and Manufacturing of a (PEM) Proton Exchange Membrane Fuel Cell 63
Where 54.3085 10ϕ −= × [VK-1]. This general expression gives the
thermodynamic potential for a hydrogen/oxygen fuel cell on the basis of the Nernst
equation, which indicates the importance of this equation.
Evaluation of the two partial pressures for oxygen and hydrogen as per equation
(3-26) typically involves mass transfer calculations and requires averaging over the cell
surface or along the direction of gas flow to account for significant changes in the
partial pressures of the gaseous reactants due to reaction in the cell. Amphlett et al. [52]
assumed that the partial pressures of hydrogen and oxygen will decline exponentially
with respect to their residence time in the flow channels due to their consumption at the
electrodes. They assumed that the exponential decay will depend on the velocity of gas
flow in the flow channels.
On the cathode side, where the consumed oxygen represents a small fraction of
the total flow (the stoichiometric ratio of oxygen, which is the ratio of the actual
quantity of gas supplied to the actual quantity needed, is generally > 1.75 using
atmospheric air, which means that the excess flow is in the order of 733% due to the
presence of nitrogen), velocity will be approximately constant. The effective oxygen
partial pressure can then be approximated using a log-mean average of the inlet and
outlet oxygen partial pressures, where subscripts ‘avg’ and ‘hum’ stand for average and
humidified respectively:
2 2
22
2
, ,
,
,ln
hum humO out O inavg
O humO inhum
O out
P PP
PP
⎛ ⎞⎜ ⎟⎜ ⎟⎝ ⎠
−= 3-27
Along the anode flow channels, on the other hand, the decline in flow velocity
due to consumption and absorption of hydrogen is a much more significant fraction of
the total velocity, since the excess flow of fuel is typically quite small (Stoichiometric
Ratio is in the range of 1.15 to 1.3) hence, an arithmetic mean is justifiable as a good
first approximation of the effective hydrogen partial pressure which can be represented
by the following equation:
2 2
2
, ,
2
hum humH in H outavg
H
P PP
+= 3-28
Design and Manufacturing of a (PEM) Proton Exchange Membrane Fuel Cell 64
3.4. FUEL CELL VOLTAGE LOSSES
The performance of a fuel cell can usually be described by a Current Density vs.
Voltage curve, known as the polarization curve, where the voltage of the fuel cell is
related to the current density, or by a power density curve, where the power output is
related to the current density. Figure 3.4 is a schematic of a polarization curve.
0 100 200 300 400 500 600 700 800 900 10000
0.2
0.4
0.6
0.8
1
1.2
Current Density [mA/cm2]
Cel
l Vol
tage
[V]
Reversible Potential
Open Circuit Potential
Reg
ion
of
Act
ivat
ion
Loss
es
Region of Ohmic Losses
Region of Concentration Losses
Figure 3-4 Schematic of a polarization curve, axis values and region limits are arbitrary
The polarisation curve, figure (3-4) indicates that the open circuit voltage ( oE ) is
less than the theoretical value of the reversible potential, ooE , which indicates that there
is a loss in voltage even when no current is drawn from the fuel cell. This loss can be
attributed to fuel cross over and internal currents through the electrolyte. The
electrolyte should only transport ions, but a small amount of fuel, and even a lesser
amount of electrons, will be conducted through the electrolyte, which will have a
reducing effect on the open circuit voltage, as seen from the polarization curve [17].
As we move away from the zero current point, a rapid initial drop in voltage is
noted, this can be referred to activation losses which are caused by the slowness of the
Design and Manufacturing of a (PEM) Proton Exchange Membrane Fuel Cell 65
reaction taking place on the surface of the electrodes. A proportion of the voltage
generated is lost in driving the chemical reaction that transfers the electrons to and from
the electrode [17].
Moving to higher current densities, the voltage loss becomes more linear and
falls less slowly, this loss is due to Ohmic losses, sometimes called “resistive losses”, as
they stem from the straightforward resistance to the flow of electrons in the various fuel
cell components, as well as the resistance to the flow of ions in the electrolyte. This
voltage drop is approximately linear and proportional to current density.
The final region of the polarization curve occurs at higher current density,
where the voltage falls rapidly away due to mass transport limitations in the cell. These
are usually termed “Mass transport or concentration losses”, and they result from the
change in the concentration of the reactants at the surfaces of the electrodes, due to
obstruction that prevents the gases from reaching the reaction sites on the membrane
and most commonly due to the accumulation of product water blocking the flow
channels in the bipolar plates or the GDL. This type of loss is sometimes called
“Nernstian”, because of its connection with concentration effects which are modelled by
the Nernst equation [17]. So as to avoid the drastic decrease in power density in this
region, the optimal operating regime for a fuel cell is up to the maximum power density.
It should be pointed out that the terms used for losses are variable from one
discipline to another, they are called: losses, voltage drop or conversely; overvoltage,
which gives the impression that voltage increases rather than decreases, but it is the
term usually used in electrochemical literature. The terms losses and overvoltage will be
used mostly in our analysis.
In the following sections we attempt to consider each one of these losses
separately, and present, in mathematical and graphical forms, the effects of varying
certain operating conditions such as: temperature and pressure on the performance of
the fuel cell, as well as certain geometric dependant parameters such as the values of
exchange current density and charge transfer coefficient which are dependant on the
electrode material and catalyst loading of the fuel cell electrodes.
Design and Manufacturing of a (PEM) Proton Exchange Membrane Fuel Cell 66
The following assumptions are applied throughout this analysis:
i. The fuel cell operates under steady state conditions.
ii. The gases are assumed to be ideal compressible gases.
iii. Due to the low velocity of the gases, their flow is laminar.
iv. The product water is assumed to be in liquid form.
v. The electronic resistance of the fuel cell components and the external
circuit are constant over the range of operating temperatures.
vi. The pressures of the anode and cathode are assumed to be the same.
vii. The internal currents in the fuel cell are equal to fuel cross over.
3.4.1. Activation Overvoltage; actη
There is a close similarity between electrochemical and chemical reactions in
that both involve an activation barrier that must be overcome by the reacting species. In
doing so, part of the electrode potential is lost in driving the electron transfer rate to the
rate required by the current demand. The Butler-Volmer equation describes the reaction
kinetics when mass transfer effects are negligible as follows [65]:
/ (1 ) /[ ]actc actanF RT nF RToi i e eα η α η− − −= − 3-29
Where ‘R’ is the universal gas constant (8.314 kJ/kmol.K), ‘T’ is the temperature
of operation in Kelvin, ‘n’ is the number of electrons involved per mole of electrolysed
component, ‘α ’ is the charge transfer coefficient, which is the portion of the electrical
energy assisting the forward reaction, the remaining portion (1 α− ) hinders the reverse
process. The value of ‘α ’ depends on the reaction involved and the material the
Design and Manufacturing of a (PEM) Proton Exchange Membrane Fuel Cell 67
electrode is made from, but it must be in the range of (0< α <1), ‘F’ is Faradays
constant (96485 C/mole), ‘ actcη ’ and ‘ actaη ’ are the activation overvoltages on the
cathode and anode respectively, ‘i’ is the current density (A/cm2) and ‘io’ is the
exchange current density7, which is the rate of flow of electrons from and to the
electrolyte [65].
In equation (3-29) above, the first exponential represents the forward reaction
potential (the reduction reaction on the cathode), while the second exponential
represents the backward reaction potential (the oxidation reaction on the anode).
Writing the equation in the logarithmic form yields:
(1 )ln actc acta
o
nF nFii RT RT
α η α η⎛ ⎞ − −= +⎜ ⎟
⎝ ⎠ 3-30
When the activation overvoltage on the cathode is very much higher than the
activation overvoltage on the anode, the first part of the equation which represents the
forward oxidation reaction prevails and the second part can be ignored, and vice a versa
in the case of prevailing anodic overvoltages.
These two expressions can be written separately for anode and cathode in the
form known as Tafel’s laws. For a net cathodic overvoltage, the backward activation
overvoltage (anodic reaction) is negligible, and the equation becomes:
ln cactc
o
iRTnF i
ηα
⎛ ⎞= − ⎜ ⎟
⎝ ⎠ 3-31
7 The exchange current density is defined as the current flowing equally in each direction at the reversible
potential. Equilibrium in a chemical reaction is established when the forward and backward rates are equal. In
the case of electrochemical reactions, rates of the reaction define the current, which at equilibrium would be the
exchange current density.
Design and Manufacturing of a (PEM) Proton Exchange Membrane Fuel Cell 68
On the other hand, for a net anodic overvoltage, the anodic reaction becomes the
forward reaction and the cathodic reaction is neglected, equation (3-30) becomes:
ln(1 )
aacta
o
iRTnF i
ηα
⎛ ⎞= ⎜ ⎟− ⎝ ⎠
3-32
Subscripts ‘a’ and ‘c’ are used in equations (3-31) and (3-32) to denote the
anodic and cathodic current densities respectively. Both equations are in the form
known as Tafel’s Law which can be written in terms of current density as follows:
lnactc cx y iη = + 3-33
Where; for the cathode side:
ln oRTx inFα
= And RTynFα
= −
This equation can also be written in terms of both current density and exchange
current in the following form which is used by many researchers:
log cact
o
ibi
η⎛ ⎞
= ⎜ ⎟⎝ ⎠
3-34
Where ‘b’ in this equation is equal to ‘y’ as follows [20]:
RTbnFα
= − 3-35
Equation (3-35) is very important as it will be used again in the expression for
the concentration overvoltage
Tafel’s equation is applicable where the activities of the species involved in the
reaction are not very much affected by the current flow. The equation can also be used
to deduce the exchange current density which occurs at 0actη = . Rearranging equation
(3-31) to give ‘ ln ci ’ in terms of ‘ actη ’, considering the other terms constant gives:
ln lnactc c o
RT RTi i
nF nFη
α α= − + 3-36
Design and Manufacturing of a (PEM) Proton Exchange Membrane Fuel Cell 69
Rewriting the equation using the coefficient ‘b’:
0ln( ) ln( )
actcb i b iη = − 3-37
Substituting the proper values for the constant terms in equation (3-35), and
taking the value n = 4 for the cathode side, 0.5α = [17] and an operating temperature
‘T’ = 373 K, the value of coefficient ‘b’ is found to be = 0.0161. This equation is plotted
Figure 3-5 Variation of activation overvoltage as a function of exchange current density
From the graph it is seen that increasing the exchange current density leads to
reducing the activation losses.
For a low temperature, hydrogen fuel cell running on air at ambient pressure, the
cathode exchange current density is over 2000 times less than that on the anode, a
typical value for the exchange current density, oi ; would be about 0.1 2mAcm− at the
cathode and about 200 2mAcm− at the anode [17], which makes losses due to activation
much greater on the cathode side and hence requires more catalyst loading to improve
the kinetics of the reaction.
Design and Manufacturing of a (PEM) Proton Exchange Membrane Fuel Cell 70
It is also noted from the figure that the voltage drop increases exponentially as
the current density increases. In situations where the polarization curve is obtained
experimentally, it is possible to deduce the activation current density from this curve by
extrapolation; in this case activation overpotential is plotted against ln( )i .
It was reported by some researchers that the exchange current density; oi also
depends on the partial oxygen pressure. Parthasarathy et al. [67] conducted experiments
on a PEM fuel cell at a temperature of 50 °C. The results are summarized in Fig. (3-6).
Figure 3-6 Dependence of the exchange current density of oxygen reduction reaction
(ORR) on oxygen pressure [20].
A linear relationship was found between the logarithm of the exchange current
density oi and the logarithm of the oxygen partial pressure, according to:
2
* .exp( ) o Oi x yP= 3-38
Where ‘ 8 1.27 10x −= × ’ and ‘ 2.06y = ’. However, this relationship is only
applicable to the particular conditions of the experiment performed by Parthasarathy et
al. [67] and is not applicable to other fuel cells because, as mentioned earlier, the
Design and Manufacturing of a (PEM) Proton Exchange Membrane Fuel Cell 71
exchange potential, particularly at the cathode side, is a mixed potential due to
competing reactions. Furthermore, there are other geometric variables and operating
conditions that contribute to the value of the exchange current density, however, the
reported experiments indicate the oxygen partial pressure is also a factor in determining
the value of ‘ oi ’.
To understand the effects of the charge transfer coefficient on the activation
overvoltage; Tafel’s equation is plotted for different values of the charge transfer
coefficient (α) for a given value of exchange current density oi = 0.01 and an operating
temperature of T = 373K:
200 400 600 800 1000 1200 1400 1600 1800 2000-0.7
-0.6
-0.5
-0.4
-0.3
-0.2
-0.1
0
Current Density [mA/cm2]
Act
ivat
ion
Ove
rvol
tage
[ V
]
α = 0.3α = 0.6α = 0.9
Figure 3-7 Effect of varying the values of the charge transfer coefficient (α) on the activation
overvoltage, for exchange current density ( oi =0.01) and operating temperature T=373K
As the charge transfer coefficient decreases, figure (3-7) shows that the
activation overvoltage increases exponentially. This indicates the importance of the
charge transfer coefficient which depends on the type of the electrode material;
consequently, the type of electrode material is an important factor in improving the
power output of the fuel cell.
Design and Manufacturing of a (PEM) Proton Exchange Membrane Fuel Cell 72
The same equation is plotted for various temperatures of operation and various
current densities; the graph shows that at higher temperatures the activation losses
increase. However, this is counterbalanced by the increased activities of the reactants
due to higher temperatures, in accordance with the kinetic theory of gases.
0.20.4
0.60.8
1
280300
320340
360
1.1
1.12
1.14
1.16
Current Density [ A/cm2 ]Temperature [ T ]
Vol
tage
[ V
]
Figure 3-8 Changes of voltage due to activation overvoltage with respect to variations in
temperatures of operation and variations of current densities
In the case of the PEM fuel cell, with effective catalyst action, the hydrogen
electrode operates close to thermodynamic equilibrium conditions. The hydrogen
oxidation reaction proceeds readily so that the anodic activation overvoltage; ‘ actaη ’ is
negligible.
In contrast, the rate of oxygen reduction in aqueous media at the
thermodynamic equilibrium potential is about (10-5) times slower than that of hydrogen,
even with the best catalysts currently available [17]. Consequently, the voltage drop due
to activation can be mainly attributed to the cathodic reaction.
Design and Manufacturing of a (PEM) Proton Exchange Membrane Fuel Cell 73
Following from the previous discussion, the second exponential in equation (3-
30) which represents the anodic part of the total activation overvoltage, is safely ignored
in most of the published literature on PEM fuel cells; the equation is simplified to the
form of Tafel’s law.
However, this is not the case for other types of fuel cells, such as the Direct
Methanol Fuel Cell (DMFC), which is similar to the PEM fuel cell in using the same
type of membrane electrolyte with a different catalyst and basically the same
construction, but the activation overvoltages on the anode are considerable and have to
be accounted for in the equation.
3.4.2. Ohmic Overvoltage; Ohmicη
The Ohmic voltage drop in the fuel cell is due to the resistances of the various
components of the fuel cell to the flow of electrons, and the resistance of the membrane
to the flow of protons. This can be divided into two components:
i. Electronic resistance; which is the resistance to the flow of the electrons in the
various components of the fuel cell and the connected load. The resistance of all
pure materials increases as temperature increases, whereas the resistances of
carbon, electrolytes and electrically insulating materials decrease with
temperature increase. For a moderate range of temperatures, up to 373K
(100°C), the change of resistance is usually proportional to the change of
temperature, however, in this analysis, it will be assumed constant. The
electronic resistance of the fuel cell can be determined by simple measurement
of the resistance of the various components of the fuel cell excluding the
membrane at the required operating temperature.
ii. Protonic resistance to the flow of the protons, and this mainly occurs in the
proton exchange membrane, and depends greatly on the structure of the
membrane, the dimensions of the membrane, its water content, temperature and
catalyst loading. Hence, the total Ohmic Overvoltage can be expressed as
follows:
Design and Manufacturing of a (PEM) Proton Exchange Membrane Fuel Cell 74
( )electronic protonicohmic i R Rη = − + 3-39
Considering the protonic portion of the total resistance, for a membrane of
length ‘ l ’ in the direction of flow of protons, which is in this case the thickness of the
membrane; ‘ A ’ is the active area of the membrane in ( 2cm ), the protonic resistance of
the membrane; ‘R’, can be defined as follows [68]:
protonic M lRAρ
= 3-40
Where ‘ Mρ ’ is the membrane specific resistivity for the flow of protons
measured in ( ohm cm⋅ ) and it is a function of the type and characteristics of the
membrane, temperature, water content or degree of hydration of the membrane and
current density.
An empirical expression for Nafion® membrane resistivity was proposed by
Mann et al. [53] on the basis of published PEM Fuel cell performance curves. It was
represented as a function of current, temperature, active area and the semi-empirical
parameter (λ ); representing the effective water content of the membrane per sulphonic
group ( 2 3/H O SO− ) as follows:
2 2.5
1 2
3 4
0.031303
3 303expM
i T iA A
i TA T
ϕ ϕρ
λ ϕ ϕ
⎡ ⎤⎛ ⎞ ⎛ ⎞ ⎛ ⎞+ +⎢ ⎥⎜ ⎟ ⎜ ⎟ ⎜ ⎟⎝ ⎠ ⎝ ⎠ ⎝ ⎠⎢ ⎥⎣ ⎦=
⎡ ⎤ ⎛ − ⎞⎛ ⎞ ⎡ ⎤− − ⎜ ⎟ ⎜ ⎟⎢ ⎥ ⎢ ⎥⎝ ⎠ ⎣ ⎦⎣ ⎦ ⎝ ⎠
3-41
Where 1 181.6ϕ = , 2 0.062ϕ = , 3 0.634ϕ = and 4 4.18ϕ = . The parameter (λ )
depends on the preparation procedures of the membrane, the relative humidity and the
stoichiometric ratio of the anode feed gas and the working life of the membrane. It can
have a value as high as 14 under ideal, 100% relative humidity conditions, and has had
reported values as high as 23 [53]. The value of ‘λ ’ has to be determined on the basis
of experimental results.
Design and Manufacturing of a (PEM) Proton Exchange Membrane Fuel Cell 75
For simplicity, the two types of resistances can be grouped together in one term,
and equation (3-39) can be written as:
ohmic iR iη = 3-42
Where ‘ iR ’is the internal current resistance which comprises both electronic and
protonic resistances caused by membrane and contact losses [20].
3.4.3. Concentration Overvoltage; concη
Concentration overvoltage or “mass transport losses” result from the change in
the concentration of one of the reactants at the surfaces of the electrolyte, which occurs
when a chemical species participating in the reaction is in short supply due to obstruction
in the pathway of this species. This type of loss is sometimes called “Nernstian” because
of its connection with concentration effects which are modelled by the Nernst equation
[17].
The reduction in the concentration of the reactants depends on the rate at which
they are being consumed, which in turn depends on the current drawn from the fuel cell,
and on the physical characteristics of the system. All these factors will eventually lead
to variations in the pressures and concentrations of the gases, as well as the rate at
which they are being transported from the flow channel to the surface of the membrane
through the catalyst layer and the GDL. The effect of partial pressures was discussed
earlier; however, a similar argument will be adopted in the analysis of the concentration
overvoltages.
As pointed out earlier in the context of this chapter, the initial concentration of
the reactant gases, represented by their partial pressures, has an influence on the open
circuit voltage. The pressures of the gases will decrease in the fuel cell in the course of
their consumption, until they reach a point where the amount of reactant gases reaching
the electrolyte is equal to the rate of their consumption. At this point, the partial
pressure of the reactant gas has reached zero, hence, it is impossible to increase the
current output of the fuel cell beyond this point, which is the maximum current density
attainable, from now on called the limiting current density, ‘ li ’.
Design and Manufacturing of a (PEM) Proton Exchange Membrane Fuel Cell 76
Figure 3-9 Assumed variation of current density with concentration pressure Assuming that the pressure drops down to zero at the limiting current density
‘ li ’ in a linear manner due to mass transport, and that the initial pressure at zero current
was ‘P1’, then from the similarity of triangles in Figure (3-9), it can be shown that:
2
1
1l
P iP i
= − 3-43
Substituting this value in the Nernst equation (3-15), which explains the
relationship between the voltage drop and partial pressures of the reactant gases, the
following relationship is obtained:
ln 1concl
RT inF i
η⎧ ⎫
= − −⎨ ⎬⎩ ⎭
3-44
Where ‘n’ is the number of electrons transferred per molecule in the reaction, in
the case of Hydrogen-Oxygen Fuel cell n = 2 for Hydrogen, and n = 4 for Oxygen, ‘R’
is the universal gas constant (8.314 KJ/kmol .K), ‘T’ is the temperature of operation in
Kelvin, and ‘F’ is Faraday’s constant.
2
1
1l
P iP i
= −
Design and Manufacturing of a (PEM) Proton Exchange Membrane Fuel Cell 77
This can be compared to equations (3-36) where:
RTbnFα
= − 3-36
Hence equation (3-44) can be written as follows:
ln 1concl
ibi
η α⎧ ⎫
= −⎨ ⎬⎩ ⎭
3-45
This equation can now be used for plotting the concentration overvoltage for
hydrogen and oxygen using the proper values of ‘n’ at a temperature of 353K and
charge transfer coefficient ‘ 0.5α = ’ [17], the plots are shown in figure (3-10). The
open circuit voltage is taken as 1 Volt.
It is noted from the graph that the effect of the concentration overvoltage is more
dominant at the Anode compared to the Cathode, this is due to the fact that the reaction
kinetics are more rapid on the anode, consequently any effect that causes a delay to the
reaction will be more noticeable on the anode.
It is also noted that the limiting current does not occur suddenly, and the curve
drops down gradually at the anode side, while, in the case of the cathode, the drop-down
of the curve is more gradual.
The two curves drop down to the limiting current value simultaneously, hence
the final drop at the cathode side is more rapid and any attempt to draw more current
from the fuel cell beyond this value will result in a sharp drop in cell voltage, hence
decreasing the power output.
Design and Manufacturing of a (PEM) Proton Exchange Membrane Fuel Cell 78
0 100 200 300 400 500 600 700 800 900 10000.975
0.98
0.985
0.99
0.995
1
1.005
Current Density [mA/cm2]
Volta
ge d
rop
[V]
Concentration Overvoltage at the AnodeConcentration Overvoltage at the Cathode
Figure 3-10 Concentration Overvoltage at the Anode and Cathode at 353 K, Open circuit voltage is
taken as 1 Volt.
In order to study the effect of temperature on the concentration overvoltage,
equation (3-45) is plotted for two values of temperature for the cathode; figure (3-11)
below, it is noticed that the concentration losses increase slightly as temperature
increases. This is in accordance with Nernst equation, but in reality this is
counterbalanced by the increase in the kinetics of the chemical reaction as predicted by
the kinetic theory of gases. However, the concentration losses behaviour in the fuel cell
is a complex phenomenon and involves many factors. The main factor is the generation
of water at the cathode due to the chemical reaction which increases at high current
densities, at the same time, water evaporation increases at higher temperatures, which
reduces the species transport limitations and thus the concentration losses, but at the
same time could result in dehydration of the membrane and reduction in its protonic
conductivity. Consequently, it is difficult to predict the voltage behaviour due to the
variation of one parameter without considering the interactions of other parameters,
which necessitates the implementation of more advanced analytical tools such as
Design and Manufacturing of a (PEM) Proton Exchange Membrane Fuel Cell 79
computational fluid dynamic (CFD) modelling and simulations, which will be used to
model the final design of the fuel cell proposed in this study.
0 100 200 300 400 500 600 700 800 900 10000.988
0.99
0.992
0.994
0.996
0.998
1
1.002
Current Density [mA/cm2]
Volta
ge d
rop
[V]
Concentration O/V at the cathode at T=353KConcentration O/V at the cathode at T=303K
Figure 3-11 Concentration Overvoltage at the Cathode at various temperatures
A different approach in modelling the concentration overpotential was presented
by Kim et al. [69], in which an empirical equation based on experimental data was
presented as:
exp( )conc m niη = 3-46
A physical interpretation for the parameters ‘m’ and ‘n’ was not given, but
Bevers et al. [70] found in their one-dimensional modelling study that ‘m’ correlates to
the electrolyte conductivity and ‘n’ to the porosity of the gas diffusion layer. Following
up on this we can speculate now that both ‘m’ and ‘n’ relate to water management
issues: a partially dehydrated electrolyte membrane leads to a decrease in conductivity,
which can be represented by ‘m’, whereas an excess in liquid water leads to a reduction
in porosity and hence to an early onset of mass transport limitations, which can be
captured by the parameter ‘n’ [65].
Design and Manufacturing of a (PEM) Proton Exchange Membrane Fuel Cell 80
The equation is derived on the basis of curve fitting techniques and only applies
to the fuel cell and operating parameters of the particular experiment of the authors.
Typical values for ‘m’ and ‘n’ as suggested by [17] are m = 2.11E-5 and n = 0.008.
The Geometry of the fuel cell plays an important role in minimizing the
concentration losses, and hence, increasing the value of the limiting current and
improving the range of operation of the fuel cell. This can mainly be achieved through
reducing pressure drop in the flow channels, increasing the active area of the membrane
and improved water management which is capable of removing the water produced by
the reaction at the cathode side in order to maintain access for the reactants to reach the
active sites on the membrane.
3.4.4. Fuel Cross-Over and Internal Currents
Although the proton exchange membrane in the fuel cell is an electronic
insulator, it will support very small amounts of electron cross-over. It will also allow
some hydrogen to pass through diffusion from the anode to the cathode. This hydrogen
will react with oxygen at the cathode in the presence of the catalyst to produce water
and heat, but without producing electric current.
It is assumed here that the internal currents are equal to fuel cross-over. The
amount of fuel wasted due to fuel cross over can be approximated using a relationship
that relates this amount to current. This current value can then be added to the total
current in the voltage-current relationship. The internal current in the fuel cell cannot be
measured, but using the basic equation for current in terms of fuel usage derived earlier;
equation (3-7), and measuring the fuel consumption at open circuit, the value of internal
current can be estimated.
An empirical value for the internal currents suggested by [17] is 3.00 mA/cm2.
Substituting this value in equation (3-7) above, gives a value of fuel consumption due to
fuel crossover equal to: 100.314 10−× kg/s.cm2 of hydrogen.
The value of internal current has to be added to the fuel cell current when
measuring fuel cell performance.
Design and Manufacturing of a (PEM) Proton Exchange Membrane Fuel Cell 81
3.5. OVERALL VOLTAGE
The four types of overvoltage discussed above, namely: Activation, Internal
currents, Ohmic and Concentration Overvoltages act together throughout the range of
operation of the fuel cell. They have a combined effect that will drive the performance
curve of the fuel cell, commonly known as the polarization curve, away from linearity
with respect to the amount of current required from the fuel cell.
To visualize the combined effect of these losses, a general equation that
represents the summation of their basic equations is representative of their total effect.
The basic equations are as follows:
int int into act Ohmic concV E η η η+ + += + + + 3-47
Where V is the output voltage, and oE is the reversible voltage of the fuel cell.
For a fuel cell operated on hydrogen with the gases at one atmospheric pressure; and the
activity of water remains at unity; oE will have a voltage of 1.229 volt [66].
The three following terms represent the activation, Ohmic and concentration
overvoltages; the ‘int’ suffix denotes the voltage losses due to internal currents that will
be included in the equation:
( ) ( ) ( )2 2
* *2
11.229 ln ln2o
o H OE T T T P Pβ ϕ ⎧ ⎫⎨ ⎬⎩ ⎭
= − − + + 3-26
Where 32 0.85 10β −= × [VK-1] and 54.3085 10ϕ −= × [VK-1].
log cact
o
ibi
η⎛ ⎞
= ⎜ ⎟⎝ ⎠
3-34
Where:
RTbnFα
= − 3-35
ohmic iR iη = 3-42
Design and Manufacturing of a (PEM) Proton Exchange Membrane Fuel Cell 82
Where ‘ iR ’is the internal current resistance which comprises both electronic and
protonic resistances caused by the membrane together with the contact losses.
ln 1concl
ibi
η α⎧ ⎫
= −⎨ ⎬⎩ ⎭
3-45
Where ‘α’ is the charge transfer coefficient and ‘b’ is taken from equation (3-
35).
In all these equations, the internal current has been added to the total value of
current, the following constants and parameter values (Table 3-2) have been used to plot
the polarization curve for equation (3-47), the MatLab® code used for the plot is
presented in Appendix B.
Table 3-2 Values of constant parameters used to plot the polarisation curve in figure (3-12)
PARAMETER VALUE UNITS
Eo 1.031 Volt
b 0.032 kJ.mole/kg.°C
R 3x10⁻³ Ohm
io 50 A/cm2
il 2000 A/cm2
T 353 Kelvin
Design and Manufacturing of a (PEM) Proton Exchange Membrane Fuel Cell 83
Figure 3-12 Polarisation curve as functions of the current density of the fuel cell
3.6. NOTES AND OBSERVATIONS ON THE POLARISATION CURVE
The following observations can be drawn from this graph:
1. The shape of the curve is typical of the fuel cell performance, but deviation
from this curve under practical conditions is expected, as the theory behind
this curve is based on idealistic assumptions and does not consider all the
factors affecting the practical applications.
2. This study applies only to changes in pressure and temperature and their
influence on the performance of the fuel cell, however, those changes will
cause changes in the conductivity of the various components, viscosity of the
fluids, and variations in certain parameters that have been assumed constant,
such as the specific heat at constant pressure.
3. The geometry of the fuel cell plays a major role in its performance, but in
this analysis, only the theoretical background of the analysis is considered as
an exercise for establishing similar parameters under experimental
Design and Manufacturing of a (PEM) Proton Exchange Membrane Fuel Cell 84
conditions. This however cannot be achieved until a practical fuel cell is
constructed and its geometric parameters are established.
4. This analysis puts forward the theory of the fuel cell operation which will be
used for optimization of the fuel cell design and components in a later stage.
3.7. EFFICIENCY AND HEAT OUTPUT
The basic definition of efficiency, where ‘ thε ’ the thermal efficiency of the fuel
cell is:
Power 0utput 100%Power inputthε = × 3-48
Efficiency can be the process efficiency or the system efficiency, where the
process efficiency indicates how efficient a single process in the system is performing,
but does not indicate the total system efficiency; such as the combustion process itself
in a heat engine which could reach 95% while the system efficiency is in the range of
28%.
The efficiency of the thermodynamic process taking place in the fuel cell is the
theoretical maximum efficiency allowed by the second law of thermodynamics and can
be expressed as follows:
Tth o
GH
ε Δ=Δ
3-49
Where ‘ TGΔ ’ is the Gibbs free energy at the cell operating at temperature ‘T’
[K], and ‘ oHΔ ’ is the reaction enthalpy at the (STP) standard temperature and pressure
101.3 Pa, 298 K.
Design and Manufacturing of a (PEM) Proton Exchange Membrane Fuel Cell 85
In the case of PEM fuel cells and other types of fuel cells running on hydrogen,
it is important to take the proper value for enthalpy depending on the phase at which the
product water is produced. Higher heating value HHV8 [17] is used when the water
product is liquid at 298K (25oC) and lower heating value LHV is used when the water
product is vapour at 423K (150oC), as part of the enthalpy has been consumed in
evaporating the water. It is worth noting that in the PEM fuel cell, the water product is
produced at 353K (80oC), and the calorific value of the fuel should be somewhere
between the lower and higher heating value, according to the definitions of the heating
values.
Table 3-3 Gibbs free energy, enthalpy and calorific value for hydrogen
Value TGΔ 0HΔ Calorific Value Unit kJ/mole kJ/mole MJ/kg LHV 223.0 240.4 120.21 HHV 237.1 285.8 142.18
Interpolated value at 353K (80oC) 230.5 264.6 132.0
From standard thermodynamic values, the values for the Gibbs free energy ‘ΔG’
for hydrogen and the enthalpy of the reaction ‘ΔH’ at 353K (80°C) are approximated
by linear interpolation, table (3-2). Applying equation (3-49) for thermal efficiency
4 The lower heating value; LHV; (also known as net calorific value) of a fuel is defined as the amount of heat released by combusting a specified quantity (initially at 25°C) and returning the temperature of the combustion products to 150°C, which assumes the latent heat of vaporization of water in the reaction products is not recovered. The higher heating value; HHV (also known as gross calorific value or gross energy) of a fuel is defined as the amount of heat released by a specified quantity (initially at 25°C) once it is combusted and the products have returned to a temperature of 25°C, which takes into account the latent heat of vaporization of water in the combustion products.
Design and Manufacturing of a (PEM) Proton Exchange Membrane Fuel Cell 86
above, using the interpolated values at 353K (80oC) from table (3-3); it follows that the
maximum thermal efficiency is approximately = 0.87.
Hence, from the equation for the thermodynamic efficiency above, it can be
concluded that:
00.87TG HΔ = ×Δ 3-50
Gibbs free energy represents the maximum thermodynamic output possible in an
electrochemical process. However, in real operation, the actual power output derived
from the fuel cell is:
Actual electrical power output cellIV= 3-51
To get a value for the electrical efficiency of the fuel cell, the actual output
should be compared to the actual input which is the total enthalpy of the reaction, hence:
Actual electrical power output cell
o o
IV
m H m Hε − −= =
Δ Δ 3-52
But:
I m nF−
= 3-53
Where ‘ m−
’ is the molar flow rate of fuel, ‘n’ is the number of electrons
transferred per molecule in the reaction. ‘ cellV ’ is the measured cell voltage, hence, from
equation (3-50):
/ / / // /0.87 0.87
oo TG nFEH Δ −
Δ = = 3-54
Absolute values of the enthalpy and Gibbs free energy are taken because the
negative sign indicates the direction of energy transfer, while absolute numerical values
are considered for efficiency calculation.
Substituting equations (3-54) and (3-53) in (3-52) yields the electrical efficiency
of the fuel cell:
Design and Manufacturing of a (PEM) Proton Exchange Membrane Fuel Cell 87
0.87 cello
VE
ε = 3-55
Where cellV is the measured cell voltage; which is a function of current density,
and oE is the reversible voltage of the fuel cell.
The expression can be interpreted as the maximum theoretical efficiency
multiplied by the electrical efficiency; i.e. ( th eε ε ε= × ).
Following the same lines, the electrical efficiency is the ratio of measured
electrical output to actual electrical input, which can be written as:
int( )cell
e o
iVi i E
ε =+
3-56
Where ‘ i ’is the current density, ‘ inti ’ is the cross over current which is assumed
to be equivalent to internal currents; both are considered as currents defining the input
power together with the theoretical reversible voltage of the fuel cell. From equations
(3-56) and the definition of maximum thermal efficiency:
int
0.87( )
cello
iVi i E
ε ×=
+ 3-57
This relationship is plotted in fig (3-13) below:
Design and Manufacturing of a (PEM) Proton Exchange Membrane Fuel Cell 88
0 100 200 300 400 500 600 700 800 900 10000
0.1
0.2
0.3
0.4
0.5
0.6
0.7
0.8
0.9
1
Current Density [A/cm2]
Effi
cien
cy/C
ell v
olta
ge [V
]
Cell VoltageEfficiency
Figure 3-13 Efficiency and cell voltage as functions of current density
It is observed from the figure that, contrary to heat engines, the efficiency of the
fuel cell is higher at low fuel flow rates corresponding to low current densities. The
efficiency curve follows almost the same shape as the voltage curve; being a function of
cell output voltage, hence, efforts should be focused on improving the fuel cell voltage
and reducing voltage losses as this would improve the performance of the fuel cell.
Following the conventional definition of efficiency in thermodynamics, another
approach for defining the efficiency of the fuel cell is to compare the actual output with
the input calorific value, the system efficiency of the fuel cell can be written as:
2
100%Calorific value (LHV)
cellfc
H
V I
mε •
×= ×
× 3-58
Using the expression for current, for a hydrogen fuel cell:
2
2
2H
H
mI FM
•
= × 3-59
Design and Manufacturing of a (PEM) Proton Exchange Membrane Fuel Cell 89
2
2 100%Calorific value (LHV)
cellfc
H
V FM
ε ×= ×
× 3-60
Substituting the values for Faraday’s constant, molar mass of hydrogen and the
interpolated calorific value for hydrogen, the efficiency of the fuel cell becomes:
100%1.38
cellfc
Vε = × 3-61
In this work the expression for efficiency based on the calorific value of
hydrogen will be used.
Comparing the two expressions for efficiency; equations (3-61) and (3-55);
which should be equal, the theoretical open circuit voltage of a pure hydrogen fuel cell
can be found as follows:
100% 0.87 100%1.38
cell cellfc o
V VE
ε = × = × 3-62
Hence the reversible voltage of the fuel cell assuming the water product is steam
at 80oC is:
0.87 1.37 1.20 VoE = × = 3-63
This value is close to the value of potential of equilibrium for hydrogen fuel
cells which is 1.229 V, which verifies the above method for calculating the efficiency of
the fuel cell.
3.8. FUEL UTILISATION EFFICIENCY
In actual operation, it is expected that some fuel will pass through the fuel cell
and come out unused, this is a significant issue when the outlet end of the fuel cell is
open and excess fuel is vented out of the fuel cell, however, if the fuel cell is operated
dead ended or in the case where the excess fuel is recirculated or used in another
process; such as an after burner for heat generation, fuel utilisation will not be an
important issue for the fuel cell. In all cases the final efficiency of the fuel cell has to be
multiplied by the fuel utilisation value to calculate the exact efficiency of the fuel cell.
Design and Manufacturing of a (PEM) Proton Exchange Membrane Fuel Cell 90
Assuming fuel utilisation efficiency was given the term ‘µ’, the above
expression of efficiency equation (3-57) becomes as follows:
int
0.87( )
cello
iVi i E
ε μ ×=
+ 3-64
3.9. SUMMARY
In this chapter; the theoretical background to PEM fuel cell science is discussed
starting with the working principles of PEM fuel cells. A thermodynamic analysis is
followed to establish the relationship between current and voltage in relation to other
operational and geometric parameters such as pressure, temperature, exchange current
density, charge transfer coefficient and gas concentrations in the fuel cell.
For the first time, an analysis based on the polytropic index is used to study the
effects of pressure and temperature on fuel cell performance which shows the effects of
irreversibility on output voltage of the fuel cell.
A comprehensive expression for the efficiency of the fuel cell; which takes into
consideration the actual operating conditions, internal currents, fuel utilisation
efficiency and thermal and electrical efficiencies is derived and used to plot the
complete curve of efficiency against current density. The equations derived in this
chapter are useful in performing parametric studies on fuel cell performances. The
graphical representations of the solutions of those equations would help in finding the
optimum combination of the design variables for changing operating conditions. They
can also be used to formulate a more complex numerical model of the system which can
be resolved using computational methods to simulate the fuel cell performance and find
avenues for optimisation.
This chapter was very useful in understanding the behaviour of PEM fuel cells
under various operating and geometrical conditions. The knowledge and findings
acquired in this study will be useful in designing the fuel cell and formulating the
mathematical model which will be used for optimisation of the design. Those issues are
presented in the following chapters.
Design and Manufacturing of a (PEM) Proton Exchange Membrane Fuel Cell 91
Chapter 4 DESIGN OF THE (PEM) FUEL CELL
4.1. INTRODUCTION
The theoretical background necessary to understand the working of a PEM fuel
cell was given in the previous chapter. This research aims to investigate the fuel cell
technology through the actual making of a working fuel cell and at the same time
attempts to reduce the cost of fuel cell manufacturing through simplifying the design
and investigating new materials for the various components of the fuel cell.
More than half of the fuel cell cost goes to three major components: The gas
distributors, constituting ≈30% of the total cost [71], the electrolyte, which is the
protonic conducting membrane which constitutes ≈14% of the total cost and the catalyst
layer which also constitutes ≈14% of the total cost. The estimated percentage cost of
each of the major components of the fuel cell are shown in the following chart, figure
(4-1) [72]:
Figure 4-1 Estimated percentage cost of each of the major components of PEM fuel cells based on
graphite bipolar plates
Design and Manufacturing of a (PEM) Proton Exchange Membrane Fuel Cell 92
The design of the fuel cell plays a major role in determining their cost. It is not
only the cost of materials that increases the cost of the fuel cell, but also the
manufacturing techniques and the need for skilled technicians for assembling and
testing the fuel cell.
The main aim of this research is to design and manufacture a fuel cell at low cost
using conventional materials and production techniques, then testing the fuel cell to
validate its performance. The following chart describes the design process leading to the
production stage of the fuel cell:
Figure 4-2 Fuel cell design and manufacturing process
NO
Specifications and Requirements
Material Selection
Design
Fabrication
Testing
Does it give the desired performance?
YES
Production
Design and Manufacturing of a (PEM) Proton Exchange Membrane Fuel Cell 93
4.2. MATERIAL SELECTION
Material selection is a very important step after the specifications have been put
forward to meet the requirements of the end user. So as to select the proper materials, a
proper understanding of the function and general requirements of the fuel cell
components is necessary. A general description of the main components is briefly
discussed.
4.2.1. The Electrolyte
The electrolyte is the media where chemical reactions in the fuel cell take place;
it should have good proton conductivity because higher protonic conductivity means
larger electron flow in the external circuit and hence more current output of the fuel cell.
At the same time, the electrolyte should have good chemical and physical properties
regarding its manufacturability, cost and fitness for fuel cell application.
One important feature which is desirable in the PEM is the operation at
temperatures higher than 100°C. Operation at higher temperatures simplifies the water
management problem as the by-product water will come out as vapour which is easy to
remove, and the temperature output of the fuel cell will be of a higher grade, which can
be better utilised, hence; improving the overall efficiency of the fuel cell.
The most important advantage of operation at a higher temperature is the
improvement in the kinetics of the chemical reaction, particularly oxygen reduction at
the cathode, which results in a reduction of the catalyst loading on the cathode and
hence; a reasonable reduction in the cost of the fuel cell. Another advantage is the
reduction of CO poisoning which is reduced at higher temperatures.
The electrolyte commonly used in PEM fuel cells is the poly (perfluorosulfonic
acid) copolymer. Those copolymers are based on a sulfonated Teflon backbone. The
state of the art is the Nafion® membrane produced by Du Pont plc. These polymers have
good chemical and physical properties for use as PEM in fuel cells, however, they are
recognized to have some significant technical deficiencies such as reduction in
conductivity at low humidity or high temperatures and high cost [9].
Design and Manufacturing of a (PEM) Proton Exchange Membrane Fuel Cell 94
In this research, it was attempted to investigate new materials for PEM through
the synthesis of new polymer membranes based on Sulfonated Polyimides. However,
the focus of the study was directed towards the design aspects of the fuel cell hardware,
but understanding of the functions and properties of other components remains
important.
4.2.2. The Catalyst Layer
The electrochemical reaction in the fuel cell takes place within the porous
catalyst layer at the boundaries of three phases: the gases, the electrolyte and the
catalyst surface. The performance of the fuel cell is limited by the electrochemical
kinetics of these three components, where the catalyst determines the electrochemical
kinetics of the reduction and oxidation reactions, the membrane determines the proton
conduction and the gas phase is concerned with mass transport issues.
The catalyst layer has to cater for the three phases at the same time; it has to
generate the protons by breaking the bonds between hydrogen particles and then
transport them to the surface of the membrane; hence, it should have the same protonic
conductivity of the membrane material. It has to transport the electrons to the
electrodes; hence, it has to be an electronic conductor, and it has to allow the gases to
diffuse through it to reach the active sites in the catalyst layer.
As the oxidation of hydrogen and reduction of oxygen take place on the surface
of the catalyst, the catalyst layer should have a large surface area. This does not only
improve the reaction, but also reduces the amount of catalyst material used, which is the
precious platinum.
Usually the catalyst material is dispersed on the surface of a high surface area
carbon material, which helps reduce the amount of platinum used, increases the surface
area of the catalyst material and maintains its gas permeability and electronic
conductivity. This platinum on carbon is then prepared in the form of an ink by mixing
it with a solution of the membrane material, which enhances its bonding to the
membrane and makes it protonically conductive, and then it is applied to the membrane
surface by means of a brush, spray or a decal method.
Design and Manufacturing of a (PEM) Proton Exchange Membrane Fuel Cell 95
4.2.3. Gas Distributors and Electrode Plates
Commonly known as bipolar plates (BPP) and end plates in fuel cell
terminology, and are conventionally made of graphite. They constitute a considerable
percentage; nearly (30%) of the total estimated cost of the fuel cell and nearly (80%) of
the volume when made of graphite [71], this is due to the fact that graphite is fragile and
has to have some thickness to provide for the depth of the flow channels and to
withstand machining. The gas distributors serve two main tasks:
1. To distribute the gases over the surface of the membrane
2. To work as electrodes that transport the electrons from anode to cathode
and connect individual fuel cells in series to form a fuel cell stack with
required voltage output.
Conventionally, the plates’ material is chosen, machined or treated to satisfy
both requirements at the same time. It will generate a good saving in the fuel cell if the
functions of the bipolar plates were separated and different materials used to satisfy
each requirement separately. For instance, a composite material can be used for the gas
distribution and a metallic material for the electrical connection and current transfer.
Furthermore, the cost can be reduced by reducing the number of components.
This can be achieved by changing the configuration of the fuel cell.
The common approach is to connect the cells together internally in series using
the bipolar plates, this is actually where the term bipolar plate comes from; the cathode
of one cell is connected to the anode of the adjacent cell. The number of those plates can
be reduced if one compartment was used to supply hydrogen or oxygen to two cells at
the same time, in this case the configuration of the fuel cell is changed in such a way;
that one gas distributor is used to supply the gas to two anodes or two cathodes at the
same time, the configuration of the fuel cell in the conventional design is:( Anode -
Cathode – Anode … etc.), the proposed configuration is :( Anode – Anode – Cathode –
Cathode ….etc.).
Design and Manufacturing of a (PEM) Proton Exchange Membrane Fuel Cell 96
Further details of this design will be presented in the fuel cell design section of
this chapter including a proposed detailed design of a fuel cell module of 0.1 kW output
which constitutes a building block in a larger fuel cell for stationary applications.
The first step in the present design approach is to separate the two tasks of the
bipolar plate, namely gas distribution and interconnection of the fuel cells. The second
step is to change the internal configuration of the fuel cell to reduce the number of
electrode plates and gas distributors used. The details of this design will be discussed in
this section together with calculations for the fuel cell module.
The materials for the electrode plates must be selected to satisfy the following
requirements:
1. High electric conductivity typically in excess of (100 Siemens/cm) [72] to
reduce (Ohmic) resistive losses in the fuel cell
2. Low hydrogen permeability ( 6 3 22 10 / .cm cm s−< × ) [72] to reduce power losses
Where ‘io’ is the exchange current density, ‘n’ is the number of electrons per
mole of reactant, ‘η’ is the local over-potential and ‘R’ is the universal gas constant. ‘α’
is the is the transfer coefficient, which is determined empirically to be between 0 and 1,
subscripts ‘c’, ‘a’ stand for cathode and anode respectively.
The activation over potential ‘ηact’ at the cathode is calculated by [85]:
,act c s m ocVη φ φ= − − 6-21
And, from the Nernst law, the open circuit voltage (OCV); ‘ ocV ’is given by [85]:
0.2329 0.0025 ocV T= + 6-22
During these analyses; the catalyst layer is treated as a thin boundary interface,
where sink and source terms for the reactants are implemented.
The consumption of reactant species and the production of water and heat are
modelled as sink and source terms in the catalyst layers. The mass consumption rate of
oxygen per unit volume is given by [86]:
22 4
OO c
MS iF
= − 6-23
The production of water is modelled as a source term based on the local current
density [86]:
22 2
H OH O c
MS iF
= 6-24
At the anode catalyst layer, hydrogen is consumed to produce electrons and
protons. The consumption of hydrogen is given by [86]:
22 2
HH a
MS iF
= − 6-25
In this model, heat generation is assumed to be predominantly due to the
electrochemical reactions, and Ohmic heating is not currently accounted for.
Design and Manufacturing of a (PEM) Proton Exchange Membrane Fuel Cell 181
Furthermore, heat generation from the anode reaction is negligible compared to
the cathode reaction, and hence only cathodic heat generation is considered [86]:
( )act c
e
T sq in F
η• ⎡ ⎤−Δ= +⎢ ⎥⎣ ⎦
6-26
Where ‘T’ is the local temperature, ‘Δs’ is the entropy of the chemical reaction,
‘ne’ is the number of electrons transferred per mole of hydrogen, ‘ηact’ is the activation
overpotential and ‘F’ is Faraday’s constant.
6.6. NUMERICAL SETUP
The above mentioned governing equations with their relative boundary
conditions were solved using a commercial multi-physics numerical solver ‘COMSOL
version 3.4’. Convergence criterion is performed on each variable and the procedure is
repeated until the convergence is obtained. All these numerical analyses were carried
out considering the following assumptions:
a) Single Phase model as liquid is assumed in vapour form at operating conditions.
b) Isotropic and Homogenous electrodes and membranes.
c) Membrane impermeable for species in the gas phase.
d) Negligible contact resistance.
e) Negligible membrane swelling.
f) Catalyst layer assumed as a reactive boundary layer.
g) Steady state operation under fully humidified conditions is assumed.
h) The model assumes operation under ideal heat and water management ensuring
the membrane remains fully humidified.
i) Both humidified air and hydrogen behave as ideal gases and since the
characteristic Reynolds number in the gas channels are low; the flows there are
assumed laminar.
Design and Manufacturing of a (PEM) Proton Exchange Membrane Fuel Cell 182
j) Ohmic heating is neglected, as heat generation is assumed to be predominantly
associated with the cathodic electrochemical reaction.
k) The potential drop in the electrode plate is negligible, since stainless steel is a
good conductor.
For the numerical model, velocity, temperature and species mass fractions are
specified as inlet boundary condition at both cathode and anode sides, while pressure
and convective flux are specified as outlet boundary conditions. Continuous boundary is
assumed between the gas channel and the perforated gas distributor open channels,
while for the closed channels, wall is used as a boundary condition. At the diffusion
layer/catalyst layer interface, there are phase changes between gaseous and dissolved
species; therefore continuity is assumed at this interface. Solid phase potential is
arbitrarily set to zero as a reference at the anode, while at the cathode; solid potential is
set to ( – cell revE E ) where ‘ cellE ’ is the desired cell potential and ‘ revE ’ is the reversible
cell potential.
Design and Manufacturing of a (PEM) Proton Exchange Membrane Fuel Cell 183
6.7. MODEL VALIDATION
This section presents the numerical analyses in comparison with the
experimental data to validate the performance of the proposed fuel cell design at various
geometric conditions. The electrochemical properties and physical properties for various
regions of the fuel cell together with the operating conditions are specified in table (6-1)
below:
Table 6-1 Model parameters and physical properties of fuel cell components
Parameter Value
Operating Temperature (K) 333
Inlet Pressure (kPa) 100
H2, Air Flow Rate (kg/sec) 1.57E-05
Relative Humidity, Air 70%
Relative Humidity, H2 92%
Oxygen/Nitrogen ratio in air 0.21/0.79
GDL and Catalyst Porosity 0.5
GDL and catalyst Permeability (m2) 1.76 e-11
Exchange Current Density, Anode (A/m2) 1.00E04
Exchange Current Density, Cathode (A/m2) 1.00E-03
Concentration Parameter, Anode 0.5
Concentration Parameter, Cathode 1
Transfer Coefficient, Anode 0.5
Transfer Coefficient, Cathode 0.5
Membrane Ionic Conductivity (S/m) 17.69
GDL and Catalyst layer Conductivity (S/m) 120
Membrane Thickness (m) 180 e-6
GDL Thickness (m) 200 e-6
Perforated Plate Thickness (m) 0.55 e-3
Active Area of the PEM Fuel Cell (cm2) 25
Design and Manufacturing of a (PEM) Proton Exchange Membrane Fuel Cell 184
To validate this design concept, a comparison study was done with the results
obtained form a conventional design fuel cell and the current design approach. A good
comparison was found between experimental and numerical results obtained for the
perforated design configuration, which validated the numerical model. A satisfactory
performance comparison was found between results obtained from the conventional
graphite-made parallel flow channels fuel cell and PEM fuel cell with perforated
stainless steel flow channels.
Figure 6-13: Comparison of PEM fuel cell performance polarization curves for
Conventional parallel channel graphite gas distributor and perforated Stainless Steel gas
distributor at T = 333K
For both these experimental models; Nafion® 117 membrane was used. As
discussed earlier, although graphite is a suitable material for electrodes in PEM fuel
cell, but on the other hand it’s manufacturing and handling cost is considerably high as
compared to stainless steel.
Design and Manufacturing of a (PEM) Proton Exchange Membrane Fuel Cell 185
The low performance in the case of stainless steel; figure (6-13) is attributed to
differences in material properties, particularly electrical conductivity and high fractional
losses offered by the perforated holes.
Stainless steel is an alloy made up of 17% to 21% Chromium, 7.5% to 11.5%
Nickel, 0.01% to 0.164% Carbon and 50% to 70% Iron. Apart from Carbon; these are
transition metals10 [87] which have their valence electrons, or the electrons they use to
combine with other elements, present in more than one shell of the atom. This is the
reason why they often exhibit several common oxidation states and consequently can
react with the catalyst and reaction gases in the fuel cell. This reaction has a double
effect: on one hand, it damages the performance of the fuel cell because an amount of
catalyst and reactant gases will be consumed in the oxidation reaction, and on the other
hand oxide layers are formed on the electrode plates which increase their electrical
resistance hence increase Ohmic voltage losses in the fuel cell. This also has a dramatic
effect on the exchange current density due to the side reactions taking place in the fuel
cell and the reduced catalytic activity due to these reactions which explains the sharp
activation losses at low current densities.
Another factor which is likely to have contributed to the performance losses in
the fuel cell is the frictional loss due to flow past the perforated holes in the meshed
10 The 38 elements in groups 3 through 12 of the periodic table are called "transition metals". As with all
metals, the transition elements are both ductile and malleable, and conduct electricity and heat. The
interesting thing about transition metals is that; their valence electrons, or the electrons they use to
combine with other elements, are present in more than one shell. This is the reason why they often exhibit
several common oxidation states. There are three noteworthy elements in the transition metals family.
These elements are iron, cobalt, and nickel, and they are the only elements known to produce a magnetic
field.
Design and Manufacturing of a (PEM) Proton Exchange Membrane Fuel Cell 186
stainless steel electrodes. However, this factor can be controlled by certain geometric
variations which can be discussed as a future investigation.
Keeping the material properties aside, further analyses were carried out to
explore the performance of the current design approach by varying different geometric
parameters in order to enhance and optimize its performance.
For this purpose; the distribution of reactant species and their potential impact
on water management and current density in this particular design approach are taken
into consideration. Figure (6-14) shows the distribution of oxygen and water mole
fractions along the cathode catalyst layer at T = 333K and V = 0.4 Volt.
Figure 6-14: Distribution of oxygen and water mole fractions along the cathode catalyst layer at T =
333K, RH = 95% and V = 0.4V.
Results in figure (6-14) indicate a high value of oxygen mole fraction just below
the cathode inlet, but at the corners and below the solid areas of the meshed plate; a
considerably lower amount of oxygen is present, which could lead to potential water
flooding in these areas. Moreover, the figure shows that reactant air is not covering the
whole area of the fuel cell domain at the cathode side and is following the shortest
possible path from inlet to outlet, which indicates that certain design changes can be
undertaken to improve the distribution of reactant air to cover more surface area of the
fuel cell domain.
Oxygen mole fraction Water mole fraction
Design and Manufacturing of a (PEM) Proton Exchange Membrane Fuel Cell 187
The following sections present the numerical and experimental results on the
effects of varying certain geometric parameters such as: perforation-hole diameter,
shape, gas channel height and inlet and outlet-hole locations on the performance of the
proposed PEM fuel cell design.
6.7.1. Effect of Trough Height Variation
Gas channel (trough) height of a PEM fuel cell is an important factor that could
influence the behaviour of the reactant species in the fuel cell domain. Any change in
gas channel height affects its boundary layer features, consequently changing the
residence time of the reactant species and their distribution along the fuel cell domain.
Increase in residence time improves the rate of diffusion of the species along the fuel
cell domain.
Two different gas channel heights 2 mm and 5 mm were analysed to study the
flow behaviour and its impact on the overall performance of the fuel cell. Figure (6-15)
shows the results obtained from experimental and numerical studies at T = 333K:
Figure 6-15: Effect of Gas channel height on the performance of the fuel cell, at T = 333K,
RH = 95% and V = 0.4V. Comparison between experimental and numerical results.
Design and Manufacturing of a (PEM) Proton Exchange Membrane Fuel Cell 188
From the figure above; it is observed that increasing the channel height slightly
reduces the performance of the fuel cell. Such decrease in performance is attributed to
the change in residence time of the reactant gases in the flow domain as a result of
increasing the cross sectional area in the direction of flow. With the increase in gas
channel height, the velocity of the gas flow decreases, hence the residence time of the
gases increases, which is supposed to improve the performance of the fuel cell,
however, this effect is counterbalanced by the decrease in the thickness of the boundary
layer due to increasing the trough thickness, which results in a decrease in shear stresses
and enhances the flow of the gases through the fuel cell. These flow interactions lead to
an increase in convective flux and a reduction in diffusive flux of the reactant species.
The relatively low flow velocity and residence time in the case of the thicker
trough deteriorate water removal from the fuel cell and lower its performance, while, on
the other hand, reducing the trough thickness reduces the residence time of the reactant
gases and reduces the amount of oxygen mole fraction along the cathode catalyst layer,
thus leading to a change in the electrochemical reaction.
The activation losses in both cases are similar, which indicates that the flow
characteristics do not have a direct impact on the activation overvoltages which were
attributed predominantly to material characteristics. However, the overall analyses show
that increasing the gas channel height slightly reduces the performance of this type of
PEM fuel cell.
6.7.2. Effect of Varying Mesh Hole Diameter
To study the effect of perforated hole diameter variation; two different hole
diameters 2.5 mm and 5 mm were taken into consideration. All the analyses were carried
out assuming a constant channel height (trough thickness) of 5 mm. Figure (6-15) above
shows the current density distribution along the cathode catalyst layer for two different
perforated type hole diameters.
Results demonstrate that increasing the meshed plate hole diameter increases the
surface area of the PEM exposed to the reactant species along the fuel cell domain,
which consequently increases the performance of the PEM fuel cell. Increase in mesh
Design and Manufacturing of a (PEM) Proton Exchange Membrane Fuel Cell 189
hole diameter also reduces the frictional losses to flow through the holes which leads to
an improved distribution of oxygen mole fraction along the cathode catalyst layer, thus
resulting in improvement of the electrochemical reaction along the catalyst layer and, to
a certain extent, reduction in water flooding.
Figure 6-16: Effect of perforated holes diameter variation on current density distribution along the
cathode catalyst layer, at V = 0. 4V, in both cases hole trough height = 5 mm.
A higher value of current density is obtained in the case of the 5 mm diameter
holes as compared to the 2.5 mm diameter holes, this has a direct impact on the
activation kinetics and should result in improving the activation overvoltage.
As an overall assessment, the results show that increasing the perforated hole
diameter enhances the performance of this type of PEM fuel cells.
6.7.3. Effect of Varying Inlet Hole Diameter
During the above analyses, the outlet holes diameter was kept constant at 6mm.
In the following discussion, three different inlet hole diameters 6, 8 and 10 mm are
analysed to see their impact on the overall performance of the fuel cell, while the outlet
hole diameter is kept constant at 6 mm.
Hole diameter= 2.5 mm, Trough Height = 5mm Hole diameter = 5 mm, Trough Height = 5 mm
Design and Manufacturing of a (PEM) Proton Exchange Membrane Fuel Cell 190
Results confirm that with the increase of inlet hole diameter, a significant
improvement in reactant species distribution along the fuel cell domain is observed.
This improvement is attributed to the increase of the mass flow rate of reactant species
at the inlet. During this study; outlet diameter is kept constant to increase the residence
time of the flow in the fuel cell domain, so that a better diffusive concentration of
reactant species can be obtained. For all these analyses perforated gas distributor with
mesh hole diameter of 5 mm and gas channel height of 2 mm is taken into
consideration.
Figure (6-17) illustrates the distribution of Oxygen mole fraction along the fuel
cell domain at V = 0.5 Volts. A more uniform gas distribution is obtained in the case of
larger hole, with oxygen covering the full domain of the fuel cell, while in the case of
the 6 mm inlet hole, the remote corners seem to be poorly covered with the reactant gas.
Figure 6-17: Oxygen Mole fraction distribution along the cathode side of PEM fuel cell
The following figure (6-18) illustrates the distribution of Water mole fraction
along the fuel cell domain at V = 0.5 Volts.
Water accumulation is observed at the remote corners in the case of the 6mm
hole, while much better water removal is achieved with the 10 mm inlet hole.
Inlet Diameter = 6 mm Inlet Diameter = 10 mm
Design and Manufacturing of a (PEM) Proton Exchange Membrane Fuel Cell 191
Figure (6-18) clearly shows that increasing the inlet hole diameter improves the
distribution of oxygen along the fuel cell domain, and simultaneously reduces the water
flooding and improves the overall performance of the fuel cell.
Figure 6-18: Water Mole fraction distribution along the Cathode side of the PEM fuel cell
The effect of inlet hole diameter variation on the overall performance of the fuel
cell is revealed in figure (6-19) below. It is observed that the activation overpotential is
not significantly influenced by the change in the inlet hole diameter, which confirms
again that the reaction kinetics are not dependant on flow characteristics.
A significant increase in Ohmic losses is observed as the inlet hole diameter
reduces, this is attributed to frictional losses to the flow of reactant gases through the
meshed plate holes and the low diffusivity of the plate as the meshed plate holes reduce
in diameter. This is, in fact, contrary to expectations, as it is expected that the electrical
resistance to the flow of electrons will increase as the meshed plate hole sizes increase,
because the electrons will be transported through a larger distance in the GDL instead of
the stainless steel plate, but it seems that this loss is compensated by the increase in the
exposed area of the membrane to the reactant gases.
Inlet Diameter = 6 mm Inlet Diameter = 10 mm
Design and Manufacturing of a (PEM) Proton Exchange Membrane Fuel Cell 192
Figure 6-19: Effect of inlet hole diameter variation on the performance of PEM fuel cell,
for perforated hole diameter = 5 mm and Trough height = 2 mm
6.7.4. Effect of Varying Gas Supply/Exit Port Location
The analyses presented earlier provided an insight of the effects of different
geometric parameter variations on the overall performance of the fuel cell. For all these
analyses; inlet and outlet holes for reactant gases (Air and Hydrogen) were assumed at
the centre of the gas flow channel, the distance between the inlet and outlet ports are the
shortest in this case. Analyses of flow behaviour in this case showed that the reactant
species did not cover the maximum area of the fuel cell domain, as they followed the
shortest possible path.
In this section, the effects of the locations of inlet and outlet holes on the overall
performance of the fuel cell will be investigated. For this purpose two configurations
were taken into consideration; in the first case both the inlet and outlet were assumed at
the centres of the gas channel domains, while in the second case; they were diagonally
opposed with counter- flows at the cathode and anode.
Design and Manufacturing of a (PEM) Proton Exchange Membrane Fuel Cell 193
Figure (6-20) illustrates the oxygen mole fraction distribution at the cathode
side of the fuel cell in both cases. It is observed that the distribution of the reactant gas
is improved and is more uniform in the case of the diagonally opposed supply ports.
Furthermore, water condensate is more likely to accumulate around the remote corners
in the case of the centrally located holes due to the poor oxygen flow in these regions,
which will result in an increase in concentration losses, as the gases will not be able to
reach the reaction sites due to the presence of water.
Residence time of the gases is shorter in the case of centre holes, which has a
negative influence on performance, but this is counterbalanced by the improvement in
water removal due to the high velocity of flow as compared to the diagonally opposed
supply ports.
Figure 6-20: Effect of Inlet/Outlet hole locations on oxygen mole fraction distribution
Comparing the polarisation curves for both cases, figure (6-21), it is observed
that the change in the supply port locations did not affect the activation and Ohmic
regions of the polarisation curves. However, it is noted that the limiting current density
tends to occur much earlier in the case of centre ports as compared to the diagonally
opposed ports. This is attributed to the accumulation of water in the fuel cell domain in
areas which are poorly covered with the flow of air especially in the case of the central
supply port location. At this current density the performance of the fuel cell starts to
Diagonally opposed gas ports Centre-line gas ports
Design and Manufacturing of a (PEM) Proton Exchange Membrane Fuel Cell 194
drop due to mass transfer limitations resulting from the presence of water in the fuel
cell.
This is a very important point which was considered in the final design of the
fuel cell so as to optimise the performance. The gas supply ports were offset from the
centre of the active area in opposite directions, in the final design of the fuel cell
presented earlier in chapter 4 of this report, so as to enhance better distribution of
reactant gases.
Figure 6-21: Effect of inlet and outlet holes locations on PEM fuel cell performance for perforated
hole diameter = 5 mm, Trough height = 2 mm, Inlet and outlet diameter = 6 mm. concentration
losses start to be observed at 0.3 A/ cm2 current density in the case of the central holes.
Design and Manufacturing of a (PEM) Proton Exchange Membrane Fuel Cell 195
6.8. COMPARISON OF FUEL CELL PERFORMANCE TO PUBLISHED
FUEL CELL DATA
A detailed comparison with experimental results from the literature can only be
made on a qualitative basis, since the exact operating conditions of the various
experiments are not fully reported and it is quite certain that the design conditions are
different.
In figure (6-22), experimentally obtained polarization curves by Kim et al. [69]
are reproduced. The experiments were conducted with pure hydrogen at the anode side
and air at the cathode side. It is fair to assume that the results were obtained from a fuel
cell of a conventional design based on graphite plate electrodes and Nafion® membranes
without detailed specifications.
Figure 6-22 Experimentally obtained polarization curves for various cathode side pressures at a
temperature of 343K and a stoichiometric flow ratio of (1.5). The experiments were conducted with
pure hydrogen at the anode side and air at the cathode side, the exact details of the experiments
such as the cell geometry are not known [20, 69]
Design and Manufacturing of a (PEM) Proton Exchange Membrane Fuel Cell 196
Comparing the results presented earlier for the fuel cell design proposed in this
study to the fuel cell performance reported by Kim et al.[69], the general behaviour of
the two fuel cells is similar as far as the gradual decrease in performance with current
density is concerned; the three regions of the fuel cell characteristic curves, namely;
activation, Ohmic and concentration losses regions are observed in both cases.
The OCV in the case of the proposed fuel cell is higher than the one reported by
Kim et al. It was discussed earlier that the open circuit voltage that is established at the
platinum electrode in an oxygen containing environment has been shown to be a mixed
potential. The mixed potential is set up due to the simultaneous occurrence of the
oxygen reduction reaction (ORR) and the process of platinum oxidation. Impurity
oxidation may also contribute to the observed OCV, which could have been the case in
the published experimental results and resulted in reducing the OCV [67].
The activation overvoltage is not as sharp in the published results, the reasons
for the sharp drop in potential due to activation has been discussed thoroughly
elsewhere, and it is clear from this comparison that it is the major drawback in the
proposed fuel cell performance.
However, qualitative agreement between the performance of the proposed fuel cell
design and published experimental results indicates that the proposed design with the
necessary improvement on the basis of optimization is feasible for industrial
implementation.
Design and Manufacturing of a (PEM) Proton Exchange Membrane Fuel Cell 197
Chapter 7 CONCLUSIONS AND RECOMMENDATIONS FOR
FURTHER WORK
7.1. CONCLUSIONS
A novel fuel cell design with a new approach in design methodology has been
presented in this work. Two major components of the fuel cell; namely; the electrode
plates and the channel troughs have been redesigned and manufactured, together with a
test apparatus and gas conditioning unit equipped with a data acquisition system to
facilitate testing the performance of the new fuel cell design and to compare the
performance to conventional fuel cell design and published fuel cell experimental data.
The theoretical background including a mathematical model of the fuel cell
performance has been developed and used in a LabView® application to simulate fuel
cell performances and to be used as a curve fitting model for the experimental results.
The mathematical model was developed to perform a parametric study of fuel cell
performance under various operating conditions such as temperature, pressure and
reactant gas volume.
For the first time; the effects of irreversibilities on fuel cell behaviour is
presented using a mathematical argument involving the polytropic index. Furthermore,
a comprehensive formula for the efficiency of the fuel cell based on interpolated values
of the main parameters affecting the performance of the fuel cell and incorporating the
internal current effects which are usually ignored in most of the published work has
been developed and presented in this thesis.
In order to optimise the proposed design, a computational modelling and
simulation study using CFD techniques has been carried out to test the validity of this
technique and to improve the performance of the fuel cell by varying different
geometric parameters such as meshed plate hole diameter, shape, location of inlet and
outlet-hole diameters for the reactant gases and gas channel (trough) height.
Design and Manufacturing of a (PEM) Proton Exchange Membrane Fuel Cell 198
A three dimensional (3D) fully coupled numerical model was used, which
resolved coupled transport phenomena of PEM fuel cell and accounted for voltage
losses at the catalyst layer as well as convention and diffusion of different species in the
channels and in the porous gas diffusion layer (GDL). The model was solved using a
commercial multi-physics numerical solver ‘COMSOL version 3.4’.
The results of the experiments and the numerical studies indicated the potential
of the new fuel cell design for practical implementation, and for considerable reductions
in fuel cell cost.
The following conclusions have been drawn through this exercise:
1. There is considerable potential for the improvement of the fuel cell design to
reduce the cost and improve the performance through the use of common
materials and design techniques.
2. The modular design presented in this thesis presents a simple fuel cell design
which reduces the cost of production and compares to the performance of the
state of the art fuel cells.
3. The trough size is an important design parameter as it reflects on the water
management and gas distribution issues in the fuel cell operation. The 5 mm
trough proved to be more effective in maintaining good performance of the fuel
cell due to its moderate flow velocity convenient for water management, and its
suitability for maintaining high power density of the fuel cell.
4. The mesh size selection has to compromise between two major parameters:
maximising the area of the membrane exposed to reactant gases so as to promote
the reaction and enhance water removal from the fuel cell and to provide enough
support and current collector along the surface of the membrane. The 5 mm
diameter hole meshed plate was found better than other meshed plates used in
this study to satisfy both requirements; however, more investigations are
required to find the best configuration of the electrode material.
5. The numerical modelling and simulation study revealed the following important
findings:
Design and Manufacturing of a (PEM) Proton Exchange Membrane Fuel Cell 199
• Increase in perforated hole diameter improves the performance of the
fuel cell due to the increase in the effective surface area of the fuel cell covered
by reactant species, which leads to an improvement in the electrochemical
reaction and reduction in water flooding in the fuel cell domain.
• Increase in perforated holes diameter reduces the frictional losses to flow
when passing through the perforated holes due to the reduction in side wall shear
stress, which results in less friction to flow passing through the holes, and hence
reduces Ohmic losses in the fuel cell.
• Increase in gas channel (trough) height affects the wall shear stresses in
the gas channel domain and consequently affects the performance of the fuel
cell. With the increase of gas channel height; the residence time of flow in the
gas channel decreases which increases the convective flux and reduces the
diffusive flux. Furthermore, it reduces the potential for water removal from the
fuel cell and leads to a decrease in fuel cell performance.
• Increase in inlet holes diameter of PEM fuel cell increases the effective
mass flow rate, which leads to an increase in fuel cell performance.
• Change in inlet/outlet holes location from centre to opposite corners with
counter flow of reactant gases improves the reactant species distribution along
the fuel cell domain and enhances water removal, thus effectively improves the
performance of the fuel cell.
7.2. RECOMMENDATIONS FOR FURTHER WORK
The subject of this thesis ‘Design and manufacturing of a (PEM) fuel cell’ was
an ambitious programme; as the intention originally was to design and manufacture a
full scale 5kW (PEM) fuel cell for stationary application with the aim of acquiring the
technology of making a full scale fuel cell including the polymer electrolyte, the catalyst
layer, electrodes and gas distributors. The ultimate aim of the programme was to acquire
the technology of making a fully working fuel cell and understanding the mechanism of
performance loss and ways to decreasing these losses.
Design and Manufacturing of a (PEM) Proton Exchange Membrane Fuel Cell 200
A good deal of work has been spent in the area of designing and synthesising a
polymer electrolyte membrane based on polyimide materials and the synthesis of a
platinum catalyst, but as the work progressed it became clear that the proposed
programme was beyond the scope of this study because the membrane science is a
complex issue by itself, and the work on the catalyst needs more resources and
dedication.
In view of these limitations this research programme had to be modified without
significantly altering its objective or scope. The emphasis was then shifted to the design
and manufacturing of a 100W modular fuel cell which can be used as a building block
for a larger fuel cell stack for stationary applications; with focus on understanding the
factors affecting the performance and reliability of the (PEM) fuel cell.
Therefore, it is felt that further research is still needed to carry the fuel cell
research started in this thesis forward, the following suggestions point out areas of
possible research:
1. The fuel cell electrodes chosen in this study were SS316 stainless steel
meshed plates. The performance of the fuel cell did not compare to fuel
cell results reported in the open literature. Further work has to be
performed to improve the material used either by the use of different
coating materials or by using different material alloys which can
withstand the acidic environment of the fuel cell and maintain an
electrical conductivity higher than the conductivity of graphite.
2. Understanding the physics of voltage losses in the fuel cell and the
mechanisms which cause these losses to occur is very necessary to
improve fuel cell performance. Hence, the use of advanced
electrochemical techniques to determine the electrochemical behaviour
of the fuel cell such as: cyclic voltammograms (CV) used to determine
the active surface area of the membrane, and other electrochemical
diagnostic tools are very important and recommended in further research
work.
Design and Manufacturing of a (PEM) Proton Exchange Membrane Fuel Cell 201
3. Fuel cell testing is very crucial in the development of fuel cells; hence
special attention should be paid to the development of testing techniques
and facilities. The fuel cell test unit built through this project offers a
good base for fuel cell testing equipment and should be tackled as a
dedicated project to develop a comprehensive test station. Special
attention has to be paid to flow measurement as the potential users of the
fuel cell would be interested to know the actual cost of using a fuel cell
in terms of fuel input and power output.
4. The polyimide membrane offers a good candidate for fuel cell
application. It has the potential to reduce cost and simplify the design of
the fuel cell by operating at temperatures higher than 100°C. The work
started in this research on the membrane did not reach a mature stage and
more optimisation and characterisation work still needs to be done.
5. The numerical modelling and simulation study developed for present
research and described in this thesis presents a good start for a more
reliable and advanced simulation study of fuel cell performance.
Design and Manufacturing of a (PEM) Proton Exchange Membrane Fuel Cell 202
References
1. Energy Information Administration, World Marketed Energy Use by Fuel Type, 1980-2030 website :http://www.eia.doe.gov/oiaf/ieo/highlights.html. [Cited 04.05.09] in International Energy Annual 2005.
2. Bhinder, F.S., et al., Parametric Study of the Combined Fuel Cell-Gas Turbine Power Plant. ASME Conference Proceedings, 2006. 2006 (42398): p. 703-711.
3. National Sunflower Association. SUNFLOWER WEEK IN REVIEW. 2009 [cited 18 May 2009]; Available from: www.sunflowernsa.com.
4. Hadjipaschalis, I., A. Poullikkas, and V. Efthimiou, Overview of current and future energy storage technologies for electric power applications. Renewable and Sustainable Energy Reviews, 2009. 13(6-7): p. 1513-1522.
5. Nikam, V.V. and R.G. Reddy, Copper alloy bipolar plates for polymer electrolyte membrane fuel cell. Electrochimica Acta, 2006. 51(28): p. 6338-6345.
6. S. Mandal, P.S., D. Roy, R. Chaudhari, M. Sastry, A new method for the synthesis of hydrophobized, catalytically active Pt nanoparticles. Chem. Commun., 2002. 24: p. 3002-3003.
7. Wilson M. S., V.J.A., Gottesfeld Sh., Low Platinum Loading Electrodes for Polymer Electrolyte Fuel Cells Fabricated Using Thermoplastic Ionomers. Electrochemica Acta, 1995. 40(3): p. 355-363.
8. Genies, C., et al., Soluble sulfonated naphthalenic polyimides as materials for proton exchange membranes. Polymer, 2001. 42(2): p. 359-373.
9. Gunduz, N., Synthesis and Characterization of Sulfonated Polyimides as Proton Exchange Membranes for Fuel Cells. 2001, Virginia Polytechnic Institute and State University: Blacksburg. p. 311.
12. Kordesch, K. and G. Simader, Fuel cells and their applications. 1996, Deerfield Beach, FL: VCH.
13. Fuel Cell Bus Club. 2008 [Cited 2008 14 May 2008]; Available from: http://www.fuel-cell-bus-club.com/index.php?module=pagesetter&func=viewpub&tid=1&pid=158.
14. The Register. Fuel Cell Demonstrator Airplane. 2008. UK.
15. Wang, L., et al., A parametric study of PEM fuel cell performances. International Journal of Hydrogen Energy, 2003. 28 (11): p. 1263-1272.
16. Balkin, A.R., Modelling A 500w Polymer Electrolyte Membrane Fuel Cell, in Faculty of Engineering. 2002, University of Technology: Sydney.
Design and Manufacturing of a (PEM) Proton Exchange Membrane Fuel Cell 203
17. J. Larmine, A.D., Fuel Cell Systems Explained. 2 ed. Vol. 1. 2003, Chichester: John Wiley & Sons Ltd.
18. Kumar, A. and R.G. Reddy, Effect of channel dimensions and shape in the flow-field distributor on the performance of polymer electrolyte membrane fuel cells. Journal of Power Sources, 2003. 113 p. 11-18.
19. Janssen, G.J.M. and M.L.J. Overvelde, Water transport in the proton-exchange-membrane fuel cell: measurements of the effective drag coefficient. Journal of Power Sources, 2001. 101 (1): p. 117-125.
20. Berning, T. and N. Djilali, Three-dimensional computational analysis of transport phenomena in a PEM fuel cell--a parametric study. Journal of Power Sources, 2003. 124 (2): p. 440-452.
21. Wakizoe, M., O.A. Velev, and S. Srinivasan, Analysis of proton exchange membrane fuel cell performance with alternate membranes. Electrochimica Acta, 1995. 40 (3): p. 335-344.
22. efunda. [cited 18.05.09]; Available from: http://www.efunda.com/glossary/units/units--electric_conductivity--siemens_per_centimeter.cfm.
23. Savadogo, O., Emerging membranes for electrochemical systems: Part II. High temperature composite membranes for polymer electrolyte fuel cell (PEFC) applications. Journal of Power Sources, 2004. 127 (1-2): p. 135-161.
24. Faure S., Sulphonated polyimides, membranes and fuel cell 2001, Centre National de la Recherche Scientifique (Paris Cedex, FR): USA.
25. Mehta, V. and J.S. Cooper, Review and analysis of PEM fuel cell design and manufacturing. Journal of Power Sources, 2003. 114 (1): p. 32-53.
26. A. K. Shukla, et al., A 5 W liquid-feed solid polymer electrolyte direct methanol fuel cell stack with stainless steel. Applied Electrochemistry, 1999. 29 p. 120-132.
27. E. Atonolini, et al., Physical and morphological characteristics and electrochemical behaviour in PEM fuel cells of PtRu/C catalysts. J Solid State Electrochem, 2001. 5: p. 131-140.
28. Mandal, S., et al., A new method for the synthesis of hydrophobized, catalytically active Pt nanoparticles. Chem. Commun., 2002. 24: p. 3002-3003.
29. Zhang, Y.J., et al., Synthesis and characterization of carbon black supported Pt-Ru alloy as a model catalyst for fuel cells. Catalysis Today, 2004. 93-95: p. 619-626.
30. Andreaus, B., et al. (2003) Investigation Of Gas Diffusion Layers Of Polymer Electrolyte Fuel Cells By X-Ray Tomographic Microscopy. Paul Scherer Institute Scientific Report 2003 Volume VII Volume,
31. Wikipedia. [Cited 18.05.09]; Available from: http://en.wikipedia.org/wiki/Anisotropy.
Design and Manufacturing of a (PEM) Proton Exchange Membrane Fuel Cell 204
32. Djilali, N. and B.R. Sivertsena, Computational modelling of polymer electrolyte membrane (PEM) fuel cells: Challenges and opportunities. Energy, 2007. 32: p. 269-280.
33. Mathias, M., et al., Diffusion media materials and characterisation, in Handbook of Fuel Cells – Fundamentals, Technology and Applications, W. Vielstich, H.A. Gasteiger, and A. Lamm, Editors. 2003 John Wiley & Sons, Ltd.: London. p. 517-537.
34. Zhang, F.Y., S.G. Advani, and A.K. Prasad, Performance of a metallic gas diffusion layer for PEM fuel cells. Journal of Power Sources, 2008. 176 (1): p. 293-298.
35. Moreira, J., et al., Dependence of PEM fuel cell performance on the configuration of the gas diffusion electrodes. Journal of new material systems, 2002. 5: p. 173-175
36. Li, X. and I. Sabir, Review of bipolar plates in PEM fuel cells: Flow-field designs. International Journal of Hydrogen Energy, 2005. 30 (4): p. 359 - 371.
37. Kumar, A. and R.G. Reddy, Materials and design development for bipolar/end plates in fuel cells. Journal of Power Sources,, 2004. 129 (1): p. 62-67.
38. Tawfik, H., Y. Hung, and D. Mahajan, Metal bipolar plates for PEM fuel cell--A review. Journal of Power Sources, 2007. 163 (2): p. 755-767.
39. Wang, H. and J.A. Turner, Ferritic stainless steels as bipolar plate material for polymer electrolyte membrane fuel cells. Journal of Power Sources, 2004. 128 (2): p. 193-200.
40. Wang, H., M.A. Sweikart, and J.A. Turner, Stainless steel as bipolar plate material for polymer electrolyte membrane fuel cells. Journal of Power Sources, 2003. 115 (2): p. 243-251.
41. T.V. Nguyen and M.W. Knobbe, A liquid water management strategy for PEM fuel cell stacks,. J. Power Sources, 2003. 114 p. 70-79.
42. Staschewski, D. and Z.M, Hydrogen- Air PEMFC operation with extraordinarily low gas pressures and internal humidification, conception and experimental prototype stack. International Journal of Hydrogen Energy, 1999. 24: p. 543-548.
43. F.Liu, et al., Development of novel self humidifying composite membranes for fuel cells. Journal of Power Sources 2003. 124 p. 81-89.
44. Murphy, O., G. Duncan, and D. Manko, High power density proton exchange membrane fuel cells. Journal of power sources, 1994. 47: p. 353-368.
45. H.H. Voss, et al., Anode water removal: A water management and diagnostic technique for solid polymer fuel cells. Electrochemica Acta, 1995. 40 (3): p. 321-328.
46. Mennola, T., et al., Water balance in a free-breathing polymer electrolyte membrane fuel cell. Journal of Applied Electrochemistry, 2004. 34 p. 31-36.
Design and Manufacturing of a (PEM) Proton Exchange Membrane Fuel Cell 205
47. Santarelli, M.G. and M.F. Torchio, Experimental analysis of the effects of the operating variables on the performance of a single PEMFC. Energy Conversion and Management, 2007. 48 (1): p. 40-51.
48. Lin, P.-C., B.Y. Park, and M.J. Madou, Development and characterization of a miniature PEM fuel cell stack with carbon bipolar plates. Journal of Power Sources, 2008. 176 (1): p. 207-214.
49. Tori, C., et al., Advances in the development of a hydrogen/oxygen PEM fuel cell stack. International Journal of Hydrogen Energy, 2008. 33 (13): p. 3588-3591.
50. Cheddie, D. and N. Munroe, Review and comparison of approaches to proton exchange membrane fuel cell modelling. Journal of power sources, 2005. 147 (1-2): p. 72-84.
51. Baschuk, J.J. and X. Li, Modelling CO poisoning and O2 bleeding in a PEM fuel cell anode. International Journal of Energy Research, 2003. 27: p. 1095-1116.
52. J. Amphlett, et al., Performance Modelling of the Ballard Mark IV Solid Polymer Electrolyte Fuel Cell: I. Mechanistic Model Development. J. Electrochem. Soc., 1995. 142 (1).
53. Mann, R.F., et al., Development and application of a generalised steady-state electrochemical model for a PEM fuel cell. Journal of Power Sources, 2000. 86(1-2): p. 173-180.
54. AL-Baghdadi, M.A.R.S. and H.A.K.S. AL-Janabi, Optimization Study of Proton Exchange Membrane Fuel Cell Performance. Turkish J. Eng. Env. Sci., 2005. 29: p. 235-240.
55. Al-Baghdadi and M.A.R. Sadiq, Modelling of proton exchange membrane fuel cell performance based on semi-empirical equations. Renewable Energy, 2005. 30 (10): p. 1587-1599.
56. Bernardi, D.M. and M.W. Vebrunge, A mathematical model of the solidpolymer electrolyte fuel cell. J. Electrochem. Soc., 1992. 139 p. 2477-2491.
57. Springer, T.E. and S. Gottesfeld, Polymer electrolyte fuel cell model. J. Electrochem. Soc., 1991. 138 (8): p. 2334-2342.
58. Érdi, P. and J. Tóth , Mathematical models of chemical reactions: theory and applications of deterministic and stochastic models . 1989, Manchester Manchester University Press ND .
59. R Bradean, K Promislow , and B Wetton, Transport phenomena in the porous cathode of a proton exchange membrane fuel cell,". Numerical Heat Transfer, Part A,, 2002. 42 (2002): p. 121-138.
60. Gurau, V., H.L., and S. Kakac, Two-dimensional model for proton exchange membrane fuel cells,. AIChE J, 1998. 44 (11): p. 2410-2422.
Design and Manufacturing of a (PEM) Proton Exchange Membrane Fuel Cell 206
61. Coppo, M., N.P. Siegel, and M.R.v. Spakovsky, On the influence of temperature on PEM fuel cell operation. Journal of Power Sources, 2006. 159 (1): p. 560-569.
62. Jung, C.-Y., C.-S. Lee, and S.-C. Yi, Computational analysis of transport phenomena in proton exchange membrane for polymer electrolyte fuel cells. Journal of Membrane Science, 2008. 309 (1-2): p. 1-6.
63. Wang, C.Y., Fundamental Models of Fuel cell Engineering. Chem. Rev., 2004. 104: p. 4727-4766.
64. Bhinder, F.S., Design Parameters of a Centripetal Gas Turbine in Non-Steady Flow, in Faculty of Engineering. 1974, University of London: London. p. 319.
65. Berger, C., Handbook of Fuel Cell Technology. 1 ed. 1968, Englewood Cliffs, New Jersey: Printice-Hall, Inc. 607.
66. Williams, K.R., An Introduction to Fuel Cells. 1966, London: Elsevier Publishing company.
67. Parthasarathy, A., et al., Temperature Dependence of the Electrode Kinetics of Oxygen Reduction at the Platinum/Nafion[registered sign] Interface---A Microelectrode Investigation. Journal of The Electrochemical Society, 1992. 139 (9): p. 2530-2537.
68. Hughes, E., Electrical Technology. 5th ed. 1981: Longman Group Ltd.
69. Kim, J., et al., Modelling of proton exchange membrane fuel cell performance with an empirical equation. J. Electrochem. Soc., 1995. 142 (8): p. 2670-2674.
70. Bevers, D., et al., Simulation of a polymer electrolyte fuel cell electrode. J. Appl. Electrochem, 1997 27: p. 1254-1264.
71. Nikam, V.V., et al., Corrosion resistant low temperature carburized SS 316 as bipolar plate material for PEMFC application. Electrochimica Acta, 2008. 53 (6): p. 2743-2750.
72. Arthur D. Little, I., Report to Department of Energy, Cost Analysis of Fuel Cell System for Transportation, Ref. No. 49739, SFAA No. DESC02-8EE50526,. 2001.
73. Padhy, B.R. and R.G. Reddy, Performance of DMFC with SS 316 bipolar/end plates. Journal of Power Sources, 2006. 153 p. 125-129.
74. Williams, P.C. and S.R. Collins, Mechanical design using low-temperature carburization. JOM Journal of the Minerals, Metals and Materials Society, 2008. 60 (12 ): p. 27-30.
75. Open University, T881 Manufacture Materials Design: Block 1: The design activity model. 2001, Milton Keynes: The Open University.
76. Einsla, B.R., High temperature polymers for proton exchange membrane fuel cells, in Macromolecular science and engineering. 2005, Virginia Polytechnic Institute and state University: Blacksburg. p. 291.
Design and Manufacturing of a (PEM) Proton Exchange Membrane Fuel Cell 207
77. Khandelwal, M. and M.M. Mench, Direct measurement of through-plane thermal conductivity and contact resistance in fuel cell materials. Journal of Power Sources, 2006. 161 (2): p. 1106-1115.
78. Incropera, F.P. and D.P.D. Witt, Fundamentals of Heat and Mass Transfer, ed. 3. 1990: John Wlley and Sons.
79. Gasteiger, H.A., J.E. Panels, and S.G. Yan, Dependence of PEM fuel cell performance on catalyst loading. Journal of Power Sources, 2004. 127 p. 162-171.
80. Wahdame, B., et al., Design of experiment techniques for fuel cell characterisation and development. International Journal of Hydrogen Energy, 2008. 1 (14).
81. Weber, A.Z. and J. Newman, Modeling Transport in Polymer-Electrolyte Fuel Cells. Chem. Rev., 2004. 104: p. 4679-4726.
82. Sadiq Al-Baghdadi, M.A.R. and H.A.K. Shahad Al-Janabi, Parametric and optimization study of a PEM fuel cell performance using three-dimensional computational fluid dynamics model. Renewable Energy, 2007. 32 (7): p. 1077-1101.
83. Chen, F., M.H. Chang, and C.F. Fang, Analysis of Water Transport in a Five Layer Model of PEMFC. jounal of Power source, 2007. 164: p. 649-658.
84. Motupally, S., A.J. Becker, and J.W. Weidner, Diffusion of water in Nafion 115 membranes. J. Electrochem. Soc., 2000. 147 (9): p. 3171.
85. Guvelioglu, G.H. and H.G. Stenger, Computational fluid dynamics modelling of polymer electrolyte membrane fuel cells. Journal of Power Sources, 2005. 147: p. 95-106.
86. Nguyen, P.T., T. Berning, and N. Djilali, Computational model of a PEM fuel cell with serpentine gas flow channels. Journal of Power Sources, 2004. 130(1-2): p. 149-157.
Design and Manufacturing of a (PEM) Proton Exchange Membrane Fuel Cell 208
Bibliography
1. Baird, et al., Polymer electrolyte membrane fuel cells: opportunities for polymers and composites. 2003: Virginia Tech. Plastics Engineering.
2. Berger, C., Handbook of Fuel Cell Technology. 1 ed. 1968, Englewood Cliffs, New Jersey: Printice-Hall, Inc. 607.
3. Brady, J. and G. Humiston, General Chemistry, Principles and Structure. 3rd edition ed. 1982: John Wiley & Sons.
4. Érdi, P. and J. Tóth , Mathematical models of chemical reactions: theory and applications of deterministic and stochastic models . 1989, Manchester Manchester University Press ND .
6. Hughes, E., Electrical Technology. 5th ed. 1981: Longman Group Ltd.
7. Incropera, F.P. and D.P.D. Witt, Fundamentals of Heat and Mass Transfer, ed. 3. 1990: John Wlley and Sons.
8. J. Larmine, A.D., Fuel Cell Systems Explained. 2 ed. Vol. 1. 2003, Chichester: John Wiley & Sons Ltd.
9. Kordesch, K. and G. Simader, Fuel cells and their applications. 1996, Deerfield Beach, FL: VCH.
10. Mathias, M., et al., Diffusion media materials and characterisation, in Handbook of Fuel Cells – Fundamentals, Technology and Applications, W. Vielstich, H.A. Gasteiger, and A. Lamm, Editors. 2003 John Wiley & Sons, Ltd.: London. p. 517-537.
11. Vielstich, W., A. Lamm, and H. Gasteiger, Handbook of fuel cells - fundamentals, technology and applications Vol. 4. 2003: John Wiley & Sons.
12. Williams, K.R., An Introduction to Fuel Cells. 1966, London: Elsevier Publishing company.
13. Berlowitz, P.J. and C.P. Darnell, Fuel Choices for Fuel Cell Powered Vehicles. 2000, New York: Society of Automotive Engineers.
14. Blomen, L. and M. Mugerwa, Fuel Cell Systems. 1993: Plenum Press.
15. Liebhafsky, H.A. and E.J. Cairns, Fuel Cells and Fuel Batteries, A guide to their Research and Development. 1968, New York: John Wiley & Sons, Inc.
Design and Manufacturing of a (PEM) Proton Exchange Membrane Fuel Cell 209
Appendix A: Thermodynamics of the Electrochemical
Energy Conversion
Design and Manufacturing of a (PEM) Proton Exchange Membrane Fuel Cell 210
Thermodynamics of the Electrochemical Energy
Conversion
For a better understanding of the main factors influencing the fuel cell
performance, it is necessary to understand the thermodynamics of the electrochemical
energy conversion and the main factors involved in this process.
The main factor determining the performance of the fuel cell is the electrical
work that can be obtained from the fuel cell. Hence, it is important to find the
relationship between chemical energy content of the fuel that would be released as a
result of an electrochemical reaction, in order to determine the maximum electrical
energy that can be extracted from a chemical system.
• The Second Law of Thermodynamics
The second law of thermodynamics provides us with a way of comparing the
effects of the two driving forces involved in a spontaneous process, namely; changes in
energy and changes in entropy.
One statement of the second law is that: “In any spontaneous process there is
always an increase in the entropy of the universe ( 0totalSΔ ≥ ); this increase takes into
account entropy changes in both the system and its surroundings”:
total system surroundingsS S SΔ = Δ + Δ (A- 1)
The entropy change that occurs in the surroundings is brought about by the heat
added to the surroundings divided by the temperature at which it is transferred. For a
process at constant Pressure (P) and temperature (T), the heat added to the surroundings
is equal to the negative of the heat added to the system, which is given by ‘ systemHΔ ’;
thus:
surroundings systemQ H= − Δ (A- 2)
Where ‘Q’ is the Heat added to the system.
The entropy change for the surroundings is therefore:
Design and Manufacturing of a (PEM) Proton Exchange Membrane Fuel Cell 211
system
surroundings
HS
TΔ
Δ = − (A- 3)
And the total entropy change is:
systemtotal system
HS S
TΔ
Δ = Δ − (A- 4)
Or
( ) = system system
total
T S HS
TΔ − Δ
Δ (A- 5)
This can be rearranged to give:
( ) = total system systemT S T S HΔ Δ − Δ (A- 6)
For a spontaneous change to take place, ‘ totalSΔ ’ must be a positive number (the
second law of thermodynamics), whence, the product ‘ totalT SΔ ’ must also be positive.
Thus, for a spontaneous change to take place, the expression ( system systemH T SΔ − Δ )
must be negative.
At this point it is convenient to introduce the thermodynamic state function
called the Gibbs free energy (G), which is defined as:
G H TS= − (A- 7)
For a change at constant temperature; ‘T’ and Pressure ‘P’, we write:
,T PG H T SΔ = Δ − Δ (A- 8)
From this argument, we see that ‘ GΔ ’ must be less than zero for a spontaneous
process at constant temperature and pressure (STP). The above and the following
equations are derived on the basis of this assumption; hence it is expected to find some
departure of the measured values from the theoretical values when experimental work is
carried out.
The Gibbs free energy represents a composite of the two factors contributing to
spontaneity, ‘ HΔ ’ and ‘ SΔ ’. For systems in which ‘ HΔ ’ is negative (exothermic
Design and Manufacturing of a (PEM) Proton Exchange Membrane Fuel Cell 212
reactions in which heat is emitted) and ‘ SΔ ’ is positive, both factors favour spontaneity
and the process will occur spontaneously at all temperatures. In this case; ( , 0T PGΔ ≤ ),
at constant temperature and pressure, with ( , 0T PGΔ = ) at equilibrium.
Physically interpreted, the Gibbs free energy of the system decreases during any
spontaneous process at constant temperature and pressure, until equilibrium is achieved
and the process can continue no further. The equation therefore allows us to calculate
both the direction and the end point of a physical or chemical change within the system,
but it does not tell us anything about the rate at which the change occurs.
Conversely, if ‘ HΔ ’ is positive (in the case of endothermic reactions in which
heat is absorbed by the reaction) and ‘ SΔ ’ is negative (increase in order), ‘ GΔ ’ will
always be positive and the change cannot occur spontaneously at any temperature.
In situations where ‘ HΔ ’ and ‘ SΔ ’ are both positive, or both negative,
Equation (A-8) shows that temperature plays the determining role in controlling
whether or not a reaction will take place. In the first case ( HΔ and 0SΔ > ), , T PGΔ will
be negative only at high temperatures, where ‘T SΔ ’is greater in magnitude than ‘ HΔ ’;
as a consequence, the reaction will be spontaneous only at high temperatures.
When ‘ HΔ ’ and ‘ SΔ ’ are both negative ( HΔ and 0SΔ < ); , T PGΔ will be
negative only at low temperatures [88].
• Equilibrium Potential ( oE )
For an electrochemical reaction where ‘n’ number of electrons participates in the
reaction, the maximum electrical work obtained is related to equilibrium potential as
follows:
oMaximum electrical work nFE= − (A- 9)
Where;
‘n’ = number of electrons participating in the reaction of interest
‘F’ = Faraday’s Constant (96, 473 J/Volts-mol)
Design and Manufacturing of a (PEM) Proton Exchange Membrane Fuel Cell 213
oE = Equilibrium potential (also called the reversible potential or theoretical Open
Circuit Potential or Open Circuit Voltage, i.e. OCP or OCV).
The chemical energy of a system can be expressed in terms of several
thermodynamic quantities including: Enthalpy, Helmholtz free energy and Gibbs free
energy, the chemical energy of interest here is the Gibbs free energy. The molar free
energy change of reaction in terms of Gibbs free energy is related to the maximum
electrical work according to the following relationship:
og nFEΔ = − (A- 10)
Where, ‘ gΔ ’ is Gibbs free energy change for the reaction defined on a (per mole) basis
of one of the reactants.
It is important to emphasize that several forms of the Gibbs free energy for a
given species exist, however, the most commonly used form is the Gibbs free energy of
formation ‘ fgΔ ’. As long as a consistent form of Gibbs free energy and the reference
state are used, the numerical value of ‘∆g’ will be the same.
• Standard Equilibrium Potential ( ooE ):
When the reactants and products exist in the standard states of unit activity at a
given temperature, the equilibrium potential is referred to as standard equilibrium
potential ( ooE ) and related to standard Gibbs free change for the reaction as follows
[17]:
oo og nFEΔ = − (A- 11)
In a fuel cell, the energy released is equal to the change in Gibbs free energy of
formation; this is the arithmetic difference between the Gibbs free energy of the
products and the Gibbs free energy of the inputs or reactants. It is convenient to
consider these quantities in their “per mole” form, usually indicated by an _⎛ ⎞
⎜ ⎟⎝ ⎠
over the
lower case letter. Considering the basic reaction for the hydrogen /oxygen fuel cell:
Design and Manufacturing of a (PEM) Proton Exchange Membrane Fuel Cell 214
2 2 212
H O H O+ → (A- 12)
The product is one mole of 2H O , and the inputs are one mole of ‘ 2H ’ and half a
mole of ‘ 2O ’, hence
22 2
_ _ _ 12f f ff
OH O H
g g g g−⎛ ⎞ ⎛ ⎞ ⎛ ⎞Δ = − − ⎜ ⎟⎜ ⎟ ⎜ ⎟ ⎝ ⎠⎝ ⎠ ⎝ ⎠ (A- 13)
• Effect of Pressure and Temperature on the Equilibrium Potential, oE
The pressure dependence of ‘ oE ’ can be derived from basic thermodynamics by
relating how the Gibbs free energy change for a given reaction varies with pressure
[11].
Considering the equations for the internal energy of the system, together with
Gibbs and Helmholtz free energies and enthalpy. The fundamental thermodynamic
equations in this regard are:
The Internal Energy
The internal energy of a closed system during any physical or chemical process,
from the first law of thermodynamics:
dU dq dw= + (A- 14)
Where dq is the heat added to the system, and dw the work done on the
system, and according to the second law of thermodynamics:
dqdST
≥ (A- 15)
Where; the inequality applies in the case of an irreversible system and the
equality in the case of a reversible system.
In the general case, where the composition can change, it is useful to decompose
the work done on the system into two components:
Design and Manufacturing of a (PEM) Proton Exchange Membrane Fuel Cell 215
exp edw p dV dw= − + (A- 16)
Where ‘ expp dV ’ is the expansion work associated with an incremental change
in the system volume and ‘ edw ’is the remaining work done on the system by its
surroundings, which could be written as:
e i idw dnμ= −∑ (A- 17)
Where:
iμ = chemical potential of component ‘i’ and ‘ in ’ = amount of component ‘i’.
The chemical potential terms will be omitted in the following analysis for
simplicity, and equation (A-16) can be rewritten as:
expdw p dV= − (A- 18)
Now, combining equation (A-14) with equations (A-15) and (A-18), the second
law of thermodynamics for a reversible process can be written as:
TdS dU pdV= + (A- 19)
This can be rearranged to give a general expression for the internal energy as
follows:
dU TdS pdV= − (A- 20)
Gibbs free energy, where:
-G H TS= (A- 21)
And its derivative with respect to ‘S’ and ‘T’ is:
dG dH TdS SdT= − − (A- 22)
Helmholtz Free Energy:
-A U TS= (A- 23)
And its derivative with respect to ‘S’ and ‘T’ is:
Design and Manufacturing of a (PEM) Proton Exchange Membrane Fuel Cell 216
dA dU TdS SdT= − − (A- 24)
Enthalpy:
H U pV= + (A- 25)
And its derivative with respect to ‘p’ and ‘V’ is:
dH dU pdV Vdp= + + (A- 26)
Now substituting equation (A-20) in (A-26) gives:
dH TdS Vdp= + (A- 27)
And substituting equation (A-27) in (A-22) gives:
dG Vdp SdT= − (A- 28)
For an ideal gas, if ‘T’ is constant, the Gibbs energy at one pressure can be
determined with respect to its value at a reference pressure.
To derive a relationship between the Gibbs function and pressure, the ideal gas
equation of state is used, where:
PV nRT= (A- 29)
For an isothermal process ( , : 0)i e dT = , equation (A-28) becomes:
dG Vdp= (A- 30)
Substituting the ideal gas equation (A-29) in equation (A-30):
dPdG nRTP
= (A- 31)
Integrating from state 1 to state 2:
2 2
1 1
dPdG nRTP
=∫ ∫ (A- 32)
Integrating to obtain the Gibbs free energy change for a change in pressure at
constant temperature [89]:
Design and Manufacturing of a (PEM) Proton Exchange Membrane Fuel Cell 217
22 1
1
ln PG G nRTP
⎛ ⎞− = ⎜ ⎟
⎝ ⎠ (A- 33)
If state 1 is replaced by a standard reference state, ‘ oG ’ and a reference pressure
‘ oP ’, the change in Gibbs energy is:
22 lno
o
PG G nRTP
⎛ ⎞= + ⎜ ⎟⎜ ⎟
⎝ ⎠ (A- 34)
Or, in the molar form (kJ/mol):
_ _2
2 lno
o
Pg g RTP
⎛ ⎞= + ⎜ ⎟⎜ ⎟
⎝ ⎠ (A- 35)
Equation (A-35) clearly shows the dependence of the Gibbs free energy on
pressure and temperature. More light is shed on the dependence of Gibbs free energy on
pressure and concentration when discussing the Nernst equation in chapter 3 of this
thesis.
Design and Manufacturing of a (PEM) Proton Exchange Membrane Fuel Cell 218
Appendix B: Matlab® Code for Plotting the Polarisation
Curve
Design and Manufacturing of a (PEM) Proton Exchange Membrane Fuel Cell 219
Matlab® Code for Plotting the Polarisation Curve
% Theoretical voltage of the fuel cell is given by E=-delta g/2*F (electrical work
%done=Charge *Voltage) delta g for hydrogen oxidation where the product water is
liquid at temperature 80oC = -228.2 kJ/mole
% Activation voltage losses are given by the equation delta V=
%R*T/(2*alfa*F)*ln(i/io)
% Voltage losses due to fuel cross over can be accounted for using the same equation
%by adding 3 mA/cm2 to i [17]
% Ohmic losses are represented by VOhmic=-i*r (r=3e-5 kOhm/cm2 in this example).
% Concentration losses are represented by Vconc=R*T/(2*F)*ln(1-i/il) where il is the %
%limiting current.
% Exchange current density io=50 mA/cm2 taken from (table 3.1 Larmine) [17] for
platinum %electrode. In this programme the constant values are defined and graph is
plotted for %Voltage vs. current density
F=96485; % Faradays Constant in Coulomb/mole
R=8.31; % Universal Gas constant in J/K/Mole
alfa=0.5; % Charge transfer coefficient, electrical energy harnessed in changing the rate
%of the reaction
io=50; il=2000; % mA/cm2 the limiting current density
r=3e-5; % Resistances in the fuel cell in kOhm/cm2