Page 1
Design and manufacturing of SLM printed tooling for plastic injection molding
PAPER WITHIN Product Development and Materials Engineering
AUTHOR: Ting Huang, Daniel Nordqvist
TUTOR: Roland Stolt
JÖNKÖPING May 2021
Page 2
Postadress: Besöksadress: Telefon:
Box 1026 Gjuterigatan 5 036-10 10 00 (vx)
551 11 Jönköping
This exam work has been carried out at the School of Engineering in Jönköping
in the subject area Product development and materials engineering. The work
is a part of the Master of Science programme in Product Development and
Materials Engineering. The authors take full responsibility for opinions,
conclusions and findings presented.
Examiner: Marisol Rico Cortez
Supervisor: Roland Stolt
Scope: 30 credits (second cycle)
Date:2021/05/25
Page 3
Abstract
1
Abstract
The thesis work is to show that the use of SLM (Additive Manufacturing) compared
with the traditional process to make injection molds will have advantages in design,
especially in waterways.
This thesis work gives seven different versions of design applied to the SLM method
to analyze and compare them in Solidworks® and Moldflow® to figure out what
design is suitable for the SLM method.
Through analysis of different versions, the finding of this thesis work is that the
conformal waterway of design and lighter but stead structure in the SLM method
causes the SLM molds' cooling performance to be almost 15% better than the
conventional way and shorten the production time by 18% per product.
Based on the advantages of the SLM method in cooling system design and structure
optimization, the company can use the SLM method in the production process to
improve economic and environmental benefits.
Keywords
Additive manufacturing, SLM method, Solidworks, Moldflow, conformal waterway
Page 4
Summary
2
Summary
In terms of manufacturing injection molds, Additive Manufacturing (AM) has
amazing potential, compared with traditional methods, and has more advantages,
such as cavity temperature balance, shortening the molding cycle, designing the
mold structure more flexible, and reducing manufacturing costs.
Plastsystem AB is an injection mold company. The company wants to know about
SLM printing molds for injection molding. So, they asked us to work together to
make the core part of the mold with SLM printing and then test its performance.
The SLM method is to print layer by layer, which can directly form metal parts with
good performance.
In order to get the best suitable design, this thesis work gives seven different designs
including five core designs and second cavity designs to analyze which combo is the
best. The properties of mold material obtained and predicting them by simulation
are studied by Solidworks® simulation. To obtain the data, a static stress analysis is
performed. Based on this, the calculated fitting SN-curve was used for fatigue
analysis to obtain the characteristics of the model lifetime. Through simulation of
Moldflow®, to get the data of whole cycle time of each model to analyze whose
cooling design is the best for processing.
All in all, as long as the load imposed on the model does not exceed the limit, to
some extent, the lifetime of it is more than at least one million times. Results of
Moldflow® display that the complex cooling designs in the model have excellent
cooling efficiency, and the designs are hard to make by conventional manufacturing.
This allows the companies to produce injection mold through the SLM method,
thereby shortening the processing cycle and improving economic efficiency.
Page 5
Acknowledgements
3
Acknowledgements
We would like to thank the following people for their guidance,
support and participation in this project.
Roland Stolt
Senior Lecturer at Jönköping University in Jönköping, Sweden
Darko Josifovski
Designer at PLASTSYSTEM H. HELMETSCHLÄGER AB
Plastsystem AB
Plastic Company in Gislaved, Sweden
Page 6
Contents
4
Contents
1 Introduction 8
1.1 BACKGROUND 8
1.2 PURPOSE AND RESEARCH QUESTIONS 9
1.3 DELIMITATIONS 9
1.4 OUTLINE 10
2 Theoretical background 11
2.1 INJECTION MOLDING PROCESS 11
2.2 MOLD DESIGN 13
2.2.1 Mold structure 13
2.2.2 Wall thickness and flow length 14
2.2.3 Gate design 15
2.2.4 Runner design 16
2.2.5 Cooling system design 16
2.3 SELECTIVE LASER MELTING 18
2.3.1 Process 18
2.3.2 Materials 19
2.3.3 Defect 20
2.3.4 Pros and cons 21
2.4 3D PRINTING OF INJECTION MOLD 22
2.4.1 Comparisons between AM and conventional molds 22
2.4.1.1 Process different 22
2.4.1.2 Cooling different 23
2.4.2 Others 24
2.5 INJECTION MOLD TOOLING MATERIALS OF AM TECHNIQUES. 25
2.6 THE IMPACT OF SLM MAKING INJECTION MOLDS ON THE INJECTION MOLDING INDUSTRY. 25
2.6.1 Impact of conformal channels 25
2.6.2 Fatigue 26
2.6.3 Economic and environmental impact 26
Page 7
Contents
5
3 Method and implementation 28
3.1 METHODOLOGY 28
3.1.1 Identify needs 28
3.1.1.1 Analyzes the initial design from the company 28
3.1.1.2. Interpret analysis in terms of the company needs 30
3.1.1.3. Establish the assessment of needs 30
3.1.1.4. Evaluate needs. 31
3.1.2 Establish target specifications 31
3.1.2.1 Limitations 31
3.1.2.2 Challenges 32
3.1.2.3 Basic design 33
3.1.3 Design the Strategy 34
3.1.4 Generation of Redesigns 35
3.1.4.1 Core - Concept 1 37
3.1.4.2 Core - Concept 2 38
3.1.4.3 Core - Concept 3 39
3.1.4.4 Core - Concept 4 40
3.1.4.5 Core - Concept 5 41
3.1.4.6 Cavity - Concept 1 42
3.1.4.7 Cavity - Concept 2 43
3.1.5. Redesign testing 44
3.2 IMPLEMENTATION 44
3.2.1 Static testing 44
3.2.1.1 Solidworks simulation 44
3.2.1.2 Material 45
3.2.1.3 Constraint loading 47
3.2.1.4 Mesh 49
3.2.2 Fatigue testing 50
3.2.2.1 Calculate SN-curve by material tensile strength. 50
3.2.2.2 Loading and Run 54
3.2.3 Thermal testing 55
3.2.3.1 Boundary element method derivation 55
3.2.3.2. Model 56
3.2.3.3 Material 60
3.2.3.4 Precision and Simulation 61
4 Findings and analysis 62
4.1 STATIC & FATIGUE ANALYSIS 62
Page 8
Contents
6
4.1.1 Static analysis 62
4.1.1.1 Stress 62
4.1.1.2 Displacement 64
4.1.2 Fatigue analysis 66
4.1.3 Comparison 68
4.2 THERMAL TESTING 69
4.2.1 Cooling 69
4.2.1.1 Circuit coolant temperature 69
4.2.2.2 Circuit flow rate + Circuit Reynolds number 70
4.2.2.3 Warp, differential cooling 73
4.2.2 Comparison 75
5 Discussion and conclusions 78
5.1 DISCUSSION OF METHOD AND IMPLEMENTATION 79
5.1.1 Strategy 79
5.1.1.1 Static analysis 79
5.1.1.2 Thermal analysis 79
5.1.2 Stress & Fatigue testing 80
5.1.2.1 Solidworks 80
5.1.2.2 Stress testing 80
5.1.2.3 Fatigue testing 80
5.1.3 Thermal testing 80
5.1.4 Evaluation 81
5.2 DISCUSSION OF FINDINGS 81
5.2.1 Static and Fatigue analysis 81
5.2.2 Thermal analysis 81
5.3 CONCLUSIONS 82
6 Future Work 83
7 References 84
8 Appendices 88
APPENDIX 1: PIPE THREADS 89
APPENDIX 2: STRESS WITH DIFFERENT EDITIONS OF CORE (INITIAL,1,2,3,4,5) AND CAVITY
(INITIAL,1,2) 91
Page 9
Contents
7
APPENDIX 3: DISPLACEMENT WITH DIFFERENT EDITIONS OF CORE (INITIAL,1,2,3,4,5) AND CAVITY
(INITIAL,1,2) 95
APPENDIX 4: TEMPERATURE, PART (TOP) WITH DIFFERENT EDITIONS OF CORE (1,2,3,4,5) AND
CAVITY (1,2) 100
APPENDIX 5: PROPERTIES OF MATERIAL 101
APPENDIX 6: COOLING MODELS VIEWS 102
APPENDIX 7: DETAIL OF SETTING IN MOLDFLOW 105
APPENDIX 8: CES OF THE MATERIAL 106
Page 10
Introduction
8
1 Introduction
This thesis work will show the entire process of designing and producing Additive
manufacturing (AM) molds. If the results indicate how a viable business case can be developed,
the expectation is that mold manufacturers and plastic component manufacturers will begin to
consider AM as an alternative to machining or importing molds from low-wage countries.
1.1 Background
Injection molding is a manufacturing process in which plastic parts are produced by injecting
material into a mold. Injection molding has been used to create a wide variety of products with
a wide range of sizes, complexity and applications. From its inception to the present, injection
molding mold production technology has progressed significantly [1]. Via basic NC milling to
CNC, from possibility to recent 3D molded component development. Component injection
tooling is an important application of prototyping and manufacturing processes. With the help
of contemporary AM technologies, a lot of time and money can be saved in tooling development
[2]. The ability to get complicated geometries of the master pattern and its conformal cooling
channels is an excellent benefit of using AM to fabricate injection tooling. Furthermore, the use
of AM allows for the creation of lighter, more compact molds and dies made of a lattice structure,
which reduces the amount of fabric used in the AM process. It is now possible to improve the
preparation of today's injection tooling and create lightweight, complex designs with better
thermomechanical efficiency thanks to the advent of finite-element based structural
optimization methods [3].
The company Plastsystem AB is committed to satisfying all needs for plastic parts for customers.
From concept to finished product, the weight ranges from a few grams to about 2kg, and they
can provide full assistance. They saw the need for the design and manufacturing of 3D printed
molds for plastic injection molding. The current plan for making the mold is to use 3D printing
to make the core part of the mold and then splice it with other parts.
The expected results of the project will enable the manufacturers to reduce costs and shorten
delivery times, which also can make a larger portion of the product value can be added locally.
This will enable plastic parts manufacturers to reduce their dependence on suppliers. They will
have complete capabilities in products and manufacturing equipment, or they will be able to
find mold manufacturers locally. This provides them with ample opportunities to optimize the
combination of product design and production systems.
Page 11
Introduction
9
1.2 Purpose and research questions
In recent years, metal 3D printing has been increasingly put into industrial applications by
companies. The SLM method is one of 3D printing. This thesis work is to explore whether the
injection mold designed and manufactured by SLM has a significant improvement compared
with conventional manufacturing methods. Further, AM opens enhanced possibilities for
operating factories remotely. This can be expected to enhance the attractivity of manufacturing
jobs in Sweden.
The design of injection molding tools that are appropriate for AM will be created and evaluated
in this project using a computer model to figure out how tooling is designed to be better after
being produced through AM rather than the traditional way. Through the simulation analysis
of different versions of the mold, the difference between the SLM method and the traditional
method is discussed. The project will cover a variety of topics, including tool materials,
structural design, thermal conductivity and strength. The project's long-term effect purpose is
projected to be an improvement in local added value, which will improve the plastics industry's
competitiveness.
Due to finish our goal, here is four research questions that need to be answered:
Q1 What material should the tooling be made of?
Q2 What plastic components are suitable for printed tooling?
Q3 How should the tooling be designed to be more convenient after being produced through
AM rather than the conventional way? (Not only manufacture the mold. What about Cycle times?
Handling in productions?
Q4 What is the process performance?
1.3 Delimitations
The tool will be manufactured through a 3D-printer called ProX DMP 300 that uses a laser and
metal powder to build a product. Limited by the geometric limitations and manufacturing
consumption of the machine itself, tooling is made after obtaining the best design through the
result of computer simulation.
The material that will be used to manufacture these components is LaserForm Maraging Steel
(B) [4], specially developed for the printer in question. Maraging Steel is especially suitable for
high performance applications. After discussing with Plastsystem AB, this thesis work only
considers redesigning the cavity part and the core part of the whole tooling because it will cost
too much if the whole injection mold tooling is made by SLM. More details are in chapter 2.2.1.
Page 12
Introduction
10
1.4 Outline
This study has six chapters, chapter one describes objectives of the thesis work.
Chapter two describes SLM, the mold design and impact of 3D printing as the theoretical
background.
Chapter three describes the method and implementation, which is about design tooling
strategy and how to measure design.
Chapter four describes the findings and analysis, presenting the results from analysis
simulation.
Chapter five describes the discussion and conclusion, showing the discussion in method and
finding and giving a conclusion based on the results of analysis.
Chapter six describes the future work.
Page 13
Theoretical background
11
2 Theoretical background
2.1 Injection molding process
One of the most common polymer processing techniques used to manufacture polymer parts is
Injection molding (IM). It has been developed for nearly 150 years. The main goal of IM is to
manufacture parts with the required quality, which are usually related to mechanical accuracy,
dimensional consistency and aesthetics. The structure of parts and molds and process variables
are the most important factors that affect the efficiency of parts [5]. However, when it is
necessary to produce complex tooling with complex structures, especially multi-layer mold
cavities or cavities containing inserts, there is a possibility that welds will appear in the filling
of the mold, resulting in unsatisfactory redesign molding results.
Injection mold is a tool for producing most plastic parts, so the design of the mold has a very
critical impact on the quality of the product and efficient processing. However, generally in the
mold design stage, the mold designer will follow a set of general guidelines to rely on his own
skills and intuition to design the mold instead of formal engineering analysis, which may lead
to the redesign mold not necessarily being the best or meeting the requirements. On the other
hand, the pressure on mold manufacturers is increasing, which comes from customers'
increasingly demanding performance requirements and shorter time requirements for molds
[5].
Injection molding is the main processing technology used to produce plastic parts products.
Injection molding requires an injection molding machine with a control unit to complete the
operation. The injection molding machine must have a suitable clamping mold (with one or
more cavities for production), and a very important cooling system.
The process principle is melting the solid plastic according to a certain melting point and
injecting it into the mold at a certain speed through the pressure of the injection machine. The
mold is cooled by the water channel to solidify the plastic to obtain the same product as the
designed cavity. It is mainly used for the molding of thermoplastics, but also for the molding of
thermoset plastics [6].
Page 14
Theoretical background
12
Figure 2.1 Injection molding process [5]
Figure 2.1 shows the proportion of each part in the entire process of injection molding, which
separately are Mold Close (2%-4%), Packing (18%-20%), Filling (4%-6%), Cooling (70%-80%)
and Mold open (2%-4%) [6]. Different products will lead to different time proportions, but
basically the cooling time is more than 70%.
Mold Close (Feeding):
Because injection molding is an intermittent process, it needs quantitative (constant volume)
feeding, in order to ensure stable operation, uniform plastic plasticizing, and finally obtain high
quality plastic parts.
Packing + filling:
The filling time in the injection time is inversely proportional to the filling speed, and the filling
time in production is generally about 3 to 5 seconds.
The pressure hold time during injection is the pressure time on the plastic inside the mold cavity,
this time depends on the material temperature, the mold temperature and the size of the main
channel and the door. It accounts for a large portion of the total injection time, typically around
20 to 120 seconds (maybe up to 5 to 10 minutes for parts that are too thick).
Cooling:
Cooling time accounts for about 70%~80 % of the whole molding cycle. When the plastic in the
pouring system is frozen, it is no longer necessary to continue to hold the pressure, so the
plunger or screw can be returned to unload the plastic in the barrel.
The pressure of the material melts, and adding new material, and at the same time passes
cooling water, oil or air into the mold to further cool the mold. This stage is called the cooling
after the gate freezes. In fact, the cooling process starts when the plastic melt is injected into
Page 15
Theoretical background
13
the cavity, and it includes the period of time from filling the mold, holding the pressure to before
demolding.
Mold open(ejection):
The mold can be opened when the plastic part is cooled to a certain temperature, and the plastic
part is pushed out of the mold under the action of the ejection mechanism.
2.2 Mold design
The mold is composed of multiple complex parts that need to meet the requirements of heat
resistance, wear resistance, corrosion resistance, and stress resistance, which directly
determine the quality of the product. Inexpensive molds sometimes cannot guarantee the yield,
or the product quality is not up to standard, so mold design needs to be traded off. Designers
and engineers should make "appropriate" molds, that is, design molds that meet the lowest
cycle cost and produce parts that meet the standards with the least money, time, and risk [6].
2.2.1 Mold structure
Figure 2.2 Structure of Injection mold [7]
As shown in Figure 2.2, the movable mold and the fixed mold form the whole mold. The fixed
mold is also named A plate because it is on the stationary plate of the injection mold machine.
Meanwhile, B plate is also the movable mold for its plate. During injection molding, the moving
mold and the fixed mold are closed to form the gating system and a cavity. When the mold is
opened, the moving mold and the fixed mold are separated to remove the plastic products [7].
Page 16
Theoretical background
14
In this thesis, considering the designing requirements, only need to redesign the core part and
the cavity part which is shown in Figure 2.2.
2.2.2 Wall thickness and flow length
Based on factors such as cost and quality, factories should avoid using parts with inconsistent
wall thicknesses. The reason is that the cooling rates of thick-walled parts and thin-walled parts
are different: it is obvious that the cooling rate of thicker parts of the same material is slower
than that of thinner parts. When ejected, the different wall thickness of the part will result in a
higher temperature at the thick wall and a lower temperature at the thin wall, which will result
in a higher defect rate of the plastic product (considering the high thermal expansion coefficient
of the plastic). Therefore, under normal circumstances, designers should try to ensure that the
mold wall thickness is basically the same.
Figure 2.3 shows several different design options. As shown in the upper left Figure, due to the
large difference in overall thickness, it is considered to be the worst design. This design scheme
may cause uneven melt flow. If the thinner part of the plastic cures prematurely, the size of the
product surface and the thicker part will be wrong [7]. If it is changed to the design shown in
the Figure above, although the melt flow is still uneven, casting from thicker parts first will
greatly improve the dimensional stability and surface aesthetics of the product. Since there is
no transition region that shrinks during plastic molding, a sharp shift in wall thickness is the
worst design.
Figure 2.3 Wall thickness design [8]
As shown on the left, a more standard solution is to increase the thickness of the mold. The
disadvantage is increased material consumption and extended cooling time, but compared with
the top design solutions, it can be said that the product quality has been greatly improved. The
Page 17
Theoretical background
15
design on the right side of the Figure meets its higher strength and rigidity by changing various
values of the ribs, thereby ensuring stable product quality.
The two parts at the bottom are alternatives, which have become more and more common in
recent years. Both of these innovations can effectively reduce the wall thickness and increase
the material away from the neutral axis of the part, thereby greatly improving the rigidity
without increasing the amount of material used. The lower left corner uses a thin and short rib
to make the mold wall thinner, and the lower right corner uses a double dent structure, so the
wall will become thicker, but there are dents on both sides to reduce the effective wall thickness.
Both solutions can significantly improve production efficiency because of the increased cooling
rate due to the increase in surface area [8].
2.2.3 Gate design
Since a narrow cross-section of a gate results in a high injection pressure, gates should be
constructed with thick-wall areas to prevent large pressure drops to maintain a constant
pressure. The following are few other things to think about:
1.Flow direction: Prevent melts that cause extreme warpage due to molecular orientation.
2.Weld line: To minimize air traps and weld lines, maintain the flow distances within mold
cavities to the same size.
3.Filling: In addition, noise should be caused by the appropriate location to reduce the
incidence of jetting and flow marks [9].
Figure 2.4 Gate types [9]
The type of gate to be used is determined by part appearance criteria, gate removal process, part
geometry, mold production, and plastic characteristics, among other variables. The cashew gate
or cashew gate with ejector pin, the fan gate, the alternating gate, the tunnel gate, and the pin
gate are among the forms shown in Figure 2.4.
Page 18
Theoretical background
16
2.2.4 Runner design
Runner architecture considers four main factors:
1. Runner shape: A oval, parabolic, or trapezoidal cross-section impacts pressure loss and
mold production costs, as well as demolding considerations.
2. Runner dimension: Influences pressure loss and the demolding process by determining the
melt flow rate.
3. Mold cavity number: In a multi-cavity scheme, the balance of geometric allocation, as well
as the volume containable by each mold, efficiency, and expense, should all be considered.
4. Flow balance, demolding style, and production expense are all affected by the overall
runner configuration.
A plastic injection machine consists of a runner, a sprue, and a nozzle, as seen in Figure 2.5. A
runner's primary role is to uniformly distribute melt from the nozzle to the cavity, which has a
significant impact on the filling path, cycle time, and, eventually, product consistency [9].
Figure 2.5 Plastic melt delivery system [9]
2.2.5 Cooling system design
Heat dissipation is also affected by the cooling channel's association. The two most popular
cooling system architectures, as seen in Figure 2.6, are cascade (serial) and parallel cooling
systems. Other types of links, such as those that use one-to-many branching, can induce
selective flow and result in dead corners [10]. In the case of a long cascade with a temperature
difference of more than 3 °C between the inlet and outlet, the cooling channel can be separated
into several segments as seen in Figure 2.7 (from one-in/one-out to multi-in/multi-out).
Page 19
Theoretical background
17
Figure 2.6 Serial and parallel cooling systems [10]
Figure 2.7 Multi-inlets and outlets of the cooling system [10]
Figure 2.8 Enhanced cooling designs: (a) baffle, (b) bubbler, (c) conformal cooling [10]
There is the baffle (Figure 2.8(a)), which is the tube installed on the channels, and the baffle
can cool the space where the straight cooling channels are hard to reach. As Figure 2.8(b)
shown, the bubbler is a tubular cavity, whose diameter is larger than the cooling channel to
make sure the coolant can reach the concave areas [11]. After the development of laser AM, as
seen in Figure 2.8(c), the latest conformal cooling techniques improve cooling performance in
these regions [11]. As the temperature distribution of all three designs is compared, conformal
cooling is able to remove the part's internal heat, making it the better cooling system of the
three.
Page 20
Theoretical background
18
Turbulence can remove heat three to five times faster than a steady laminar flow, so in
addition to a good cooling channel structure, a proper coolant flow rate is critical. To keep the
coolant in a chaotic state, a Reynolds number greater than 6000 is suggested [11].
2.3 Selective laser melting
SLM: Selective Laser Melting, is a major technological approach in the AM of metal materials.
The technology uses a laser as the energy source and scans the metal powder bed layer by layer
according to the planned path in the 3D CAD slice model. The scanned metal powder is melted
and solidified to achieve the effect of metallurgical bonding, and finally obtain the design of the
model Metal parts [12].
SLM technology overcomes the troubles caused by traditional technology to manufacture metal
parts with complex shapes. It can directly form almost completely dense metal parts with good
mechanical properties [13].
2.3.1 Process
As shown in Figure 2.9, the SLM equipment has a chamber filled with metal powder, and the
metal powder is spread in a very thin layer on the substrate or build plate through a coating
blade.
Then, the high-power laser melts the 2D section of the part by selectively melting the powder
material. Then, the build plate is lowered by one layer, and the coating blade spreads a new
layer of powder finely on the surface. Repeat this process until printing is complete.
The whole process is carried out in a controlled atmosphere inside the machine. After the part
is built, it can be taken out of the machine. Remove the SLM components from the build plate,
which is usually done using a band saw. Then you need to remove the support. Since the support
material is the same as the component material, this can be a difficult and time-consuming
process [14].
The surface finish of pressed and sintered is very rough and may require some post-processing,
but machine parts can usually achieve fine tolerances and complete fine features, whether it is
surface or pores.
Page 21
Theoretical background
19
Figure 2.9 How SLM work [14]
2.3.2 Materials
The breakthrough of the metal powder atomization process will promote the development of
SLM technology, and the improvement of the quality of powder materials will directly promote
the application of metal printing parts. At present, the commonly used powder particle size of
SLM is usually gas atomized pre-alloy, which is the most economical method to obtain spherical
powder on an industrial scale. The sphericity is required because it guarantees high fluidity and
bulk density, which translates into fast and reproducible spreading of the powder layer. Narrow
grain size distributions with a low percentage of fine particles, such as 15 - 45 µm or 20 - 63 µm,
are commonly used to improve flowability. Stainless steels 17-4 and 15-5, maraging steel, cobalt
chromium, Inconel 625 and 718, aluminum AlSi10Mg, and titanium Ti6Al4V are currently
Page 22
Theoretical background
20
available alloys used in the process. Samples made by direct metal laser sintering have different
mechanical properties than those made by casting [15].
2.3.3 Defect
Although the significant benefits that SLM has brought to AM, the process of melting a
powdered medium with a focused laser produces a variety of microstructural defects that can
have a negative impact on the overall functionality and strength of the produced component.
Lack of Fusion (LOF) and cracking within solidified regions are two of the most common
mechanical defects. Rather than a coherent solid, LOF includes the entrapment of gas within
the system. These flaws may occur as a result of not using a powerful enough laser source or
scanning too rapidly through the powdered surface, resulting in inadequate melting of the metal
and a weak bonding condition for solidification. Low thermal conductivity and high thermal
expansion coefficients generate enough internal stresses to break bonds within the material,
especially along grain boundaries where dislocations are present, resulting in cracking [4].
Powder particle dynamics due to gas expansion, thermal fluid dynamics trapping solid-liquid-
vapor transition when interfered with laser, solid state transformation such as precipitation
after remelting and intrinsic heat treatment and resulting solid mechanics to deal with
disruption mechanisms such as cracking are all examples of physical effects and related physics
that occur during AM [15].
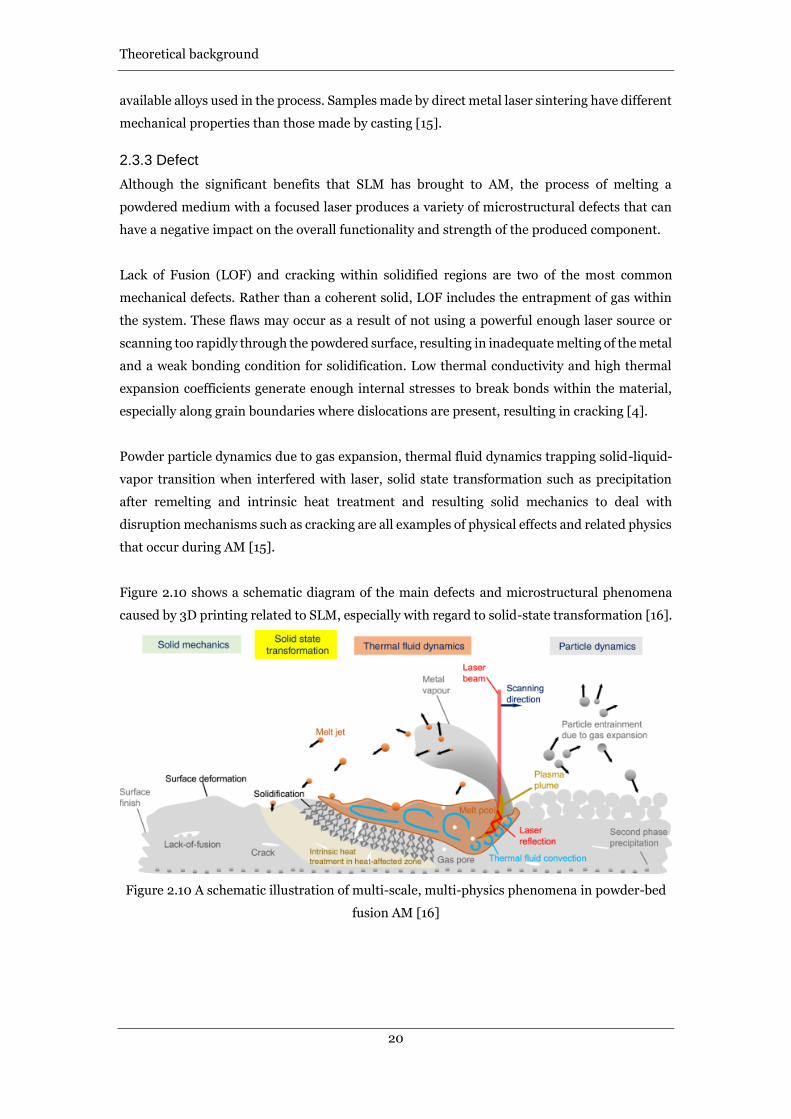
Figure 2.10 shows a schematic diagram of the main defects and microstructural phenomena
caused by 3D printing related to SLM, especially with regard to solid-state transformation [16].
Figure 2.10 A schematic illustration of multi-scale, multi-physics phenomena in powder-bed
fusion AM [16]
Page 23
Theoretical background
21
2.3.4 Pros and cons
Pros:
It is a near-net-shape industrial manufacturing technology that reduces the need for post-
processing technology or simple surface treatment, thereby greatly shortening the product
development cycle and saving a lot of post-processing costs.
Entities with non-equilibrium supersaturated solid solution and uniform fine metallographic
structure can be obtained, the density can reach almost 100%, and the mechanical properties
of the parts are equivalent to those obtained from the forging process.
Due to the small diameter of the laser spot, it can melt high melting point metals with lower
power, making it possible to manufacture parts with single-component metal powder, and the
types of metal powders available for selection have also been greatly expanded.
Suitable for a variety of complex shapes of workpieces, especially suitable for complex and
special-shaped structures (such as cavities, three-dimensional grids) inside. If realized by
traditional manufacturing, it will be incredibly difficult and expensive. At the same time, this is
also the hope of mold manufacturers. Use the SLM manufacturing process to make complex
structure injection molds instead of the very expensive CNC manufacturing process.
Cons:
Expensive, especially those parts that are not optimized or designed for the process.
Rough surface treatment (need to polish the whole part later).
It is possible to print out parts with tiny holes (less than 0.1cm), and the design process needs
to be polished.
Although the development cycle has been shortened, it has not reached the level where
customers place orders today and provide customers with finished products today.
Page 24
Theoretical background
22
2.4 3D printing of injection mold
Figure 2.11 Difference between formative, subtractive and AM [17]
As shown in Figure 2.11, the additive manufacturing process builds objects by adding materials
layer by layer, while subtractive manufacturing creates parts by deleting materials. AM is not
constrained by process, and without significantly increasing the cost, additive manufacturing
technology can produce three-dimensional products with almost unlimited geometry [17].
2.4.1 Comparisons between AM and conventional molds
2.4.1.1 Process different
Figure 2.12 shows that the time cost of traditional technology is at least 40% higher than AM
technology, because CNC machining technology needs a lot of time to finish the mold
production [18]. For example, if the customer is very demanding on the design time of a certain
mold product (a small production like a phone case), the CNC technology needs at least 15 days,
but AM technology can meet the requirement of about two days from the request to the
appearance of the sample [19].
Page 25
Theoretical background
23
Figure 2.12 Traditional injection mold development process and 3D printing mold process
[20]
2.4.1.2 Cooling different
As shown in Figure 2.13, in the production of traditional molds, drilling can only create a
straight waterway, which also means that the shape of the waterway is limited and far away
from the mold surface [20]. 3D printing can realize precise and complex crystal lattice and
pipeline structure, combined with digital design, can evenly distribute water channels
according to the geometric structure of injection molded products.
Compared with the traditional mold complex cavity, the heat is not easy to dissipate, and the
mold production cycle is long [21]. The conformal cooling water path is close to the mold
surface, and multiple water paths coexist, which effectively improves the heat dissipation
efficiency, shortens the production cycle, and improves production efficiency [22].
In the traditional production mode, due to the existence of dead cooling corners, parts are
prone to bend and deform due to high temperatures. The conformal waterway dissipates heat
Page 26
Theoretical background
24
evenly, can produce zero-defect products, effectively improve product quality, and reduce the
rate of rejects [22].
Digital design combined with 3D printing can realize the lightweight structure of the mold and
reduce the cost. At the same time, 3D printing grafting molds can be designed and
manufactured based on existing molds [23].
Figure 2.13 Comparison of traditional waterway cooling design (left) with conformal cooling
waterway design (right) [24]
2.4.2 Others
The development of additive technology has made it a reality to use 3D printing to make plastic
injection molds. Figure 2.14 shows a plastic mold made using 3D printing. However, this type
of mold has problems such as poor durability and low accuracy. This is also one of the main
reasons why this study chooses to use SLM to make metal instead of plastic molds. However,
plastic molds can be regarded as samples of metal molds to analyze the possible problems of
the mold in the production process, such as voids, and the roughness of the channel to improve
the design [25].
Figure 2.14 Plastic mold [25]
Page 27
Theoretical background
25
2.5 Injection Mold Tooling Materials of AM techniques.
What are the advantages of 3D printing mold steel? The traditional process, like Figure 2.12,
has a long mold production cycle and poor hardenability, and it also faces the quenching process,
once it cracks, it will be scrapped. After the participation of 3D printing technology, it is possible
to improve the mold grains in the process of processing parameters to improve the mechanical
performance [26].
Although 3D printing molds have two serious shortcomings, one is insufficient density and
defects (holes, as shown in Figure 2.15. The other is that there are not many choices of materials,
and the thermal conductivity is not ideal enough [27]. With the development of metal 3D
printing applications, in the foreseeable future, the types of 3D mold steels will gradually
increase, and these shortcomings will also be compensated one by one.
Figure 2.15 Oxide inclusions on the surface of 3D printing mold steel
This thesis work intends to adopt LaserForm Maraging steel (B), which has been specially
formulated and fine-tuned for use with the 3D Systems DMP 320 metal 3D printer to ensure
the best component quality and efficiency. 3D Systems' printing parameter database, as well as
the components, have been thoroughly developed, checked, and refined in the company's parts
manufacturing facilities, which have the specialized expertise to print 500,000 demanding
parts each year. More details will be presented in the Method section [4].
2.6 The impact of SLM making injection molds on the injection molding
industry.
2.6.1 Impact of conformal channels
3D printing molds, such as injection molds, have always been relatively promising metal 3D
printing applications in the industry. There are reasons:
Complex cooling channels, like Figure 2.16, are very useful for cooling capacity to improve the
product efficiency. However, because it is a complex structure, the requirements of the
designing process must be higher than conventional. On the other hand, because this design is
Page 28
Theoretical background
26
indeed almost only possible with 3D printing, the added value of the mold has to withstand the
high price of the 3D processing.
Figure 2.16 Complex cooling channels [24]
Assuming an ABS plastic product mold with a lifespan of 0.5 million times, the original yield
rate is 98%. The 3D technology has improved the efficiency by 10% and the yield rate by 1%.
Then in the entire life of the mold, qualified products will be increased from 490,000 to
495,000. At the same time, the time is saved by 10%, which may be several days, which can free
up the production line and generate further benefits.
If the income of qualified products and the comprehensive benefits of saving time are calculated,
and there is still a surplus after the benefits are allocated to 3D printing, then this surplus is
value [28].
2.6.2 Fatigue
Mold life has always been an important factor affecting the profitability of injection molding
projects. If a reasonable method can be used to increase the life of the mold to exceed the design
requirements, then the profitability of the company will be significantly improved. The mold
made by the SLM method is stronger than the ordinary mold in terms of overall quality. For
example, better structural stability can make the clamping force more reasonable and increase
the life of the mold.
2.6.3 Economic and environmental impact
3D printing has gradually become an important alternative to the traditional manufacturing
processes of various companies, making the supply chain more environmentally friendly. The
tools we now have can achieve unprecedented design results and methods to meet ever-
increasing consumption. More efficient product design, more efficient manufacturing processes,
Page 29
Theoretical background
27
more efficient supply chains, accelerated innovation and time to market have brought better
economic sustainability [28].
Depending on future AM technological advancements, AM has the ability to save 3 % to 5 %
primary oil, 4 % to 7 % GHG emissions, 12 % to 60 % lead time, and 15 % to 35 % expense over
1 million injection molding cycles [29]. The economic benefits show the importance of
considering trade-offs and balancing techniques between environmental and economic
performance when AM is used in the tooling industry, while the comparatively limited
environmental benefits highlight the need to weigh trade-offs and balancing techniques
between environmental and economic performance when AM is used in the tooling industry
[29]. The findings also aid in identifying the technological issues. The findings also aid in
identifying technical advancements in AM that could have wider implications in the future [30].
Page 30
Method and implementation
28
3 Method and implementation
3.1 Methodology
This chapter presents a method for designing and manufacturing of SLM printed tooling for
plastic injection molding.
The philosophy behind the method is to the possibility to produce a core and cavity with the
SLM technique.
According to Concept development Method, this research work follows the next steps:
1. Identify needs.
2. Establish target specifications.
3. Design the Strategy.
4. Generation of Redesigns.
5. Redesign testing.
3.1.1 Identify needs
At the beginning of this part, the company Plastsystem AB had already provided the initial cad
model of the core part, because during our sessions with the company, it has detected the
redesign needs of improving product efficiency and decreasing weight with stable mechanical
properties, which has been classified following the next steps:
1. Analyzes the initial design from the company.
2. Interpret the raw data in terms of the company needs
3. Establish the assessment of needs.
4. Evaluate needs.
3.1.1.1 Analyzes the initial design from the company
As shown in Figure 3.1, the mold consists of a cavity part (white) and a core part (blue), the size
is 221mm x 132mm x 73mm. This mold is the part where the injection mold forms the plastic
product. The mold is the part Lifting rings are connected to the core and cavity which help it to
lift in place. The mold halves are then looked at from above with clamps. Figure 3.2 shows the
initial design. When the processing is completed each time, the mechanical structure of the pink
part will loosen the product and let it fall naturally into the basin.
Page 31
Method and implementation
29
(a)
(b)
Figure 3.1 Different views of initial version: (a) top view and perspective view (b) bottom view
and perspective view
Figure 3.2 Initial design entire tool
Page 32
Method and implementation
30
3.1.1.2. Interpret analysis in terms of the company needs
This part is the interpretation of the analysis design based on the discussions with the company.
It was detected that the Material, Thermal and Mechanical properties, and construction
(manufacturing), are the main needs to focus on and shown in detail below:
Material:
Strong materials that will not fail under the premise of meeting the stress needs
Mold materials
Component materials
Thermal:
Cooling
Mechanical:
Static
Fatigue
Construction and operation:
Assembly
Size of tools
Lattice structure of tools
Process of redesign
Production efficiency
Emergency shut off
3.1.1.3. Establish the assessment of needs
Based on the interpret analysis, a list (Table 3.1) of needs is done and has establish the score of
them, where the high value is nine, the mediate value is three and the low value is one. Similar
needs and those with a score of less than three will be covered.
Table 3.1 Assessment score of needs
Assessment Score
Filling flow characteristics of plastic melt during injection 3
Corrosion resistant 9
High temperature resistant 3
Good Production efficiency 9
Be stable 9
Save costs 3
Simplify the design process 9
Page 33
Method and implementation
31
Ensure mold manufacturing cycle 9
Ensure the service life of the mold 9
Good Mechanical properties 3
weight Loss 9
System has an indicator 1
3.1.1.4. Evaluate needs.
For this model that is being redesigned, it is most important for the company to reduce its own
weight as much as possible to save costs, reduce each processing time, and improve overall
productivity on the premise of meeting the mechanical needs. Table 3.2 shows the relative
importance of needs. In this project the hierarchy represents the higher lever needs. The relative
importance of the needs is the key in the design and manufacturing of SLM printed tooling for
plastic injection molding.
Table 3.2 Relative importance of needs
Needs Aspects Importance
Mold materials Material high
Component materials Material mediate
Cooling Thermal high
Fatigue Mechanical high
Static Mechanical mediate
Lattice structure Construction and operation high
Process of redesign Construction and operation high
Assembly Construction and operation high
3.1.2 Establish target specifications
The target specifications are established after the company needs have been identified, however,
some limitations and challenges has been detected. What’s more, the same basic design of
lattice structure in redesign each version will give a base in process.
3.1.2.1 Limitations
Here is a cross-section of the tool (Figure 3.3). These slot holes as shown are where hoses for
the cooling are installed underneath. Since the cooling lines must be specifically placed in the
Page 34
Method and implementation
32
core and cavity, locked before the pipe threads, there has to be room for that, that’s why G ⅛ is
chosen.
Figure 3.3 Limitation
3.1.2.2 Challenges
Based on the previous analysis and evaluation needs, there are several challenges of redesigning
the core and cavity:
● Reducing weight.
● Make it strong enough.
● Make the cooling lines efficient.
● Make it sustainable to withstand fatigue.
Reduction of weight will lead to less metal need and therefore less environmental impact. To be
able to reduce material the design must handle parameters like pressure and temperature as
well as all other construction cavities. In other words, it’s challenging to remove material.
Page 35
Method and implementation
33
3.1.2.3 Basic design
To be able to find lattice structure. Design aspects (Figure 3.4) such as weight reduction and
complex cooling channels had to be considered. Following six structures were designed and
considered.
square
diamond
honeycomb
octagon
crisscross
miura fold
Figure 3.4 Different lattice structure
Page 36
Method and implementation
34
Table 3.3 shows the evaluation of lattice structure according to discussion with Plastsystem AB
and Roland. Because the machining accuracy of SLM machine ProX DMP 300 is ±50 microns,
as shown in Figure 3.4, the spacing of the honeycomb structure is the best suitable for the design.
The spacing of the octagon structure and the square structure are too large. Diamond structure
has a good spacing but it’s load-bearing capacity is not as good as the honeycomb structure. The
miura fold structure is not suitable for the molds with rectangular parallelepiped structure. The
crisscross frame is too tiny to print by the machine. So, based on the evaluation, the honeycomb
model was chosen.
Table 3.3 Evaluation of lattice structure
Lattice structure Spacing load bearing Printing possibilities scores
Square 0 (too large) 1 1 2
Diamond 1 0 1 2
Honeycomb 1 1 1 3
Octagon 0 (too large) 1 1 2
Crisscross 1 0 X X
Miura fold 0 1 1 2
3.1.3 Design the Strategy
Based on the identified needs with establishing target specifications, this part gives the strategy
to ensure a base was set up for how to redesign the molds. The strategy consists in determining
that the material and structure of the mold (including the lattice structure) are the same, and
on this basis, only redesign the cooling channel in the mold to obtain the data from thermal and
mechanical analysis to prove whether the purpose of the paper is feasible, that is, Design and
manufacturing of SLM printed tooling for plastic injection molding were useful. First, all the
versions are made out of the same material and have the same lattice structure, which is a
honeycomb (hexagonal structure). All cells in lattice structure have chamfered edges to increase
strength and simplify removal of support material. The mold halves have the molding side
directed upward for cleaning reasons. The molding sides have to be solid to prevent leaking.
They also have the same thickness of the cooling channels and the same pipe threads which are
5 mm and G ⅛. The dimension of pipe threads is the hole size including thread size, meaning
that G ⅛ isn’t actually ⅛ inch (3,175 mm) but 9,728 mm. Read Appendix 1 for more description.
Mass of each version varies, mostly based on the designs of the cooling channels. Wall thickness
is mostly 3 mm.
Page 37
Method and implementation
35
The purpose of this redesign approach that led to a number of design versions was to show the
possibility to produce a core and cavity with AM 3D SLM technique. Whilst achieving excellent
performance in terms of molding pressure, fatigue, and cooling. To print a core and cavity more
effectively instead of a number of standing operations when using CNC.
3.1.4 Generation of Redesigns
This section describes the development of redesign concepts based on the needs identified.
Each redesigned mold is analyzed and tested to meet the needs, and then appears in this step
as the final mold and compared. This part shows seven versions of the molds. As a result, there
were 5 concepts of the Core and 2 concepts for the cavity. The core required more creativity
because of the more complex shape. The cooling channels must go under the slides for the
blocks that separate when opening the mold, then up closer to the mold part surfaces and at the
same time orientate between the ejector pinholes. The cavity on the other hand was easier where
the cooling channels could be drawn more straight without going upwards or downwards. That
is why more time has been put on the core. Every concept further in this chapter describes each
view and everyone has a simulation on stress and displacement.
When redesigning the core and cavity, it was done by using the original as a start and work
based on its geometries. After a redesign was finished, a new one was made with knowledge
from previous ones for improvements.
Page 38
Method and implementation
36
Here follows a summary of core and cavity differences.
Core v1 - The original core supplied by Plastsystem AB. This version had only one cooling
channel, missing cooling ability for the second product. So, it also had to be added. Cooling
channels had an inlet and outlet from bottom.
Core v2 - This version was redesigned to have separated inlet and outlet. Inlet was placed at
bottom and outlet was at top. This version also gave a better cooling performance.
Core v3 - The core was redesigned with two individual cooling channels.
Core v4 - A new redesign with individual cooling channels. Inlet and outlet were placed at the
bottom. Cooling capacity increased but placement of the cooling channels was too tight.
Core v5 - A completely new design with two parallel cooling channels achieving even better
cooling and less material usage.
Cavity v1 - The original prototype had no cooling channels at all and gave free possibilities to
design. Experience for core v2 was utilized, i.e., one cooling channel with inlet at bottom and
outlet at top.
Cavity v2 - New redesign with aim to increase cooling even more. The design gave one cooling
channel to form a sick-sack curve.
Note the colored sections:
Red = Part mold surfaces
Yellow = Ejector pin holes
Green = Cooling channels
Results can be found in table 4.1 in chapter 4.1.3.
Page 39
Method and implementation
37
3.1.4.1 Core - Concept 1
The first idea (Figure 3.5) for the core was to make one single cooling that splits into two since
this mold manufactures two parts. It starts with an inlet at the top, goes down to the mold part
section and to the outlet at top. The cooling channel goes where the cells in the lattice structure
are filled as shown underneath, just like the rest of the versions of the core. It was clear that this
idea was not going to work since the water flow in the cooling channel was poor as the ability
for cooling the second product was missing.
Isotopic view of core v1.
Isotopic view of transparent core v1.
Top view of transparent core.
Right view of
transparent.
Bottom view of core v1.
Figure 3.5 Different views of Core- Concept 1
Page 40
Method and implementation
38
3.1.4.2 Core - Concept 2
The second idea (Figure 3.6) is similar to the first one, but the cooling channel is adjusted to
evenly divide into two based on the part mold surfaces. This channel has its inlet at bottom and
the outlet at top. This gave a better cooling performance than the previous one. The learning
lesson here is depending on how the cooling channel is designed, one may not always be the
most efficient solution.
Isotopic view of core v2.
Isotopic view of core v2.
Top view of transparent core
v2.
Right view of
transparent
core v2.
Bottom view of core v2.
Figure 3.6 Different views of Core Concept 2
Page 41
Method and implementation
39
3.1.4.3 Core - Concept 3
The third one (Figure 3.7) has two individual cooling channels beside each other, both having
inlets at the bottom to the right and outlets at top to the left. Each one takes its own mold section.
Problem here, cooling performance is lower and the core itself is heavier.
Isotopic view of core v3.
Isotopic view of transparent
core v3.
Top view of transparent core
v3.
Right view of transparent
core v3.
Bottom view of core v3.
Figure 3.7 Different views of Core Concept 3
Page 42
Method and implementation
40
3.1.4.4 Core - Concept 4
The fourth idea (Figure 3.8) also has two cooling channels like the previous one. Except that
these have both inlets and outlets at bottom. This increased the cooling performance, but the
channels were too close to each other.
Isotopic view of core v4.
Isotopic view of transparent core
v4.
Top view of transparent core
v4.
Right view of
transparent core v4.
Bottom view of core v4.
Figure 3.8 Different views of Core Concept 4.
Page 43
Method and implementation
41
3.1.4.5 Core - Concept 5
The last idea (Figure 3.9) has two parallel cooling channels that orient from the inlet at bottom
to the outlet at top. These go around the ejector pin holes instead of between like the rest of the
concepts. The reason is the narrow spaces between the ejector pin holes where it is tight for the
cooling channels. This design is also the lightest one and has a greater cooling performance.
Isotopic view of core v5.
Isotopic view of transparent.
Top view of transparent core
v5.
Right view of transparent
core v5.
Bottom view of core v5.
Figure 3.9 Different views of Core Concept 5
Page 44
Method and implementation
42
3.1.4.6 Cavity - Concept 1
The first idea (Figure 3.10) of the cavity has a single cooling line that starts with an inlet at
bottom and ends with an outlet at top. It splits in the middle around the runner system where
the molten plastic gets injected from, which in theory should distribute the cooling. The cavity
has a section where the cooling channel goes. The cells in the lattice structure in these cavities
are bigger than the ones in the cores. Since the original had no cooling channels, this gave free
design possibilities.
Isotopic view of cavity v1.
Isotopic view of transparent.
Top view of transparent cavity
v1.
Left transparent view v1.
Bottom view of cavity v1.
Figure 3.10 Different views of Cavity Concept 1
Page 45
Method and implementation
43
3.1.4.7 Cavity - Concept 2
Second idea (Figure 3.11) also has a single cooling channel with an inlet at bottom and outlet at
top just like the first cavity. But here the cooling goes sick sack. This should in theory give more
cooling surface. The section where the cooling channel goes is rounded.
Isotopic view of cavity v2.
Isotopic view of transparent.
Isotopic view of transparent
cavity v2.
Left view of transparent v2.
Bottom view of cavity v2.
Figure 3.11 Different views of Cavity Concept 2
Page 46
Method and implementation
44
3.1.5. Redesign testing
According to the needs analyzed, to compare the redesigns concepts, the Finite Element Model
(FEM) is suitable for the purpose. First study is Fatigue to shows the lifetime, fortunately,
Solidworks® Simulation also has fatigue analysis of models. Thermal analysis of the injection
process is necessary because, as for injection mold, better cooling capacity means higher
efficiency. Moldflow® waterway analysis is just suitable for simulation analysis in this area.
3.2 Implementation
This chapter shows how to test the mechanical and thermal properties of the redesigned
concepts showed in last section.
According to the needs detected this section presents the next testing:
1. Static testing
2. Fatigue testing
3. Thermal testing
3.2.1 Static testing
SolidWorks® Simulation is a completely integrated design analysis system that is fully
integrated with SolidWorks®, which provides a single screen solution to perform stress analysis,
frequency analysis, distortion analysis, thermal analysis and optimization analysis.
To make a finite element model calculation to determine the stresses with accurately
establishing a 3D model and force method is a good way to make sure the models meet the
standard. In other words, when the model is running, the workbench must ensure that the
curvature and deformation of the front and rear planes cannot exceed the maximum value
specified by the process.
3.2.1.1 Solidworks simulation
In this finite element analysis, the default static is selected for the calculation type for analysis
as shown in Figure 3.12. Because static stress analysis simulation can accurately reflect what
the model bears in a working cycle.
Figure 3.12 Choose Static
Page 47
Method and implementation
45
3.2.1.2 Material
In the conversation with Plastsystem AB, the material LaserForm Maraging steel (B) was
confirmed. Special high strength steel as shown in Table 3.4, suitable for injection molds with
the conformal waterway.
Figure 3.13 shows that LaserForm Maraging steel (B) has incredible Yield Strength meanwhile
the material also has good performance at Elongation.
Figure 3.14 shows this material performs very well in Tensile strength and Young’s Modulus.
What’s more, Figure 3.15 displays materials’ specific strength against specific modules to
demonstrate that the high specific strength and specific modulus in this material indicate that
the material is light in weight, while the strength and stiffness are good.
So, these plots show the reason why this material is the best suitable for the redesign model.
More detail can check in appendices 8.
Table 3.4 Mechanical characteristics of parts: [4]
As-Built After Stress relief Ageing
Young's modulus (GPA)
Horizontal direction - XY
Vertical direction - Z
160 ± 30 145 ± 30
160 ± 20 155 ± 20
185 ± 20 165 ± 20
Ultimate strength (MPa)
Horizontal direction - XY Vertical direction - Z
1180 ± 20 1050 ± 40
1130 ± 20 1100 ± 40
2190 ± 50 2140 ± 50
Yield strength Rp0.2% (MPa)
Horizontal direction - XY
Vertical direction - Z
950 ± 60 780 ± 60
800 ± 50
790 ± 50
1870 ± 80
1750 ± 80
Elongation at break (%)
Horizontal direction - XY
Vertical direction - Z
13 ± 3 13 ± 3
13 ± 3
13 ± 3
3 ± 1,5
1,5 ± 0,5
Reduction of area (%)
Horizontal direction - XY
Vertical direction - Z
55 ± 5
60 ± 5
55 ± 10
50 ± 10
12 ± 5
7 ± 5
Page 48
Method and implementation
46
Hardness, Rockwell C 36 ± 2 33 ± 2 55 ± 3
Figure 3.13 Ashby chart, Metals, Yield strength against Elongation
Figure 3.14 Ashby chart, Metals, Tensile strength against Young’s modulus
Page 49
Method and implementation
47
Figure 3.15 Ashby chart, Metals, Specific strength against Specific modulus
Import it to Solidworks® (Figure 3.16). The Single crystal properties are anisotropic, while
polycrystals are isotropic. Because mold steel is made of polycrystals, the mold type is Linear
Elastic isotropic.
Figure 3.16 Import material properties in Solidworks
3.2.1.3 Constraint loading
In the actual coordination of the model, the bottom of the model is embedded in tooling, so the
constraint on its structure is to fix the bottom as shown in Figure 3.17. For the load of the model,
Page 50
Method and implementation
48
as shown in Figure 3.18, it mainly comes from the load received during the machining process,
and it is pre-designed to 500,000N.
Figure 3.17 Fixture
Figure 3.18 Load
Page 51
Method and implementation
49
3.2.1.4 Mesh
Mesh is a structure of finite elements used for discretization of geometry, loads and restraints.
Parameters in this sample are:
● Loads – 500,000 N (50 tons)
● Mesh type - Curvature based mesh.
● Element size - maximum 10 mm, minimum 2 mm
In a curvature-based mesh, the elements are second order tetrahedral meaning that the nodes
are both at corner and mid-side. Compared to single order tetrahedral elements which only
have corner nodes. This makes it possible to map the elements precisely to curved surfaces. In
SolidWorks® Simulation, second order tetrahedral elements are mostly used thanks to better
mapping and stress modeling capabilities [31, s.11-21].
Divide the network into the entire structure of the model and transform it into a finite element
model, as shown in Figure 3.19.
Figure 3.19 Different views of mesh
Page 52
Method and implementation
50
3.2.2 Fatigue testing
Fatigue life refers to the number of stress or strain cycles experienced before fatigue failure. The
process of fatigue failure is under the action of cyclic load, the parts form micro cracks on the
weakest and most stressed grains at the highest local stress, and then develop into macro cracks,
the cracks continue to expand, and finally lead to fatigue fracture. In this project, Solidworks®
simulation uses the nominal stress method for fatigue analysis. The nominal stress (NS) is used
as the design parameter. Starting from the SN-curve of the material and considering the
influence of various factors, the SN-curve of the part is obtained, and the fatigue design is
carried out according to the SN-curve of the part. It is mainly used for the dominant elastic
deformation High cycle fatigue.
Click the New study and choose Fatigue with Constant amplitude events with defined cycles like
Figure 3.20.
Figure 3.20 New study of Fatigue
3.2.2.1 Calculate SN-curve by material tensile strength.
This part refers to the method that the software automatically fits the SN-curve according to
the tensile strength during fatigue analysis in Optistruct and HyperLife.
As shown in Figure 3.21, in the logarithmic coordinate system, the SN-curve usually consists of
three segmented line segments, of which two-line segments are inclined, one line segment is
horizontal, and the two inclined line segments represent low cycle and high cycle fatigue,
respectively. The horizontal area represents the fatigue limit (i.e., infinite cycle life). There is no
Page 53
Method and implementation
51
definite dividing line between low-cycle and high-cycle fatigue. In order to easily distinguish
high-low-cycle fatigue, 103 or 104 cycles are usually used as the dividing line. In Optistruct, 103
cycles are used as the dividing line. So, by obtaining the data of the stress amplitude S1000 for
103 cycles and the stress amplitude Sbe for 106 cycles, the empirical SN-curve can be obtained.
Figure 3.21 Sample SN-curve
Before to begin the introduction, here are a few symbols:
S1000-----Stress amplitude of 103 cycles of loading
Sbe-----Fatigue limit
SU ——Material tensile strength (also called tensile strength)
SUS----material shear strength
b ——The slope of the high-period area of the SN-curve in the logarithmic coordinate system
𝑏 =𝑙𝑔𝑆1000 − 𝑙𝑔𝑆𝑏𝑒𝑙𝑔103 − 𝑙𝑔106
= −1
3𝑙𝑔(
𝑆1000𝑆𝑏𝑒
)
It can be seen from the above formula that the slope of the high-cycle region can be calculated
as long as the two data of S1000 and Sbe are obtained. So, how to estimate the S1000 and Sbe data
from the SU?
First, as shown in Table 3.5 the stress amplitude S1000 of 103 cyclic loads was estimated by the
tensile strength SU.
For bending load, the value of S1000 is approximately equal to 90% of the tensile strength SU; for
axial tensile load, the value of S1000 is approximately equal to 75% of the tensile strength SU; for
torsional loads, the value of S1000 is mainly Subjected to shearing force Approximately 90% of
the shear strength SUS.
The shear strength of different materials is very different. The shear strength of steel is about
80% of the tensile strength, the shear strength of non-ferrous metals is about 70% of the tensile
strength, and the shear strength of cast iron is about the same as the tensile strength. 130%.
Page 54
Method and implementation
52
Table 3.5 Conversion of S1000 and SU
Materials Type Load type S1000
All materials bending 0.9*SU
All materials Axial 0.75*SU
Steel Twist 0.9*SUS=0.72*SU
Non-ferrous metals Twist 0.9*SUS=0.63*SU
cast iron Twist 0.9*SUS=1.17*SU
Second, the stress amplitude Sbe of the fatigue limit was estimated by the tensile strength SU.
For medium and high-strength steels, the fatigue limit Sbe will increase linearly with the
increase of the tensile strength SU, that is: Sbe/SU = constant. There is a limit to this proportional
relationship, and this limit is called the "critical ultimate strength". When the tensile strength
of the material exceeds the critical ultimate strength, the fatigue limit stops increasing.
Table 3.6 is about material type Sbe number of cycles critical ultimate strength.
Table 3.6 Conversion of Sbe and SU
Material type (Steel) Sbe Cycle times
Ferrite
0.58*SU 106
Ferrite + Pearlite
0.38*SU 106
Pearlite
0.38*SU 106
Untempered martensite
0.26*SU 106
Tempered martensite
0.55*SU 106
Page 55
Method and implementation
53
Tempered Martensite +
Tempered Bainite
0.5*SU 106
Tempered Bainite
0.5*SU 106
Austenite 0.37*SU 106
The mold material’s SU is 2250 MPa, So the SN- Curve is shown in Figure 3.22.
Figure 3.22 SN-curve
Put the SN-curve into the Material properties in Fatigue simulation as the Figure 3.23 shown.
Page 56
Method and implementation
54
Figure 3.23 Details of material
3.2.2.2 Loading and Run
The lifetime of the model is set 1 million times. So Right Click Loading and choose Add Event.
Then put the cycle as 100,000 with LR=-1 type as shown in Figure 3.24. Then run the analysis.
Page 57
Method and implementation
55
Figure 3.24 Set Event
3.2.3 Thermal testing
Moldflow® analysis is to use the current CAE software (Moldflow®, C-Mold®, Z-Mold®, etc.) to
carry out finite element simulation on the process of injection molding, pressure holding,
cooling and warping of plastic parts.
Using Moldflow® achieves the thermal testing analysis to know what design is adapted for the
SLM method to get the best cooling efficiency, or more specifically, to get the least time used in
a cycle.
3.2.3.1 Boundary element method derivation
Thermal testing or Cool in Moldflow® is a 3D model analysis that uses BEM numerical methods
(Boundary Element Method). And the temperature in the mold is determined by combining the
effects of all the sources. The BEM method uses all boundaries as a heat source (obtained / loss)
during the solution from a physical perspective.
The equilibrium temperature field of the three-dimensional mold can be expressed by the
Laplace equation:
where:
is the temperature.
is the Laplace operator?
represents the surface area and the inside of the mold.
Page 58
Method and implementation
56
The heat flux from the part can be used as the boundary condition of the steady state boundary
element solution to calculate the mold surface temperature. The boundary element method
(BEM) determines the temperature on all surfaces of the mold (that is, the outer surface, parts,
and cooling pipe surfaces), and then uses boundary element integration to calculate the internal
temperature of the mold. This can accurately represent the results of cooling analysis.
3.2.3.2. Model
Click (Home tab > Import panel > Import). Choose the Component model as shown in
Figure 3.25 Then click Next to the Import Wizard pages, choose the analysis type by selecting
the appropriate radio button, then click Finish to close the dialog.
Figure 3.25 Import
After that, make sure the Mold Type is set to multi-cavity, then click (Geometry tab >
Feed System panel > Import Runners) to import the runners. The import of the cooling
channel is the same as the runner. So, Figure 3.26 displays the different editions of the core
(1,2,3,4,5) and cavity (6,7) injection systems. Table 3.7 shows the details of different versions.
Much more views are shown in the appendix.
Page 59
Method and implementation
57
Table 3.7 Data of channels of different models
version diameter of
channel(mm)
diameter of input
and output
channel(mm)
number of
channels
1(core) 5 10 1
2(core) 5 5 1
3(core) 5 5 1
4(core) 5 5 2
5(core) 5 5 2
6(cavity) 5 5 1
7(cavity) 5 5 2
Page 60
Method and implementation
58
Page 61
Method and implementation
59
Figure 3.26 Different editions of core (1,2,3,4,5) and cavity (1,2)
Page 62
Method and implementation
60
3.2.3.3 Material
Polypropylene (PP) is a widely used translucent and semi-crystalline thermoplastic polymer
with good chemical resistance and resistance to many chemical substances.
The Pressure-Volume-Temperature (PVT) properties of polymers are critical to both
engineering physics and polymer physics. The PVT diagram describes the specific volume as a
function of pressure and temperature. There is a thermal transition in the polymer. Figure 3.27
shows the PVT characteristics and thermal properties of PP. It is clear that PP has a good heat
resistance and can be used in a high-temperature environment below 100 degrees for a long
time. The temperature will not be significantly deformed at about 150 degrees. Moreover, once
reaching a certain temperature, the PP particles will melt quickly, and all can be transformed
into a molten state within a few degrees. As shown in Figure 3.27, because PP has a low melt
viscosity, it also has good fluidity and is particularly suitable for injection molding.
Taking into account the products produced by this mold, the good fluidity of the PP material
and the characteristics of quickly entering the molten state at high temperatures meet the needs
of rapid production. And its own mechanical characteristics (Figure 3.28) will also guarantee
the quality of the product.
Figure 3.27 PVT properties and Thermal properties
Page 63
Method and implementation
61
Figure 3.28 Mechanical properties
3.2.3.4 Precision and Simulation
After determining the method to be used and the selected material, use the analysis wizard of
the Moldflow® analysis to set it step by step (Figure 3.29) to the steps and choose the highest
accuracy, level 3, in Accuracy (Figure 3.30) step to selected to ensure that the small features of
the model, such as rounded corners and radius, can be displayed, and different versions of the
model are required to give very detailed results, such as hot spots in the cooling analysis results,
for comparison. Finally, click the analysis button to obtain the data. For the specific details
between the steps, please refer to the appendix.
Figure 3.29 Analysis wizard
Figure 3.30 Accuracy
Page 64
Finding and analysis
62
4 Findings and analysis
This chapter presents results from the simulations of each redesign concepts developed in the
last chapter. This section presents the results of the simulations of the seven concepts, the
comparison between them and finally the findings obtained.
4.1 Static & Fatigue analysis
4.1.1 Static analysis
This section presents the results of the analysis of:
1. Stress
2. Displacement
4.1.1.1 Stress
Figure 4.1 shows the results (including maximum and minimum) of different models performed
in stress testing in the same 50t load (more setting details in Chapter 3.2.1.3). It’s obvious that
the initial cavity takes the lowest stress, the maximum of the stress is only 184.4 MPa. In cavity
designs, the initial design also performs impressively, it only takes a maximum 105.9 MPa.
Page 65
Finding and analysis
63
Page 66
Finding and analysis
64
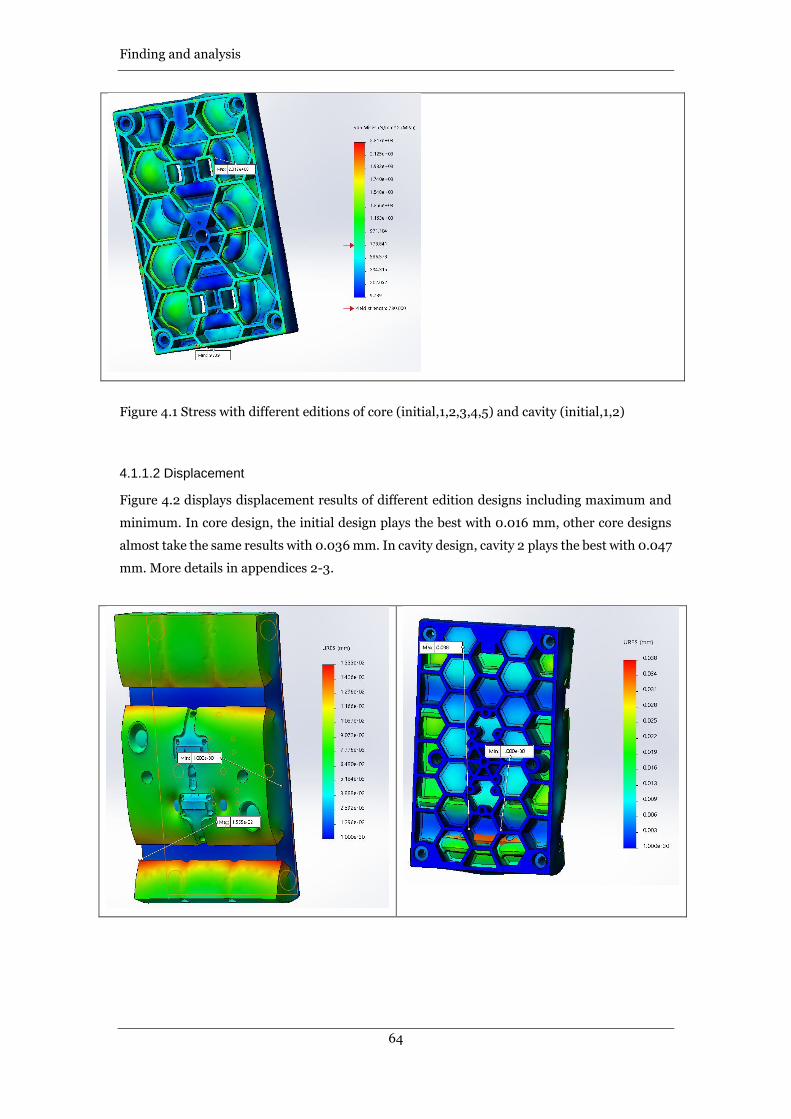
Figure 4.1 Stress with different editions of core (initial,1,2,3,4,5) and cavity (initial,1,2)
4.1.1.2 Displacement
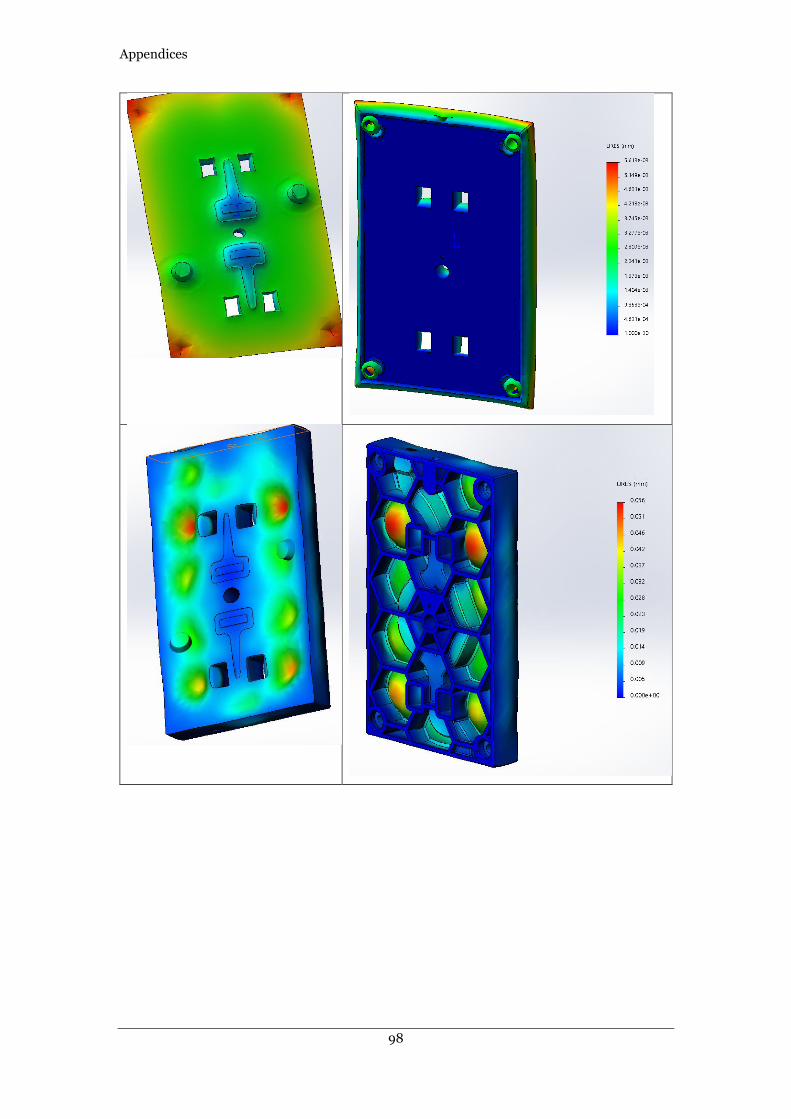
Figure 4.2 displays displacement results of different edition designs including maximum and
minimum. In core design, the initial design plays the best with 0.016 mm, other core designs
almost take the same results with 0.036 mm. In cavity design, cavity 2 plays the best with 0.047
mm. More details in appendices 2-3.
Page 67
Finding and analysis
65
Page 68
Finding and analysis
66
Figure 4.2 Displacement with different editions of core (initial,1,2,3,4,5) and cavity (initial,1,2)
4.1.2 Fatigue analysis
Because each cavity and core have the same results, so this part only shows the core 1 result.
Here are some very interesting results shown in Figure 4.3. if the Load is the designing load
(500,000 N), the cavity model will not get any damage percentage in setting cycle time. The
results of the core model are the same as the cavity model. The results show the same even
though the load is 5,045,000 N.
Page 69
Finding and analysis
67
Figure 4.3 Results of fatigue (Loads less than 5,045,000 N)
However, if the load increases a few from 5,045,000 N as shown in Figure 4.4, it will cause some
parts of the model to be broken. Just like the circle in Figure 4.4, the total life (cycle) is only 997
times, which completely does not meet the processing requirements under this load condition.
Figure 4.4 damage results of fatigue with large Load with core design and cavity design
Page 70
Finding and analysis
68
4.1.3 Comparison
According to the results from the stress analysis, core v5 and cavity v2 are the most suitable for
detected needs.
Table 4.1: Core and Cavity simulation data. For more information read Appendix 2-3.
Versions Mass (g) Stress (MPa) Deformation (mm)
Core initial design 9137 181.4 0.016
Core v1 5805 211,9 0,038
Core v2 5865 246,3 0,036
Core v3 5937 245,6 0,036
Core v4 5720 245,2 0,038
Core v5 5692 236,4 0,035
Cavity initial design 6071 105.9 0.056
Cavity v1 3056 318,4 0,056
Cavity v2 3075 243,4 0,047
As Table 4.1 shown, for the cores, the weight is reduced by up to 40% (compared with the Core
initial design). The deformations of all the cores are tiny, where the difference between the
highest and lowest are no more than 3 micrometers. Core v1 appears to be the strongest as its
stress is the lowest. Core v3 is the heaviest and also one of the weakest. Core v5 is the most
effective one for being the lightest one, lowest deformation and second rate at stress.
For the cavities, the mass is almost half of the original. While cavity v2 is 19 g heavier than v1,
its stress and deformation are better.
The material LaserForm Maraging steel (B) has incredible mechanical characters, especially
Ultimate tensile strength which is shown in chapter 3.2.1.1, and the fatigue results display that
the redesign model can perfectly work in the whole designing lifetime unless the load taken is
too larger than setting load.
Page 71
Finding and analysis
69
Therefore, the static testing proved that the redesign models, especially core v5 and cavity v2,
through the use of excellent material and design, not only reduces an amount of weight of model
but also ensure the satisfying performance of the mold during processing.
4.2 Thermal testing
In this section shows the cooling analysis on the model. Cooling analysis will compare different
results of editions obtained by performing Moldflow® to discuss and get the conclusion.
4.2.1 Cooling
In the entire molding cycle, cooling time accounts for about 80%. Therefore, for mold products
that require relatively high production efficiency, such as the one used in this research work, it
is absolutely necessary to reduce the cooling time and shorten the production cycle. Each sub-
chapter in Cooling first introduces and interprets the results of this part of the analysis, and
then compares the different or the same results shown in each version.
4.2.1.1 Circuit coolant temperature
The circuit coolant temperature shows the temperature of the coolant in the cooling circuit.
Generally, the inlet and outlet temperature does not exceed 3 degrees.
As shown in Figure 4.5, although the temperature difference of each design does not exceed 1
degree, it is obvious that different designs will lead to different heat dissipation effects.
According to the analysis and comparison of the results of the pictures, in the core part, the
temperature difference between the inlet and outlet of version 5 is the smallest, and in the cavity
part, the temperature difference between the inlet and outlet of version 6 is the smallest.
Page 72
Finding and analysis
70
Figure 4.5 Circuit coolant temperature with different editions of core (1,2,3,4,5) and cavity (1,2)
4.2.2.2 Circuit flow rate + Circuit Reynolds number
The flow rate of the coolant in the cooling system is referred to as the circuit flow rate. The flow
rate of the version 3 and version 2 models in the branch part is only around 20% of the
performance of the coolant pump, as seen in Figure 4.6 Circuit flow rate with different editions,
which obviously affects the speed of heat dissipation.
The size of the flow rate has very little impact on the cooling rate as long as turbulence is
achieved (heat dissipation). Realizing the coolant's Reynolds number in the cooling circuit
Page 73
Finding and analysis
71
yields the Circuit Reynolds number. Version 1 and version 3 did not follow the turbulence norm
(Reynolds number greater than or equal to 4000) in the circuit branch, with values of more
than 2000 and similar to 4000, respectively, as seen in Figure 4.7 Circuit Reynolds number.
Heat dissipation from the cavity is less affected by Reynolds numbers below 4000 since the flow
is laminar.
When the circuit flow fate result shown in Figure 4.6 Circuit flow rate of different editions is
combined with the circuit Reynolds number results shown in Figure 4.7 Circuit Reynolds
number, it is discovered that the edition1 and edition 2 models achieve turbulence at the inlet
and outlet as well as the first component part, but the flow rates of the remaining tributaries do
not. In version 4, version 5 and version 6, both the flow velocity and the Reynolds number are
constant, exceeding the turbulence criteria and meeting the ideal Reynolds number (10000).
On the other hand, the parallel connection will cause uneven cooling of the system, which will
make the cooling of the parts very uneven. In this regard, the models designed by version 3,
version 1 and version 7 are not very good.
Page 74
Finding and analysis
72
Figure 4.6 Circuit flow rate with different editions of core (1,2,3,4,5) and cavity (1,2)
Page 75
Finding and analysis
73
Figure 4.7 Circuit Reynolds number with different editions of core (1,2,3,4,5) and cavity (1,2)
4.2.2.3 Warp, differential cooling
Cooling time is too little, material is too hot, lack of cooling around the instrument, wrong water
temperature (parts curve inward to the hot side of the tool), and irregular shrinkage between
parts areas are the major causes of warpage. As seen in Figure 4.8, the cooling performance of
various models results in varying degrees of cooling deformation, resulting in warpage. While
all warpages are little, the 4th and 5th editions' warpage (bottom Figure) are the tiniest. This is
due to the design's twin cooling channels. The cavity's portion is more favorable to cooling.
Figure 4.9 depicts the average temperature of the chemical unit's bottom surface throughout
the period. The temperature difference between the top and bottom of the 5th edition (bottom
Figure) is the lowest, the most stable, and the cooling is the greatest, according to the
comparison of the four models of the model. This also confirms that the cooling element is the
smallest study in the warpage of the 5th edition (bottom Figure) model.
Page 76
Finding and analysis
74
Figure 4.8 Warpage indicator, differential cooling with different editions of core (1,2,3,4,5) and
cavity (1,2)
Page 77
Finding and analysis
75
Figure 4.9 Temperature, part (Bottom) with different editions (1,2,3,4)
4.2.2 Comparison
As shown in Table 4.2 and Figure 4.10, under the same design, higher Melt temperature and
coolant temperature require a longer injection cycle. Increasing the coolant temperature and
increasing the mold temp will cause the cycle to prolong. Case 0 refers to the cycle time when
the component in the initial design is not designed with a cooling system. Among all the
versions, the cooling efficiency shown by case 8 is the best. Compared with the initial design
(no cooling pipes are designed), the cooling efficiency is improved by nearly 15%. Even
compared to case 8 with the previous version, the cooling efficiency has increased by 0.5% to
6.5%.
Page 78
Finding and analysis
76
Table 4.2 Parameters used for Moldflow cooling analysis to predict cycle time.
Case Version model Melt
Temp
(°C)
Coolant
Temp (°C)
Mold
Temp (°C)
Ejection
Temp (°C)
Part
thickness
(mm)
Predicted
Cycle time
0 No cooling
(Initial design)
220 25 50 124 2.0 26.11
1 1 220 25 50 124 2.0 22.50
2 2 220 25 50 124 2.0 22.41
3 3 220 25 50 124 2.0 22.40
4 4 220 25 50 124 2.0 21.42
5 5 220 25 50 124 2.0 21.36
6 6 220 25 50 124 2.0 22.35
7 7 220 25 50 124 2.0 22.40
8 Core version
5+ cavity
version 6
220 25 50 124 2.0 21.20
9 Core version 5
+cavity
version 7
220 25 50 124 2.0 21.75
Page 79
Finding and analysis
77
Figure 4.10 Graph of cycle time variation
Based on Chapter 2.2.4, in designing waterways, especially for conformal cooling, the SLM
method design scheme has shorter use time, faster optimization time, shorter production
process, and cheaper than CNC method. The most important thing is that the SLM method can
design a lot of cooling that cannot be processed by the CNC method, such as case 8, cause as
shown in the Solidworks® section, it is impossible to use a lathe to turn out tooling with a
complex cooling system and honeycomb design of cavity and core.
All in all, using SLM to design the cooling system is much easier and better to get a nice result
rather than CNC cause the engineers do not need to consider whether the structure of the
waterway is too complex.
Page 80
Discussion and conclusions
78
5 Discussion and conclusions
At the beginning of the study, the company had already provided the initial cad model. So, the
team has reached an agreement that there is no need to redesign the entire injection tooling.
After all, it will be incredibly expensive if the whole tooling is made by SLM. It only needs to
optimize the structure of the A plate to the B plate, print it out, and then assemble it with the
tooling part. The main purpose of this study is to compare the advantages and disadvantages of
the SLM model and the CNC model.
The answer to research questions Q1-Q4 which are shown in chapter 1.2 are separately shown
in below:
“Q1: What material should the tooling be made of?”
Answer: In the communication with Plastsystem AB, LaserForm Maraging steel (B) is selected
to be the tooling material because of its superior physical properties, which is shown in chapter
3.2.1.1.
“Q2 What plastic components are suitable for printed tooling.?”
Answer: Taking into account the characteristics of the produced products and injection molds,
PP is a relatively suitable material, which can meet the needs of processing finished products in
a short time (almost 21 Secs per cycle time) and ensure that the production quality meets the
needs.
“Q3 How should the tooling be designed to be more convenient after being
produced through AM rather than the conventional way? (Not only manufacture
the mold. What about Cycle times? Handling in production?)”
Answer: SLM technology does not require traditional fixtures and multiple procedures and can
quickly and accurately create parts with complex shapes, thereby greatly reducing processing
procedures and shortening the processing cycle. Moreover, the more complex the product
structure, the more significant the impact of its manufacturing speed. As mentioned in Chapter
2, taking into account the advantages of conformal waterways compared with conventional
waterways, better waterways can be evenly distributed according to the product, improving heat
dissipation efficiency, shortening the production cycle, and improving production efficiency.
What is more, the additivity of the process allows for material savings while also allowing the
reuse of waste materials not used in the manufacturing process, such as metal resins (estimated
recoverability of metal powders is between 95-98%). And the digital design combined with the
SLM method is designed in the form of digital files, which facilitates the sharing, easy
modification and customization of parts and products, thus shortening the development cycle.
Page 81
Discussion and conclusions
79
“Q4 What is the process performance?”
Answer: In Chapter 4, Table 4.2 shows that the case 8 design (improve model) is the best, whose
cycle time is only 21.20 secs, compared with the initial design (CNC model)’s 26.11 secs, which
means the improve model can decrease 18.8% production time per product.
So, for a mature production line, a shorter design cycle, lighter product weight and better mold
products represent saving money on material use, time, design, etc.
5.1 Discussion of method and implementation
In the SLM method, to use Solidworks® to redesign the model, it can be considered how to make
the structure maintain excellent physical properties while reducing the weight. When using
Moldflow® to design the cooling channel, a variety of design considerations were carried out,
from the design of parallel pipes at the beginning to the more reasonable design of series double
pipes after optimization. The analysis chapter shows that because of the advantages of water
channel design, the SLM method will make the cycle time shorter.
5.1.1 Strategy
This part starts with a demonstration of the tool and follows up on a strategy that explains how
to tackle the problem plus limitations about obstacles that have to be solved.
The reason to have a strategy was to simplify product development. This saved time and work
on redesigning the mold. When designing a variety of similar products, a practical way is to
have standard modules that all the products follow and then focus on the details. Therefore,
every core and cavity have the same lattice structure, pipe threads and cooling channel diameter.
On the other hand, having more limitations may decrease possible ideas that will not be
available.
5.1.1.1 Static analysis
By comparing the conclusions of the Solidworks® simulation analysis of different models, the
best core model and cavity generated under the SLM process are obtained, which will be
discussed in detail in the last part of Chapter 4.1. At the same time, according to the comparison
results, the advantages and disadvantages of the SLM process and the CNC process in the
production mold are shown.
5.1.1.2 Thermal analysis
By comparing the conclusions of the Moldflow® simulation analysis using different models, the
best core model and cavity produced under the SLM process are obtained, and then they are
combined to obtain the best cooling case, which is discussed in detail in the last part of this
Page 82
Discussion and conclusions
80
chapter. At the same time, according to the comparison results, the advantages and
disadvantages of the SLM process and the CNC process in cooling production are shown.
5.1.2 Stress & Fatigue testing
5.1.2.1 Solidworks
This thesis work gives seven different versions of design and compares each other to prove how
the new design is better. The method to calculate SN-curve is a way to show the material
properties are suitable for the SLM design.
This mold can be designed in many ways and there could be better ideas than the ones that are
mentioned in this thesis work. The lattice structure, which was the honeycomb proved to be
strong and stable for this area according from the data from the stress simulation however, it
can’t be said that it is the best one as it was the only one used for every version of core and cavity
as there may be lattice structures that could make even stronger and lighter. One thing to
mention though is that all types of lattice structure are not possible to apply or are even practical
depending on the design, particularly in this case where the core and cavity are exposed to huge
amounts of load when closing the mold.
5.1.2.2 Stress testing
Solidworks® stress simulation is a useful tool for testing the sustainability of products. It may
not always give an accurate picture of the situation, but it gives an indication of how it could be.
The redesigns of the core and the cavity have proved to be sustainable against intensive loads.
The differences on the cores however are relatively small when looking at the stresses and the
deformations are minimal, while the differences on the cavities are larger. A wider selection of
more different designs could have given a more widespread data.
5.1.2.3 Fatigue testing
Given that all the redesigns had relatively low stresses despite a large mass reduction compared
to the original mold parts, it did not give the data needed to compare the fatigue. If it did, it
could have shown how sustainable these redesigns really are. As it seems in these conditions,
the redesigns could theoretically take an unlimited number of cycles.
5.1.3 Thermal testing
In the design of the cooling, the initial idea was to design the pipe as thick as possible according
to Newton's law of cooling. Unfortunately, it is not possible to create a conformal cooling
channel due to structural limitations and limited space. Besides, the simulation results for
version 1 and version 2 Moldflow® are not very good. Because the main purpose of this thesis
work is to compare the CNC model with the SLM model. The design direction is to consider how
Page 83
Discussion and conclusions
81
to make the complex structure, which is hard to use the CNC method, with excellent cooling
efficiency. The case 8 model was born based on this idea.
5.1.4 Evaluation
The thesis work uses 5 different versions of cores and 2 different versions of cavities that are
evaluated from various aspects. The reason why this approach is useful is that this project
redesigns the model in several aspects including using new lattice structure to reduce the weight
of cavity and core. What is more, this approach can design very complicated water channels
that are difficult to use CNC to process to achieve better results.
Of course, if the number of redesigned versions becomes larger, the method will be more
convincing, but considering that 7 different versions are enough to answer the research
questions, and time is not enough to produce more versions, this SLM method is used in this
project. On the other hand, if the CNC versions of waterway designs give more different versions
like the SLM method, the comparison of results will be more reasonable to answer the same
research questions.
5.2 Discussion of findings
5.2.1 Static and Fatigue analysis
Through comparing different version designs as shown in chapter 4.1, the strategy is successful
to show that weight of case 8 (8748g) is only 57% of the initial design (15208g). Besides, all The
tolerable pressure of the redesigned mold is basically twice that of the original design (CNC
design). What is more, the Fatigue analysis results confirm that the structure and materials of
the redesign model meet the service life needs of the design, and the performance is very good.
5.2.2 Thermal analysis
The Figure 3.26 is the views of the version 7 model, which is obviously hard to make by CNC
cause the pipe includes many small bends especially the cooling is in the tooling. And unlike
CNC, SLM method does not have to take into account the complexity of the structure in its
processing, since it is done by 3D printing. Table 4.2 shows lower coolant temperature and
lower Melt temperature will decrease the cycle time, and the most important thing is that based
on the same conditions, the cooling efficiency of the case 8 model improves almost 15% rather
than the initial design. So, in cooling design, the SLM method will be better and easier than the
CNC method.
Page 84
Discussion and conclusions
82
5.3 Conclusions
Through simulation of Moldflow®, the analysis shows complicated cooling channels do have a
better effect rather than conventional design. These unusual designs are due to the SLM method
having the ability to create more complex geometries that may be impossible for traditional
manufacturing methods.
Results of stress analysis and fatigue analysis display that not only the mold material LaserForm
Maraging steel (B) is incredibly suitable for injection models to make it have a long lifetime but
also the structure designed with less weight for better injection and ejection characters have
better stress resistance.
The performance of case 8 in analysis is the best means that further investigation would be to
actually print out the mold and test how it works in reality.
All in all, the SLM method does have advantages that cannot be ignored in terms of cooling
system designing and portable structure design. The companies can consider using the SLM
method to optimize the process produced in the design of injection mold.
Page 85
Future Work
83
6 Future Work
This thesis work provides insights into the possibility of shifting from commercially used
process methods to AM, which is an important study for the future development and
implementation of AM in the industry.
The cooling time in the injection molding process accounts for about 50% to 80% of the product
molding cycle. Therefore, the injection mold cooling system is a key factor that directly affects
the quality and production efficiency of plastic parts. The design and optimization of the mold
cooling system are very important for injection molding. The SLM design method can analyze
the heat dissipation of the mold and the waterway through Moldflow® analysis, find out the key
problem parts that affect the molding cycle, and design a conformal waterway plan for it,
shorten the manufacturing time, and improve the quality of manufacturing efficiency. This
design method can also adopt an irregular shape design for conformal waterways to improve
heat dissipation efficiency. On the other hand, the future development of AM technology,
especially the advancement of SLM technology, will make the performance of metal printed
parts as good as forged parts. The complexity of metal printing is beyond the reach of traditional
manufacturing.
Compared with using milling machine drilling or turning methods, new injection tooling
manufactured with SLM technology can bring manufacturers better products, faster production
efficiency and higher corporate benefits. In this era, new molds manufactured by SLM may be
the key to mold manufacturing companies breaking through the predicament in the foreseeable
future.
Page 86
References
84
7 References
[1] Hwaseop Lee, Kwangyeol Ryu, Youngju Cho(2017), A Framework of a Smart
Injection Molding System Based on Real-time Data, Procedia Manufacturing,
Volume 11 Pages 1004-1011, ISSN 2351-9789, [online] Available at:
https://doi.org/10.1016/j.promfg.2017.07.206. [Accessed 6 March 2021].
[2] Equbal, Azhar & Sood, Anoop Kumar & Shamim, Mohammad. (2015). Rapid
tooling: A major shift in tooling practice. Manufacturing and Industrial
Engineering. 14. 10.12776/mie.v14i3-4.325. [online] Available at: <DOI
10.12776/mie.v14i3-4.325> [Accessed 6 March 2021]
[3] T. Wu, Suchana A. Jahan, Y. Zhang, J. Zhang, H. Elmounayri, A.
Tovar.(2017) Design Optimization of Plastic Injection Tooling for Additive
Manufacturing, Procedia Manufacturing, Volume 10, Pages 923-934, ISSN 2351-
9789, [online] Available at: https://doi.org/10.1016/j.promfg.2017.07.082.
[Accessed 6 March 2021].
[4] 3D systems (2019), “LaserForm® Maraging Steel (B)”, [PDF], Available: 3D
Systems, [PDF], 3D-Systems_LaserForm_Maraging Steel
(B)_DATASHEET_USEN_2019.03.15_WEB.pdf (3dsystems.com)(Acc. 6
April 2021)
[5] Kauffer, PH (2010), Injection Molding: Process, Design, and Applications, Nova
Science Publishers, Incorporated, Hauppauge. Available at:
<https://ebookcentral-proquest-com.proxy.library.ju.se/lib/jonhh-
ebooks/detail.action?pq-origsite=primo&docID=3018198# >. [14 March
2021].
[6] Chen, S, & Turng, L (eds) (2019), Advanced Injection Molding Technologies, Hanser,
München. Available at:< https://ebookcentral-proquest-
com.proxy.library.ju.se/lib/jonhh-ebooks/reader.action?docID=6010421 >.
[19 March 2021].
[7] Kazmer, DO (2016), Injection Mold Design Engineering, Hanser, München.
Available at:< https://ebookcentral.proquest.com/lib/jonhh-
ebooks/detail.action?docID=6010355. >. [19 March 2021].
[8] B. H. Lee & B. H. Kim (1995) Optimization of Part Wall Thicknesses to Reduce
Warpage of Injection-Molded Parts Based on The Modified Complex Method, Polymer-
Plastics Technology and Engineering, 34:5, 793-811, Available at: <DOI:
10.1080/03602559508009600>. [24 March 2021]
Page 87
References
85
[9] Runner and Gating Design Handbook: Tools for Successful Injection
Molding. (2004). SciTech Book News, 28(4), 166–. Ringgold, Inc.
[10] Wang, M, Chang, R, & Hsu, C, (2018), Molding Simulation: Theory and Practice,
Hanser, München. Available
at:<https://ebookcentral.proquest.com/lib/jonhh-
ebooks/detail.action?docID=6010362>. [25 March 2021].
[11] Tang, Y, Gao, Z, & Zhao, Y. (2019). Design of Conformal Porous
Structures for the Cooling System of an Injection Mold Fabricated by
Additive Manufacturing Process. Journal of Mechanical Design (1990), 141(10).
https://doi.org/10.1115/1.4043680
[12] Zhang, Baicheng, et al. (2012), “Studies of Magnetic Properties of Permalloy
(Fe–30%Ni) Prepared by SLM Technology.” Journal of Magnetism and Magnetic
Materials, vol. 324, no. 4, Elsevier B.V, pp. 495–500, doi:
10.1016/j.jmmm.2011.08.030.
[13] Gu, Dongdong. (2015). Laser Additive Manufacturing of High-Performance
Materials. 1st ed. 2015, Springer Berlin Heidelberg, doi:10.1007/978-3-662-46089-
4.
[14] Brandt, Milan. (2017). Laser Additive Manufacturing: Materials, Design,
Technologies, and Applications Cambridge: Elsevier Science & Technology.
[15] Gupta, M. (2019). 3D Printing of Metals: A Reprint of Articles from the Special Issue
Published in the Journal “Applied Sciences.” MDPI.
https://doi.org/10.3390/books978-3-03921-342-9
[16] Zhang, Bi; Li, Yongtao; Bai, Qian (2017). "Defect Formation Mechanisms in
Selective Laser Melting: A Review". Chinese Journal of Mechanical Engineering.
pp. 515–527. doi:10.1007/s10033-017-0121-5. Redwood, B, Schöffer, F. and
Garret, B. (2018). The 3D printing handbook. Amsterdam: Coers & Roest.
[17] Marin, F, de Souza, A. F, Ahrens, C. H, & de Lacalle, L. N. L. (2021). A new
hybrid process combining machining and selective laser melting to
manufacture an advanced concept of conformal cooling channels for plastic
injection molds. International Journal of Advanced Manufacturing Technology, 113(5-
6), 1561–1576. https://doi.org/10.1007/s00170-021-06720-4
[18] Dizon, J.R.C, Valino, A.D, Souza, L.R. et al. (2019) Three-dimensional-
printed molds and materials for injection molding and rapid tooling
applications. MRS Communications 9, 1267–1283. https://doi-
org.proxy.library.ju.se/10.1557/mrc.2019.147
Page 88
References
86
[19] Scopigno, R, P Cignoni, N Pietroni, M Callieri, and M Dellepiane. (2017).
“Digital Fabrication Techniques for Cultural Heritage: A Survey.” Computer
Graphics Forum 36 (1): 6–21. https://doi.org/10.1111/cgf.12781.
[20] Tan, Chaolin, et al. “Design and Additive Manufacturing of Novel
Conformal Cooling Molds.” Materials & Design, vol. 196, Elsevier Ltd, 2020,
p. 109147–, doi: 10.1016/j.matdes.2020.109147.
[21] Kuo, CC, Jiang, ZF, Yang, XY. et al (2020). Characterization of a direct metal
printed injection mold with different conformal cooling channels. Int J Adv
Manuf Technol 107, 1223–1238. https://doi.org/10.1007/s00170-020-05114-2
[22] Phull, G.S. & Kumar, S. & Walia, R.S. (2018). Conformal cooling for molds
produced by additive manufacturing: A review. International Journal of Mechanical
Engineering and Technology. 9. 1162-1172.
[23] Hiller, Jonathan, and Hod Lipson. (2009). “Design and Analysis of Digital
Materials for Physical 3D Voxel Printing.” Rapid Prototyping Journal 15 (2): 137–
49. https://doi.org/10.1108/13552540910943441.
[24] Advincula, R, Souza, L, Dizon, J, Chen, Q, Valino, A, & Espera, A. (2020).
3D Printed Injection Molds Using Various 3D Printing Technologies.
Materials Science Forum, 1005, 150–156.
https://doi.org/10.4028/www.scientific.net/MSF.1005.150
[25] MARTIN, J.H, YAHATA, B.D, HUNDLEY, J.M, MAYER, J.A,
SCHAEDLER, T.A. and POLLOCK, T.M, 2017. 3D printing of high-
strength aluminium alloys. Nature, 549(7672), pp. 365-369J.
[26] Todaro, C.., Easton, M.., Qiu, D., Zhang, D., Bermingham, M. ., Lui, E. .,
Brandt, M., StJohn, D. ., & Qian, M. (2020). Grain structure control during
metal 3D printing by high-intensity ultrasound. Nature Communications, 11(1),
142–142. https://doi.org/10.1038/s41467-019-13874-z
[27] Bai, Xu, Yun Liu, Gangbo Wang, and Changcun Wen. (2017). “The Pattern of
Technological Accumulation: The Comparative Advantage and Relative
Impact of 3D Printing Technology.” Journal of Manufacturing Technology
Management 28 (1): 39–55. https://doi.org/10.1108/JMTM-10-2016-0136.
[28] Weller, Christian, Robin Kleer, and Frank T Piller. 2015. “Economic
Implications of 3D Printing: Market Structure Models in Light of Additive
Manufacturing Revisited.” International Journal of Production Economics 164: 43–
56. https://doi.org/10.1016/j.ijpe.2015.02.020
Page 89
References
87
[29] Huang, Runze & Riddle, Matthew & Graziano, Diane & Das, Sujit &
Nimbalkar, Sachin & Cresko, Joe & Masanet, Eric. (2017). Environmental and
Economic Implications of Distributed Additive Manufacturing: The Case of
Injection Mold Tooling. Journal of Industrial Ecology. 21. 10.1111/jiec.12641.
[30] Abbès, B, Abbès, F, Abdessalam, H, & Upganlawar, A. (2019). Finite element
cooling simulations of conformal cooling hybrid injection molding tools
manufactured by selective laser melting. International Journal of Advanced
Manufacturing Technology, 103(5), 2515–2522. https://doi.org/10.1007/s00170-
019-03721-2
[31] P. M. Kurowski, “Engineering Analysis with SolidWorks Simulations 2014”,
SDC Publications, 2014 31
Page 90
Appendices
88
8 Appendices
Appendix 1: Pipe threads
Appendix 2: Stress with different editions of core (initial,1,2,3,4,5) and cavity (initial,1,2)
Appendix 3: Displacement with different editions of core (initial,1,2,3,4,5) and cavity (initial,1,2)
Appendix 4: Temperature, part (Top) with different editions of core (1,2,3,4,5) and cavity (1,2)
Appendix 5: Properties of material
Appendix 6: Cooling models views
Appendix 7: Detail of setting in Moldflow
Appendix 8: CES of the material
Page 91
Appendices
89
Appendix 1: Pipe threads
Link: Fitting-Threads.pdf (parker.com)
Page 92
Appendices
90
Link: How To Identify British Pipe Threads - V-Flow Solutions
Page 93
Appendices
91
Appendix 2: Stress with different editions of core (initial,1,2,3,4,5)
and cavity (initial,1,2)
Page 97
Appendices
95
Appendix 3: Displacement with different editions of core
(initial,1,2,3,4,5) and cavity (initial,1,2)
Page 102
Appendices
100
Appendix 4: Temperature, part (Top) with different editions of core
(1,2,3,4,5) and cavity (1,2)
Page 103
Appendices
101
Appendix 5: Properties of material
Page 104
Appendices
102
Appendix 6: Cooling models views
core cooling models views of edition 1
core cooling models views of edition 2
Page 105
Appendices
103
core cooling models views of edition 3
core cooling models views of edition 4
Page 106
Appendices
104
core cooling models views of edition 5
cavity cooling models views of edition 6
cavity cooling models views of edition 7
Page 107
Appendices
105
Appendix 7: Detail of setting in Moldflow
Page 108
Appendices
106
Appendix 8: CES of the material