Design and Optimal Clearing Model of Inter-Regional and Inter-Provincial Power Trading Mechanism Considering Network Constraints
Chuncheng Gao1,2, Shuhong Shi1,2, Mingzhu Yuan1,2, Hao Tan1,2*, Nan Kang1,2
1 NARI Group Corporation (State Grid Electric Power Research Institute), Nanjing, Jiangsu, 211000, China 2 Beijing Kedong Power Control System Co., Ltd., Beijing, Beijing, 100192, China
Abstract. The current inter-regional and inter-provincial power trading is organized by transaction path, and the buyers and sellers are the two regions or provinces through the transaction path, and the bidding range is small, which cannot optimize the allocation of resources in inter-provincial power trading, and it is difficult to break the provincial and regional barriers, therefore, this paper proposes the inter-regional and inter-provincial power market Therefore, this paper proposes an optimal clearing model for inter-regional and inter-provincial power market, which can expand the scope and scale of trading, realize sufficient market competition, give full play to the role of inter-regional and inter-provincial power trading, and realize the optimal allocation of energy resources in a larger scale, taking into account the network constraints.
1 Introduction
At present, inter-regional and inter-provincial power transactions are usually carried out in the form of bilateral negotiations and centralized transactions[1]. Centralized transaction can be performed in two ways, one is listed transaction, and the other is centralized bidding transaction. Although listed transaction is carried out in a market-oriented way, it is still unilaterally priced by the listed party. For centralized bidding transaction, despite the price is formed by bidding, the transaction is still carried out by means of a designated trading channel currently in the inter-regional and inter-provincial power market. Under this condition, the buyers and sellers are in two regions or provinces through the channel, which leads to small scope of participation in the bidding. Therefore, it is impossible to realize the optimization of large-scale resource allocation in inter-regional and inter-provincial power transaction, and also it is difficult to break provincial and regional barriers.
In order to optimize resource allocation in the inter-regional and inter-provincial power market, it is necessary to make market entities to access in a wider range and achieve full competition in a large scale. Therefore, there’s a need to break the organization model of single-channel transaction. This leads to realize multi-channel and full-scale network of centralized transaction organization. In China, the current inter-regional and inter-provincial transmission and distribution pricing system is based on the investment costs and reasonable income of transmission project, and the transmission party cannot participate as market entity in the market directly. The division of price zones requires government
department to lead further improvement of the transmission and distribution price system[2].
This paper establishes a multi-channel collaborative clearing model for inter-regional and inter-provincial market with the objective function of improving social welfare and promoting new energy accommodation. After that, this paper proposes the according collaborative clearing algorithm combined with mining space of channel transaction. Then this paper analyzes the validity of the model and algorithm based on actual calculation examples. The structure of the paper is as follows:
Firstly, this paper establishes an inter-regional and inter-provincial market clearing model to analyze the relevant constraints that affect the trans-regional clearing results. Then it proposes a maximum social welfare objective function that takes into account the transaction channel limit, and an inter-regional and inter-provincial market clearing algorithm to meet the constraints of safe and normal operation of the power grid. It also establishes a simplified power grid model based on PTDF[3].
Secondly, based on the joint clearing algorithm and the simplified power grid model in inter-regional and inter-provincial market, combined with actual calculation examples, this paper takes total social welfare as an indicator to analyze the advantages compared with the traditional clearing algorithm.
Finally, the result for joint clearing model is obtained by specifying the social welfare apportionment method. According to the result, the impact of different social welfare apportionment methods on the transaction results in the future is expected.
2 Inter-regional and inter-provincial power trading clearing models
In the traditional single-channel transaction organization, the transmission path and the corresponding transmission price are often used as a prerequisite for the transaction, rather than part of the transaction clearing constraint. At the same time, multiple transactions may frequently cause the transmission capacity of a certain section or interconnection line to exceed the limit in the actual transaction process.
There are coupling problems of transmission path in the transaction. Under the current transaction mechanism, the transmission capacity of the channel occupied by each transaction is manually allocated. This distribution method has the advantages of simple clearing mechanism and easy implementation of clearing rules. But from the perspective of global optimization, there may be certain social welfare that cannot be configured properly.
In order to solve the above problems, this article proposes a new transaction clearing model. This model takes into account the transaction costs of different transaction channels and makes the network loss as a component of the transaction clearing constraint. By considering the maximum social welfare of the transaction, the purpose of optimal allocation of power resources is achieved.
3 Integration of transaction flow and power flow
The commonly used ATC calculation method includes the continuous power flow method, the sensitivity analysis method, the transfer distribution factor method, etc. For the ATC calculation of the main channels in the inter-regional and inter-provincial area, the HVDC power flow model is usually used. This model uses the power transfer distribution coefficient (PTDF, Power Transfer Distribution Factors) to reflect the impact of any transaction in the entire network on the available transmission capability of a specific section. PTDF describes the changes in the power flow of each branch caused by the increase of the unit active power transmitted between two regions [4], which can be expressed as:
.l
l nn
PPTDF
P
(1)
It means when injecting power nP at node n, it
causes the power change of the corresponding line l to lP .
Therefore, for a power system with L branches and N nodes, then:
L N P PTDF P (2)
11 12 1
11 22
1 2
n
l l ln
PTDF PTDF PTDF
PTDF PTDF
PTDF PTDF PTDF
PTDF (3)
11 12 1
21 22 2
1 2
j
j
i i ij
P P P
P P P
P P P
P
(4)
In the formula, LP is the HVDC power flow of branch
L; PTDF is the power transmission distribution factor matrix of the system, which represents the distribution coefficient of the injected power on each branch when
power is injected at N different nodes for L branches; NP
is injected power of each node. Therefore, for a certain branch l, if the given available
transmission capability is ATClP and the power
transmission distribution factor is lPTDF , then the
maximum power that can be injected into the sending node of the branch with the branch ATC constraint can be expressed as[5]:
.max
ATCl
inl
PP
PTDF (5)
According to the ATC and distribution factors of the main inter-regional and inter-provincial channels/sections provided by the control center, the maximum transmission capability of the inter-regional and inter-provincial power transactions through the designated channels can be determined by formula (5).
4 Clearing method considering network constraints
After introducing the upper limit of trading space as a constraint into the clearance rules, there are seven basic rules for clearance constraints. One is equality constraint and the other four are inequality constraint.
(1) Power balance constraint between the purchaser and the seller. In the same transaction, taking the requirements of real-time power balance of the grid into account, the power of the purchaser and the seller should meet the power balance requirements after the network loss is converted, as shown in equation (6).
b s lossP P (6)
In the formula, bP is the total power of the purchaser,
sP is the total power of the seller, and loss is the
transmission network loss. (2) Node power balance constraint. For each node in
the network under the normal operation of the power system, the outgoing power should equal to the incoming power in real time, as shown in equation (7).
in outP P (7)
In the formula, inP is the total power flowing into the
node through the section or interconnection line connected to the node, and outP is the total power flowing out of the
E3S Web of Conferences 256, 01004 (2021)PoSEI2021
https://doi.org/10.1051/e3sconf/202125601004
2
node through the section or interconnection line connected to the node.
(3) Available capability constraint of the transmission channel. After all transaction pairs are dealt, the transmitted power on each channel should be less than the transmission capability constraint, as shown in formula (8).
tcP ATC (8)
In the formula, tcP is the power of the transmission
channel. ATC refers to the available transmission capability in the actual physical network on the basis of the existing transmission contract. This available transmission capability can be used for business. According to the definition, the available transmission capability is based on the existing transmission contract. It’s the maximum transmission power that can be used for commercial between regions or point-to-point. The calculation method of ATC is shown in equation (9):
- - -ATC TTC TRM ETC CBM (9)
In the formula, TTC is the total transfer capability, TRM is the transmission reliability margin, ETC is the existing transmission commitment, and CBM is the capacity benefit margin.
(4) The maximum limit of the power change for the transmission channel. The power change rate in the same transmission channel in a continuous time should not exceed the maximum limit, as shown in formula (10).
maxt tP P , (10)
In the formula, is the actual value of transmission
power change tP , and maxtP , is the maximum limit of
power change for transmission section or interconnection line.
(5) The number of power changes constraint per day for the transmission channel. Within a certain period, the number of power changes of a certain transmission channel should be less than the restricted value, as shown in formula (11).
maxt tN N , (11)
In the formula, tN is the actual value of the number
of transmission power changes, and maxtN , is the
maximum number of power changes allowed by the transmission section or interconnection line.
5 Process of clearing method
The transaction clearance process considering network constraints is as follows.
The first step is to group the various transactions that need to be cleared out of the current organization according to the power capacity available for the interconnection line and the relationship of path coupling. Then group them according to the path coupling characteristics.
The second step is to establish the electrical distance matrix of the nodes according to the actual power grid structure, and use the algorithm to calculate the electrical distances between nodes.
The third step is to enter the transmission cost matrix. The fourth step is to obtain the transaction result
according to the electrical distance between the nodes. Then calculate the total social welfare and optimize the result to obtain the range of feasible solutions.
6 Numerical test
Each figure should have a brief caption describing it and, if necessary, a key to interpret the various lines and symbols on the figure.
6.1 Scene setting
In this paper, we choose the inter-provincial power transactions from Northwest China to East China, and set two scenarios, one is to organize multiple "many-to-many" inter-provincial power transactions through a single channel, and the other is to organize a "many-to-many" inter-provincial power transaction through multiple channels. In both scenarios, the purchase and sale of electricity between the sending province of Northwest China and the receiving province of East China remains unchanged, and the available transmission capacity of the transmission channel remains unchanged. When multiple transactions are organized through a defined channel, the impact on total social welfare is compared for each transaction with different available transmission capacity.
6.2 Data Selection
In this paper, CPLEX is used as the solver, and the available transmission capacity of Northwest China power sales demand, East China power purchase demand, and Ling Shao HVDC and Ji Quan HVDC are selected from the public information in the cross-provincial power market disclosure for simulation, and the transmission price and network loss rate of Ling Shao HVDC and Ji Quan HVDC are selected from the transmission price scheme announced by the State Grid Corporation. With the above basic data, the available transmission capacity and channel utilization rate of cross-provincial power transactions are calculated for each of the three scenarios.
The transmission prices of the Ling Shao HVDC and Ji Quan HVDC selected in this paper are shown in Table 1.
E3S Web of Conferences 256, 01004 (2021)PoSEI2021
https://doi.org/10.1051/e3sconf/202125601004
3
Table 1. The transmission prices of the Ling Shao HVDC and Ji Quan HVDC.
Tie-line Transmission Prices (Yuan / MWh)
Line Loss Rate
Ling Shao HVDC
65.90 6.5%
Ji Quan HVDC
82.90 7.0%
The regional grid transmission prices are shown in
Table 2.
Table 2. The transmission prices of regional grid.
Regional Grid
Transmission Prices (Yuan / MWh)
Line Loss Rate
East China 10.00 2.52% Northwest China
20.00 2.03%
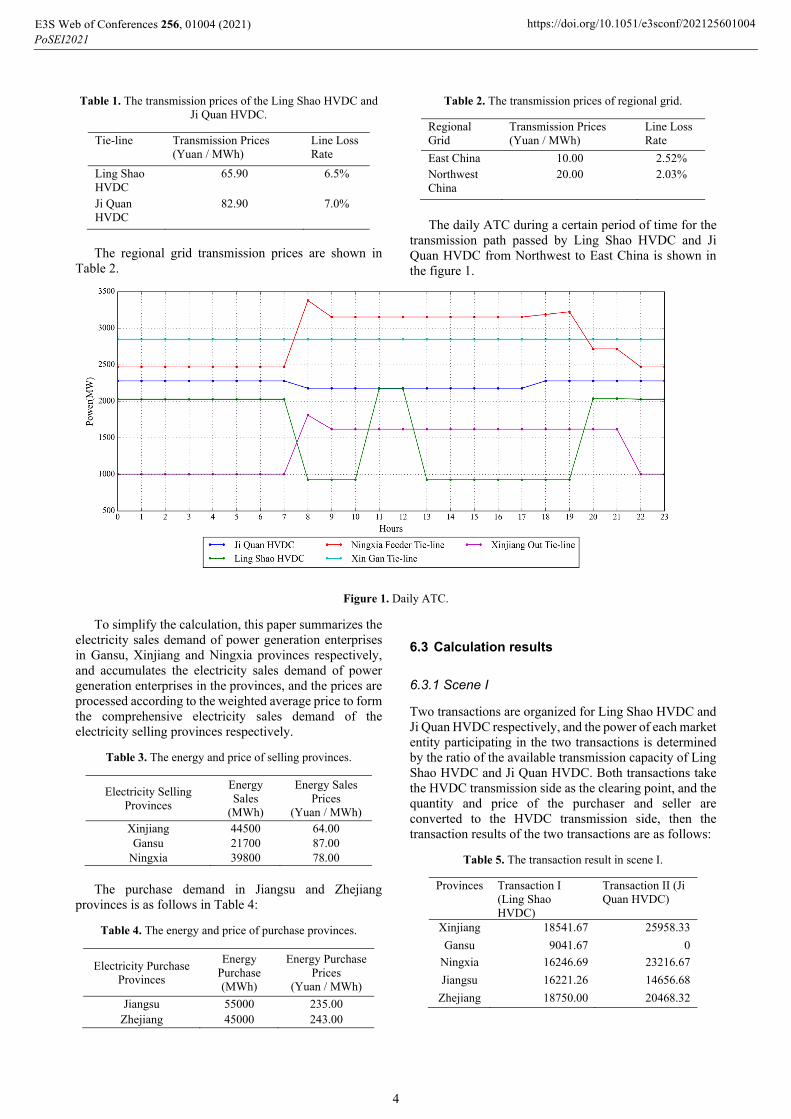
The daily ATC during a certain period of time for the
transmission path passed by Ling Shao HVDC and Ji Quan HVDC from Northwest to East China is shown in the figure 1.
Figure 1. Daily ATC.
To simplify the calculation, this paper summarizes the electricity sales demand of power generation enterprises in Gansu, Xinjiang and Ningxia provinces respectively, and accumulates the electricity sales demand of power generation enterprises in the provinces, and the prices are processed according to the weighted average price to form the comprehensive electricity sales demand of the electricity selling provinces respectively.
Table 3. The energy and price of selling provinces.
Ningxia 39800 78.00 The purchase demand in Jiangsu and Zhejiang
provinces is as follows in Table 4:
Table 4. The energy and price of purchase provinces.
Electricity Purchase Provinces
Energy Purchase (MWh)
Energy Purchase Prices
(Yuan / MWh)
Jiangsu 55000 235.00 Zhejiang 45000 243.00
6.3 Calculation results
6.3.1 Scene I
Two transactions are organized for Ling Shao HVDC and Ji Quan HVDC respectively, and the power of each market entity participating in the two transactions is determined by the ratio of the available transmission capacity of Ling Shao HVDC and Ji Quan HVDC. Both transactions take the HVDC transmission side as the clearing point, and the quantity and price of the purchaser and seller are converted to the HVDC transmission side, then the transaction results of the two transactions are as follows:
Table 5. The transaction result in scene I.
Provinces Transaction I (Ling Shao HVDC)
Transaction II (Ji Quan HVDC)
Xinjiang 18541.67 25958.33
Gansu 9041.67 0
Ningxia 16246.69 23216.67
Jiangsu 16221.26 14656.68
Zhejiang 18750.00 20468.32
E3S Web of Conferences 256, 01004 (2021)PoSEI2021
https://doi.org/10.1051/e3sconf/202125601004
4
Table 6. The transaction result statistics in scene I.
Transaction
Marginal Price
(Yuan / MWh)
Deal Energy (MWh)
Social Welfare (million Yuan)
Transaction I (Ling Shao HVDC)
141.84 37972.00 0.36
Transaction II (Ji Quan HVDC)
130.31 35125.00 0.70
Total 136.30 73097.00 1.05
6.3.2 Scene II
According to the optimal clearing method considering network constraints in this paper, multiple trading channels are organized together, and the transaction results are as follows:
Table 7. The transaction result in scene I.
Provinces Transaction I (Ling Shao HVDC)
Transaction II (Ji Quan HVDC)
Xinjiang 34844.00 9656.00 Gansu 96.00 7272.00
Ningxia 3032.00 36768.00 Jiangsu 37493.00 7507.00
Zhejiang 479.00 46189.00
Analyzing the calculation results of scene II, we can calculate that the social welfare generated by the trading organization under scene II is 2.56 million Yuan, which is higher than that of scene II.
6.3.3 Analysis.
By comparing the calculation results of scene I and scene II, since the transaction path are specified in scene II, when there is blockage in the transaction path, the blocked transaction path cannot meet the market demand, while in scene II, multiple transaction path s organize transactions at the same time, and when one transaction path is blocked the market demand can be met by switching to other transaction paths; at the same time, for the transaction paths with high transmission costs, there may be a purchase and sale price difference less than At the same time, for transaction paths with high transmission costs, there may be a situation where the purchase and sale price difference is less than the transmission cost, and when there is only one transmission path, the transaction may not be reached, while when there are multiple transaction paths coexisting, the transaction demand can be met through other transaction paths, thus maximizing the volume of transactions.
7 Conclusion
This paper proposes an optimized clearing model for inter-regional and inter-provincial power transactions considering network constraints. Based on current inter-regional and inter-provincial power transactions, multiple provinces with purchase and sale needs are considered to participate in the transaction at the same time. Moreover,
the relationship between transaction flow and simplified physical flow is established. The established optimal clearing model, which aims at maximizing social welfare with network constraints, has greatly achieved social welfare, effectively improved channel utilization, and widely realized optimal resource allocation. The optimization of clearing model taking network constraints into account not only improves the feasibility of mid-term and long-term transactions, but also achieves high efficiency of inter-regional and inter-provincial power transactions.
Acknowledgments
The authors would like to thank the State Grid Electric Power Research Institute, NARI Group Corporation, and NARI Technology Co., Ltd. for funding Project “Development and Application of Trading with Power Curve in Medium and Long-term Transaction Linkage with Spot Market”.
References
1. YAN Yu, LI Gengyin, LI Guodong, et al.Analysis of Power Direct Trade Organization Under New Round of Electricity Reform[J]. Electric Power,2017,50(07):33-37.
2. LI Guodong, LI Gengyin, ZHOU Ming,et al.Analysis on Foreign Typical Market Mechanisms for Promoting New Energy Consumptive[J]. Electric Power,2019,52(02):46-52+60.
3. LI Xiaogang, YANG Libing, WU Min, et al.The Coordination Method and Its Characteristics of Two-Level Electricity Market[J]. Electric Power,2020,53(09):71-80+116.
4. HU Chaofan, WANG Yang, ZHAO Tianyang , et al. Challenges and Strategies of Cross-provincial Intraday Market Design[J]. Power System Technology,2020,44(02):573-579.
5. XIE Kai. Electricity Market, Operation and Regulation: US Practice[M]. Beijing: China Electric Power Press,2017.