609| International Journal of Current Engineering and Technology, Vol.8, No.3 (May/June 2018)
Design and Optimization of Formula SAE Suspension system Ashish Avinash Vadhe*
Mechanical Engineering Department, B.R.Harne College of Engineering and Technology, Karav, Vangani, Dist – Thane Maharashtra- 421503, India. Received 15 March 2018, Accepted 19 May 2018, Available online 23 May 2018, Vol.8, No.3 (May/June 2018)
Abstract In automobile industry it is essential to produce the Compact and reliable Suspension system in order to increase the vehicle performance. Also, lot of forces during cornering, acceleration and bump conditions are also applied directly during dynamic condition. This article deals with design of Formula SAE Suspension by considering various loads and their simulation on each component of the system. Keywords: A-Arms, Bell Crank, Pushrod, Ansys, Spring and Dampers 1. Introduction
1 What is Suspension System?
The Suspension system is a device connecting the body with wheels. The motion is constrained by the suspension. All kinds of forces and movements between the wheels and the ground passes to the body through the suspension. The design of suspension system is an important part of the overall vehicle design which determines performance of the racing car.
Fig.1 Suspension System
SAE Suspension should have following requirements
1) It must have Shock Absorbers. 2) Suspension travel is not less than 25.4mm (1 Inch)
for both jounce and rebound. 3) Must have appropriate attenuation vibration
ability. 4) Ensure the car has good handling and stability
1. Light weight and strong. 2. Easy operation and control for the driver. 3. Convenient installation and easy adjustment
Problem Statement SAE International hosts multiple Formula competitions worldwide each year. The Formula SAE Collegiate Design Competition is governed by very strict rules and regulations to allow for fair competitions and the safety of the drivers. The rules state very specific parameters in terms of the suspension and wheel assembly design and the maximum choice of the engine; but, it remains broad in other areas such as control mechanisms and aerodynamic design. In general, the rules are tailored to protect the drivers while ensuring ample space to create one’s own custom designs.
The objective behind the project to overcome the following conditions, 1. Oversteer Configuration for high cornering 2. Light weight and compact assembly 3. Reliable and as per driver safety consideration 4. To achieve good rollover stability 5. Ease for the driver at the time of bump and cornering.
1. Methodology
This the very important factor by which a planned method from designing to manufacturing the final prototype. For designing purpose, use of basic hand calculations and research of design parameters referring design reports which are paper published
Ashish Avinash Vadhe Design and Optimization of Formula SAE Suspension system
610| International Journal of Current Engineering and Technology, Vol.8, No.3 (May/June 2018)
and also certain figures to understand the basics by using internet and referring certain books like Carroll Smith’s Tune to Win and Milliken & Milliken’s Race car vehicle dynamics, etc. Drafting and CAD model designing is done on Licensed CAD software’s like Solidworks, Catia, etc. FEA analysis is done on licensed version of ANSYS. Lotus Shark Suspension Analysis software is used for dynamic analysis of suspension. Manufacturing is done by Major machining processes like laser cut, grinding, welding, lathe operations, etc. and assemblies were done by bolting and press fitting, etc. 3. General Terms in Suspension System and Wheel Assembly
Camber Angle
Camber angle is the inclination of the vehicle tire with
the vertical axis when viewed from the Front section.
In case top of tire leans in towards the centre of the car
this is the condition of negative camber. Positive
camber is opposite of this.
Fig.2 Types of Camber Angle
Note: Increasing positive camber angle will enlarge the
slip angle for a specific cornering force which will
decrease the largest possible cornering force of the
vehicle but will also slow down the onset by
Breakaway which is assumed to mean the car starting
to slide. On the other hand, increasing negative camber
angle, opposite will occur with a higher cornering force
and less time for the car to Breakaway.
Caster Angle
Caster angle is the angular displacement from the
vertical axis of the suspension of a wheel in a car
measured in longitudinal direction.
In other words, it’s a line joining the upper and the
lower ball joint of the upright with respect to vertical
axis drawn from the center of the tire.
The purpose of this is to provide a degree of Self –
Centering for steering the wheel casters around so as
to trail behind the axis of steering.
This makes car easier to drive and improves its
straight-line stability.
Fig.3 Types of Caster Angle
Note: Improper adjustment will result in steering inputs required both in and out of a corner resulting in a car which is difficult to keep in straight line. Too much caster (positive) in the front of the car will understeer more, too little (negative) caster will give oversteer characteristics. A large positive caster setting (wheel facing forward of axis) is good for high speed stability but can make it more difficult for turning the steering. Excessive amount will increase tire wear. Excessive caster angle will make the steering heavier and less responsive. Kingpin Inclination The Kingpin axis is determined by the upper ball joints and lower ball joints on the outer end of the A-arms. This axis is not necessary centred on the tire contact patch. In front view the angle is called Kingpin inclination and the distance from the centre of the tire print to the axle centre is called Scrub or Scrub radius. The distance from the kingpin axis to the wheel centre plane measured horizontally at axle height is called Spindle length. Figure shows the kingpin geometry.
Fig.4 Kingpin Inclination Front and Side View
Note: If the spindle length is positive the car will be raised up as the wheels are turned and this results in a increase of the steering moment at the steering wheel. The larger the kingpin inclination angle is the more the car will be raised regardless of which way the front wheels are turned. If there is no caster present this effect is symmetrical from side to side. The raise of the car has a self-aligning effect of the steering at low speeds. Kingpin inclination affects the Steer camber. When a wheel is steered it will lean out at the top, towards positive camber if the kingpin inclination angle is positive. The amount of this is small but not to neglect if the track includes tight turns.
Ashish Avinash Vadhe Design and Optimization of Formula SAE Suspension system
611| International Journal of Current Engineering and Technology, Vol.8, No.3 (May/June 2018)
If the driving or braking force is different on the left and right side this will introduce a steering torque proportional to the scrub radius, which will be felt by the driver at the steering wheel. Trackwidth The Distance between centre axis of tire from front view is known as trackwidth.
Fig.5 Trackwidth Geometry
Note: Generally narrow (small) trackwidth are used at rear to avoid hit cones with the back when they are already away from this cones with front wheel. Wider track decreases load transfer which is generally good for getting grip on that end of the car. Only disadvantage is that weight increases because longer A-Arm, Push or Pull-Rod, Tie Rods and Driveshafts. Also, the moment of inertia yaw is increased a lot because it is depending on the lever arm of wheels. A wider track will make the springs feel weaker since it requires longer lever. So, a wider track will make the front suspension feel softer, promoting a reduction in understeer. Wheelbase The Distance between the centre axis of Front and Rear Wheel from longitudinal direction is known as Wheelbase.
Fig.6 Wheelbase
Note: Large Wheelbase causes Cornering issues but increases driver safety. Small Wheelbase causes easy cornering of vehicle but decreases driver safety.
Instant Center and Roll Center Instant center is the momentary centre which the suspension linkage pivot around. As the suspension
moves the instant centre moves due to the changes in the suspension geometry. Instant centres can be constructed in both the front view and the side view. If the instant centre is viewed in front view a line can be drawn from the instant centre to the centre of the tire’s contact patch. If done for both sides of the car the point of intersection between the lines is the Roll centre of the sprung mass of the car. The position of the roll centre is determined by the location of the instant centres. High instant centres will lead to a high roll centre and vice versa. The roll centre establishes the force coupling point between the sprung and the unsprung masses of the car. The higher the roll centre is the smaller the rolling moment around the roll center. If the roll centre is located above the ground the lateral force generated by the tire generates a moment about the instant centre, which pushes the wheel down and lifts the sprung mass. This effect is called Jacking. If the roll centre is below the ground level the force will push the sprung mass down. The lateral force will, regarding the position of the roll centre, imply a vertical deflection. If the roll centre passes through the ground level when the car is rolling there will be a change in the movement direction of the sprung mass.
Fig.7 Roll Centre and Roll Centre Height Ground Clearance and Rollover Stability The ground clearance must be sufficient to prevent any portion of the car other than the tires from touching the ground. Intentional or excessive ground contact results in higher C.G which decreases the rollover stability. The track and center of gravity (C.G.) of the car must combine to provide adequate rollover stability. Motion Ratio
For packaging damper in the suspension system includes required wheel travel, jounce bump travel, desired wheel rates, strength requirements and packaging constraints. Most important is Motion ratio. Motion ratio is nothing but the ratio of wheel travel to spring travel. Motion Ratio (MR) = Wheel Travel / Spring Travel Note: Higher Motion ratio requires lower spring rates for the same wheel rate.
Ashish Avinash Vadhe Design and Optimization of Formula SAE Suspension system
612| International Journal of Current Engineering and Technology, Vol.8, No.3 (May/June 2018)
Lower spring rates are also lighter and results in less spring and shocks friction as well as lower component load. The other reasons are greater damper travel and higher shock velocities and wheel displacement are quite small on a FSAE car, Higher Motion Ratio produces better shock performance. C.G. Height Center of gravity, also known as center of mass, is that point at which a system or body behaves as if all its mass were centered at that point. Where the weight, and also all accelerative forces of acceleration, braking and cornering act through it. Centre of gravity location can be defined as: -The balance point of an object -The point through which a force will cause pure translation - The point about which gravity moments are balanced
Fig.8 C. G Height
Note: When making an analysis of the forces applied on the car, the CG is the point to place the car weight, and the centrifugal forces when the car is turning or when accelerating or decelerating. Any force that acts through the CG has no tendency to make the car rotate. The center of mass height, relative to the track, determines load transfer, (related to, but not exactly weight transfer), from side to side and causes body lean. When tires of a vehicle provide a centripetal force to pull it around a turn, the momentum of the vehicle actuates load transfer in a direction going from the vehicle's current position to a point on a path tangent to the vehicle's path. This load transfer presents itself in the form of body lean.
Anti-Dive Anti-dive describes the amount of front of the vehicle dives under braking. As the brakes are applied weight is transferred to the front and that forces the front to dive. Anti-dive is dependent on the vehicle centre of gravity (C.G), the percentage of braking force developed at the front tires vs. rear and the design of the front suspension.
Fig.9 Anti-Dive Geometry For the very common double A-Arm Suspension Anti-Dive is design to suspension based on the angle of the A-Arm mounting points when viewed from the side. If the intersection point of the extension lines for the mounting points is located above the neutral line, there is more than 100 % Anti-Dive. High Anti-Dive values require more complex suspension design and causes ‘Rattling’ type noise. Typical values are in range of 0 – 50%.
Note: Unless specified, all calculations are based on vehicle at rest on a level road surface. The TCA (Track Control Arm) is horizontal to road surface and therefore centres of the inner sub-frame bushing and the outer ball joint are at same distance from the ground. This may not be the case with shorter load road springs where the ball joint may end up higher than inner bushing. The stub axle lies on a vertical line, Perpendicular to the load surface that passes through the centre of the TCA sub-Frame bushing. The tire contact patch is therefore also centred under the TCA. In real life the axle would be slightly behind the TCA due to Caster Angle. Anti-Squat Squat is a term used to refer to the amount the car tips backwards under acceleration. Over 100% of anti-squat (AS) means suspension will extend under acceleration. With 100% AS suspension would neither extend nor compress. Under 100% AS means tendency to compress under acceleration.
Fig.10 Anti-Squat Geometry
The calculation of anti-squat is similar to that of anti-dive. Locate the rear Centres of the suspension from the vehicle’s side view. Draw a line from the rear tire contact patch through the Instantaneous Centre. This is
Ashish Avinash Vadhe Design and Optimization of Formula SAE Suspension system
613| International Journal of Current Engineering and Technology, Vol.8, No.3 (May/June 2018)
the tire force vector. Now draw a line straight down from the vehicle’s centre of gravity. The Anti-squat is the ratio between the height of where the tire force vector crosses the centre of gravity plane expressed as a percentage. Suspension Geometry (Push/Pull) Push-rod or pull-rod, the difference as the name suggests is the whether the rod push up to the rocker or pull down to the rocker. The main advantage of a pull rod lie in the possibility to make the nose lower, assemble most suspension parts lower to the ground and thus lowering the height of the centre of gravity.
Fig.11 Suspension Geometry (Push/Pull)
Pull rod set up has a strut from the outer end of the upper wishbones that runs diagonally to the lower edge of the chassis and "pulls" a rocker to operate the spring/damper. A push rod is the opposite; the strut runs from the lower wish bone to the upper edge of the chassis.
Types of Load Transfers Longitudinal Load Transfer Longitudinal load transfer is the result of the car mass accelerating from the front of the vehicle to the back or the back to the front under accelerating or deaccelerating (Braking) respectively. It is important to mention that “The total weight of the vehicle does not change, Load is merely transferred from the wheels at one end of the car to the wheels at other end.”
Lateral Load Transfer
In essence the lateral load transfer experienced by the vehicle is the same principle as the longitudinal transfer only just rotated to 90 degrees such that load is either transferred from the right to left under left hand corner and from the left to the right in right hand corner.
Vertical Load Transfer
Vertical load transfer is nothing but opposite reaction
of vehicle load on wheels and also fluctuating loads
occurs during bump.
2. Suspension Design Procedure
The suspension design procedure requires several
terms selections and values taken into consideration as
design of the FSAE starts with suspension. The
procedure is as follows.
Suspension Geometry Selection
The selection of suspension geometry type is based on
our research work and comparing the advantages and
disadvantages of both geometries.
Table 1 Difference between Push/Pull Suspension
S. No Pull Suspension Push Suspension
1 Gives lower Centre of
Gravity. Centre of gravity is
comparatively more.
2 Less Stable at high
speed. More stable at high
speed.
3 Assembly of bell crank
is quite complex. Assembly of bell crank is
easy.
4 Aesthetically looks
average. Aesthetically looks
attractive.
5 Mountings are
compact. Mountings are easy.
Decision By comparing all the advantages and disadvantages of
both geometries selection of the Pushrod suspension
system on both front and rear side is done as
manufacturing concern and also mountings of chassis
are easy.
Fixing General Parameters by Drawing Suspension
Geometry
The general parameters are fixed by research, Rule
And drawing the suspension geometries by checking
roll center positions.
Fig.12 Front Suspension Geometry
Ashish Avinash Vadhe Design and Optimization of Formula SAE Suspension system
614| International Journal of Current Engineering and Technology, Vol.8, No.3 (May/June 2018)
Fig.13 Rear Suspension Geometry Decision Trackwidth – Trackwidth is kept more than rear for easy cornering. Steering radius and clearance with the chassis is considered so that there will be no obstruction while turning. Front Trackwidth is 1250mm and Rear Trackwidth is 1200mm. Upright Height – To decide upright height several factors were considered. Firstly, ICR’s of both A-Arms and the line joining center of wheel to ICR to get Roll Centre Height were drawn. By Keeping Lower A-Arm Horizontal to get more stability and adjusting upper A-Arm we decided to keep Upright Height as 8-inches. Roll Centre Height – Roll center Height of Front suspension was kept 50mm and of Rear Suspension as 60mm by doing the same procedure which as in upright height. Rear Roll Centre Height is kept more to keep our car aerodynamically stable at High speed also. Camber Angle – Camber Angle is basically based on Cornering stability so a real case value of 2 degrees which is considerable and also can be manufactured is kept. Kingpin Inclination – Kingpin inclination is 6 degrees with considerable scrub radius of 63.54mm. Also it can be easy to manufacture by adjusting upright Bracket length. Suspension Compartment Geometry After Fixing all the general parameters 3D sketch of suspension compartment and also the A-Arms were drafted.
Fig.14 Suspension Geometry in 3D with A-Arm Line Drawing
Shocks Selection The shocks selection is done on the basis of the design requirement and analysis and on the performance, cost and on the market availability.
Table 2 Comparison between different shocks
S. No Local Shocks Fox DHX RC4 DNM Burner RCP 2
1 Low built quality High built quality High built quality
2 Leakage issues No leakage issues No leakage issues
3 No compression
and rebound adjustments
Compression and rebound
adjustments
Compression and rebound
adjustments
4 Easily available at local dealers
Needs to import Needs to import
5
Low cost around ₹8000 per shock excluding local
shipping charges
High Cost around ₹15000 per shock
excluding international
shipping charges and customs.
Average cost around ₹10000 per
shock excluding international
shipping charges and customs.
6 Less Durable More Durable More Durable
Decision By comparing all the parameters, DNM BURNER RCP 2 was finalized.
Fig 15 DNM Burner RCP 2
Fig 16 FOX DHX RC 4
Fig.17 Local Shocks
Ashish Avinash Vadhe Design and Optimization of Formula SAE Suspension system
615| International Journal of Current Engineering and Technology, Vol.8, No.3 (May/June 2018)
Design of Suspension Components A-Arms Design A-Arms design started with CAD geometry drawing using suspension compartments and considering trackwidth, wheelbase, etc. parameters.
Fig.18 A-Arms 3d geometry Selection of material for A-Arm was done as per Material availability and Machining cost.
Table 3 Difference between Materials
S. No Mild Steel AISI 1018 Aluminium 7075 T6 1 Heavy Material Light Material
2 High Strength Comparatively Low strength for same
dimensions. 3 Easily Available Available in Big Markets
4 Low Cost around
₹60/kg Very high cost around
₹850/kg
5 Machining cost is less Machining cost is high as requires operations like
brazing, etc
Decision As comparing all the parameters of material, mild steel material for A-Arms, Bell cranks and pushrods was selected. Afterwards cad modelling and simulation of A-Arms by applying material which was selected to get proper results before manufacturing the actual prototype is done.
Fig.19 Front A-Arm
Fig.20 Rear A-Arm
Firstly A-Arm pipe dimensions as 16mm OD x 3mm Thick is taken considering the design and simulation results. The pipes are cut on manual cutter. Then milling of A-Arm pipes is done to get fit properly in Bearing Wafer. The entire A-Arm is welded and mounted on chassis using fasteners.
Fig.21 Actual A-Arm
On manufacturing, no large variations occur due to machining accuracy. Bearing Wafer Simulation of bearing wafer with 8mm thickness is done with A-Arm pipe and after getting results it is reduced to 5mm as per weight reduction concerns and easy mounting of spherical bearing.
Fig.22 Bearing Wafers
Ashish Avinash Vadhe Design and Optimization of Formula SAE Suspension system
616| International Journal of Current Engineering and Technology, Vol.8, No.3 (May/June 2018)
For the precision in Manufacturing, Bearing wafers are laser cut and made bracket slots in lower A-Arms bearing wafers for brackets of pushrods.
Fig.23 Actual Bearing Wafer T-Section T-Section is basically an extension to A-Arm in which Rod End is fixed by threading and jam nut. The advantage of T-Section is A-Arm pipe is not directly contact with Rod end and also because of some heavy loads if rod end fails and its thread stuck in A-Arm so, no need to change full A-Arm.
Fig.24 T-section Design and Actual Part
For Manufacturing T-Section 16mm OD solid Bar is bought and manufactured by machining it on Lathe machine and also by Tapping process. The manufactured part is very precise and tapping was also good. Only slight difference in mm (Around 0.5mm) due to manual lathe machine operations. Bushings Bushings are used to give certain clearance between Rod Ends/Spherical Bearings and Mounting Brackets. One more use of bushing Is to limit the total vertical movement of A-Arm. Bushings are used to separate two different material contact to avoid wear.
Fig.25 Bushings
For car 3 types of bushings with same diameters were used, only changes are in length of 2mm, 4mm, 6mm length respectively. Keeping bushings in even multiples so that it can be easily manufactured and easily separable like for bearing Wafer mount on upright 6mm bushings on both sides were used, and for A-Arm mount on Chassis 4mm bushing and for pushrod to A-Arm 2mm bushings were used.
Table 4 Bushing specification at different mountings
S. No Application Bushing
1 A-Arm on chassis 4mm length bushing on
both side
2 A-Arm on upright 6mm length bushing on
both side
3 Pushrod to Bell Crank and
Lower A-Arm 2mm Length bushing on
both side
The quality and precision were quite good also the thickness of bushing was enough that it will not squeeze easily. Fasteners used in a-Arm Fasteners Selection Bolts are selected as per required length, Calculations, safety concern and by make/buy decision.
Table 5 Difference between make/buy fasteners
S.No Make Buy
1 Includes material cost
and machining cost. Only Component cost
2 Manufacture as per
our design requirement.
Compromise with design as sizes are limited.
3 Needs hardening. Already hardened.
Decision Comparing the all parameters it is beneficial to opt for buy components. Bolts M8 bolts at mountings of suspension A-Arms on Chassis and upright were used and then calculated the loads on bolts and by using some formulation calculations of the bolt size were done. High grade bolts are selected for safety concerns.
Fig.26 M8 Bolt Cad model and Actual Part
Ashish Avinash Vadhe Design and Optimization of Formula SAE Suspension system
617| International Journal of Current Engineering and Technology, Vol.8, No.3 (May/June 2018)
Table 6 Bolt specifications at different mountings of A-Arms
Sr. No Application Bolt
1 A-Arm to Chassis M8 x 40mm length 12.9
Grade
2 A-Arm to Upright M8 x 45mm length 12.9
Grade
Nuts and washers As per bolt size M8 Nyloc nut and washers were used. Nyloc nut are used for positive locking purpose.
Fig.27 Nyloc Nut Cad Model and Actual Part
Fig.28 Washers Cad Model and Actual Part
Jam Nut Rod end locking in T-Section of A-Arm are locked using Jam nuts.
Fig.29 Jam Nut Cad model and Actual Part Rod Ends and Spherical Bearing Rod ends of POS G-8 Male as per bolt size are used for A-Arms mounting on chassis and spherical bearing of LS GE – 8E for A-Arms mounting on Upright.
Fig.30 POS G8 Male Rod End Cad Model and Actual Part
Fig.31 LS GE 8E Bearing
Bell Crank Design Bell crank design is quite simple and easy to manufacture using laser cut. In bell crank design firstly geometry diagram is started by which the angle between pushrod and shocks can be checked. The angle between pushrod and shocks is from 80° – 120° for better load transfer.
Fig.32 Bell Crank Geometry – Front
As one can do good weight reduction in bell crank; bell crank is first drawn by checking the angles between pushrod and shocks and geometry. First model Design was quite simple but it has more weight so trying some alterations the bell crank design was finalized and the Manufacturing of bell crank was done using CNC machining.
Fig.33 First Model of Bell Crank
Final model After some alterations final bell crank design was finalized and its manufacturing process too.
Ashish Avinash Vadhe Design and Optimization of Formula SAE Suspension system
618| International Journal of Current Engineering and Technology, Vol.8, No.3 (May/June 2018)
Fig.34 Bell Crank Cad Model Front and Rear
Table 7 Different types of manufacturing process for Bell crank
Sr. No. CNC Machining Laser Cut
1 High machining cost Low machining cost 2 More time required Less time required
3 Generate more waste
material Less waste material
4 Material Block required Material plate required
Decision – By comparing all the parameters of different machining process, it was beneficial to opt for Laser cutting.
Fig.35 Actaul Bellcrank Spacer Spacer is nothing but a circular pipe of certain dimensions to keep distance between two bell crank plates.
Fig.36 Bell Crank Plate Spacer
The final Assembly is done by bolting Bell crank on Chassis. Fasteners used in Bell Crank Bolts Selection of M8 bolts at mountings of suspension Bell crank on Chassis is done and then calculated the loads on bolts and by using some formulation calculations of the bolt size were done. High grade bolts are selected for safety concerns.
Table 8 Bolt specification at different mountings of bell crank
S. No Application Bolt
1 Bell Crank to Chassis M8 x 50mm length 12.9
Grade
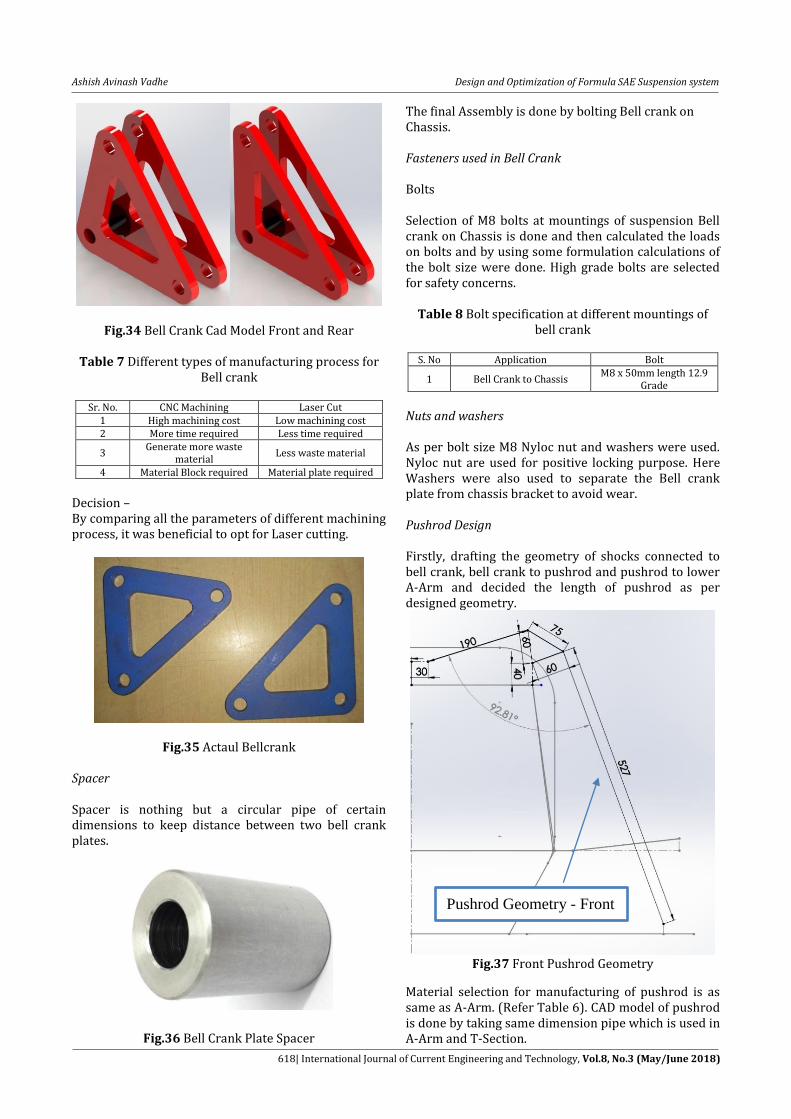
Nuts and washers As per bolt size M8 Nyloc nut and washers were used. Nyloc nut are used for positive locking purpose. Here Washers were also used to separate the Bell crank plate from chassis bracket to avoid wear. Pushrod Design Firstly, drafting the geometry of shocks connected to bell crank, bell crank to pushrod and pushrod to lower A-Arm and decided the length of pushrod as per designed geometry.
Fig.37 Front Pushrod Geometry
Material selection for manufacturing of pushrod is as same as A-Arm. (Refer Table 6). CAD model of pushrod is done by taking same dimension pipe which is used in A-Arm and T-Section.
Pushrod Geometry - Front
Ashish Avinash Vadhe Design and Optimization of Formula SAE Suspension system
619| International Journal of Current Engineering and Technology, Vol.8, No.3 (May/June 2018)
Fig.38 Pushrod Then pushrod is manufactured by cutting the pipes manually as per required length and then welding the T-sections on both ends to fix the Rod-Ends in pushrod. Finally, the Pushrod is fixed by fitting bushings and bolting on Bell crank and Lower A-Arm. Final manufactured Pushrod is as same as design because the pushrod distances are complete decimal values which is easy to manufactured and welding is done properly. Fasteners used in Pushrod Bolts Selection of M8 bolts at mountings of pushrod on Bell crank and lower A-Arm is done and then calculated the loads on bolts and by using some formulation calculations of the bolt size were done. High grade bolts are selected for safety concerns.
Table 9 Bolt specifications at different mountings of
pushrod
S. No Application Bolt
1 Pushrod to A-Arm M8 x 40mm length 12.9
Grade
2 Pushrod to Bell crank M8 x 40mm length 12.9
Grade
Nuts and washers As per bolt size M8 Nyloc nut and washers were used. Nyloc nut are used for positive locking purpose. Jam Nut: Rod end locking in T-Section of A-Arm are done using Jam nuts. Rod Ends: Rod ends of POS G-8 Male as per bolt size for Pushrod mounting on Lower A-Arm and Bell crank were used. Bushings In pushrod 2mm length bushings in bell crank mount as well as Lower A-Arm mount are used.
Tie Rod Tie rod is nothing but a rod which olds the rear wheel to keep it position properly. In this case tie rod is directly welded to Rear A-Arm which reduces extra bracket and bolting cost and other is mounted on Rear upright via bolting of Rod end of Tie rod on upright bracket.
Fig.39 Tie rod with Lower A-Arm As the Tie Rod is directly welded to rear lower A-Arms therefore assembly takes slight more time. Fasteners used in Tie Rod Bolts: Selection of M8 bolts at mountings of tie rod on upright is done and then calculated the loads on bolts and by using some formulation calculations of the bolt size were done. High grade bolts are selected for safety concerns. Nuts and Washers: As per bolt size M8 Nyloc nut and washers were used. Nyloc nut are used for positive locking purpose. Rod Ends: Rod ends of POS G-8 Male as per bolt size for Tie Rod mounting on upright are used. Nuts and Washers: In Tie Rod 4mm length bushings in upright Mounting are used. Damper Springs DNM Burner RCP 2 shocks were selected as the DNM company have only specific spring rates and they were not as per our design. So, springs for the shocks were customized.
Fig.40 Shocks cad file
Tie Rod Welded to Rear Lower A-Arm
Ashish Avinash Vadhe Design and Optimization of Formula SAE Suspension system
620| International Journal of Current Engineering and Technology, Vol.8, No.3 (May/June 2018)
Table 10 Spring Selection
S. No Keizer Custom
Springs Local Custom
Springs 1 More precise. Less precise.
2 Needs Import from
other country.
Can be manufactured in Local markets.
3 Product Receiving
time is more. Product receiving
time is less.
4 Costlier as includes
international shipping and customs.
Less expensive as manufactured in
local market.
Decision
After comparing all the parameters, it was decided to manufacture springs from local market as per time concern. The manufactured springs free length is slightly more than actual design so that it gives rebound easily and bending will not occur. 3. Calculations
Abbreviation y’ = Lateral shift at Y-axis W = Total weight of vehicle B = horizontal distance from rear axis to C.G. r = Tire radius MR = Motion Ratio Fp = Force on push rod BMR = Bell crank motion ratio Ks = spring rate Fr = Ride frequency Msm = Sprung mass Kw = Wheel rate kwFL = wheel rate front left kwFR = wheel rate front right KψF = Front roll rate KψR = Rear roll rate FS = Force on shocks Syt = Tensile Yield strength σut = Ultimate tensile strength Pmax = Maximum Force on Shocks Pmin = Minimum Force on Shocks K = Spring Stiffness D = Mean Diameter d = Wire Diameter C = Spring Index N = Total number of coils n = Active number of coils Ls = Solid Length Lf = Free Length p = Pitch α = Helix angle δmax = Maximum spring deflection δ = Spring deflection
C.G. Height Calculations Assumed Vehicle weight (without driver) = 230kg Drivers weight = 70kg Total weight of vehicle with driver = 300kg Assuming 45:55 weight distribution Weight at front = 135kg Therefore, weight on each wheel = 135/2= 67.5kg Weight at rear = 165kg Weight on each wheel = 165/2= 82.5kg Trackwidth[Front]= 1250mm Trackwidth[Rear]= 1200mm Wheelbase = 1600mm
Fig.41 C. G Height at Ground
Now moment about Rear Axle
a = l – b = 1.6 - 0.72 = 0.88 m a = 0.88 m b = 0.72 m
Engine is in backside so wt. is more on backward Now moment about xx
( )
( )
* (
)+
(
)
* (
)+
(
)
Ashish Avinash Vadhe Design and Optimization of Formula SAE Suspension system
621| International Journal of Current Engineering and Technology, Vol.8, No.3 (May/June 2018)
As no lateral shift from X axis C.G. on centerline
Fig.42 C.G. Height at Inclination ( ) Now moment about O 137.5 × 1.56 = 300 × b1
b1 = 0.715 m. Now,
= cos (11.6)
C = 0.0099 m
Therefore, h1 = 0.0482 m Since (r) = 10.25 inch. = 10.25 × 25.4 = 260.35 mm = 0.260 m h = h1 + r = 0.0482 + 0.2605 = 308.7 mm h=12.68 inch
Load Calculations Longitudinal Forces during Braking: While Braking, the weight of the rear side tends to
come in the front side of the vehicle so there is a load
transfer that is taking place form rear to front. It
interns affects the knuckle as these forces act on the A-
arm mounting points through the A-arms.
Considering Maximum acceleration of 1g = 9.81 m/s2
Force at the front side = mass at the rear side of the
vehicle × acceleration
Let the mass at the rear side of the vehicle be 0.6 times
the total weight
Mass at the rear side of the vehicle=0.6 × 300 =180 kg
Force = 180 × 9.81
Force = 1765.8 N
Now force on 1 wheel =1765.8/2 =882.9 N
Longitudinal Force =882.9 N
Lateral Forces
Lateral forces are because of two reasons – centrifugal
force and lateral load transfer from outside to inside
while turning. The centrifugal force is considered as
follows.
Let the vehicle take a turn of 6m turning radius and at a
speed of 30kmph = 8.33 m/s.
r = turning radius =6m
1 km = 1000 m; 1 hr. = 3600 sec.
To convert km/hr into m/sec, multiply the
number by 5 and then divide it by 18 .
= 1388.77N
Now consider if all the weigh at the front side comes on
the wheel assembly the force will be Force due to
lateral load transfer =0.4 × 300 × 9.81 =1175.5N
Vertical Force at Bump
The vertical load transfer occurs at bump and as per
load theories 3g of weight applies on vehicle at the
time of bump.
Vertical load transfer on each wheel (Front)=662.17x3
= 1986.53N
Vertical load transfer on each wheel (Rear)=809.325x3
= 2427.975N
Suspension Calculations
Front Suspension
(MR)= Wheel Travel /Spring travel
Motion ratio[Front] at jounce = 37/29.13= 1.2704
Motion ratio[Front] at Rebound = 30/24.19= 1.24
Motion ratio [MR][Front] = 1.2704+1.24 / 2 = 1.2552
Ashish Avinash Vadhe Design and Optimization of Formula SAE Suspension system
622| International Journal of Current Engineering and Technology, Vol.8, No.3 (May/June 2018)
Fig.43 Front Suspension Geometry Free Body Diagram Force on front single wheel when driver seated= 662.175N Force on each wheel (front) at bump= 3*662.175 = 1986.53N α=20.20: β=77.36: Therefore FP = 1986.53 cosα
=1986.53 cos (20.20)
FP =1864.34N BMR = L1/L2 ^ sin θ
=60/60 sin (77.36)
BMR= 0.975 Now, Considering ride frequency of front as 3.15 Hz Therefore, Fr= 3.15Hz KS=4 x π2 x Fr2 x Msm x MR2 [20] Ks(Front)= 4 x π2 x (3.15)2 x 135 x (1.2552)2
Ks = 82629.40 N/m Therefore, selecting stiffness of front as 82000N/m or 82N/mm Kw [Front] = (Ks)/MR2 [21] = 82/ (1.2552)2 Kw[front] = 52 N/mm
Kw[front] = kw (front left) = kw (front right) Also, KψF = π x (Tf)2 x (kwFL x kwFR) / 180 (kwFL + kwFR) [22] KψF = π (1.25)2 x 52000 x 52000 / 180 x (52000 + 52000) KψF = 709.04Nm/deg
Rear Suspension (MR)= Wheel Travel /Spring travel
Motion ratio[Rear] at jounce = 44/32.439= 1.3563 Motion ratio[Rear] at Rebound = 32/23.68 = 1.3511 Motion ratio [MR][Rear] = 1.3563+1.3511 / 2 = 1.3537
Fig.44 Rear Suspension Geometry Free Body Diagram Force on rear single wheel when driver seated= 809.325N Force on each wheel (Rear) at bump = 2427.975N α=18.22: β=90: Therefore FP = 2427.975cosα =2427.975 cos (18.22) FP =2306.24N Bell crank motion ratio(BMR) = L1/L2 sin θ BMR = 1 FS = FP x BMR
= 2306.24 x 1
FS = 2306.24N Now, Considering ride frequency of front as 2.5 Hz Therefore, Fr= 2.5Hz Ks=4 x π2 x Fr2 x Msm x MR2
Ks [Rear]= 4 x π 2 x (2.5)2 x 165 x (1.3537)2
Ks = 74605.106 N/m Therefore, Ks [Rear]= 74.605 N/mm. Therefore, selecting stiffness of front as 74000N/m or 74N/mm. Kw [Rear] = Spring rate(Ks)/ MR2
= 74/ (1.3537)2
KwR =40.38 N/mm. Kw[Rear] = kw (rear left) = kw (rear right) Also, KψR = π x (tr)2 x kwRL x kwRR/ 180 x (kwRL+kwRR)
Ashish Avinash Vadhe Design and Optimization of Formula SAE Suspension system
623| International Journal of Current Engineering and Technology, Vol.8, No.3 (May/June 2018)
KψR = π x (1.2)2 x 40380 x 40380 / 180 x (40380+40380) KψR = 507.43Nm/deg
Bolt Calculations
The bolts are standard parts and have a defined value of yield strength. All bolts used in the Wheel Assembly are made up of a minimum of 12.9 Grade. Syt = 640 N/mm2
Factor of Safety = 2 Material = carbon steel – quench and tempered. Bolt of A-Arm at Upright Mount – The Bolt of A-Arm at Upright mount undergoes Shear stress due to effect of Longitudinal Load. Longitudinal Load = 882.9N
= 160 N/mm2
(
)
d = 2.0777 mm This is a critical fastener and undergoes dynamic conditions, so bolt size is M8 as per safety concern.
Bolt of A-Arm at chassis Mount The Bolt of A-Arm at Chassis mount undergoes Shear stress due to effect of Vertical load at Bump.
Vertical Load at Bump (front) = 1986.53N Vertical Load at Bump (Rear) = 2427.975N
= 160 N/mm2
(
)
d = 3.122 mm
Here bolt diameter is too small and such small rod end is not available, so bolt size is M8 For Front.
(
)
d = 3.453 mm Here bolt diameter is too small and such small rod end is not available, so bolt size is M8 For Rear. Bolt of Push-Rod at Lower A-Arm and Bell Crank Mount The Bolt of Push-Rod at A-Arm and Bell Crank Mount undergoes Shear stress due to effect of Vertical load at Bump. Vertical Load at Bump (front) = 1986.53N Vertical Load at Bump (Rear) = 2427.975N
= 160 N/mm2
(
)
d = 3.122 mm As this bolt comes under high shear stress, so bolt size is M8 For Push-Rod Mount on Lower A-Arm.
(
)
d = 3.453 mm
As this bolt comes under high shear stress, so bracket bolt size is M8 For Push-Rod Mount on Bell Crank.
Bolt of Shocks at Chassis and Bell Crank Mount The Bolt of Shocks at Chassis and Bell Crank Mount undergoes Shear stress due to effect of Vertical load at Bump. Vertical Load at Bump (front) = 1986.53N Vertical Load at Bump (Rear) = 2427.975N
= 160 N/mm2
(
)
Ashish Avinash Vadhe Design and Optimization of Formula SAE Suspension system
624| International Journal of Current Engineering and Technology, Vol.8, No.3 (May/June 2018)
d = 3.122 mm Value is too small for practical use, Also, shocks are having M8 bolt hole. so, bolt size is M8 For Shocks Mount on Chassis.
(
)
d = 3.453 mm Value is too small for practical use, Also, shocks are having M8 bolt hole. so, bolt size is M8 For Shocks Mount on Bell Crank. Spring Calculations Front Springs, Material EN-42J Grade 2 σut=615N/mm2
82= 80 x 103 x 8 / 8 x (6)3 x n n=6.51 We considered spring to be square and grounded. n’=n+2 n’ =6.51+2 n’= 8.51
Solid Length (Ls)= n’ x d =8.51 x 8 Ls = 68 mm Free length (Lf) = Ls + δ +(0.15 x δmax)
= 68 + 56 + (0.15 x 67) Lf= 135.2mm Pitch, Lf=pn+2d 135=p x 6.51 + 2 x 8 p=18.27mm Helix Angle, α = tan-1 (p/π D) =tan-1 (18.27/ π x 48) α = 6.9: Rear Springs Material EN-42J Grade 2 σut=615N/mm2
τ = σut /FOS = σut/FOS = 615/1.5 τ = 410 N/mm2
Pmax = 2306.24N Pmin = 809.325N K=74N/mm2
τ = 8PC / d2 π ^ Ks Ks= 1+0.5/C Assume c=6, Ks= 1+0.5/6 =1.0833 Now, 410=8 x 2306.24 x 6/ π x d2 ^ 1.0833 d=7.71=8mm d=8mm C=D/d 6=D/8 D=48mm K= Gd/8C3n Assume, G=80 x 103 N/mm2
74= 80 x 103 x 8 / 8 x (6)3 x n n=5.003 we considered spring to be square and grounded. n’=n+2 n’ =5.003+2 n’= 7.003
solid length (Ls) = n’ x d =7.003 x 9 Ls = 63 mm Free length (Lf) = Ls+ δ +(0.15 x δmax) = 63 + 65 + (0.15 x 77)
Ashish Avinash Vadhe Design and Optimization of Formula SAE Suspension system
625| International Journal of Current Engineering and Technology, Vol.8, No.3 (May/June 2018)
Lf = 139.82mm = 140mm Pitch, Lf = pn+2d 140=p x 7.003 + 2 x 8 p=17.71mm Helix Angle, α= tan-1 (p/ D) =tan-1 (17.71/ π x 48) α=6.698: 4. Simulation Results Front Lower A-Arm
Fig.45 Front Lower A-Arm Geometry
Fig.46 Total Deformation – Front Lower A-Arm
Fig.47 Equivalent Stress – Front Lower A-Arm
Front Upper A-Arm
Fig.48 Front Upper A-Arm Geometry
Fig.49 Total Deformation – Front Upper A-Arm
Fig.50 Equivalent Stress – Front Upper A-Arm
Rear Lower A-Arm
Fig.51 Rear Lower A-Arm Geometry
Ashish Avinash Vadhe Design and Optimization of Formula SAE Suspension system
626| International Journal of Current Engineering and Technology, Vol.8, No.3 (May/June 2018)
Fig.52 Total Deformation – Rear Lower A-Arm
Fig.53 Equivalent Stress – Rear Lower A-Arm
Rear Upper A-Arm
Fig.54 Rear Upper A-Arm Geometry
Fig.55 Total Deformation – Rear Upper A-Arm
Fig.56 Equivalent Stress – Rear Upper A-Arm
Front Bell Crank
Fig.57 Front Bell Crank Geometry
Ashish Avinash Vadhe Design and Optimization of Formula SAE Suspension system
627| International Journal of Current Engineering and Technology, Vol.8, No.3 (May/June 2018)
Fig.58 Total Deformation – Front Bell Crank
Fig.59 Equivalent Stress – Front Bell Crank
Rear Bell Crank
Fig.60 Rear Bell Crank Geometry
Fig.61 Total Deformation – Rear Bell Crank
Fig.62 Equivalent Stress – Rear Bell Crank Dynamic Analysis of Suspension System Dynamic analysis of suspension is done by using Lotus
Shark suspension analysis software. In that co-
ordinates of suspension points to arrange geometry of
suspension system and then by using the software the
Bump, Roll and Steering effect on dynamic conditions
were checked.
Fig.63 Suspension Geometry in Lotus Shark
Ashish Avinash Vadhe Design and Optimization of Formula SAE Suspension system
628| International Journal of Current Engineering and Technology, Vol.8, No.3 (May/June 2018)
5. Results and Conclusions
Results
More stability of vehicle is achieved due to negative camber angle as it provides more traction and contact patch to the wheel during cornering.
Over-steer configuration enables good vehicle handling to the driver by reducing the required steering effort.
Aerodynamic stability is achieved by provision of low roll center height at the front of the vehicle.
As the C.G height is kept near to the ground the rolling effect of vehicle is reduced.
Anti-dive feature reduces the jerking effect at the time of braking.
Anti-squat feature reduces the jerking effect at the time of high acceleration.
Conclusion
The purpose of this thesis project is not only to design and manufacture the suspension system for the car, but also to provide an in-depth study in the process taken to arrive at the final design. With the overall design being carefully considered beforehand, the manufacturing process being controlled closely, and that many design features have been proven effective within the performance requirement of the vehicle. The FEA result indicates that the suspension system is
able to perform safely in real track condition as per performance requirement. References Florida International University, EML 4905 Senior Design
Project, Formula SAE Dynamics (Nov 2016). A B.S. Thesis Prepared in Partial Fulfilment of The Requirement for The Degree of Bachelor of Science in Mechanical Engineering
Abhijeet Das (2014), Virtual Prototype of Upright Assembly of a Race Car for SUPRA SAEINDIA Competition. International Journal of Mechanical and Industrial Technology, ISSN 2348-7593 (Online) Vol. 2, Issue 2, pp: (79-86)
Anshul Dhakar and Rishav Ranjan (2016), Force calculation in upright of a fsae race carvolume 7, Issue 2, pp. 168–176, Article ID: IJMET_07_02_018 ISSN Print: 0976-6340 and ISSN Online: 0976-6359
Bin Zhu and Ning Sun (ICMEIS 2015), Design and Optimization of FSAE Race Car suspension system. 3rd International Conference on Mechanical Engineering and Intelligent Systems
Josh Carrol, Lloyd Outten, Joseph Perry, Taylor Watkins, (April 2013) “FormulaSAE Team Final Report”, Old Dominion University,
William Davis. Billy golfer, design and optimization of a formula SAE racecar by Faculty of worcester polytechnic institute, Project Number: MQP-DCP2012-A11-D12
Design Data Book by PSG College of Engineering, Published by Kalaikathir Achchagam, ISBN – 978-51-927355-0-4
Milliken and Milliken, Race Car Vehicle Dynamics published by SAE International Carroll Smith, Tune to Win
Ashish Avinash Vadhe Design and Optimization of Formula SAE Suspension system
629| International Journal of Current Engineering and Technology, Vol.8, No.3 (May/June 2018)
Ashish Avinash Vadhe Design and Optimization of Formula SAE Suspension system
630| International Journal of Current Engineering and Technology, Vol.8, No.3 (May/June 2018)
Ashish Avinash Vadhe Design and Optimization of Formula SAE Suspension system
631| International Journal of Current Engineering and Technology, Vol.8, No.3 (May/June 2018)
Ashish Avinash Vadhe Design and Optimization of Formula SAE Suspension system
632| International Journal of Current Engineering and Technology, Vol.8, No.3 (May/June 2018)
Ashish Avinash Vadhe Design and Optimization of Formula SAE Suspension system
633| International Journal of Current Engineering and Technology, Vol.8, No.3 (May/June 2018)
Ashish Avinash Vadhe Design and Optimization of Formula SAE Suspension system
634| International Journal of Current Engineering and Technology, Vol.8, No.3 (May/June 2018)
Ashish Avinash Vadhe Design and Optimization of Formula SAE Suspension system
635| International Journal of Current Engineering and Technology, Vol.8, No.3 (May/June 2018)