Page 1
Design and Performance Assessments of Solar Driven
Liquid Desiccant Air Conditioning System Components
A thesis submitted in fulfilment of the requirements for the degree of
Doctor of Philosophy
by
Bukke Kiran Naik
(Roll No. 146103001)
Department of Mechanical Engineering
Indian Institute of Technology Guwahati
Guwahati – 781039, India
January 2019
Page 2
THESIS CERTIFICATION
This is to certify that the work contained in this thesis entitled Design and Performance
Assessments of Solar Driven Liquid Desiccant Air Conditioning System Components by
Bukke Kiran Naik, a student of the Department of Mechanical Engineering, Indian Institute
of Technology Guwahati, for the award of degree of Doctor of Philosophy has been carried
out under my supervision and that this work has not been submitted elsewhere for any degree.
Prof. P. Muthukumar
Professor
Department of Mechanical Engineering
Indian Institute of Technology Guwahati
Guwahati-781039, Assam
INDIA
Department of Mechanical Engineering
Indian Institute of Technology Guwahati
Guwahati-781039
INDIA
TH-1963_146103001
Page 3
Dedicated To
My M-Tech and Ph.D. Thesis Supervisor
Prof. P. Muthukumar
TH-1963_146103001
Page 4
Acknowledgement
i
ACKNOWLEDGEMENT
I would like to convey my profound sense of gratitude to my supervisor Prof. P. Muthukumar,
Professor, Department of Mechanical Engineering, IIT Guwahati for his continuous guidance,
support, motivation and constant encouragement helped me to complete this work successfully.
Working under him has been a great experience for me and I am very much thankful to him for
building up my confidence and for having faith in me during the project period, his suggestions
broadened my views in engineering subjects as well as practical life.
I express my heartfelt thanks to Late Prof. S. C. Mishra, Professor, Department of Mechanical
Engineering, IIT Guwahati for motivating me and for insisting me to pursue Ph.D. I will
remember him throughout my career. I am grateful to Emeritus Prof. Manfred Groll, IKE,
University of Stuttgart, Germany for providing valuable technical suggestions and ideas during
the initial stage of my research work which forwarded my research progress to six months
ahead.
I would like to thank Engineering Section, IIT Guwahati for proving financial support (Project
No.: IITG/ENGG/15/NIQ/09). I thank DST for providing SERB–ITS travel grant (ITS/Off-
529/2017-18) to attend the ISHPC 2017 international conference held at Waseda University,
Tokyo, Japan. I also thank people of engineering and maintenance section especially, I thank
Mr. A. Goswami, Mr. S. Senapati, Mr. Dasgupta, Mr. D. Bhagawathi, Mr. Indrajit Das, Mr. K.
Barman and Mr. T. J. Singh for providing necessary support during the course of investigation.
I am thankful to Mr. S. Ragahavan, Managing Director (MD), Best Systems and Services,
Kodambakkam, Chennai for helping in fabricating the experimental setup. I also thank Mr. Nip
Borah, Scientific officer for providing necessary equipment throughout the study. I also thank
workers Mr. Dipankar, Mr. Atanu and Mr. Vimal of A/C plant and Cycle shop workers for
their support and kind cooperation which helped me a lot, to work on my project successfully.
I am thankful to my doctoral committee members, Dr. Amaresh Dalal, Dr. Chandan Das and
Prof. N. Sahoo for their valuable suggestions and encouragement during the period of my
research work. I would like to express my sincere thanks to Prof. S. K. Dwivedy (HOD,
Mechanical Engineering Department) for providing research facilities needed during my
research work and financial support extended by Mechanical Engineering Department. I
specially thank Mr. Amzad, Mr. Nip Borah and Mr. D. Chetri for their help during the course
TH-1963_146103001
Page 5
Acknowledgement
ii
of fabrication of the evacuated U – tube solar collector and also, for their assistance when
needed during my experimental studies.
I am thankful to my seniors Dr. B. Satya Sekhar, Dr. S. Anbarasu, Dr. Hakeem Niyas, Mr.
Chilaka Ravi Chandra Rao, Dr. Niraj Kumar Mishra, Ms. D. V. N Lakshmi, Dr. L. G. Kiran
Kumar, Dr. Gyan Sagar Sinha and Dr. Debakanta Rabha for their career guidance and support
whenever required. They also have motivated me in various aspects of my research work.
I am very much thankful to my project mates Mr. Ankit Soni, Mr. Ankit Varshney, Mr. Vikas
Choudhary, Mr. Amit kumar, Mr. Chiraprabha Bhattacharya, Mr. P. Sunil Kumar, Mr. Mrinal
Bhowmik, Mr. Mullapudi Joshi, Mr. Bhargava Sunkara, Mr. Lav Mittal, Mr. Balamurugan and
Mr. Arvind for their assistance and support during my Ph.D.
I am also thankful to my lab colleagues, Mr. Vivek Selvan, Mr. Nithin Narmada, Mr. Lav
Kumar Kaushik, Mr. Sunku Prasad, Mr. Vigneshwaran, Mr. Surendhar, Mr. Viswanth Ms.
Jasinta Poonam Ekka, Ms. Sunita Deb, Mr. Malleswara Rao, Mr. Bharat kumar, Mr. Alok
kumar, Mr. Sayanthan Jana, Mr. G. Sodhi, Mr. K. Durga Prasad, Mr. Jagath, Mr. R. Unnava,
Mr. D. Pradeep, Mr. Narendra Naik, Mr. Mood Mohan, Mr. B. Ramesh Naik Mr. Yeswanth
kumar, Mr. Mallikarjuna, Mr. Nagarjuna and other colleagues of IITG for their valuable
friendship and making my stay at IIT Guwahati a memorable experience. I wish to express my
deepest gratitude to all those who have helped me in various ways during the tenure of my PhD
work at IIT Guwahati.
I am very much thankful to my parents Mr. B. Venkata Siddu and Mrs. B. Radhabai, my
younger brother Mr. B. Suresh Naik, my wife Mrs. B. Lekhya, my Uncle Mr. B. Siva, my aunt
Mrs. B. Kamala, my younger brother Mr. B. Hemanth Naik, my younger sister Ms. B. Kusuma
and Father in law Mr. M. Bavasingh Naik and their family who’s never ending support inspires
me to do my best. Especially, I thank my parents who have encouraged me to pursue higher
studies and their never ending sacrifices helped me to reach my career goals. I am thankful to
my wonderful kid Master B. Rithik Naik for always making me smile. I also thank my B –
Tech roommates, Mr. M. Krishna Sarath, Mr. Seelam Vishnu Vardhan Naidu and my B – tech
friends, Mr. P. Venu, Mr. G. Pavan, Mr. P. V. R. Mohan, Mr. K. Dileep, Mr. Vamsi and Mr.
T. Sudhakar for their support and motivation to pursue higher studies in premier institute IIT
Guwahati.
Bukke Kiran Naik
TH-1963_146103001
Page 6
Abstract
i
ABSTRACT
In recent years, solar driven liquid desiccant based ACS has been projected as a promising
alternative for handling large latent heat loads (> 50 TR or 176 kW) compared to solid
desiccant, vapour compression and vapour absorption based ACSs. Dehumidifier, regenerator
and solar collector are the key components of solar driven liquid desiccant based ACS.
Dehumidifier works based on the principle of condensation whereas regenerator works based
on the principle of evaporation. In the dehumidifier, desorption of water vapour takes place
from ambient air to the liquid desiccant whereas in the regenerator, absorption of water vapour
takes place from the liquid desiccant to the ambient air. During absorption and desorption
processes, simultaneous heat and mass exchange occurs in between the air and the liquid
desiccant. The driving force for heat exchange is the temperature difference whereas for the
mass exchange, it is the vapour pressure difference between the air and the desiccant. These
driving forces depend upon the changes in local temperature and vapour pressure at the air –
desiccant interface.
Several thermodynamic models have been developed for predicting the simultaneous heat and
mass exchange processes occur in the adiabatic dehumidification/regeneration system which
includes finite difference model, ε – NTU model and simplified models. Considerable
experimental studies have been also performed for analysing the performance of the adiabatic
liquid desiccant dehumidification and regeneration systems by employing different liquid
desiccant materials, packings in a packed tower and flow patterns. It is noted that very few
researchers have carried out the exergy analyses of the liquid desiccant
dehumidification/regeneration system.
Numerous studies reported on analysing the performance of the evacuated tube and flat plate
type solar collectors showed that evacuated tube type solar collectors were more efficient
compared to flat plate type solar collectors. Several types of evacuated tube solar collector
configurations viz. U – type, H – type, T – type, heat pipe type, etc. have been reported for
various solar thermal utilization applications. Among these, owing to simplicity in design and
lower investment cost factors, evacuated U – tube solar collector is considered for present
investigation. The solar radiation incident on the outer glass surface of the evacuated tube is
transferred to the inner glass tube through radiative heat transfer and then the heat is absorbed
TH-1963_146103001
Page 7
Abstract
ii
by the U – tube. From U – tube, the heat is exchanged to the working fluid. Research on
evacuated tube type solar collectors have been initiated during 1970s. But the investigations on
evacuated U – tube solar collector was started very recently. From the literature, it is observed
that very few researchers have analysed the thermal performance of the evacuated U – tube
solar collector by performing experimental studies and by employing numerical/mathematical
models. The reported numerical/mathematical models are not suited for predicting the working
fluid transition time and the variation of heat transfer characteristics along the length of the
evacuated U – tube solar collector. Further, there is a lack of profound experimental studies on
performance of the evacuated U – tube solar collector system (multiple evacuated U – tubes
connected to a manifold). It is also observed from the literature that limited research works
have been carried out on investigating energy and exergy efficiencies of the evacuated U – tube
solar collector.
In view of the above, the following objectives are considered in the present work
To develop thermal models for evaluating the performances of solar driven liquid desiccant
ACS components such as liquid desiccant dehumidifier/regenerator and evacuated U – tube
solar collector.
To design and fabricate solar driven liquid desiccant ACS components for achieving
dehumidified air of 18 kW capacity.
To perform a detailed experimental study on solar driven liquid desiccant ACS components
at different operating and ambient conditions.
To carryout energy and exergy analyses on individual components of solar driven liquid
desiccant ACS.
An experimental investigation for estimating the overall energy exchange between the liquid
desiccant and the ambient air and the variation of ambient and operating parameters along the
liquid desiccant dehumidification/regeneration system are presented in accordance with humid
subtropical climate. An experimental correlation for specific humidity ratio difference in terms
of known inlet parameters is developed for both the dehumidification and the regeneration
systems. A thermodynamic model is developed for analyzing the heat and mass transfer
interaction between air and desiccant solution along a counter-flow packed tower (liquid
desiccant dehumidifier/regenerator). An algorithm using a backtracking approach is introduced
for simulating the transfer processes in the packed tower. The predicted simulation results are
in good agreement with the experimental data available in the literature for the counter-flow
TH-1963_146103001
Page 8
Abstract
iii
packed tower. The contour plots are presented for analyzing the transfer processes along the
height of the packed tower. The performances of the dehumidifier, the regenerator and the
cooling tower are predicted at various operating conditions and tower specifications.
In addition, the coupled heat and mass transfer processes occurring in a cross-flow liquid
desiccant dehumidifier and regenerator are analyzed. A novel finite difference based
thermodynamic model is developed using the governing equations of mass, momentum and
energy and a recursive algorithm is proposed for solving the developed model. The simulated
results obtained from the developed model are validated with the experimental data reported in
the literature and a good agreement is observed between them. The contour plots for the
distribution of air and desiccant enthalpies, air specific humidity and solution concentration
along the longitudinal and the transverse directions of the packed tower are represented. Also,
the contour plots for the desiccant concentration at different Lewis numbers are presented.
Further, the influence of Lewis number on operating and performance parameters are also
discussed in detail.
Present investigation also focuses on deriving the expressions for energy, exergy and entransy
(EEE) of the regenerator and quantifies them along the height of the liquid desiccant
regenerator. By varying the operating parameters such as desiccant temperature and
concentration, air temperature and humidity ratio and air and desiccant flow rates, the
performance of the regenerator is investigated in terms of entransy, exergy and desorption
efficiencies. From the EEE analyses, it is observed that by increasing the desiccant temperature
from 60.3 °C to 65.2 °C and decreasing the air humidity ratio from 18.7 gwv/kgda to 14.3 gwv/kgda
simultaneously, the overall energy exchange, exergy destruction and entransy dissipation are
increased by 26%, 37% and 39%, respectively.
Further, an experimental setup of an evacuated U – tube solar collector system has been
designed and fabricated for testing the performance of the system. Based on experimental
analysis, three empirical correlations for predicting working fluid transition time, energy
efficiency and exergy efficiency are developed as the function of operating parameters and
ambient temperature. Data predicted from these correlations match with the experimental data
with the maximum error of ±12.7 %, ±6.9 % and ±7.8 % for working fluid transition time,
energy efficiency and exergy efficiency of an evacuated U – tube solar collector, respectively.
A three dimensional numerical model is developed for predicting the working fluid outlet
temperature of a single evacuated U – tube solar collector and for the whole solar collector
TH-1963_146103001
Page 9
Abstract
iv
system. The model predictions are compared with the experimental data and a good agreement
exists between them. The working fluid transition time in an evacuated U – tube solar collector
is defined for analyzing the time taken by a working fluid to attain a steady state condition. The
influence of average solar irradiance on efficiency and useful heat rate of the solar collector is
studied theoretically for two different evacuated tube configurations. Further, performance of
the evacuated tube solar collector is investigated theoretically by employing water and air as
working fluid, copper, aluminium and brass as U–tube material, and graphite, magnesium
oxide and aluminium oxide as filler material.
TH-1963_146103001
Page 10
Nomenclature
v
NOMENCLATURE
𝑎𝑠 specific surface area per unit volume (m2/m3)
An+1 equally spaced node
A area of the structure packing chamber (m2)
AC air conditioning
ACS air conditioning system
Ac area of the collector (m2)
Cp specific heat at constant pressure (kJ/kg – K)
G mass flux or flow rate per unit cross sectional area (kg/m2–s)
h enthalpy (kJ/kg)
H height of the packed tower (m)
Δhdil dilution enthalpy difference (kJ/kg)
I solar intensity (kW/m2)
k integer denoting equally spaced 1 to ‘n’ no. of parts
km thermal conductivity of the material (W/m – K)
L length of the structured packing chamber (m)
L* effective length of the packed tower (m)
Le Lewis number
LDACS liquid desiccant AC system
LHS latent heat storage
L/G liquid to gas ratio
ṁ mass flow rate (kg/s)
N no. of iterations
TH-1963_146103001
Page 11
Nomenclature
vi
n no. of parts
Np no. of packing materials
N number of manifolds
Pssat statured vapour pressure at air – desiccant interface (kPa)
Patm atmospheric pressure (kPa)
P pressure (Pa)
Qex exergy destruction (kW)
Qexs sensible exergy destruction (kW)
Qexl latent exergy destruction (kW)
Qe energy exchange (kW)
Qes sensible energy exchange (kW)
Qel latent energy exchange (kW)
Qen entransy dissipation (kW – K)
Qens sensible entransy dissipation (kW – K)
Qenl latent entransy dissipation (kW – K)
Quseful useful heat gained by the working fluid (W)
R. H. relative humidity (%)
T temperature (oC)
V volume (m3)
v velocity (m/s)
W width of the structure packing chamber (m)
X concentration of the desiccant solution (%)
Z height (m)
TH-1963_146103001
Page 12
Nomenclature
vii
Greek symbols
𝛽 desiccant concentration (kgdes./kgsol.)
𝛽T coefficient of thermal expansion (1/K)
𝛼𝑚 mass transfer coefficient (kg/m2s)
𝛼ℎ heat transfer coefficient (W/m2K)
𝛿 latent heat of vaporization/condensation (kJ/kg)
φ latent heat (kJ/kg)
𝜔 air humidity ratio (kgv/kgda)
𝜆 evaporation/condensation rate (g/m2s)
𝛾 ratio of mass flux of working fluid and air
𝜉 effectiveness
h function of heat transfer coefficient and air mass flux
m function of mass transfer coefficient and air mass flux
T logarithmic function of thermal effectiveness
m logarithmic function of moisture effectiveness
ϕl latent enthalpy (kJ/kg)
ϕs sensible enthalpy (kJ/kg)
φ no. of experimental runs
ωs saturated air humidity ratio (kgv /kgda)
η efficiency (%)
ρ density (kg/m3)
μ dynamic viscosity of working fluid (N/m2-s)
α absorptivity of the U – tube material
αc absorptivity of the coating material
TH-1963_146103001
Page 13
Nomenclature
viii
τg,i transmissivity of the inner glass tube
τg,o transmissivity of the outer glass tube
ζ effective heat absorbed from the evacuated tube (kW/m2)
τ transmissivity of the glass tube
ηu energy efficiency (%)
ηex exergy efficiency (%)
ηu,sc energy efficiency of the evacuated U – tube solar collector system (%)
ηex,sc exergy efficiency of the evacuated U – tube solar collector system (%)
Subscripts
a air
amb ambient air
da dry air
e equilibrium
ex exergy
en entransy
h heat transfer
ini initial
l working fluid
m moisture/mass transfer
M mean fluid temperature
o overall
r reference
s liquid desiccant solution
sr solar radiation
TH-1963_146103001
Page 14
Nomenclature
ix
T thermal
v water vapour
wb wet bulb temperature
wf working fluid
w,o working fluid outlet
w,i working fluid inlet
wM1,i working fluid inlet at manifold 1
wM1,o working fluid outlet at manifold 1
wM2,i working fluid inlet at manifold 2
wM2,o working fluid outlet at manifold 2
wM3,i working fluid inlet at manifold 3
wM3,o working fluid outlet at manifold 3
wM1 – U,i working fluid inlet at U – tube of manifold 1
wM1 – U,o working fluid outlet at U – tube of manifold 1
wM2 – U,i working fluid inlet at U – tube of manifold 2
wM2 – U,o working fluid outlet at U – tube of manifold 2
wM3 – U,i working fluid inlet at U – tube of manifold 3
wM3 – U,o working fluid outlet at U – tube of manifold 3
wf,o working fluid outlet
wf,i working fluid inlet
Superscripts
avg average
i inlet
o outlet
TH-1963_146103001
Page 15
TH-1963_146103001
Page 16
Contents
xi
CONTENTS
Chapter Title Page No.
ACKNOWLEDGEMENT i
ABSTRACT iii
NOMENCLATURE v
CONTENTS xi
LIST OF FIGURES xvii
LIST OF TABLES xxiii
1 INTRODUCTION 1
1.1 Desiccant Air-conditioning Systems 2
1.1.1 Working procedure 2
1.1.2 Benefits 3
1.1.3 Types of desiccant materials 4
1.2 Solar driven desiccant ACSs 8
1.3 Comparison of solar driven liquid and solid desiccant based
ACSs
10
1.4 Motivation of present work 11
1.5 Structure of the thesis 12
2 STATE OF ART 15
2.1 Design of Liquid Desiccant Dehumidification/Regeneration
System
15
2.1.1 Low Flow liquid desiccant systems 16
2.1.2 U-shaped spray tower 17
2.2 Thermal Models for Liquid Desiccant
Dehumidification/Regeneration System
17
2.3 Experimental Studies for Liquid Desiccant
Dehumidification/Regeneration System
20
2.4 Exergy and Entransy Analyses of a Liquid Desiccant
Regenerator
23
2.5 Application of Solar Energy as Low-Grade Energy 23
2.5.1 Numerical studies on evacuated U – tube solar
collector
25
TH-1963_146103001
Page 17
Contents
xii
2.5.2 Experimental studies on evacuated U – tube solar
collector
26
2.6 Literature closure 28
2.6.1 Liquid desiccant dehumidification/regeneration
system
28
2.6.2 Evacuated U – tube solar collector system 29
2.6.3 Objectives of the present work 30
3 NUMERICAL STUDIES 31
3.1 Liquid desiccant dehumidification/regeneration system 31
3.1.1 Thermodynamic model for counter-flow packed tower 32
3.1.2 Numerical simulation 38
3.1.3 Validation of developed thermodynamic model 42
3.1.4 Contour plots for air and desiccant solution operating
and performance parameters
46
3.2 Evacuated U – tube solar collector system 50
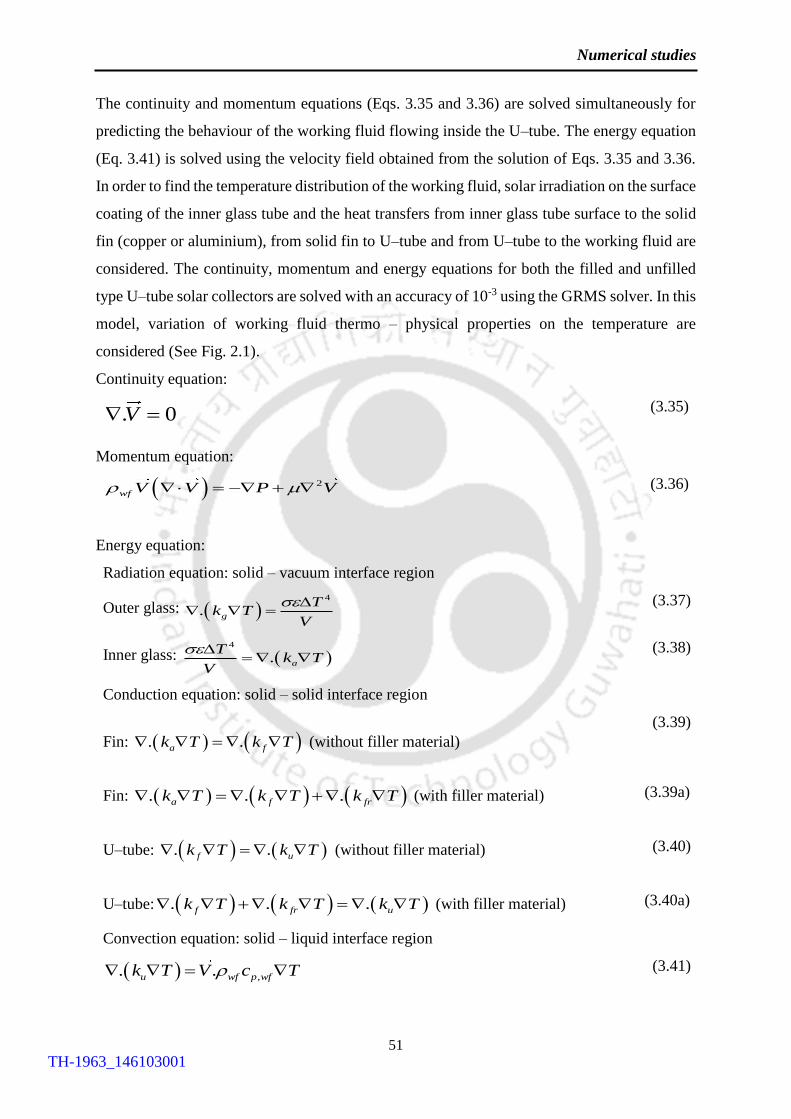
3.2.1 Boundary conditions 51
3.2.2 Mesh generation 52
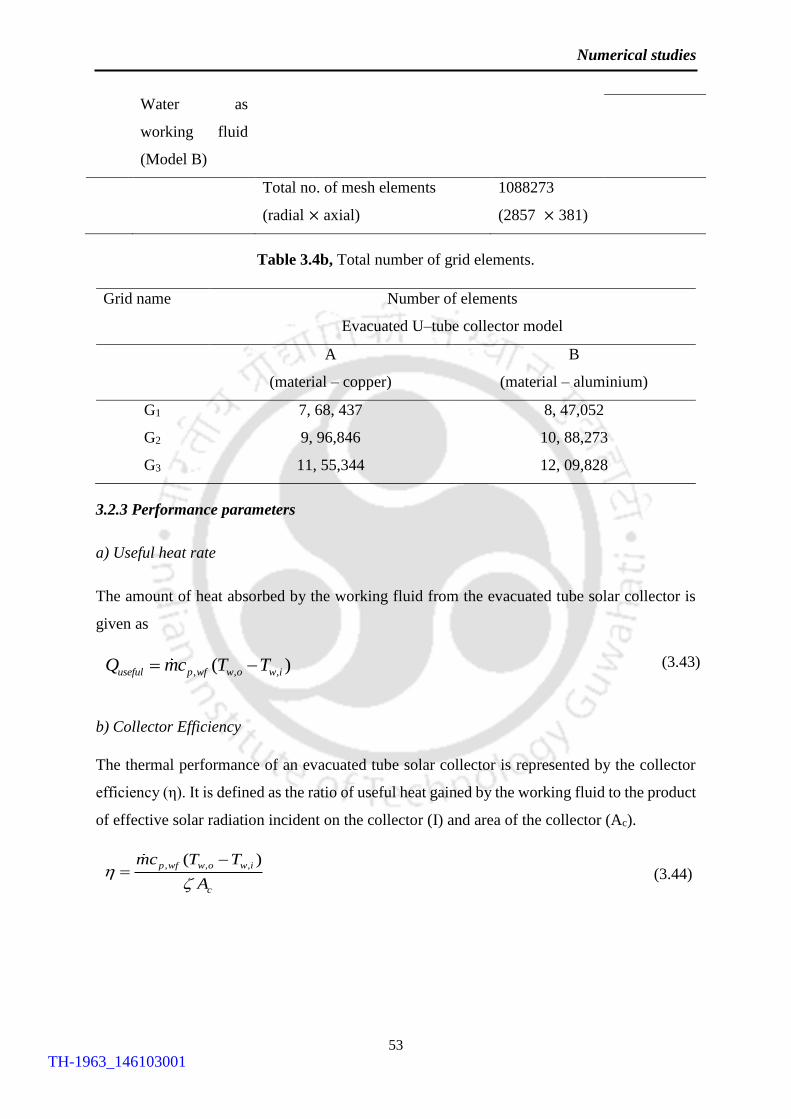
3.2.3 Performance parameters 53
3.2.4 Validation of developed numerical model 54
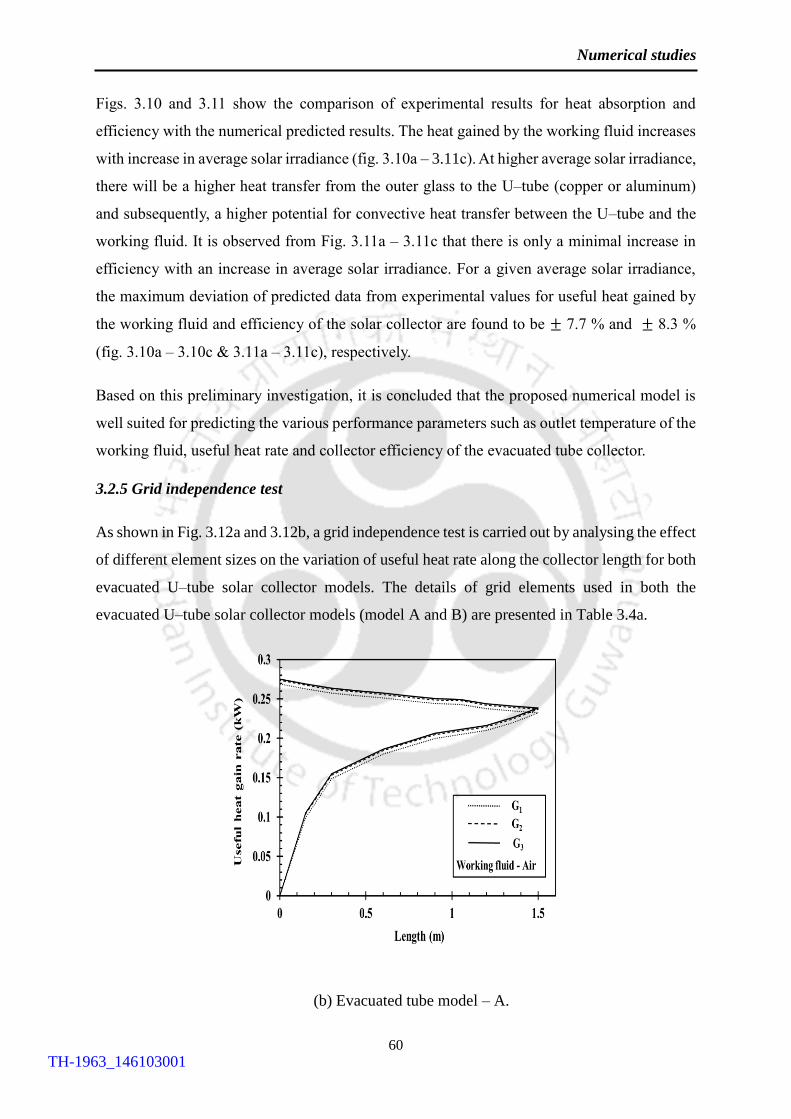
3.2.5 Grid independence test 60
3.2.6 Results and discussion 61
3.3 Summary 71
3.3.1 Liquid desiccant dehumidifier/regenerator 71
3.3.2 Evacuated U – tube solar collector 71
4 EXPERIMENTAL STUDIES 73
4.1 Experimental studies on liquid desiccant
dehumidification/regeneration system
73
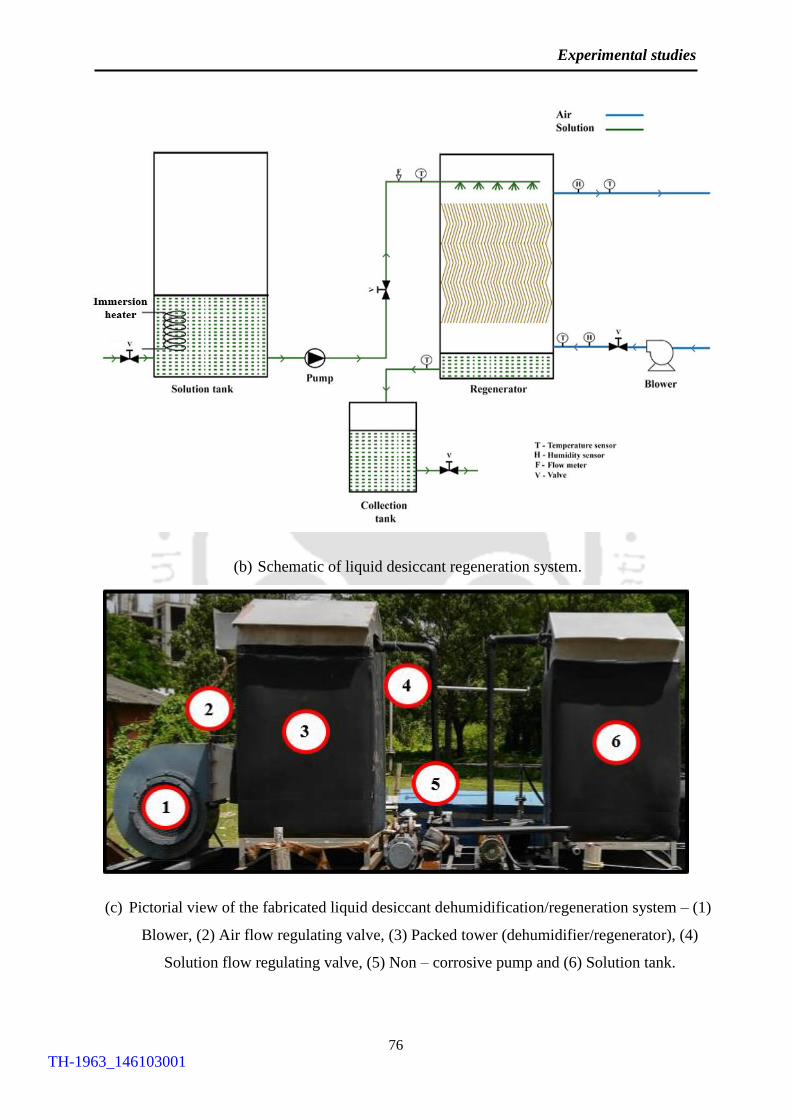
4.1.1 Details of experimental Setup and test procedure 73
4.1.2 Uncertainty in measurement 78
4.1.3 Performance characteristics 78
4.1.4 Experimental results and discussion 79
4.1.5 Energy exchange 84
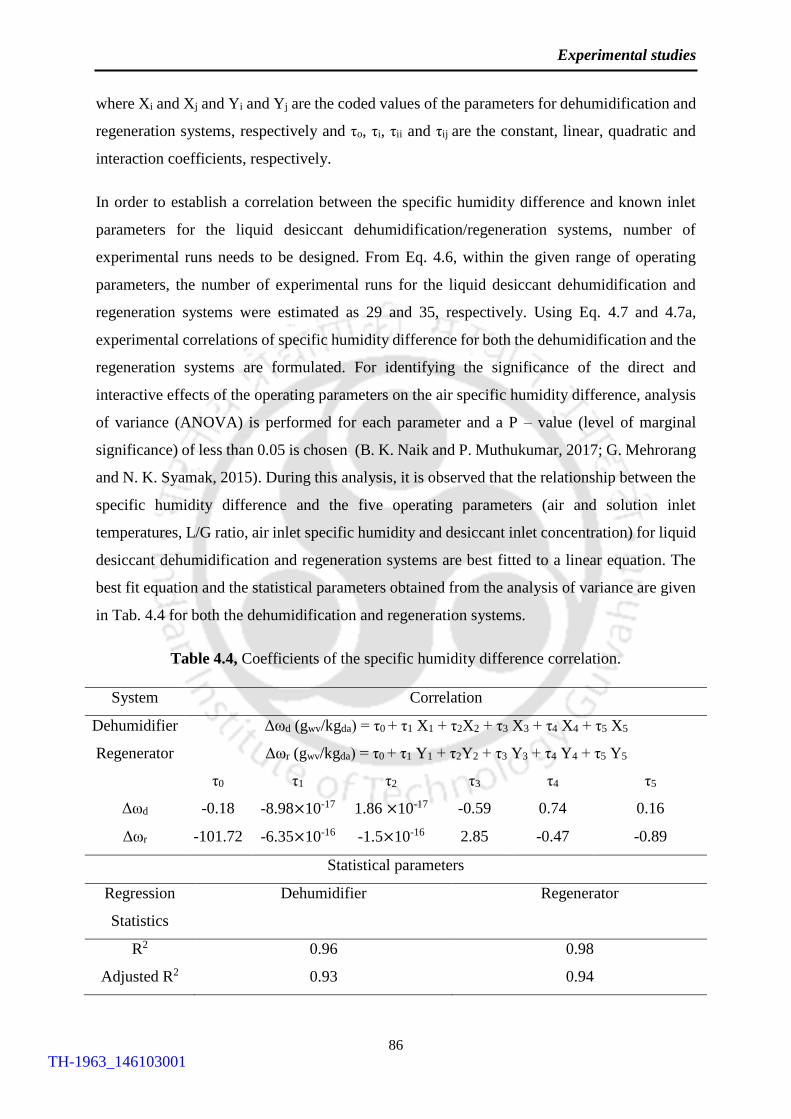
4.1.6 Experimental Correlation 85
TH-1963_146103001
Page 18
Contents
xiii
4.2 Evacuated U – tube solar collector system 88
4.2.1 Details of experimental Setup and test procedure 88
4.2.2 Uncertainty in measurement 91
4.2.3 Thermal modelling 91
4.2.4 Mesh generation and Grid independence test 93
4.2.5 Performance characteristics 95
4.2.6 Model validation 96
4.2.7 Working fluid transition time for an evacuated U –
tube solar collector
102
4.3 Summary 110
4.3.1 Liquid desiccant dehumidification/regeneration
system
110
4.3.2 Evacuated U – tube solar collector system 110
5 ENERGY AND EXERGY ANALYSES 113
5.1 Energy and exergy analysis of liquid desiccant regenerator 114
5.1.1 Energy analysis model 114
5.1.2 Exergy analysis model 116
5.1.3 Validation of developed energy and exergy analyses
model
119
5.1.4 Results and discussions 120
5.2 Energy and exergy analysis of evacuated U – tube solar
collector
127
5.2.1 Energy efficiency analysis of an evacuated U – tube
solar collector
127
5.2.2 Exergy efficiency analysis of an evacuated U – tube
solar collector
129
5.3 Energy and exergy analysis of evacuated U – tube solar
collector system
132
5.3.1 Efficiencies of the evacuated U – tube solar collector
system
132
5.4 Summary 134
5.4.1 Liquid desiccant regenerator 134
5.4.2 Evacuated U – tube solar collector 134
TH-1963_146103001
Page 19
Contents
xiv
6 CROSS-FLOW DEHUMIDIFIER/REGENERATOR 135
6.1 Preface 135
6.2 Thermodynamic model 136
6.2.1 Governing equations 137
6.2.2 Heat and mass transfer coefficients 138
6.3 Finite difference model 140
6.3.1 Recursive Algorithm 142
6.4 Validation of the developed model 144
6.4.1 Distribution profiles 145
6.4.2 Validation of operating parameters 148
6.5 Influence of Lewis number on dehumidification and
regeneration processes
149
6.5.2 Lewis number 149
6.5.2 Influence of Lewis number on operating parameters 150
6.5.3 Influence of Lewis number on condensation and
evaporation rates
155
6.6 Summary 157
7 ENTRANSY ANALYSIS 159
7.1 Entransy analysis model 159
7.1.1 Entransy dissipation in the liquid desiccant
regenerator
161
7.1.2 Entransy efficiency 162
7.2 Entransy analysis of the liquid desiccant regenerator 162
7.2.1 Entransy analysis along the height of the liquid
desiccant regenerator
162
7.2.2 Influence of operating parameters on entransy
efficiency of the regenerator
165
7.3 Summary 166
8 CONCLUSIONS AND FUTURE SCOPE 169
8.1 Liquid desiccant dehumidification/regeneration system 169
8.1.1 Numerical studies 169
8.1.2 Experimental studies 170
8.1.3 EEE analyses of liquid desiccant regenerator 171
TH-1963_146103001
Page 20
Contents
xv
8.2 Evacuated U – tube solar collector system 172
8.2.1 Numerical studies 172
8.2.2 Experimental studies 173
8.2.3 Energy and exergy analyses 173
8.3 Future scope 174
8.3.1 Liquid desiccant dehumidification system 174
8.3.2 Liquid desiccant regeneration system 174
8.3.3 Evacuated U – tube solar collector system 175
8.3.4 Liquid desiccant materials 175
REFERENCES 177
Appendix – A Governing Equations derivation 191
Appendix – B Uncertainty Analysis 193
LIST OF PUBLICATIONS 199
TH-1963_146103001
Page 21
TH-1963_146103001
Page 22
List of Figures
xvii
LIST OF FIGURES
Fig. No. Figure Name
Page No.
1.1 Process of moisture transfer by desiccant 3
1.2 Classification of desiccants materials 4
1.3 Working principle of solar driven desiccant ACSs 8
1.4 Schematic of solid desiccant wheel 9
1.5 Liquid desiccant dehumidification system 9
2.1 Schematic of evacuated U–tube solar collector a) Cross section and b) Longitudinal
section
25
3.1 Energy and mass balance across a packed tower (a) counter-flow
dehumidifier and (b) counter – flow regenerator
34
3.2 Flowchart for numerical simulation of the developed model 40
3.3 Height of the column divided into ‘n’ equal parts 41
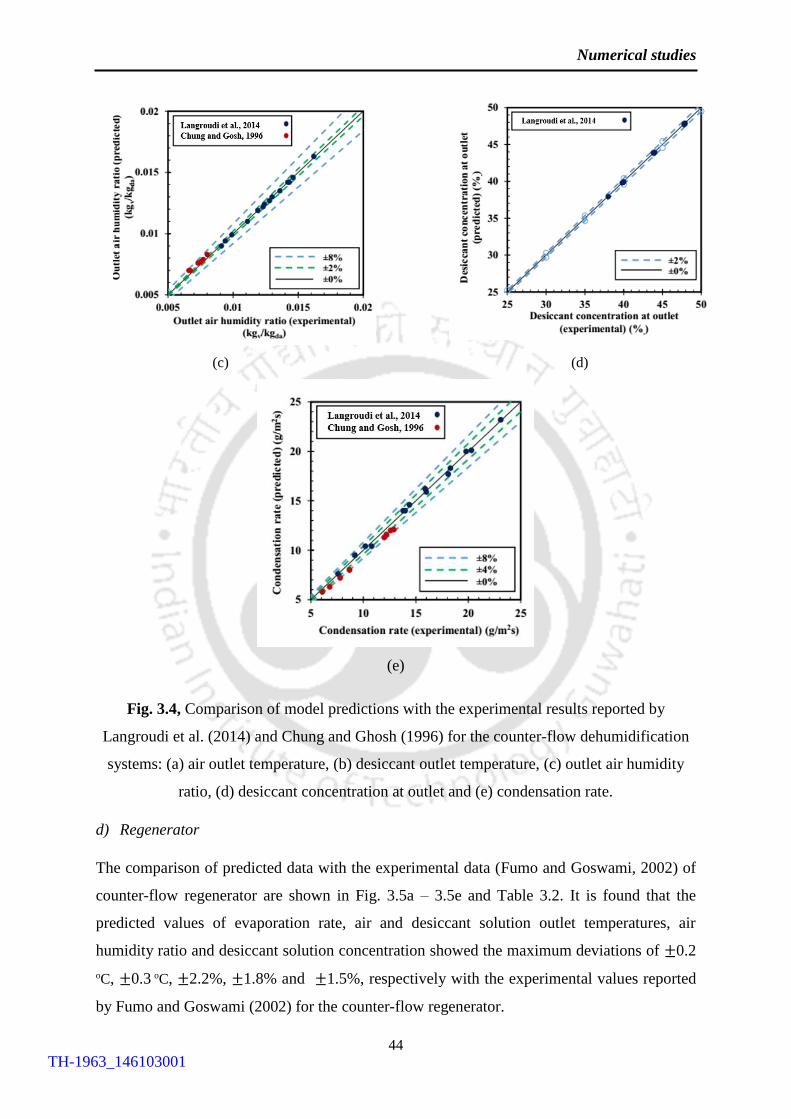
3.4 Comparison of model predictions with the experimental results reported by
Langroudi et al. (2014) and Chung and Ghosh (1996) for the counter-flow
dehumidification systems: (a) air outlet temperature, (b) desiccant outlet
temperature, (c) outlet air humidity ratio, (d) desiccant concentration at outlet
and (e) condensation rate
44
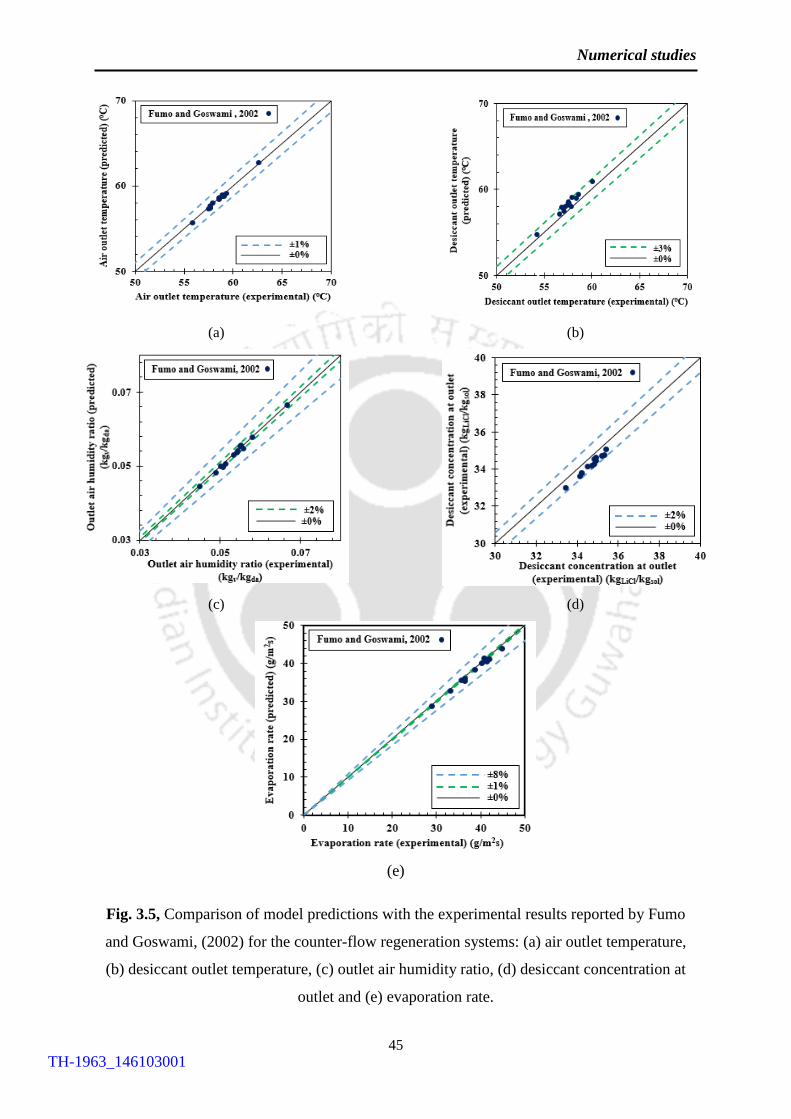
3.5 Comparison of model predictions with the experimental results reported by
Fumo and Goswami, (2002) for the counter-flow regeneration systems,
respectively: (a) air outlet temperature, (b) desiccant outlet temperature, (c)
outlet air humidity ratio, (d) desiccant concentration at outlet and (e)
evaporation rate
45
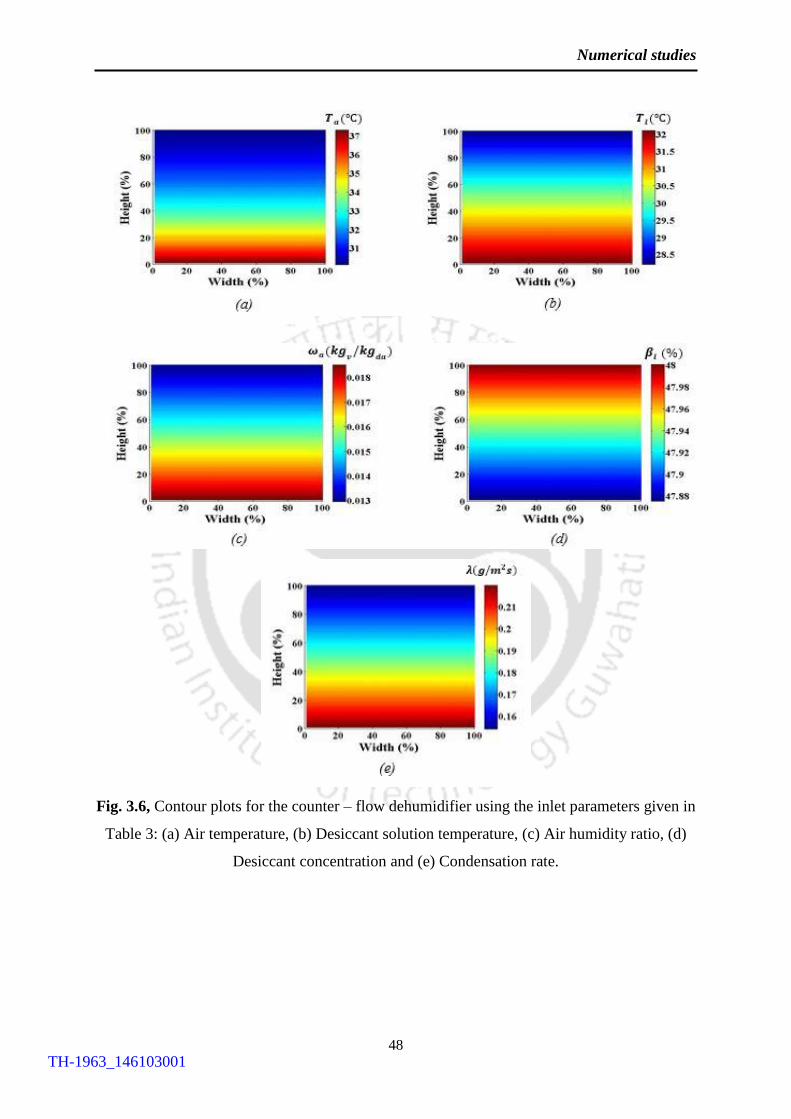
3.6 Contour plots for the counter – flow dehumidifier using the inlet parameters
given in Table 3: (a) Air temperature, (b) Desiccant solution temperature, (c)
Air humidity ratio, (d) Desiccant concentration and (e) Condensation rate
48
3.7 Contour plots for the counter-flow regenerator using the inlet parameters
given in Table3: (a) Air temperature, (b) Desiccant solution temperature, (c)
Air humidity ratio, (d) Desiccant concentration and (e) Evaporation rate
49
3.8 Temperature variation across the evacuated tube solar collector (Front view) 56
3.9 Temperature variation of working fluid along the collector length 56
TH-1963_146103001
Page 23
List of Figures
xviii
3.10 Comparison of numerically predicted heat gain with experimental data (Gao
et al, 2014 and Neeraj and Avadhesh, 2015): Influence of average solar
irradiance on heat gain for working fluid air (a and b) and water (c)
58
3.11 Comparison of experimental results (Gao et al, 2014 and Neeraj and
Avadhesh, 2015) with the numerical results: Influence of average solar
irradiance on efficiency of the evacuated tube solar collector (air (a and b)
and water (c))
59
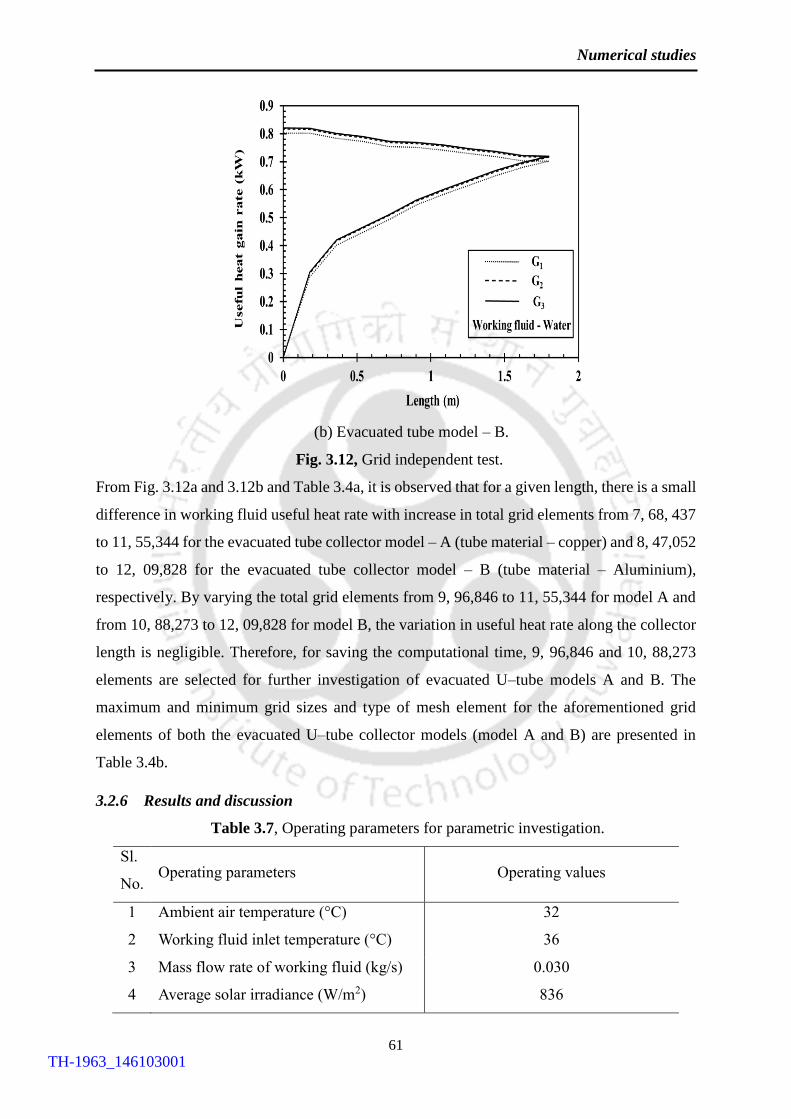
3.12 Grid independent test 61
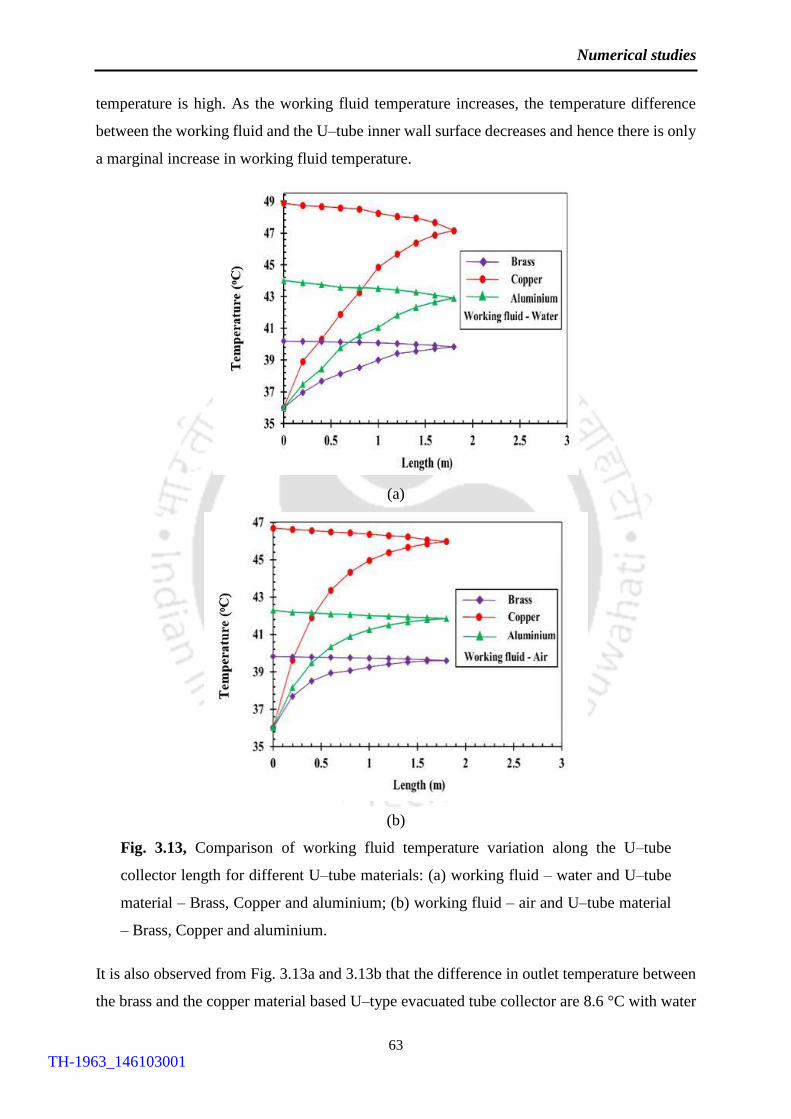
3.13 Comparison of working fluid temperature variation along the U–tube
collector length for different U–tube materials: (a) Working fluid – water and
U–tube material – Brass, Copper and aluminium; (b) Working fluid – air and
U–tube material – Brass, Copper and aluminium
63
3.14 Comparison of working fluid heat gain variation along the collector length
for different U–tube materials: (a) U–tube material – Brass and working fluid
– air and water; (b) U–tube material – Copper and working fluid – air and
water and (c) U–tube material – Aluminium and working fluid – air and water
65
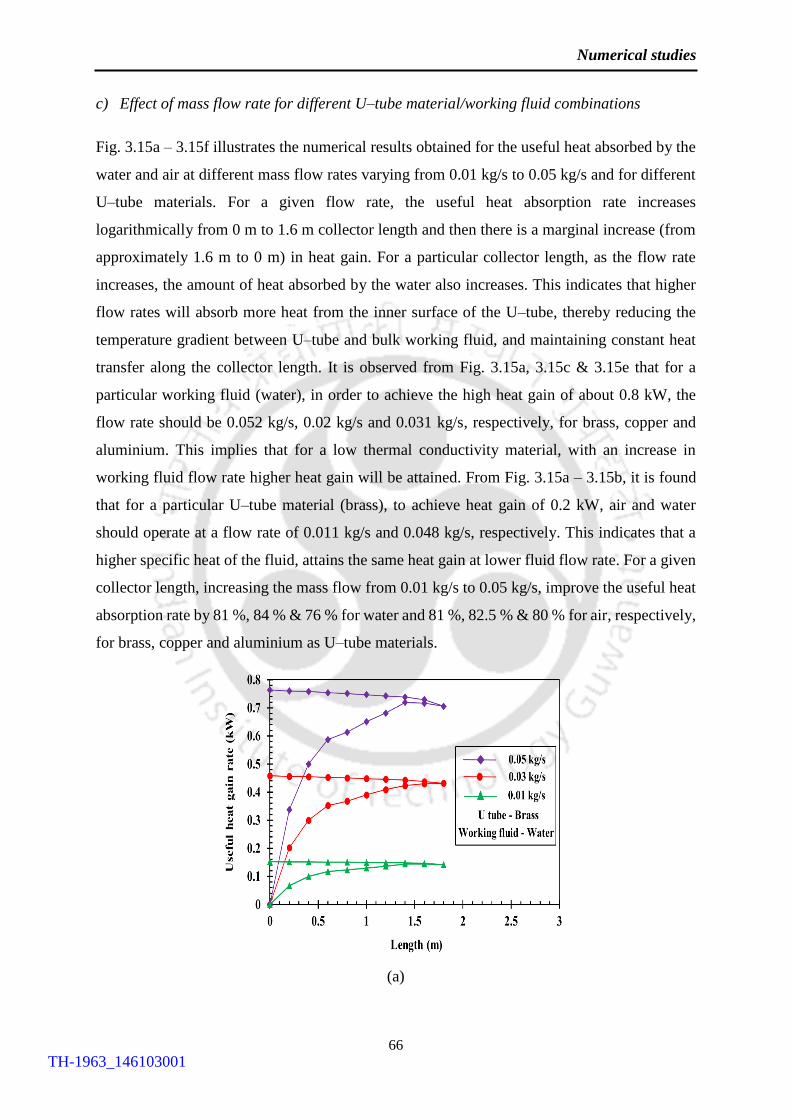
3.15 Comparison of working fluid heat gain variation along the U–tube collector
length for different mass flow rates: (a) U–tube material – brass and working
fluid – water; (b) U–tube material – Copper and working fluid – air; (c) U–
tube material – Aluminium and working fluid – water; (d) U–tube material –
brass and working fluid – air; (e) U–tube material – Copper and working fluid
– water and (f) U–tube material – Aluminium and working fluid – air
68
3.16 Influence of useful heat gained on efficiency of the evacuated tube solar
collector
69
3.17 Schematic of filler evacuated U–tube solar collector a) Cross section and b)
Longitudinal section
69
3.18 Influence of filler material on evacuated tube solar collector efficiency 70
4.1 Liquid desiccant dehumidification/regeneration system 77
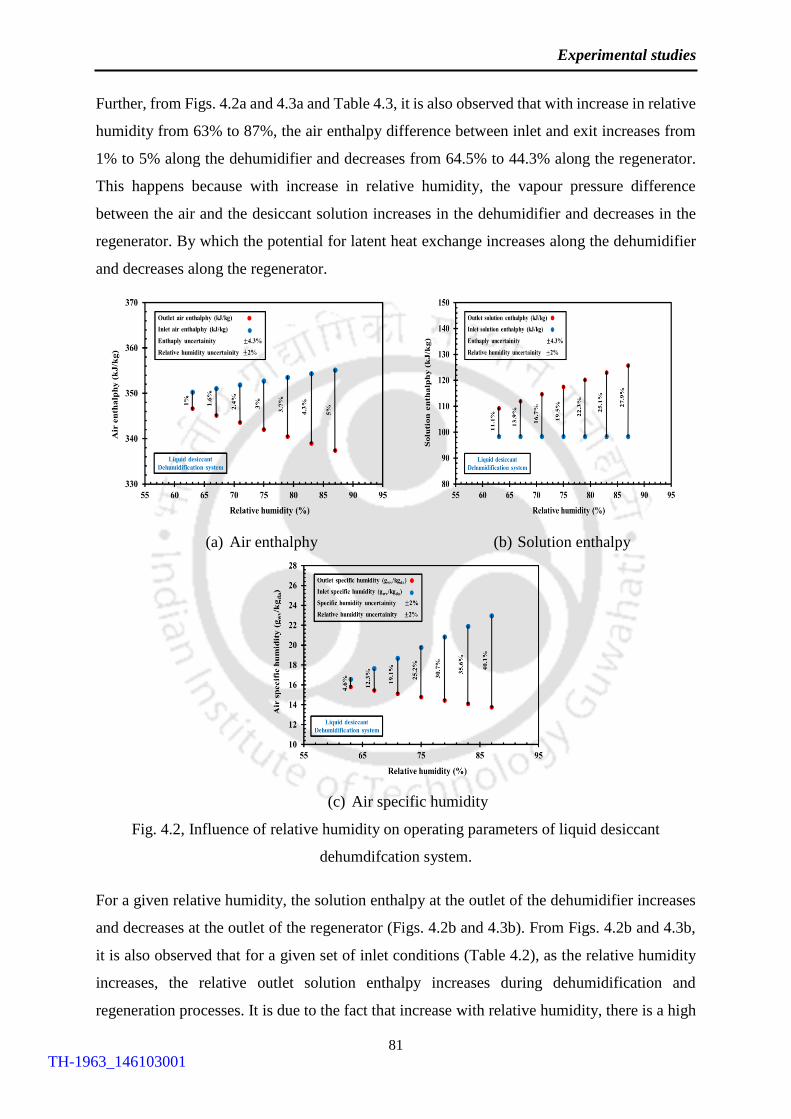
4.2 Influence of relative humidity on operating and ambient parameters – liquid
desiccant dehumidification system
81
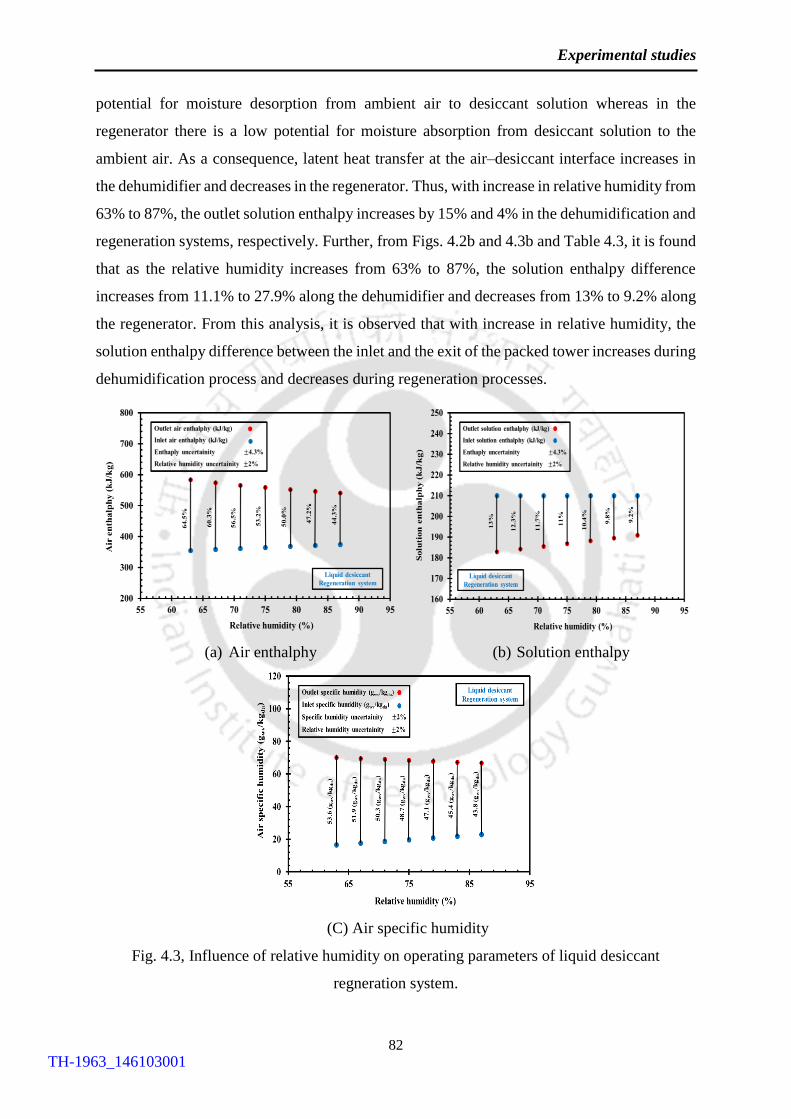
4.3 Influence of relative humidity on operating and ambient parameters – liquid
desiccant regeneration system
82
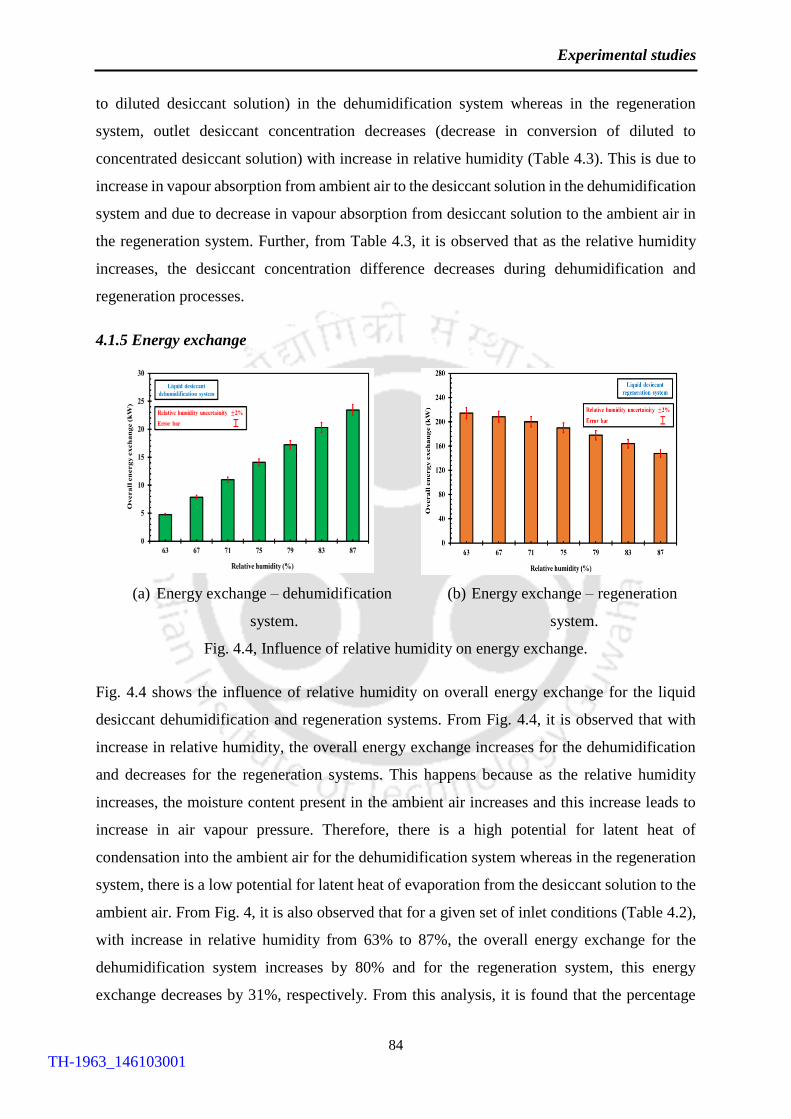
4.4 Influence of relative humidity on energy exchange
84
TH-1963_146103001
Page 24
List of Figures
xix
4.5 Validation of developed experimental correlation with the experimental
results and the influence of L/G ratio on the variation of condensation and
evaporation rates
87
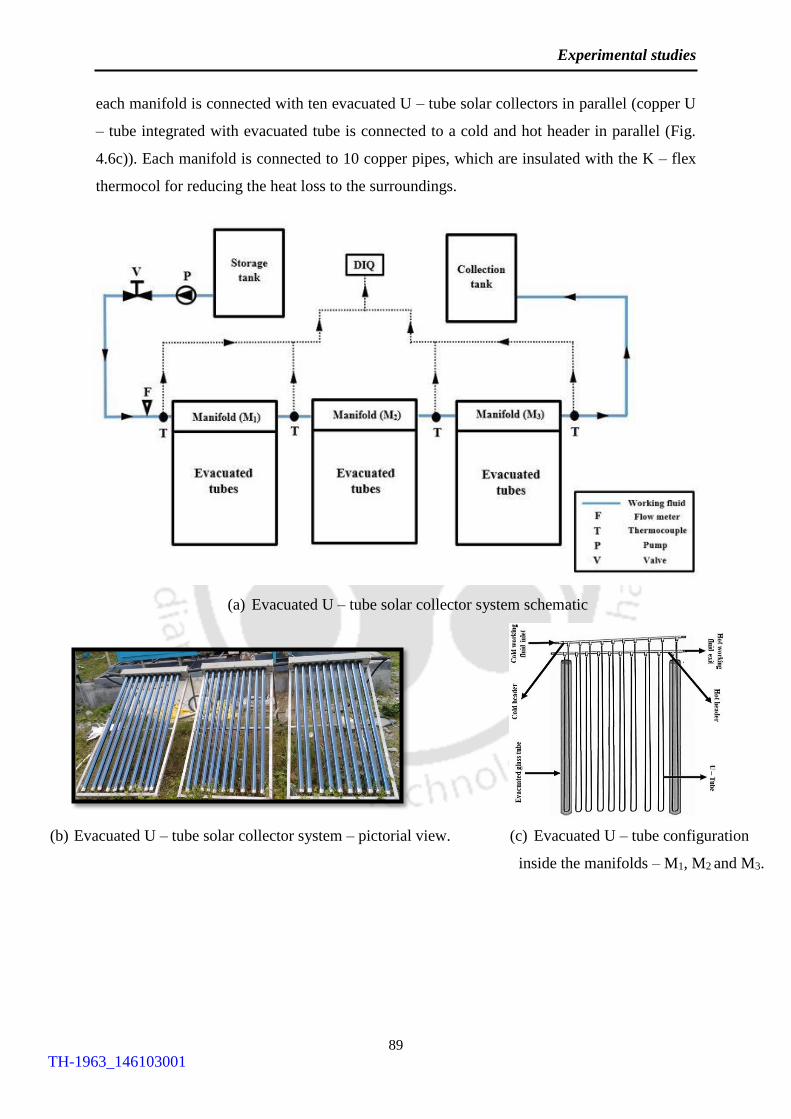
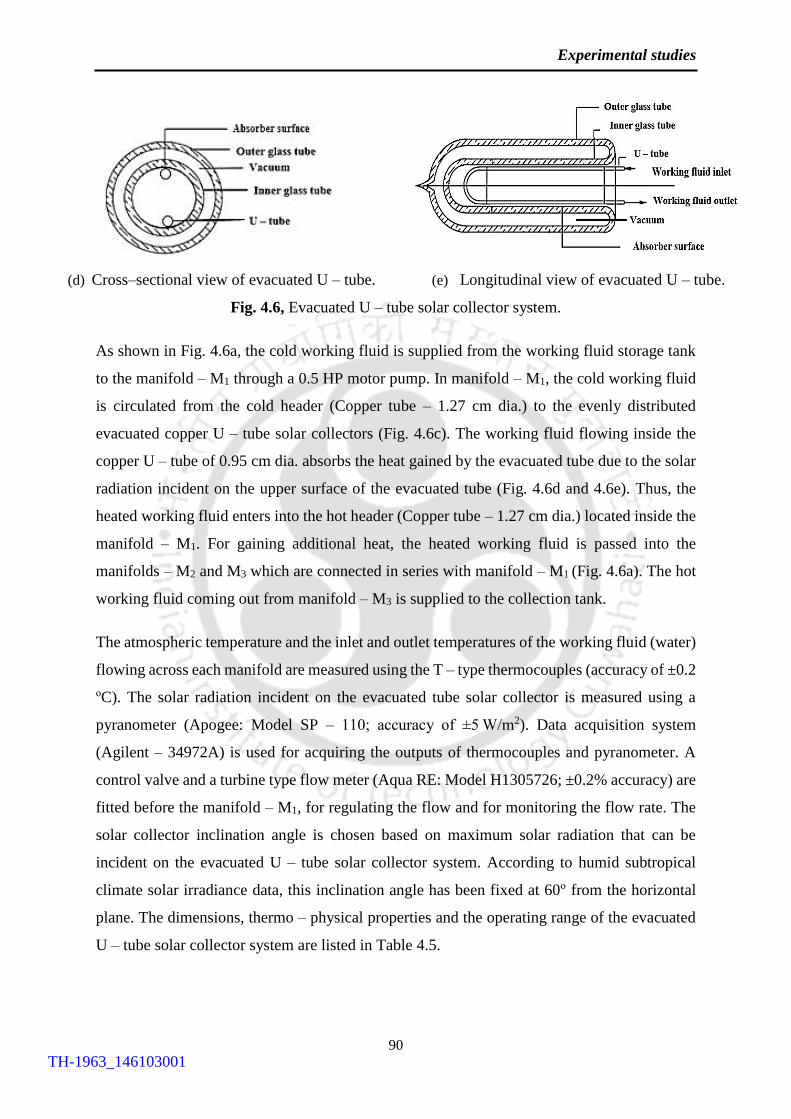
4.6 Evacuated U – tube solar collector system 89
4.7 Details of U – tube solar collector module 94
4.8 Grid independence test for U – tube solar collector module 95
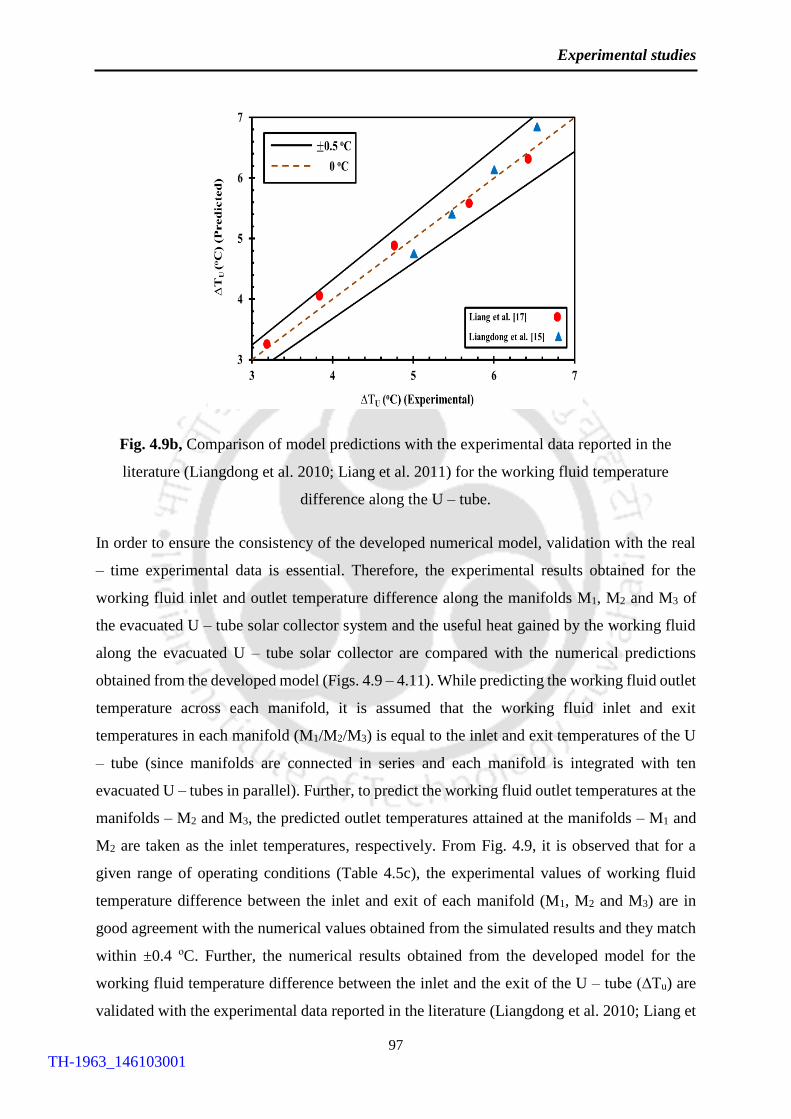
4.9 Comparison of model predictions with the experimental data for working
fluid inlet and outlet temperature difference along the manifolds M1, M2 and
M3
96
4.10 Comparison of experimental data with the developed numerical model
predictions and influences of operating parameters on useful heat flux
98
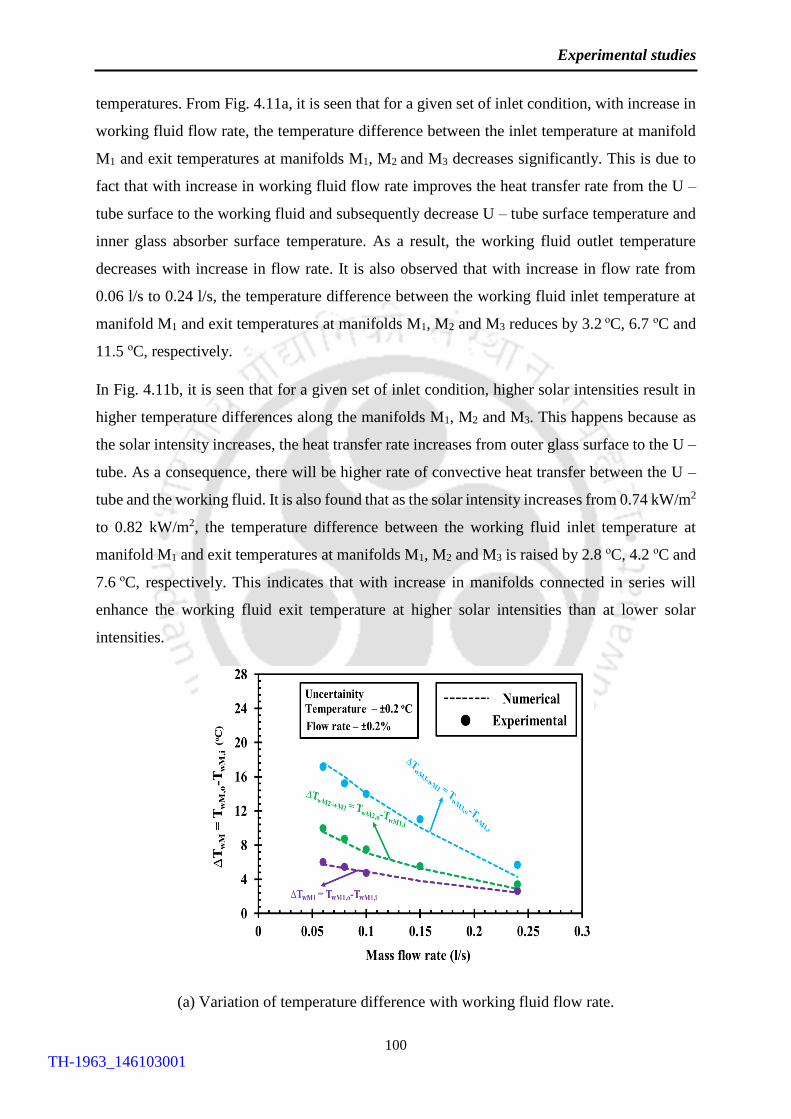
4.11 Numerical model validation and the variation of working fluid temperature
difference along the manifolds M1, M2 and M3 for a given range of operating
parameters (Table 4.5c)
101
4.12 Comparison of empirical correlation with the experimental data for the
working fluid transition time (λt) in an evacuated U – tube solar collector
104
4.13 Numerical analysis for the case study 106
4.14 Working fluid heat transfer characteristic variation along the length of the U
– tube after attaining the steady state condition
107
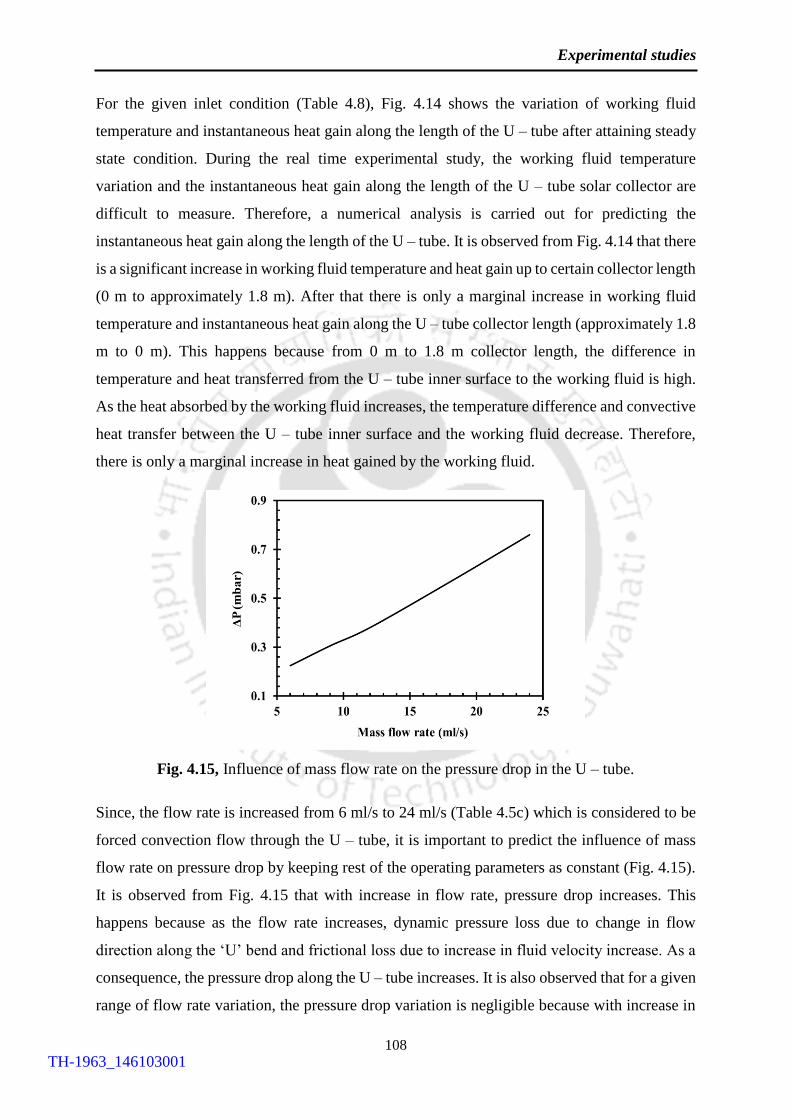
4.15 Influence of mass flow rate on the pressure drop in the U – tube 108
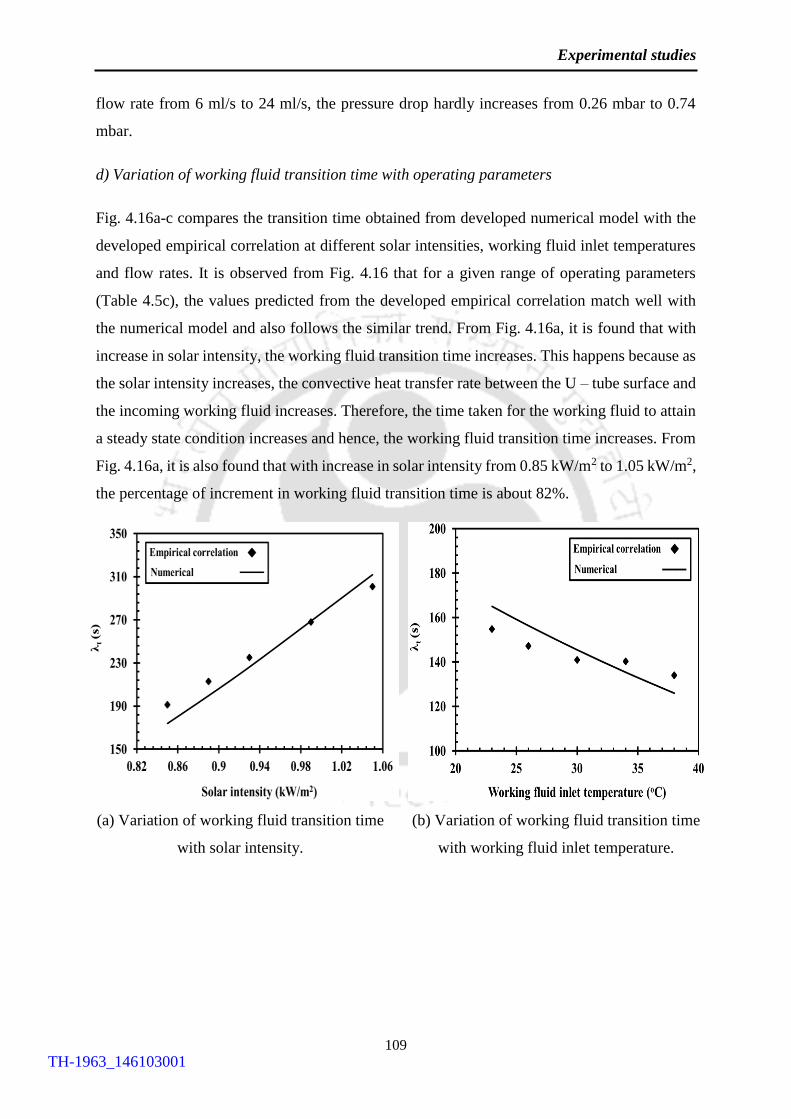
4.16 Validation of numerical model with the developed empirical correlation for
working fluid transition time and influences of operating parameters on the
variation of working fluid transition time
109
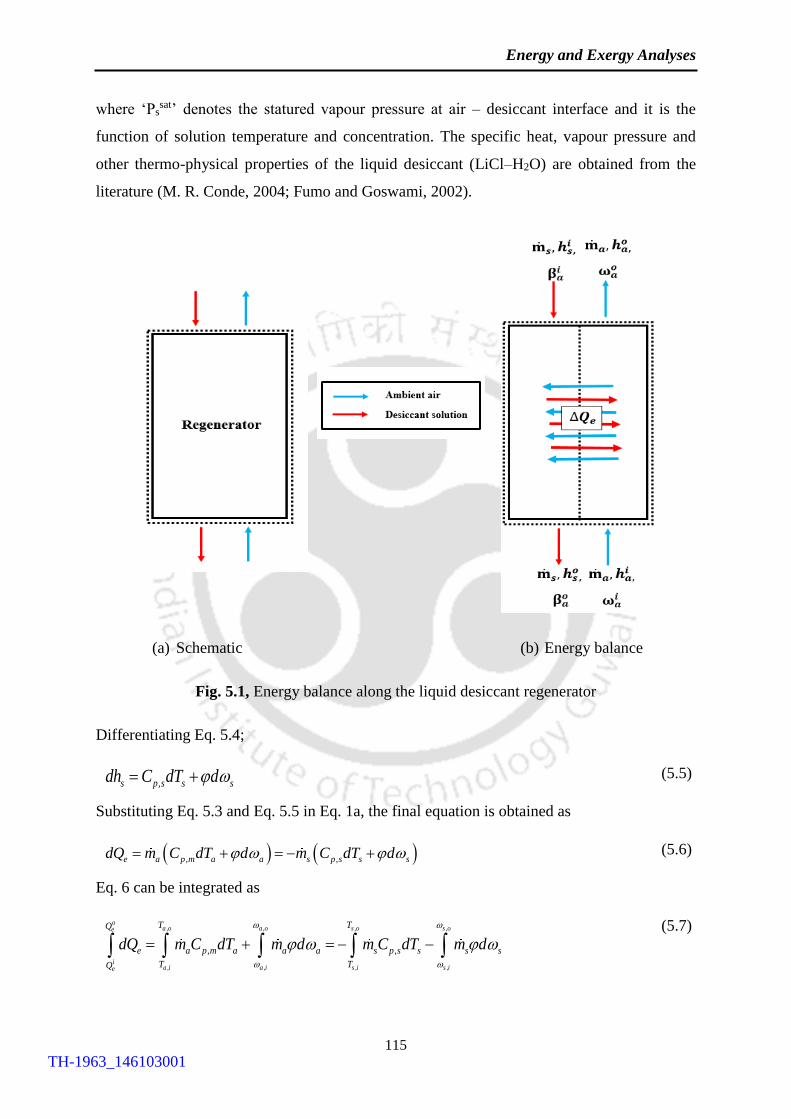
5.1 Energy balance along the liquid desiccant regenerator 115
5.2 Exergy destruction along the liquid desiccant regenerator 117
5.3 Energy balance between air and desiccant solution for the experimental data
reported in the literature (Fumo and Goswami, 2002)
119
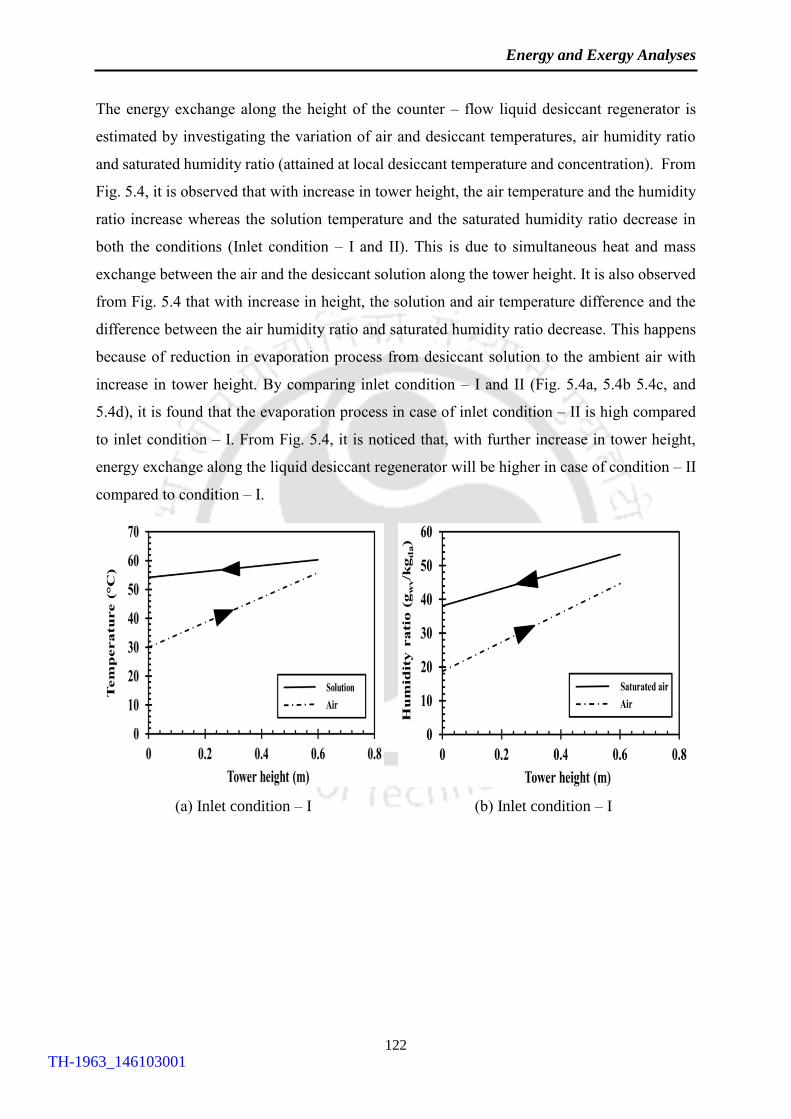
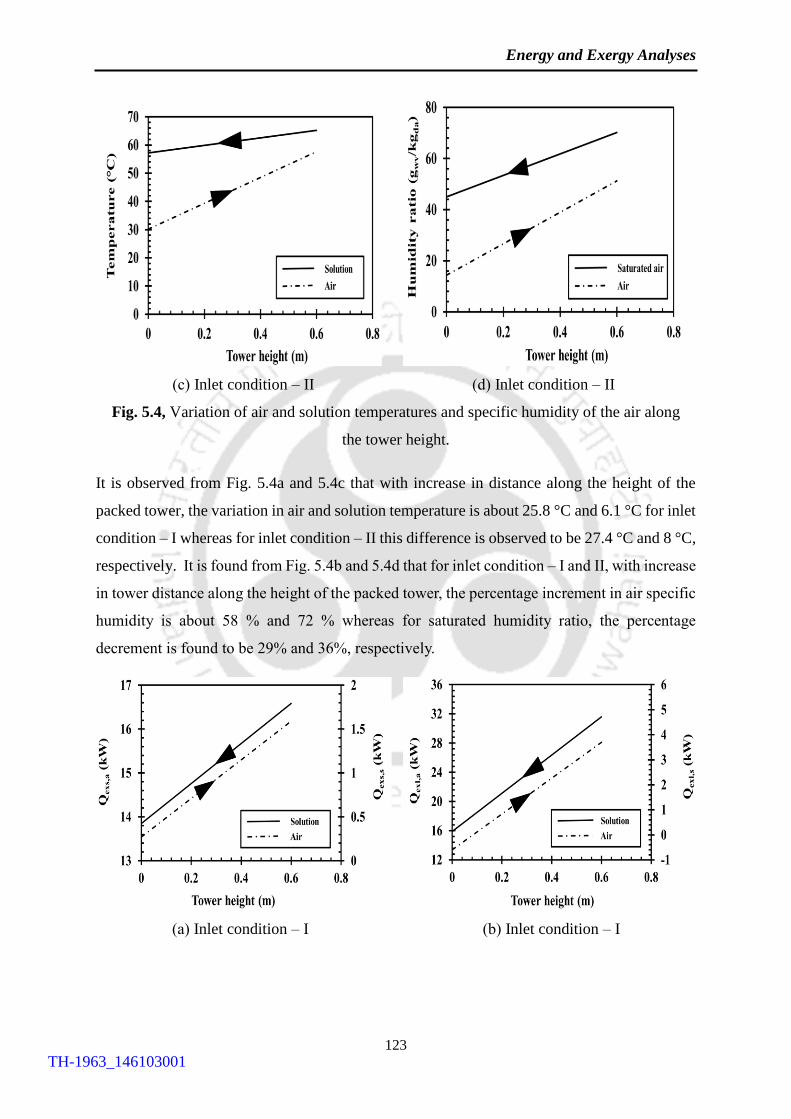
5.4 Variation of air and solution temperatures and specific humidity of the air
along the tower height
122
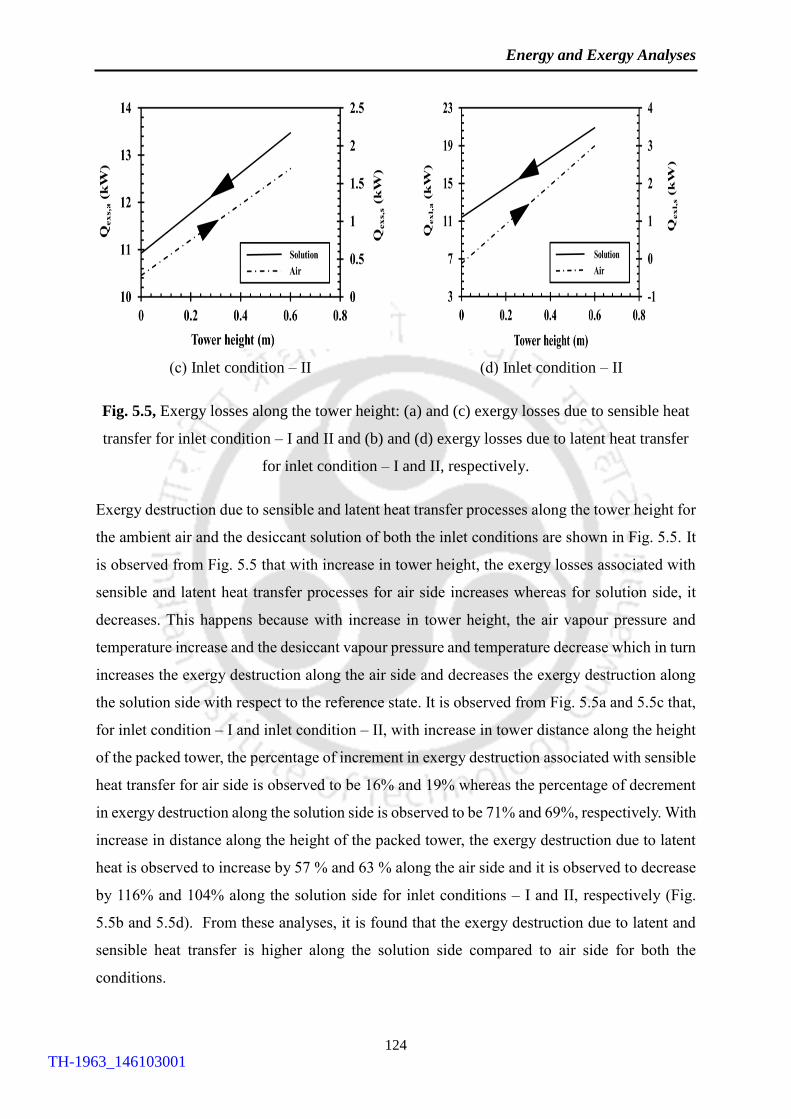
5.5 Exergy losses along the tower height: (a) and (c) exergy losses due to sensible
heat transfer for inlet condition – I and II and (b) and (d) exergy losses due to
latent heat transfer for inlet condition – I and II, respectively
123
TH-1963_146103001
Page 25
List of Figures
xx
5.6 Influence of air and desiccant parameters on desorption/energy and exergy
efficiencies of the liquid desiccant regenerator: (a) Air flow rate, (b) air
humidity ratio, (c) Air temperature, (d) desiccant flow rate, (e) desiccant
concentration and (f) desiccant temperature
126
5.7 Comparison of empirical correlation with the experimental data for energy
efficiency of the evacuated U – tube solar collector
129
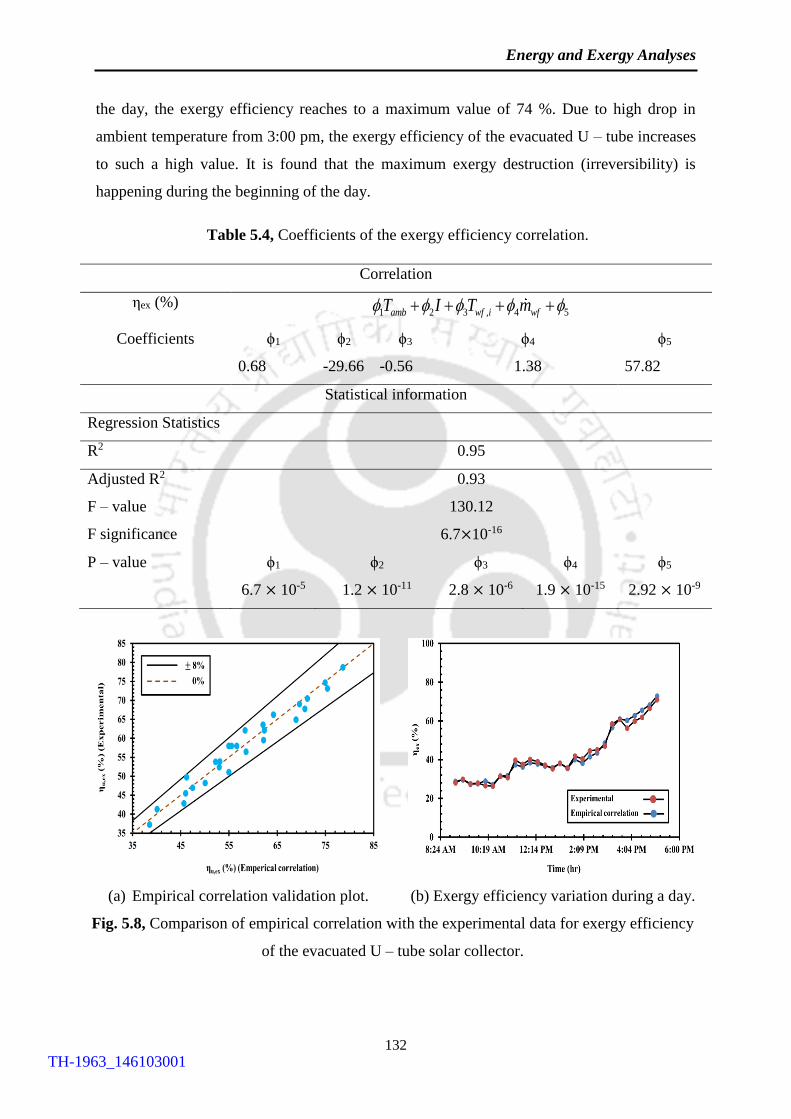
5.8 Comparison of empirical correlation with the experimental data for exergy
efficiency of the evacuated U – tube solar collector
132
5.9 Energy and exergy efficiencies variations of the evacuated U – tube solar
collector system during a sunny day
133
6.1 Schematic of the cross-flow packed tower 136
6.2 Heat and mass transfer processes along the packed tower 141
6.3 Recursive algorithm for solving the developed model 142
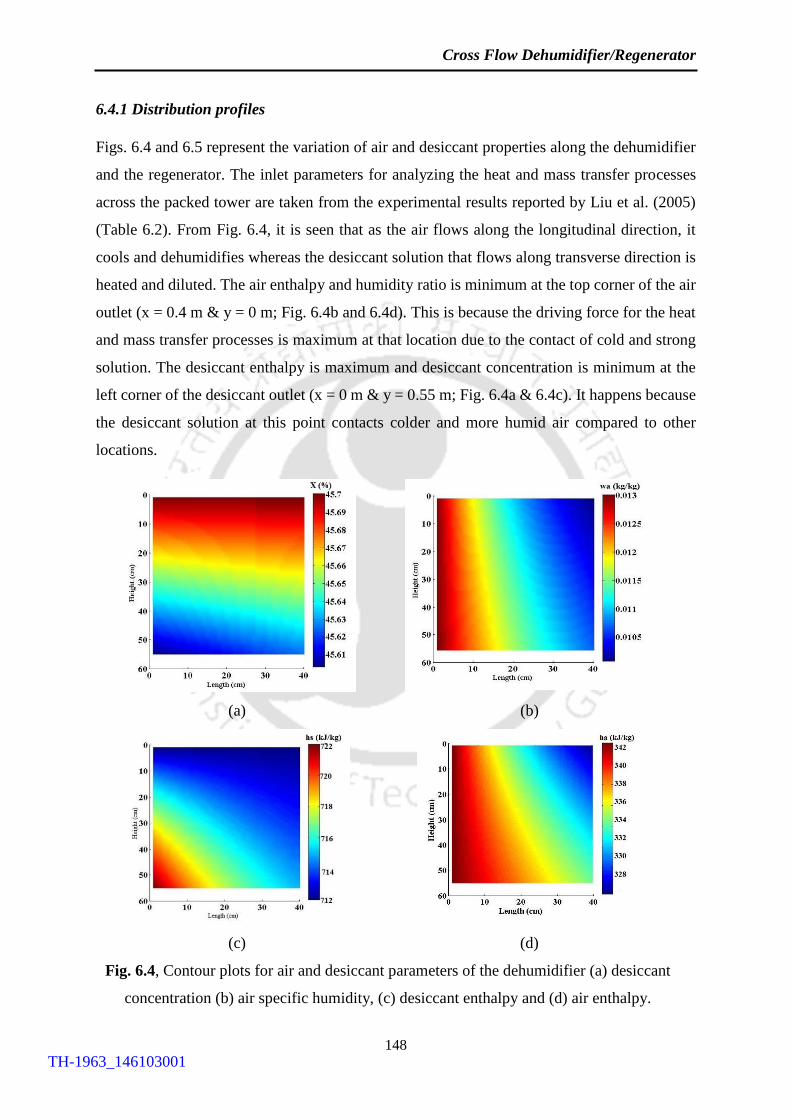
6.4 Contour plots for air and desiccant parameters of the dehumidifier (a)
desiccant concentration (b) air specific humidity, (c) desiccant enthalpy and
(d) air enthalpy
146
6.5 Contour plots for air and desiccant parameters of the regenerator (a) desiccant
concentration (b) air specific humidity, (c) desiccant enthalpy and (d) air
enthalpy
147
6.6 Comparison of simulated results with the numerical and experimental data of
(a) desiccant solution enthalpy in dehumidifier and (b) air enthalpy in
dehumidifier
148
6.7 Comparison of simulated results with the numerical and experimental data of
(a) desiccant enthalpy in regenerator and (b) air enthalpy in regenerator
149
6.8 Concentration profile for different Lewis numbers during the
dehumidification process: (a) Le=0.5, (b) Le=1 and (c) Le=1.5
151
6.9 Concentration profile for different Lewis numbers during the regeneration
process: (a) Le=0.5, (b) Le=1 and (c) Le=1.5
152
6.10 Variation of the solution concentration along the height of the packed tower 153
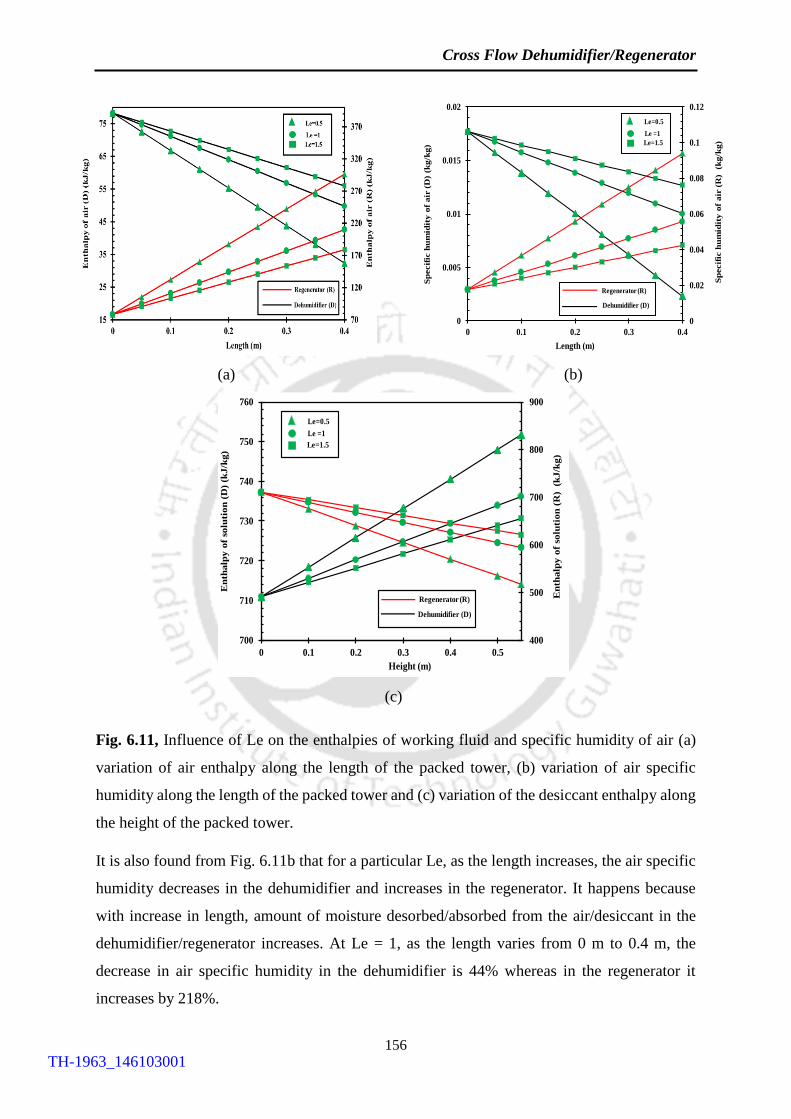
6.11 Influence of Le on the enthalpies of working fluid and specific humidity of
air (a) variation of air enthalpy along the length of the packed tower, (b)
variation of air specific humidity along the length of the packed tower and (c)
variation of the desiccant enthalpy along the height of the packed tower
154
TH-1963_146103001
Page 26
List of Figures
xxi
6.12 Influence of Le on the performances of dehumidifier and regenerator (a)
variations of evaporation and condensation rates with the inlet air specific
humidity, (b) Variation of evaporation and condensation rate with the air inlet
temperature, (c) variation of evaporation and condensation rates with the
concentration of the solution and (d) variation of evaporation and
condensation rates with desiccant inlet temperature
156
7.1 Entransy dissipation process along the liquid desiccant regenerator 160
7.2 Overall latent and sensible entransy dissipations along the height of the
regenerator
164
7.3 Influence of air and desiccant parameters on desorption, entransy and exergy
efficiency of the liquid desiccant regenerator: (a) Air flow rate, (b) air
humidity ratio, (c) Air temperature, (d) desiccant flow rate, (e) desiccant
concentration and (f) desiccant temperature
165
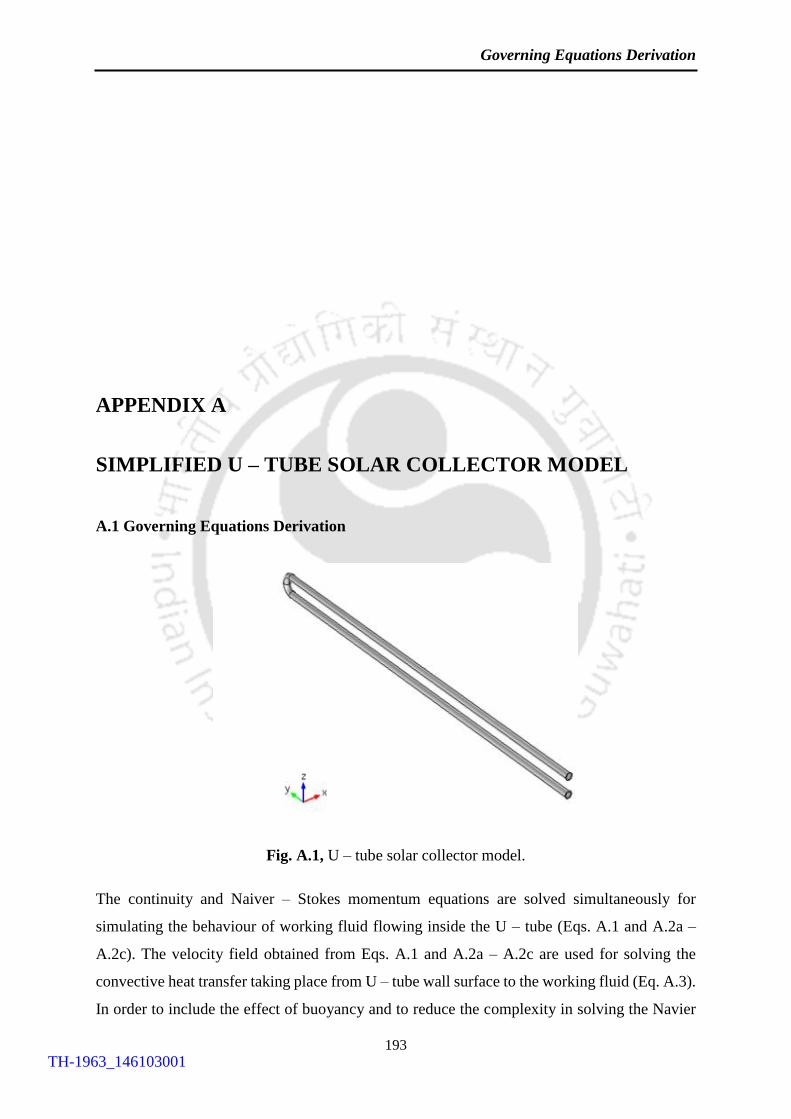
A.1 U – tube solar collector model 191
TH-1963_146103001
Page 27
TH-1963_146103001
Page 28
List of Tables
xxiii
LIST OF TABLES
Table No. Table Name Page No.
1.1 Adsorption capacities and other parameters of solid adsorbent materials 4
1.2 Characteristics of solid absorbent materials 5
1.3 Characteristics of liquid desiccant materials (Gershon et al. 1981, A.
Gasperalla, 2005 & Sanjeev et al. 2007)
7
1.4 Comparison between solar driven liquid and solid desiccant ACSs 10
2.1 Comparison of present model with the two dimensional models available in
the literature for the liquid desiccant dehumidification/regeneration system
19
2.2 Comparison of present experimental investigation with notable
experimental investigations available in the literature using LiCl as liquid
desiccant for the counter-flow liquid desiccant
dehumidification/regeneration system
21
2.3 Notable contributions available in the literature for evacuated U – tube solar
collector
27
3.1 Operating conditions for the packed tower 42
3.2 Maximum and mean deviations of predicted values with the experimental
data reported in the literature for the dehumidifier and regenerator systems
46
3.3 Inlet and outlet parameters used for analyzing the performance
characteristics of the counter-flow packed tower
47
3.4a Grid size and number of mesh elements for evacuated U–tube models 52
3.4b Total number of grid elements 53
3.5 Evacuated tube collector dimensions and surface properties 54
3.6 Comparison of experimental results with the present model 55
3.7 Operating parameters for parametric investigation 61
4.1 Components, dimensions and specifications of the liquid desiccant
dehumidification/regeneration system
74
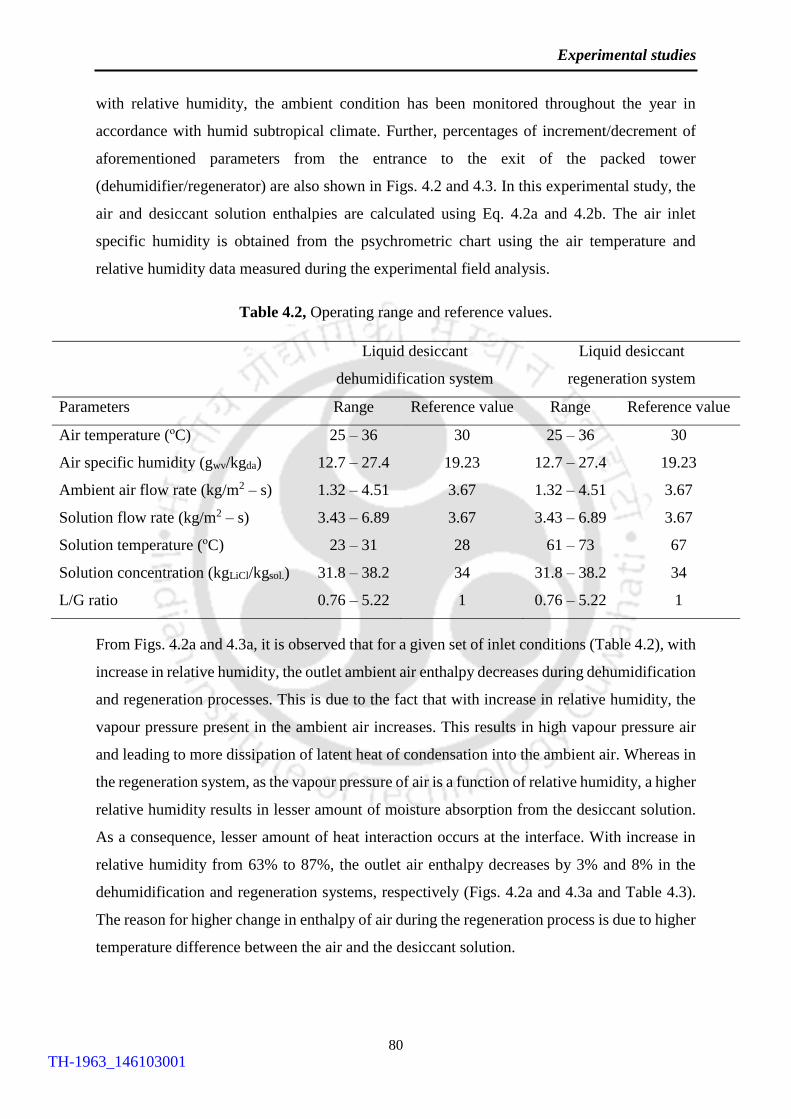
4.2 Operating range and reference values 80
4.3 Influence of relative humidity on operating and ambient parameters 83
4.4 Coefficients of the specific humidity ratio difference correlation 86
TH-1963_146103001
Page 29
List of Tables
xxiv
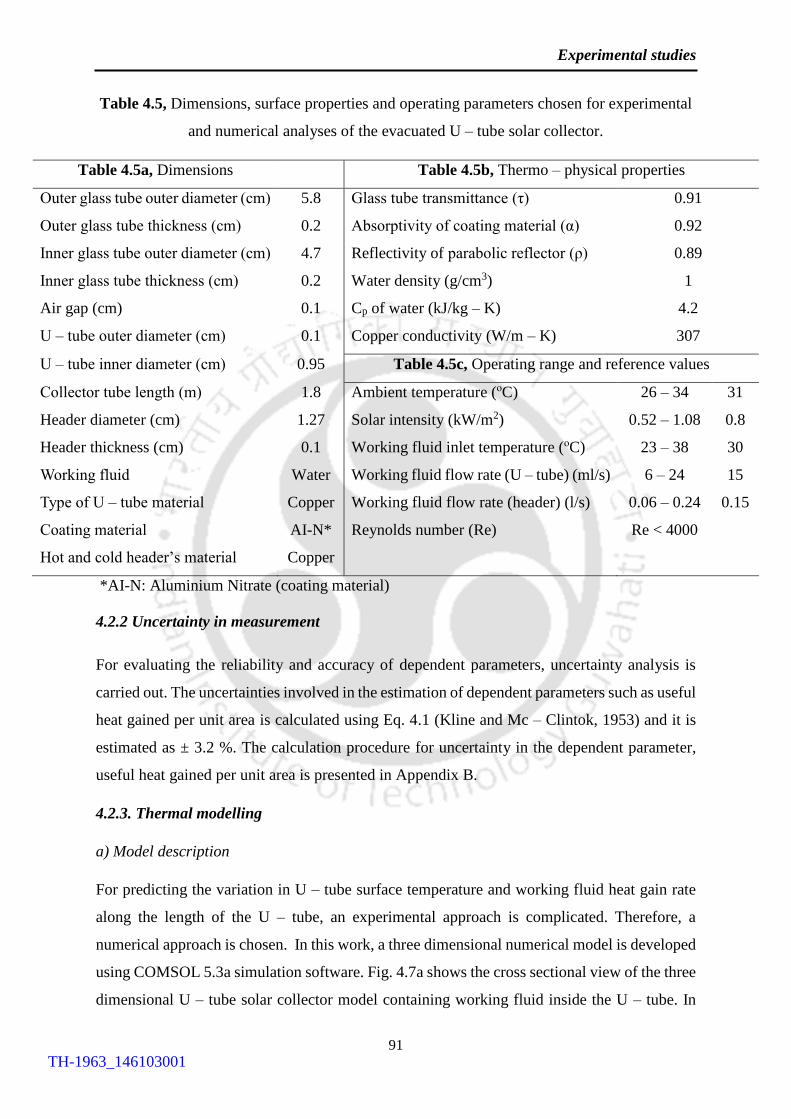
4.5 Dimensions, surface properties and operating parameters chosen for
experimental and numerical analyses of the evacuated U – tube solar
collector
90
4.6 Grid size and number of mesh elements for evacuated U – tube models 94
4.7 Coefficients of the working fluid transition time correlation 103
4.8 Case study chosen for analysing the working fluid transition time 105
5.1a Desorption and exergy efficiencies of the liquid desiccant regenerator
(Fumo and Goswami, 2002)
120
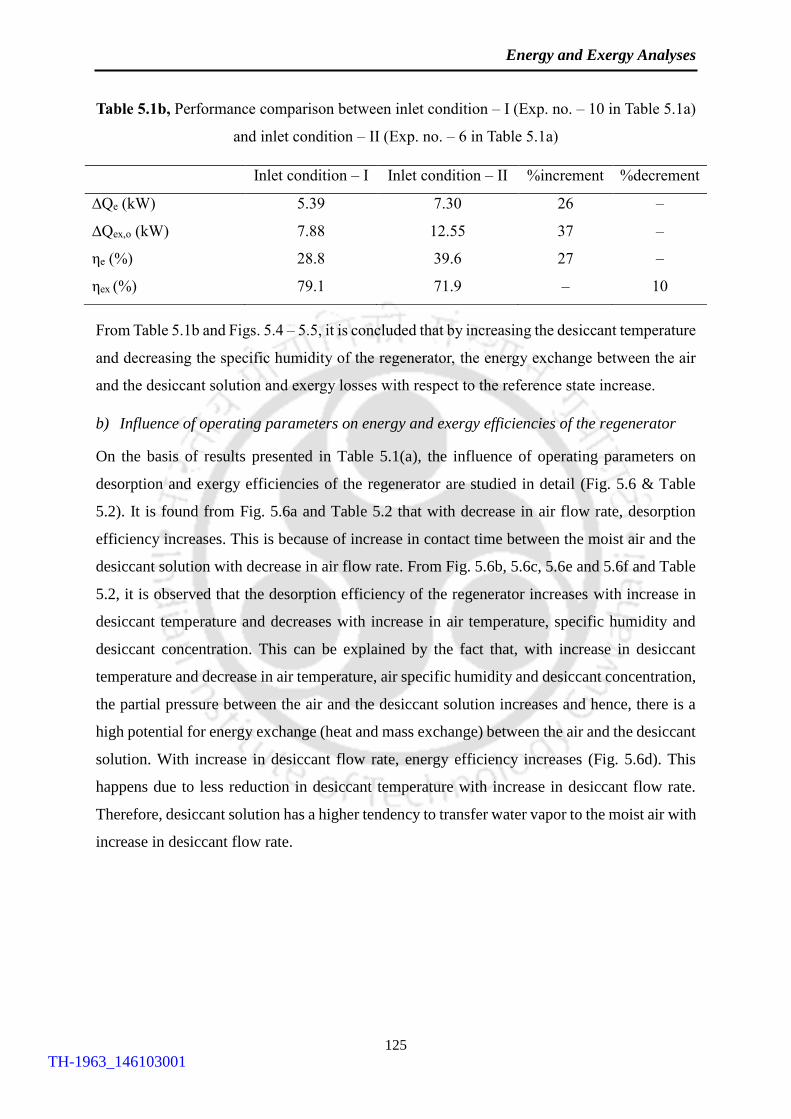
5.1b Performance comparison between inlet condition – I (Exp. no. – 10 in Table
1a) and inlet condition – II (Exp. no. – 6 in Table 5.1a)
124
5.2 Influence of operating parameters on energy and exergy efficiencies of the
regenerator (Fig. 5.6)
127
5.3 Coefficients of the energy efficiency correlation 128
5.4 Coefficients of the exergy efficiency correlation 131
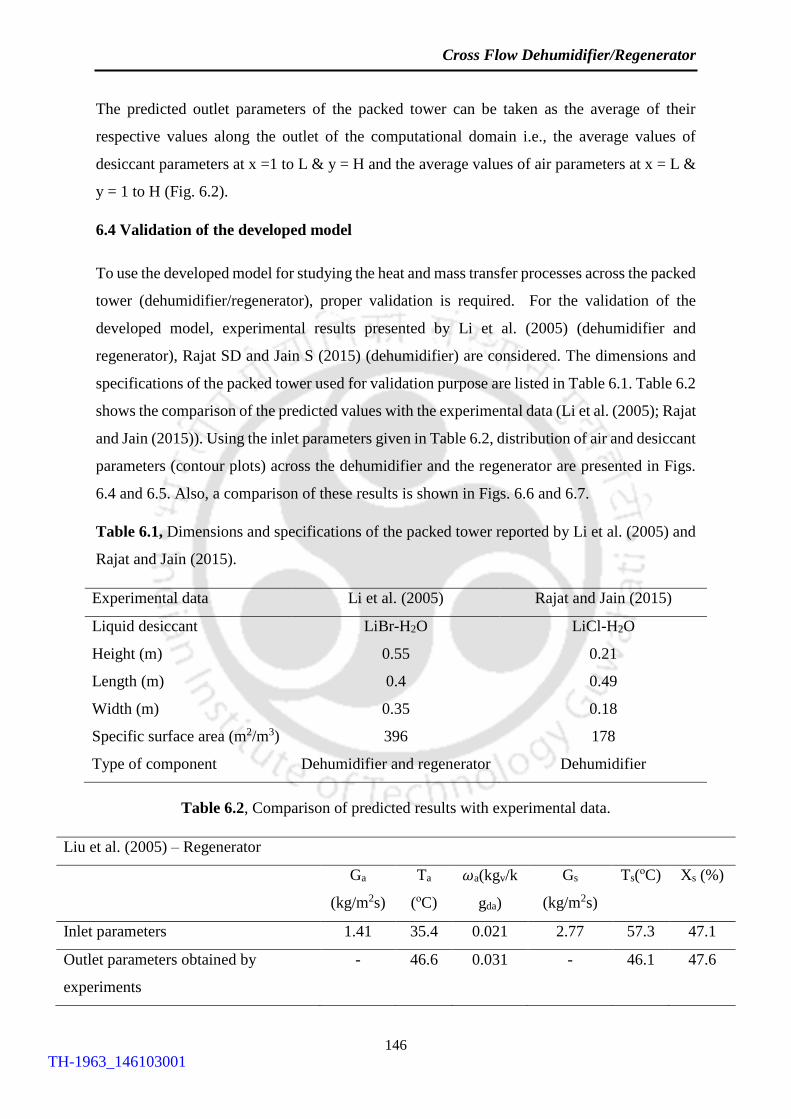
6.1 Dimensions and specifications of the packed tower reported by Li et al.
(2005) and Rajat and Jain (2015)
144
6.2 Comparison of predicted results with experimental data 144
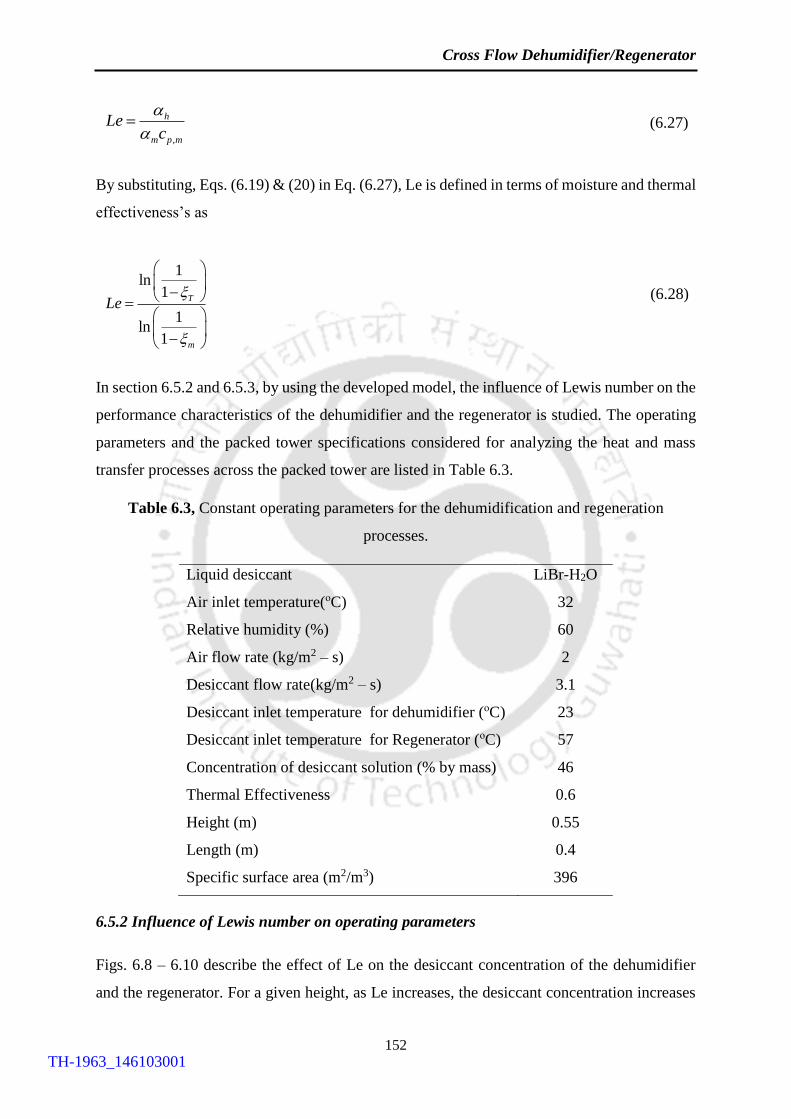
6.3 Constant operating parameters for the dehumidification and regeneration
processes
150
7.1a Entransy analysis of liquid desiccant regenerator (Fumo and Goswami,
2002)
163
7.1b Performance comparison between inlet condition – I (Exp. no. – 10 in Table
7.1(a)) and inlet condition – II (Exp. no. – 6 in Table 7.1(a))
164
7.2 Influence of operating parameters on entransy efficiency of the regenerator
(Fig. 7.3)
166
TH-1963_146103001
Page 30
Introduction
1
CHAPTER – 1
INTRODUCTION
During the 20th century, the HVAC industry brought AC out of the lab into millions of homes
and commercial buildings. It was the period where the cooling and dehumidification swapped
from being a luxury to a necessity. However, this success now presents new challenges in the
field of ACS.
The source of major problems is due to heavy dependence on electricity. In HVAC systems,
tremendous amount of fossil fuels (for generating electrical energy) are converted in to carbon
dioxide each year. A rapidly growing demand for ACS accelerates the global climate change
at a time when the world is struggling to reduce it. Air and water pollution could also increase
as more power plants are built to meet the demand of additional electricity requirement. The
reliability of electrical power transmission systems may be affected as AC creates high peak
demands for power. Furthermore, rapid growth of HVAC industry also possesses many
concerns on global warming, CO2 emissions and ozone layer depletion.
Indoor air quality is another challenge to the HVAC industry, particularly in high humid
climates. Sick Building Syndrome is a problem that can be corrected through better ventilation.
However, in high humid climates, the increased ventilation can raise indoor humidity to a level
that is uncomfortable and unhealthy.
TH-1963_146103001
Page 31
Introduction
2
Using traditional vapour compression or vapour absorption refrigeration systems, removal of
latent load can be achieved by cooling of process air below its dew point temperature. Then
the dehumidified air is reheated to meet the required indoor temperature conditions. If the latent
load present in the process air is removed by other means than by cooling below dew point,
then the energy required for cooling the supply air below its dew point temperature and the
energy needed to reheat the air from dew point temperature to the supply air temperature will
be avoided (Daou et al. 2006). Therefore, desiccant ACS is used as an alternative to
conventional ACS for meeting the growing demand in air-conditioning fields.
1.1 Desiccant air-conditioning systems
Desiccant air-conditioning systems are used for cooling and dehumidification of ambient air.
1.1.1 Working procedure
Basically, desiccant systems transfer moisture from one airstream to another by using two
processes.
Sorption process
Desorption process
a) Sorption process
The desiccant system transfers moisture from the ambient air (humid/moist air) to the desiccant
material due to vapour pressure difference between the humid air and the desiccant material. If
the desiccant material is dry and cold, then its surface vapour pressure is lower than that of the
moist air, and therefore, moisture in the air is absorbed by the desiccant material. During this
process, the latent heat of the water vapour is released, and the air temperature increases and
the desiccant material becomes wet.
Fig. 1.1, Process of moisture transfer by desiccant (Sarbu et al. 2013)
TH-1963_146103001
Page 32
Introduction
3
b) Desorption process
In this process, the captured moisture is released to the airstream by increasing the temperature
of the desiccant. This process is also called as regeneration process. During this process thermal
energy is needed because the desiccant has to be heated to release the moisture. This is an
opportunity to use low grade energy such as solar energy, biogas, waste heat and geothermal
power to transfer moisture.
After regeneration, the desiccant material is cooled down by the cold airstream. Then, it is
ready to absorb the moisture again. When these processes are cycled, the desiccant system can
transfer the moisture continuously by changing the desiccant surface vapour pressures, as
illustrated in Fig. 1.1.
1.1.2 Benefits
Desiccant materials are used in the air-conditioning applications with advantages in the
following conditions (ASHRAE fundamentals, 1989).
a) The latent load is large in comparison to the sensible load.
b) The cost of energy to regenerate the desiccant is low when compared with the cost of energy
to dehumidify the air by chilling it below its dew point.
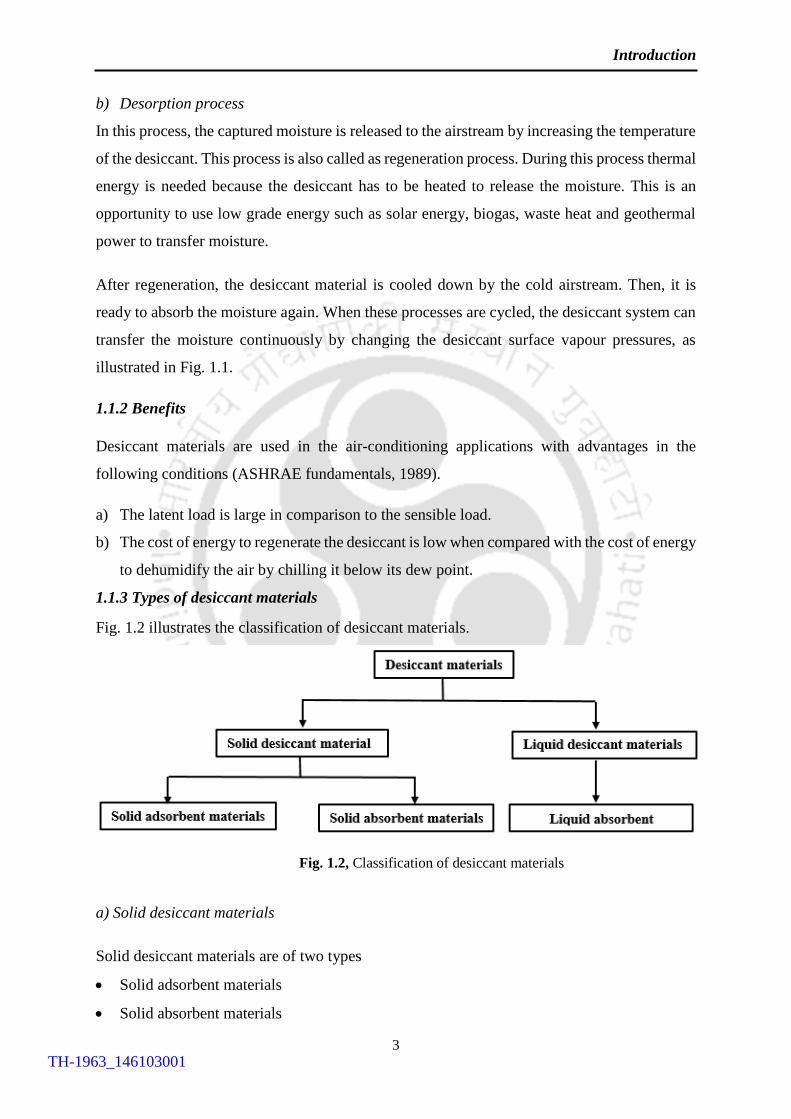
1.1.3 Types of desiccant materials
Fig. 1.2 illustrates the classification of desiccant materials.
a) Solid desiccant materials
Solid desiccant materials are of two types
Solid adsorbent materials
Solid absorbent materials
Fig. 1.2, Classification of desiccant materials
TH-1963_146103001
Page 33
Introduction
4
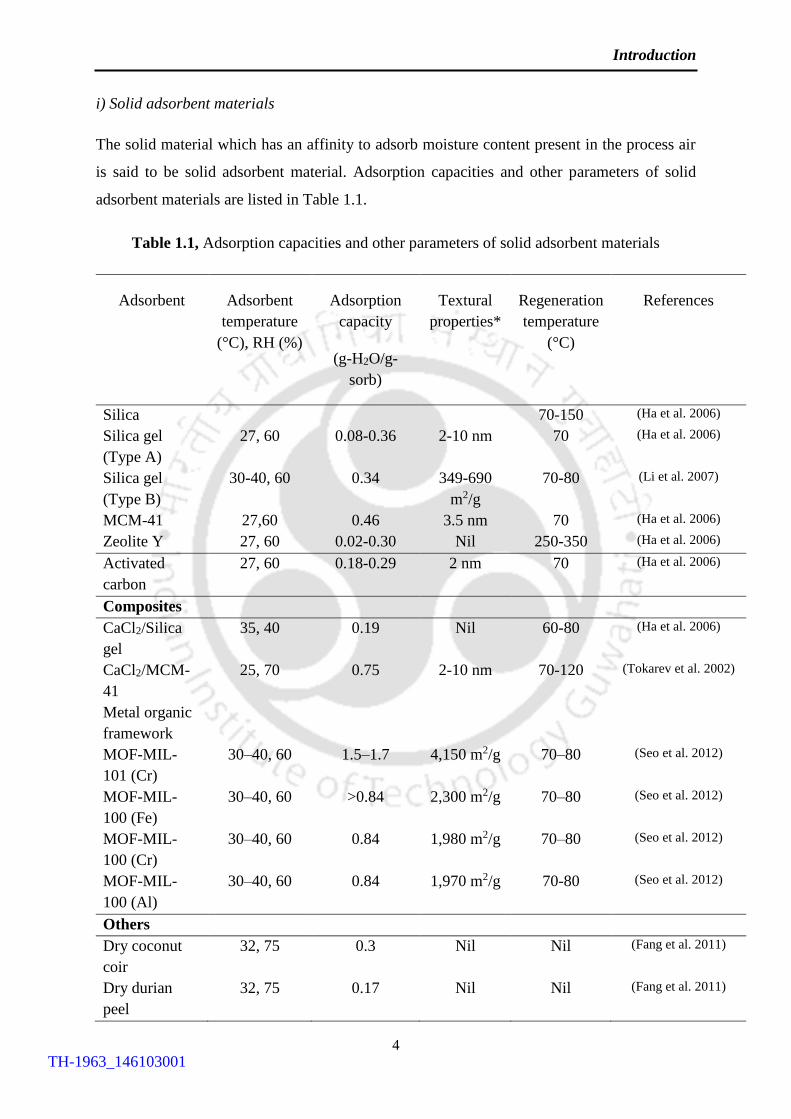
i) Solid adsorbent materials
The solid material which has an affinity to adsorb moisture content present in the process air
is said to be solid adsorbent material. Adsorption capacities and other parameters of solid
adsorbent materials are listed in Table 1.1.
Table 1.1, Adsorption capacities and other parameters of solid adsorbent materials
Adsorbent Adsorbent
temperature
(°C), RH (%)
Adsorption
capacity
(g-H2O/g-
sorb)
Textural
properties*
Regeneration
temperature
(°C)
References
Silica 70-150 (Ha et al. 2006)
Silica gel
(Type A)
27, 60 0.08-0.36 2-10 nm 70 (Ha et al. 2006)
Silica gel
(Type B)
30-40, 60 0.34 349-690
m2/g
70-80 (Li et al. 2007)
MCM-41 27,60 0.46 3.5 nm 70 (Ha et al. 2006)
Zeolite Y 27, 60 0.02-0.30 Nil 250-350 (Ha et al. 2006)
Activated
carbon
27, 60 0.18-0.29 2 nm 70 (Ha et al. 2006)
Composites
CaCl2/Silica
gel
35, 40 0.19 Nil 60-80 (Ha et al. 2006)
CaCl2/MCM-
41
25, 70 0.75 2-10 nm 70-120 (Tokarev et al. 2002)
Metal organic
framework
MOF-MIL-
101 (Cr)
30–40, 60 1.5–1.7 4,150 m2/g 70–80 (Seo et al. 2012)
MOF-MIL-
100 (Fe)
30–40, 60 >0.84 2,300 m2/g 70–80 (Seo et al. 2012)
MOF-MIL-
100 (Cr)
30–40, 60 0.84 1,980 m2/g 70–80 (Seo et al. 2012)
MOF-MIL-
100 (Al)
30–40, 60 0.84 1,970 m2/g 70-80 (Seo et al. 2012)
Others
Dry coconut
coir
32, 75 0.3 Nil Nil (Fang et al. 2011)
Dry durian
peel
32, 75 0.17 Nil Nil (Fang et al. 2011)
TH-1963_146103001
Page 34
Introduction
5
Molecular
sieve
Nil Nil Nil 130 (Gershon et al. 1981)
*Textural properties – surface area (m2/g) and average pore diameter (nm).
ii) Characteristics of solid adsorbent materials
No loss of desiccant through deliquescence.
Very good dehumidification.
Cost is moderate.
iii) Solid absorbent materials
Table 1.2, characteristics of solid absorbent materials (Ameel et al. 1995)
Absorbent Regeneration
temperature (°C)
Dehumidification
cost Deliquescent
property
LiCl >130 Very good High High
CaCl2 70 Good low High
The solid material which has an affinity to absorb moisture content present in the process air
is said to be solid absorbent material. Examples of solid absorbent materials are lithium
chloride (LiCl) and calcium chloride (CaCl2). The characteristics of solid absorbent materials
is listed in Table 1.2.
iv) Merits of solid desiccant materials
No leakage problem
Little or no corrosion and environmental hazards
Little maintenance
v) Demerits of solid desiccant materials
High air pressure drop through desiccant beds
b) Liquid desiccant materials
i) Liquid absorbent material
The liquid material which has an affinity to absorb moisture content present in the process air
is said to be liquid absorbent material.
TH-1963_146103001
Page 35
Introduction
6
ii) Comparison of liquid absorbent materials
A comparison of thermo-physical properties for TEG, MEG, LiCl, LiBr, CaCl2 and KCOOH
is presented in Table 1.3. In order to assess the liquid desiccants characteristics, vapour pressure
is chosen as key parameter which decides the dehumidification and regeneration capabilities
of the liquid desiccant. In this aspect, it is observed that compared to other liquid desiccants
LiCl exhibits lowest vapour pressure in both dehumidification and regeneration processes (G.
Fekadu and S. Subudhi, 2018). Further, it is also found that LiCl is the most stable liquid
desiccant. But LiCl is costlier, corrosive in nature and forms crystallization compared to other
liquid desiccants. Corrosiveness can be eradicated using plastics as a packing material and
crystallization can be avoided using less concentration of LiCl.
iii) Merits of liquid desiccant materials
Low air pressure drop.
Ease of isothermal dehumidification.
Ease of heat recovery.
High storage capability.
Operational flexibility.
Less maintenance.
Flexibility in design.
Utilization of low – grade thermal energy source for regeneration of liquid desiccant.
iv) Demerits of liquid desiccant materials
Possibility of leaks.
Corrosion hazard.
Possibility of crystallization or evaporation.
TH-1963_146103001
Page 36
Introduction
7
Ch
arac
teri
stic
T
riet
hyle
ne
gly
col
(TE
G)
Monoet
hyle
ne
Gly
col
(ME
G)
LiC
l L
iBr
CaC
l 2
KC
OO
H
Reg
ener
atio
n
tem
per
ature
65-8
0 °
C
65
-80
°C
8
0 °
C
80 °
C
60 °
C
50 °
C
Deh
um
idif
icat
ion
Moder
ate
Moder
ate
Good
G
oo
d
Po
or
Mo
der
ate
Co
st
Hig
h
Moder
ate
Hig
h
Hig
h
Lo
w
Hig
h
To
xic
ity
Nonto
xic
S
mal
l N
onto
xic
N
on
toxic
N
on
toxic
N
on
toxic
Cry
stal
liza
tio
n
No
N
o
Pre
sent
Pre
sen
t P
rese
nt
Pre
sen
t
Co
rro
sio
n h
azar
d
Moder
ate
Moder
ate
Hig
h
Hig
h
Mo
der
ate
less
Des
icca
nt
evap
ora
tio
n
Hig
h
(reg
ener
atio
n)
Hig
h
No l
oss
N
o l
oss
N
o l
oss
N
o l
oss
Ta
ble
1.3
, C
har
acte
rist
ics
of
liquid
des
icca
nt
mat
eria
ls (
Ger
shon e
t al
. 1981, A
. G
asp
eral
la,
200
5 &
San
jeev
et
al.
200
7)
TH-1963_146103001
Page 37
Introduction
8
1.2 Solar driven desiccant ACS
Fig. 1.3, Working principle of solar driven desiccant ACSs
In the present investigation, the possibilities of solar driven desiccant ACSs are explored. These
ACS are classified as
Solar driven solid desiccant ACSs
Solar driven liquid desiccant ACSs
a) Solar driven solid desiccant ACSs
Ambient air is dehumidified when it comes in contact with desiccant wheel (coated with solid
desiccant material) which rotates slowly between the process and the regeneration air streams;
then, to provide sensible cooling to the dehumidified air, traditional vapour compression,
vapour absorption, and direct or indirect evaporative cooler units are used, and the
dehumidified air is sent to the conditioned space. As shown in Fig. 1.4, to regenerate the
desiccant, the wheel passes through a hot reactivation air (ambient air heated using solar
energy) and the process begins again.
TH-1963_146103001
Page 38
Introduction
9
Fig. 1.4, Schematic of solid desiccant wheel (Ameel et al. 1995)
b) Solar driven liquid desiccant ACSs
Ambient air is dehumidified when it comes in contact with the strong liquid desiccant; then, to
provide sensible cooling to the dehumidified air, traditional vapour compression, vapour
absorption, and direct or indirect evaporative cooler units are used, and the dehumidified air is
sent to the conditioned space (Fig. 1.5). When the solution is weakened by absorption of
moisture, it is sent directly to the regeneration process to release the moisture using external
heat sources like solar energy. This process is called “reactivating” of desiccant (Mei et al.
1992).
Fig. 1.5, Liquid desiccant dehumidification system (Jain and Bansal, 2007)
1.3 Comparison of solar driven liquid and solid desiccant based ACSs
From Table 1.4 and sections 1.1.4 and 1.1.5, it is observed that liquid desiccant based ACS has
been proven as a promising alternative for handling high latent loads compared to solid
desiccant based ACS. Their capacity to absorb moisture is generally greater than that of solid
TH-1963_146103001
Page 39
Introduction
10
desiccants. Liquid desiccants require lower regenerating temperature, mostly in the range of
40–70 °C while, solid desiccant system requires in the range of 60–115 °C (Kassem et al.
2013). Besides, liquid desiccants can be stored in the form of concentrated solution for use
during periods when solar energy is absent and thus, offer more flexible operational
characteristics. These systems are attractive because of their operational flexibility and their
capability of absorbing air borne pollutants and bacteria (Oberg et al. 1998).
Compared to the solid desiccants, they are generally regenerated at relatively lower temperature
and equally cause lower airside pressure drops (Daou et al. 2006). Moreover, the latest
developments are focused on liquid sorption applications since the liquid sorption materials
have advantages of higher air dehumidification at the same driving temperature, as well as the
possibility of high energy storage by means of hygroscopic solutions (Yunho et al. 2007). The
liquid desiccant assisted ACS can achieve up to 40% of energy savings with regard to
traditional ACS and those savings become even greater when the required energy needed for
regeneration is drawn from solar energy (Vafai et al. 2004). During dull sunlight, the weak
liquid desiccant can be stored until required regeneration heat is not available. These systems
are capable of handling large heat loads (> 50 TR or 176 kW) and minimizes the overall energy
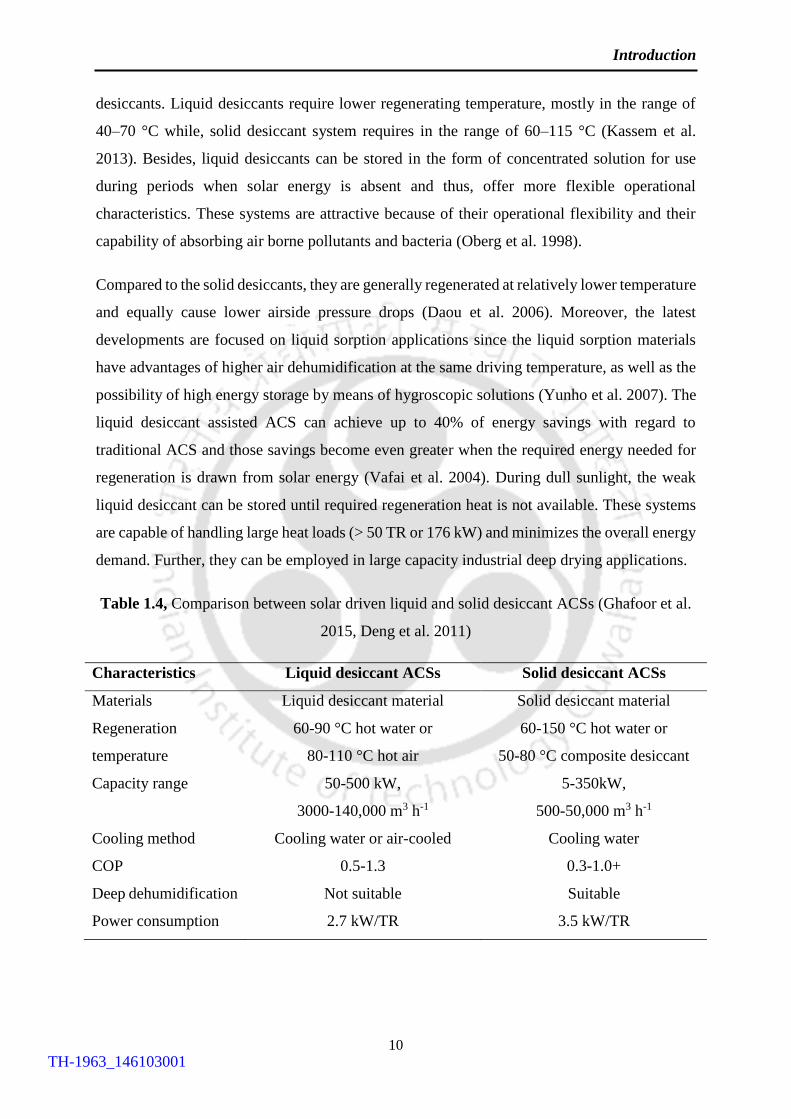
demand. Further, they can be employed in large capacity industrial deep drying applications.
Table 1.4, Comparison between solar driven liquid and solid desiccant ACSs (Ghafoor et al.
2015, Deng et al. 2011)
Characteristics Liquid desiccant ACSs Solid desiccant ACSs
Materials Liquid desiccant material Solid desiccant material
Regeneration
temperature
60-90 °C hot water or
80-110 °C hot air
60-150 °C hot water or
50-80 °C composite desiccant
Capacity range 50-500 kW,
3000-140,000 m3 h-1
5-350kW,
500-50,000 m3 h-1
Cooling method Cooling water or air-cooled Cooling water
COP 0.5-1.3 0.3-1.0+
Deep dehumidification Not suitable Suitable
Power consumption 2.7 kW/TR 3.5 kW/TR
TH-1963_146103001
Page 40
Introduction
11
Applications 1) Large capacity industrial deep
drying dehumidification
applications.
2) Building comfort and indoor
air quality control.
3) Especially the site for
removing airborne
contaminants.
1) Industrial process or storage.
2) Cold foot print buildings,
building comfort and indoor
air quality control.
3) Power augmentation of gas
turbine.
1.4 Motivation of present work
In hot and humid climates, to maintain comfort conditions, remove air borne contaminants and
protect sophisticated equipment, dehumidification of ambient air is crucial. Before 20th century,
for dehumidifying the ambient air, traditional vapour compression and vapour absorption based
ACSs were widely used. These types of dehumidification processes consume more power and
possess high energy demand. To overcome this issue, in recent years, desiccant based ACS has
been introduced.
Desiccant based ACS is classified as solid desiccant based ACS and liquid desiccant based
ACS. As discussed earlier, compared to solid desiccant based ACS, liquid desiccant based ACS
is advantageous due to less air side pressure drop, less maintenance, operational flexibility and
utilization of low- grade thermal energy sources such as solar or waste heat for the regeneration
of liquid desiccant. Therefore, solar driven liquid desiccant based ACS is chosen for the present
investigation.
Key components of solar driven liquid desiccant ACS are dehumidifier, regenerator and solar
collector. In this thesis, numerical, experimental and thermodynamic analyses of the
dehumidifier, regenerator and evacuated U–tube solar collector are presented. Further, the
exergy destruction and entransy dissipation of the liquid desiccant regenerator are investigated.
A major importance is given for analysing the heat and mass transfer characteristics along the
structured packing chamber of a liquid desiccant dehumidifier/regenerator and the heat transfer
characteristics across the evacuated U–tube solar collector.
TH-1963_146103001
Page 41
Introduction
12
1.5 Structure of the thesis
The performance of the solar driven liquid desiccant ACS mainly depends upon the heat and
mass transfer aspects of the dehumidifier/regenerator and the heat transfer aspects of the
evacuated U–tube solar collector. Therefore, aforementioned system components such as liquid
desiccant dehumidifier/regenerator and evacuated U–tube solar collector are fabricated as
individual systems and the performance is investigated of each system (liquid desiccant
dehumidification/regeneration system and evacuated U–tube solar collector system) at
different operating and ambient conditions.
This thesis is organized in seven chapters. A brief description of the content of each of the
chapters is discussed below:
Chapter 1 starts with a brief introduction of various methods and concepts of dehumidification
systems. The advantages of solar driven liquid desiccant based ACS is elucidated. Importance
of liquid desiccant ACS components, various applications and motivation of the present work
are presented.
In Chapter 2, the state-of-art on various aspects of the liquid desiccant dehumidification system,
the liquid desiccant regeneration system and the evacuated U – tube solar collector system are
described briefly. Literatures published on developed numerical models and experimental
investigations are reviewed. On the basis of literature survey, objectives of the present thesis
work are framed.
Chapter 3 presents thermal models developed for simultaneous heat and mass exchange
between the ambient air and the desiccant solution in counter-flow direction of the liquid
desiccant dehumidification/regeneration system. Also, the numerical model developed for
evacuated U – tube solar collector system for assessing the heat gained by the working fluid
from the solar radiation is discussed. Further, the theoretical model for analyzing the variation
of heat and mass transfer characteristics along the structured packing chamber and the variation
of heat transfer characteristics along the evacuated U – tube solar collector is discussed.
Chapter 4 presents the design details and test procedure of liquid desiccant
dehumidification/regeneration and evacuated U – tube solar collector systems. In accordance
with humid sub – tropical climate, several experiments are conducted at different operating
conditions and the outcome of the study is presented. In addition, a procedure for developing
TH-1963_146103001
Page 42
Introduction
13
experimental correlations and the variation of developed correlations with the operating and
ambient parameters are also discussed in detail.
Chapter 5 covers the energy exchange between the ambient air and the desiccant solution
during regeneration processes and exergy destruction with respect to reference environment
along the liquid desiccant regeneration system. Further, energy and exergy analyses of the
individual evacuated U – tube solar collector as well as whole solar collector system are
presented.
Chapter 6 depicts a finite difference based thermal model for analyzing the heat and mass
transfer processes across the cross-flow liquid desiccant dehumidifier/regenerator. Effect of
Lewis number on operating and performance parameters of the dehumidifier and regenerator
and the effect of inlet parameters on the performance of the packed tower are described in
detail.
Chapter 7 introduces the concept of entransy dissipation along the liquid desiccant regenerator.
Further, the effect of air and desiccant inlet parameters on entransy efficiency of the liquid
desiccant regenerator is presented.
Chapter 8 outlines the major conclusions arrived from numerical, experimental, energy and
exergy analyses of the liquid desiccant dehumidification/regeneration systems and evacuated
U – tube solar collector system. Further, key observations made from the entransy dissipation
theory of the liquid desiccant regeneration system are also presented in detail.
TH-1963_146103001
Page 43
TH-1963_146103001
Page 44
State of Art
15
CHAPTER – 2
STATE OF ART
The concept of liquid desiccant ACS was initially explored in 1955, when Loef indicated the
concept for the first time of using a tri ethylene glycol open-cycle ACS (Gommed et al. 2004).
In 1970’s the technique was further developed by many investigators to save energy
consumption in conventional ACSs by shifting the major part of the cooling load to the more
energy-efficient desiccant systems (Oberg et al. 1998). During mid-1970’s, desiccant
dehumidifiers were primarily used for dehumidification in the field of industrial applications
such as the manufacture of moisture-sensitive products and the prevention of corrosion or other
moisture damage during storage. In the late 1970s, public concern on energy issues led
investigators to focus new attention on desiccant dehumidification for commercial and
residential AC applications.
2.1 Design of Liquid Desiccant Dehumidification/Regeneration System
Liquid desiccant A/C systems usually require two desiccant air contact devices, namely
dehumidifier and regenerator. They are basically three types of configurations for liquid
desiccant dehumidifiers or regenerators, namely spray chamber, packed tower and spray coil
arrangement. Packed tower configuration has received more attention because of a high heat
and mass transfer rate per unit volume (Dai et al. 2004).
TH-1963_146103001
Page 45
State of Art
16
Gandhidasan and co-workers in Saudi Arabia have made extensive studies on liquid desiccant
systems with packing configurations (Farayedhi et al. 2002). In the design of liquid desiccant
systems, the desiccant was sprayed into the air stream to absorb the moisture. During this
process, some liquid desiccant carry-over was experienced. Since the lithium solutions (usually
lithium chloride or lithium bromide) are corrosive, they may be harmful to people’s health due
to inhalation of the droplets.
The carry-over of the working solution in a traditional stripping tower is of serious concern in
real applications. Some research groups employed two methods to overcome the carry-over
problem in liquid desiccant systems in their recent research.
a) Low flow liquid desiccant system
b) U-shaped spray tower
2.1.1 Low Flow liquid desiccant systems
Falling film liquid desiccant dehumidification systems can be internally heated or cooled while
conditioning the air or regenerating the desiccant. This has significant potential performance
benefits. The low-flow liquid-desiccant technology is used to achieve high energy efficiency
and eliminate carry-over of desiccant droplets.
Mesquita and Harrison (2005) conducted a 2-dimensional numerical analysis on an internally
cooled or heated flat plate liquid desiccant system. Mesquita (2007) conducted further
experimental analysis on a single channel low flow flat plate liquid desiccant system. The
system was operated under both isothermal and non-isothermal conditions. It was concluded
that water temperature and mass flow rate of desiccant have a strong effect on the performance
of the flat plate dehumidifier and regenerator. Lowenstein et al. (2007) build and tested a pre-
commercial prototype low flow liquid desiccant system. The benefit of zero desiccant process
air carryover was emphasized. Miller and Lowenstein (2008) investigated an important benefit
of a liquid desiccant system coupled to a solar thermal array. A preliminary cost benefit analysis
of a 6000 CFM (cubic feet per minute) unit charged with CaCl2 showed a payback of 10 years
with a 30% investment tax credit.
TH-1963_146103001
Page 46
State of Art
17
2.1.2 U-shaped spray tower
The other method uses a U-shaped spray tower to prevent the carry-over problem. A U-shaped
spray tower for preventing carry-over has been designed to study the stripping of water vapour
from aqueous desiccant solutions of 91.8 to 95.8 wt. % triethylene glycol (Chung et al. 1999).
2.2 Thermal Models Reported on Liquid Desiccant Dehumidification/Regeneration
System
Treybal (1969) was the first person to describe the complex heat and mass transfer process
which occurs during air dehumidification by proposing a simple mathematical model. Merkel
(1925) came up with an analytical model to describe the heat and mass interactions between
air and the working fluid for evaporative cooling purposes, but his model does not consider the
evaporation loss. Nottage (1941) and Yadigaroghu and Pastor (1974) modified the Merkel
model by considering evaporation loss and achieved higher accuracy compared to Merkel’s
model. Zhang et al. (2012) proposed an analytical model for analyzing the simultaneous heat
and mass transfer processes involved in a counter – flow cooling tower and validated with the
experimental data available in the literature. Peng and Howell (1981) developed mathematical
models for two liquid desiccant systems powered by solar or geothermal energy and using
triethylene glycol as the desiccant solution. Their parametric analysis showed that the optimum
absorber height for the process recirculation mode is 1.2 m, while for the exhaust recirculation
mode it is 0.9 m. The exhaust recirculation mode has better thermal performance and lower fan
power requirements at full capacity, but the process recirculation mode produces cooler and
drier air. Factor et al. (1980), Fumo and Goswami (2002) and Khan et al. (1992) developed
finite difference based thermodynamic models to evaluate the liquid desiccant dehumidifier
and regenerator, whereas Stevens et al. (1989) provided analytical expressions of the air and
desiccant parameters in the counter-flow dehumidifier. Jain et al. (1994) attempted to evaluate
seven liquid desiccant cycles for hot and humid climates. A computer simulation model was
developed based on the constant effectiveness of heat exchangers and evaporative coolers. The
effect of various outdoor conditions and the effectiveness of heat exchangers on the cooling
capacity have been investigated. It was found that a combination of dehumidifier and wet
surface heat exchanger shows better performance, for a wide range of outdoor conditions.
Oberg et al. (1998) introduced NTU method to analyze the performance of the aforementioned
systems.
TH-1963_146103001
Page 47
State of Art
18
Babakhani et al. (2010) and Liu et al. (2010) compared their mathematical models based on
finite difference/NTU method with the experimental findings and concluded that their models
were in good agreement with the experimental data. Chengquin et al. (2006) developed a model
for heat and mass transfer interactions in a liquid desiccant dehumidifier/regenerator. Patil et
al. (2016) developed an empirical correlation for estimating the actual gas – liquid contact area
and found more accurate than other correlations with a maximum deviation of ±15%. Zalewski
et al. (1997) developed a mathematical model by introducing a correction factor for mass
transfer coefficient. Gandhidasan (2004, 2005) presented a simplified model using
dimensionless parameters such as moisture and thermal effectiveness and formulated the
correlations for predicting the evaporation and condensation rates in terms of heat and mass
exchange effectiveness. The proposed model has been compared with the experimental data of
Fumo and Goswami (2002), and the error has been found to be within ±13%. Peng et al. (2017)
studied the heat and mass transfer characteristics of a packed tower by proposing a
thermodynamic model. They compared the developed model with the experimental data of
Fumo and Goswami (2002) and observed a maximum error of ±18%. Lu et al. (2001) & Ren
et al. (2006) reported a method for finding the analytical solution of the coupled heat and mass
transfer performance for the dehumidifier and regenerator. Analytical solutions of the air
enthalpy and desiccant equivalent enthalpy field within the cross-flow
dehumidifier/regenerator were given by Liu et al. (2006, 2007), where the air and desiccant are
not mixed breadthwise (which means the transfer processes of the air and desiccant are both
two dimensional). The enthalpy field gained from the analytical solutions compares well with
numerical solutions, and the analytical enthalpy efficiency compares well with experimental
results of the cross-flow dehumidifier. Researchers (Dai et al. 2004; Khan et al. 1998; Liu et
al. 2007) have developed mathematical models of the coupled heat and mass transfer processes
in the dehumidifier or regenerator, and most of the models were solved numerically. Davoud
and Meysam (2009) presented a new analytical solution of heat and mass transfer processes in
a packed bed liquid desiccant dehumidifier. Their results revealed that design variables such as
desiccant concentration, desiccant temperature, air flow rate, and air humidity ratio have the
greatest impact on the performance of the dehumidifier. The liquid flow rate and the air
temperature did not have a significant effect. Furthermore, the effects of air and liquid desiccant
flow rate have been reported on the humidity effectiveness of the column. Langroudi et al.
(2014) statistically evaluated the performance of the liquid desiccant dehumidification system
using response surface methodology (RSM) and studied the heat and mass transfer processes
occurring in the liquid desiccant dehumidification system. They compared the proposed model
TH-1963_146103001
Page 48
State of Art
19
with the NTU model available in the literature and found good agreement with an accuracy of
±13%. Chung and Gosh (1996) developed heat and mass transfer correlations and studied
performance of the liquid desiccant dehumidifier using lithium chloride as a desiccant solution.
Yin et al. (2009) investigated the heat and mass transfer interactions along the liquid desiccant
dehumidifier and regenerator using a mathematical model validated by the experimental data.
In the aspect of theoretical studies, several thermodynamic models have been developed for
predicting the heat and mass exchange processes in the adiabatic dehumidification/regeneration
system which includes finite difference model (Factor and Grossman, 1980; Oberg and
Goswami, 1998; Liu et al. 2007), ε – NTU model (Babakhani and Soleymani, 2009, 2010; Peng
and Zhang, 2011; Stevens and Braun, 1989) and simplified models (Gandhidasan 2004, 2005;
Liu et al. 2006). In the present study, a two dimensional finite difference based thermodynamic
models are developed for counter-flow adiabatic liquid desiccant
dehumidification/regeneration system. On the basis of present investigation, a comparison is
made with the notable contributions presented in the literature for highlighting the importance
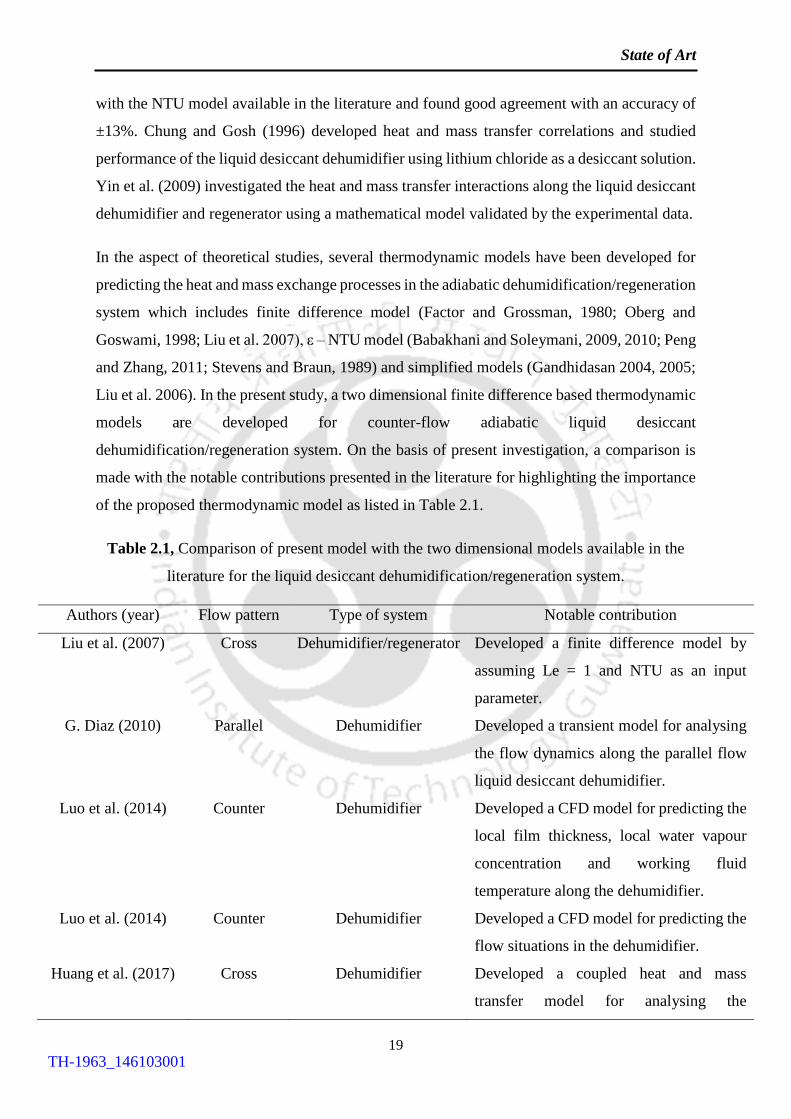
of the proposed thermodynamic model as listed in Table 2.1.
Table 2.1, Comparison of present model with the two dimensional models available in the
literature for the liquid desiccant dehumidification/regeneration system.
Authors (year) Flow pattern Type of system Notable contribution
Liu et al. (2007) Cross Dehumidifier/regenerator Developed a finite difference model by
assuming Le = 1 and NTU as an input
parameter.
G. Diaz (2010) Parallel Dehumidifier Developed a transient model for analysing
the flow dynamics along the parallel flow
liquid desiccant dehumidifier.
Luo et al. (2014) Counter Dehumidifier Developed a CFD model for predicting the
local film thickness, local water vapour
concentration and working fluid
temperature along the dehumidifier.
Luo et al. (2014) Counter Dehumidifier Developed a CFD model for predicting the
flow situations in the dehumidifier.
Huang et al. (2017) Cross Dehumidifier Developed a coupled heat and mass
transfer model for analysing the
TH-1963_146103001
Page 49
State of Art
20
simultaneous heat and mass transfer
processes across the liquid desiccant
dehumidifier.
Das and Jain (2015) Cross Dehumidifier Influence of different types of flat plate
membrane contactors on performance
characteristics of dehumidifier are
analyzed.
Liu et al. (2007) Cross Dehumidifier and
regenerator
Studied the air and desiccant parameters
numerically by taking constant Lewis
number (Le = 1).
Khin et al. (2013) Cross Dehumidifier Performance characteristics of the
dehumidifier is analyzed using air to air
heat and mass transfer processes.
2.3 Experimental Studies for Liquid Desiccant Dehumidification/Regeneration System
Chen et al. (1989), Patnaik et al. (1990), McDonald et al. (1992), Chung et al. (1993), and
Pontis and Lenz (1996) reported experimental results of packed bed dehumidifiers using salt
solutions as desiccant. Chung et al. (1995) reported experimental findings and developed
correlations for heat and mass transfer coefficient of a structured packed column using
structured packing and tri ethylene glycol (TEG) as the desiccant. Oberg and Goswami (1998)
developed a model for simultaneous heat and mass transfer between air and TEG desiccant in
a packed bed absorption tower. A comparison between the experimental and the theoretical
results showed that the model gave good predictions of the heat and mass transfer between
desiccant and air. Bravo et al. (1985) studied the structured packing and found excellent
performance characteristics with a relatively low ratio of pressure drop to heat and mass
transfer coefficient per unit volume. Lazzarin et al. (1999) developed a numerical model of a
packed tower and carried out a parametrical study using LiBr and CaCl2 to obtain the optimum
operative conditions. The experimental results matched closely with values predicted by the
numerical model. Sanjev et al. (2000) studied theoretically and experimentally a liquid
desiccant cooling system made of a falling film tubular absorber and a falling film regenerator.
For the purpose of performance evaluation, the authors defined wetness factors to characterise
the uniformity of wetting of the surface of the contactors (dehumidifier and regenerator) by the
desiccant solution. Their study is of great interest from designing viewpoint, as it can help
TH-1963_146103001
Page 50
State of Art
21
calculate more accurately the size of the contactors. Hamed (2003) investigated the desorption
characteristics of a packed porous bed. The measurements were compared with the analytical
solution. Zurigat et al. (2003) investigated the performance of an air dehumidifier employing
TEG under hot and humid conditions using two different structured packing’s, wood and
aluminium. The performance of the dehumidifier was evaluated and expressed in terms of
moisture removal rate and dehumidifier effectiveness.
Gommed et al. (2004) experimentally studied the performance of packed-bed heat and mass
exchangers flooded with lithium chloride solutions. The researchers first implemented their
conditioner and regenerator as internally cooled units using either copper tubes or
polypropylene tubes as the contact surface. Liu et al. (2006) experimentally invetigated the
performance of a cross-flow liquid-desiccant conditioner that used structured packing flooded
with a solution of lithium bromide. Performance was reported in terms of the moisture removal
rate for the conditioner and its dehumidification effectiveness (i.e., the change in the humidity
ratio of the air expressed as a percentage of the theoretical maximum change) at different
desiccant flow rates, airflow rates, desiccant inlet temperature, desiccant inlet concentration,
air inlet temperature, and air inlet humidity ratio. Chen et al. (2005) reported the regenerator’s
average COP was 0.82 and the average COP for the overall cooling process was 1.50. Mohan
et al. (2008, 2015) studied the performance of dehumidifier and regenerator for a liquid
desiccant –vapour compression system and found that higher room temperature lowers air
dehumidification and desiccant regeneration.
In the present study, using LiCl as liquid desiccant, an experimental investigation is carried out
in accordance with humid subtropical climate for counter-flow adiabatic liquid desiccant
dehumidification/regeneration system. Based on present investigation, a comparison of the
present investigation is made with respective investigations in the literature (Table 2.2).
Table 2.2, Notable contributions of experimental investigations in the literature using LiCl
as liquid desiccant for the counter-flow liquid desiccant dehumidification/regeneration
system.
Authors (year) Type of system Notable contribution
Chung and Gosh
(1996)
Dehumidifier Compared the performance of the random and structured
packing dehumidifier and developed empirical
correlations for heat and mass transfer coefficients of the
TH-1963_146103001
Page 51
State of Art
22
random and structured packing liquid desiccant
dehumidifier.
Fumo and Goswami
(2002)
Dehumidifier/regenerator Studied the influence of ambient and operating
parameters on evaporation and condensation rates.
Further, analysed the performance of the liquid desiccant
dehumidifier and regenerator in accordance with hot and
humid climate.
Longo and Gasparella
(2005)
Dehumidifier/regenerator Studied the mass transfer characteristics of the randomly
packed column dehumidifier and regenerator. Also,
investigated the performance of the dehumidifier and the
regenerator using LiCl, LiBr and KCOOH as a liquid
desiccant materials.
Zhang et al. (2010) Dehumidifier/regenerator Developed dimensionless correlations for mass transfer
coefficient of the liquid desiccant dehumidifier and
regenerator. Further, investigated the performance of the
structured packing dehumidifier/regenerator for summer
and winter climatic conditions.
Wang et al. (2016) Dehumidifier Developed empirical correlations for enthalpy and
moisture effectiveness. Further, experimentally
investigated the influence of packing height for different
desiccant flow fluctuations and consequently, optimized
the packing height of the liquid desiccant dehumidifier.
Xian Li et al. (2016) Dehumidifier Studied the heat and mass transfer characteristics of the
liquid desiccant dehumidifier and compared the
developed dynamic model with the results obtained from
the experimental analysis.
Qiong Wu et al.
(2017)
Dehumidifier Developed a desiccant solution regulation strategy for the
liquid desiccant dehumidifier and studied the
effectiveness of this strategy in different working
conditions.
TH-1963_146103001
Page 52
State of Art
23
2.4 Exergy and Entransy Analyses of a Liquid Desiccant Regenerator
Many researchers have analysed the coupled heat and mass transfer processes in the liquid
desiccant regeneration system by conducting experimental studies (Martin and Goswami,
2000; Jain et al. 2000; Fumo and Goswami, 2002) and also employing numerical schemes
(Gandhidasan, 2005; Ren et al, 2006; Liu et al. 2010; Babakhani and solymeni, 2010). Jain et
al. (2000) experimentally studied the simultaneous heat and mass transfer characteristics of the
falling film plate type liquid desiccant regenerator. Longo and Gasparella (2005)
experimentally studied the performance of the liquid desiccant dehumidification/regeneration
system based on random packing configuration. Liu et al. (2013) developed a finite difference
model for studying the effect of performance parameters on the liquid desiccant regenerator.
Some researchers have focused on optimization of operating parameters for improving the heat
and mass transfer characteristics of the regeneration system (Sultan et al. 2002; Yin et al. 2009).
Sultan et al. (2002) investigated the influence of inlet parameters on coupled heat and mass
transfer processes and provided an optimal solution for increasing the contact time between the
air and the desiccant solution. Yin et al. (2009) studied the heat and mass transfer behaviour of
an internally – cooled regenerator and also discussed the effect of heat and mass transfer
coefficients on performance of the regenerator.
Very few researchers have carried out exergy and entransy analyses of the liquid desiccant
dehumidification system (Wang et al. 2010; Xiang et al. 2010; Zhang et al. 2012; Zhang et al.
2014; Zhang et al. 2017; L. Zhang et al. 2017). Xiang et al. (2010) and Zhang et al. (2014)
studied the exergy performance of the liquid desiccant dehumidification system and identified
the sources of exergy destruction. Wang et al. (2010) investigated the exergy transfer rates of
the ideal liquid desiccant dehumidification system. Zhang et al. (2012) carried out preliminary
investigations on liquid desiccant ACS (LDACS) based on entransy theory. Zhang et al. (2017)
studied the exergy and entransy analyses of the humid air handling process between air and the
desiccant solution. Zhang et al. (2017) analysed the heat and mass transfer characteristics of a
counter – flow packer tower and LDACS based on entransy theory.
2.5 Application of Solar Energy as Low-Grade Energy
For liquid desiccant ACSs, energy is required to regenerate the liquid desiccant for
dehumidification purpose, which may come from clean energy sources such as natural gas or
low grade heat sources such as solar energy and geothermal energy.
TH-1963_146103001
Page 53
State of Art
24
The most popular type of energy source used in the commercial market is solar energy. There
have been numerous attempts in capturing the benefits of desiccants in a solar driven ACSs.
Löf proposed a solar air conditioner that used triethylene glycol (Lof, 1955). In the early 1980s,
American Solar King manufactured and sold a residential solar cooling system that used a
lithium-chloride solid-desiccant rotor (Coellner, 1986). When energy prices declined in the late
1980s, American Solar King converted their product to a gas-fired unit. Robison conducted a
2-year field test on a solar cooling system that used a calcium-chloride liquid-desiccant
conditioner (Robison, 1983). The test demonstrated the technical feasibility of this solar
cooling system, but there was no attempt to commercialize the technology. Schlepp and Schultz
(1984) have summarized the experiences of many solar desiccant cooling activities that
followed the energy crisis of the 1970s. Most of the research on solar driven liquid desiccant
based ACS began in the early 1990s.
In solar driven liquid desiccant based ACS, solar collector is one of the important component
because as discussed earlier, solar heat is required to regenerate the liquid desiccant for reuse
in dehumidification process. Numerous studies were carried out for analysing the performance
of the evacuated tube and flat plate type solar collectors. These studies concluded that
evacuated tube type solar collectors were more efficient compared to flat plate type solar
collectors (Gautam and Chamoli, 2017).
Fig. 2.1, Schematic of evacuated U–tube solar collector a) Cross section and b) Longitudinal section.
Several types evacuated tube solar collector’s viz. U – type, H – type, T – type, heat pipe type,
etc. for various solar thermal utilization applications have been reported in the literature (Shah
and Furbo, 2004; Ataee and Ameri, 2015; Nkwetta and Smyth, 2012). Among these, owing to
practical applicability, simplicity in design and lower investment cost, evacuated U – tube solar
collector is chosen for the present investigation. Evacuated U – tube solar collector is basically
a heat exchanger which transfers the energy from solar radiation from sun to the working fluid.
The solar radiation incident on the outer glass surface of the evacuated tube is transferred to
(b) (a)
TH-1963_146103001
Page 54
State of Art
25
the inner glass tube through radiative heat transfer process and then the heat is absorbed by the
U – tube. From U – tube, the heat is exchanged to the working fluid (Fig. 2.1).
2.5.1 Numerical studies on evacuated U – tube solar collector
The study on heat transfer occurring in an evacuated tube solar collector was initiated during
1970s. The first mathematical model for heat transfer analysis and performance predictions of
the aforementioned collector was reported by Eberlein (1976) using air as working fluid. The
author found that the overall heat loss was very small in the collector due to the evacuated
annular space between the glass tubes. Zhiqiang et al. (1984) and Morrision et al. (2004, 2005)
investigated the natural circulation flow in the collector tube using water as working fluid. They
concluded that buoyancy effect and mass flow rate inside the tube played a significant role in
heat transfer process. Hazami et al. (2013) and Nkwetta and Smyth (2013) studied the thermal
performance of water in an evacuated tube solar collector with different inner glass surface
coating. Shah and Furbo (2004) investigated the theoretical flow of an all-glass evacuated tube
collector and mentioned that collector tube with shorter length achieved the highest efficiency.
Kim et al. (2016) compared the numerically investigated model with Eberlein’s model and
suggested that one-dimensional numerical model could be used in designing the all-glass solar
collector tube very efficiently for different geometrical parameters. Badar et al. (2011)
evaluated the overall heat transfer coefficient of an evacuated U–tube collector both
theoretically and experimentally and reported that the numerically predicted overall heat
transfer coefficient has good agreement with the experimental data. Gao et al. (2014) proposed
a new mathematical model for predicting the thermal performance of an evacuated U–tube
solar collector by taking into account the temperature distribution along the tube radius and
axis, and validated their model with experimental data obtained using aluminum as a fin. They
investigated the dependence of thermal efficiency on ambient condition and tube design
parameters. Kiran et al. (2015) developed an analytical solution for predicting the thermal performance
of an evacuated tube solar collector by employing three different working fluids. Ayala et al. (2015)
numerically studied the evacuated U–tube solar collector for a special case where the working
fluid inlet temperature was less than the ambient temperature. They also predicted the outlet
temperature of the heat transfer fluid using two different models, viz. the Boussinesq
approximation (BA) model and the variation of thermophysical properties with temperature
(VPT) model. They concluded that the BA model has a closer match for both thermal efficiency
and outlet temperature compared to the VPT model. Vishal and Avadesh (2017) theoretically
TH-1963_146103001
Page 55
State of Art
26
studied the effect of pressure drop and mass flow rate of working fluid on the performance of
evacuated tube solar collector using air as a working fluid. Liangdong et al. (2010) developed
a thermal model for analysing the effect of absorber coating on the thermal performance of the
evacuated U – tube. Farjallah et al. (2016) numerically investigated the thermal performance
of the evacuated U – tube solar collector with and without using filler material inside the
evacuated tube. From their analysis, it was concluded that performance of the evacuated U –
tube solar collector was better when the filler material was used.
2.5.2 Experimental studies on evacuated U – tube solar collector
The studies on evacuated tube type solar collectors have been initiated during 1970s. But the
investigations on evacuated U – tube solar collector were started very recently. Badar et al.
(2011) experimentally studied the effect of overall heat transfer coefficient on working fluid
temperature of the evacuated U – tube solar collector. Later, Gao et al. (2014) carried out
experimental studies for analysing the dependency of thermal efficiency on ambient
temperature and tube design parameters. Further, they also investigated the temperature
distribution across the evacuated U – tube solar collector. Neeraj and Avdhesh (2015)
experimentally investigated the performance of two types of evacuated tube solar collectors,
viz. first like the above described one and second with a LHS integrated to the collector tube
of the working fluid. From the experimental studies, they have observed that the outlet
temperature of the working fluid was higher with LHS than without LHS. Kaya et al. (2018)
investigated the influence of nanofluid on the thermal performance of evacuated U – tube solar
collector and concluded that ZnO/ethylene glycol – water nanofluid provides the better
performance than water or air. Rodriguez et al. (2018) developed a methodology for
determining the working fluid outlet temperature of an evacuated U – tube solar collector
arranged in series. Chen et al. (2017) studied the heat absorbing and vapour generating
characteristics of LiBr – H2O mixture in an evacuated tube solar collector. Lamnatou et al.
(2012) investigated the thermodynamic performance of the evacuated tube solar collector for
solar dryer application. Liang et al. (2011) validated the theoretical and experimental
investigations of U tube evacuated tube collector with filled type and concluded that this
collector has a better thermal performance than normal U-tube evacuated type solar collector
without filler material.
In the present study, numerical and experimental studies on evacuated U – tube solar collector
as well as for the whole system are carried out using water as working fluid and for low solar
TH-1963_146103001
Page 56
State of Art
27
intensity regions. Further, for optimizing the performance of the evacuated U – tube solar
collector as well as for the system, exergy analysis of the aforementioned system is carried out.
On the basis of present study, some of the notable contributions presented in the literature for
both the experimental and numerical studies as well as exergy performance of the individual
evacuated U – tube solar collector and whole system (array of solar collectors) are listed in
Table 2.3.
Table 2.3, Notable contributions available in the literature for evacuated U – tube solar
collector.
Authors (year) Experimental/
theoretical model
Energy/exergy
efficiency
analysis
Notable Contribution
Liangdong et
al. (2010)
Theoretical Energy efficiency Studied the thermal performance of evacuated
U – tube solar collector by developing a
mathematical model.
Liang et al.
(2011)
Experimental and
theoretical
Energy efficiency Investigated the thermal performance of the
solar collector using a filler material (graphite)
in – between the absorber tube and the U –
tube.
Gao et al.
(2014)
Experimental and
theoretical
Energy efficiency Developed a mathematical model for analysing
the temperature distribution across the solar
collector and for optimizing the evacuated tube
solar collector design. Further, experimentally
analysed the working fluid heat transfer
characteristics.
Ataee and
Ameri (2015)
Theoretical Energy and
exergy efficiency
Theoretically studied the exergy and energy
efficiencies of the evacuated U – tube solar
collector using CO2 and air as working fluid.
Liangdong et
al. (2016)
Theoretical Energy efficiency Developed a heat transfer model for analysing
the thermal performance of the filler type
evacuated U – tube solar collector.
Farjallah et al.
(2016)
Theoretical Energy efficiency Developed a numerical model for investigating
the evacuated U – tube solar collector
TH-1963_146103001
Page 57
State of Art
28
performance with and without using a filler
material.
Kim et al.
(2016)
Theoretical Energy efficiency Theoretically investigated the efficiency of the
evacuated U – tube solar collector using Al2O3,
CuO, SiO2 and TiO2 nanofluids as working
fluid.
Xianhua et al.
(2017)
Experimental Energy efficiency Tested the thermal performance of the
evacuated U – tube solar collector at low solar
intensities and working fluid inlet
temperatures.
Kim et al.
(2017)
Experimental Energy efficiency Experimentally investigated the performance
of the evacuated U – tube solar collector using
Al2O3 nanofluid as a working fluid.
Kaya et al.
(2018)
Experimental Energy efficiency Using ZnO/Ethylene glycol – pure water
nanofluids, the experimental investigations
were carried out on evacuated U – tube solar
collector.
2.6 Literature closure
From the literature survey, the following conclusions are made.
2.6.1 Liquid desiccant dehumidification/regeneration system
From the literature, it is observed that the reported mathematical/thermodynamic models
were used for predicting the performance of the liquid desiccant
dehumidification/regeneration system by employing complicated numerical procedure.
There is a lack of profound numerical analysis for analysing the heat and mass transfer
behaviour at the air – working fluid interface and also for predicting the variation of
evaporation/condensation rates along the tower height.
Several researchers faced challenges in the estimation of heat and mass transfer coefficients
or Lewis number theoretically.
Several researchers experimentally analysed the performance of the liquid desiccant
dehumidification/regeneration system using LiCl as liquid desiccant. But these
experimental studies lack the field analysis in accordance with humid subtropical climate.
TH-1963_146103001
Page 58
State of Art
29
Further, there is a lack of profound experimental investigations on sensible and latent
energy exchange processes occurring between the liquid desiccant and the ambient air for
both liquid desiccant dehumidification and regeneration systems.
It is also observed that there is a lack of profound exergy analysis which accounts for the
irreversibility of heat and mass transfer processes on the liquid desiccant regenerator.
There is also a lack of profound theoretical studies on analysing the influences of operating
parameters on the performance of regenerator based on entransy dissipation theory.
2.6.2 Evacuated U – tube solar collector system
The energy needed for regeneration of liquid desiccant can be obtained from low grade
energy like solar energy. Using solar energy, the performance of liquid desiccant AC is
found to be much better.
Most of the reported studies were focused on analysing the performance of the solar
collector using different tube designs and absorber coating materials and very few studies
have investigated the effect of filler material (filled inside the absorber/inner tube) on
collector efficiency of the evacuated tube.
Very few researchers have analysed the thermal performance of the evacuated U – tube
solar collector by performing experimental studies and by employing
numerical/mathematical models.
The reported numerical/mathematical models are not suited for predicting the working fluid
transition time and the heat transfer characteristics along the length of the evacuated U –
tube solar collector.
Further, there is a lack of profound experimental investigation on the performance of the
evacuated U – tube solar collector system (multiple evacuated U – tubes connected to a
manifold).
Also, very limited research works has been carried out on investigating energy and exergy
efficiencies of the evacuated U – tube solar collector.
2.6.3 Objectives of the present work
Based on the literature closure, the following core objectives are chosen for this thesis:
To develop a thermal model for analyzing the simultaneous heat and mass transfer
processes occurring in a counter-flow packed chamber and to predict the performance of
the structured packing chamber.
TH-1963_146103001
Page 59
State of Art
30
To develop a 3D numerical model for evaluating the performance of the individual
evacuated U – tube solar collector as well as for the whole solar collector system.
To design and fabricate a liquid desiccant dehumidification/regeneration system of 18 kW
capacity.
To design and fabricate evacuated U – tube solar collector system for achieving the working
fluid temperature difference of 35 οC.
To perform a detailed experimental study on liquid desiccant
dehumidification/regeneration system and evacuated U – tube solar collector system at
different operating and ambient conditions.
To validate the developed thermal models with the experimental data for both the
dehumidification/regeneration system and also for the evacuated U – tube solar collector
system.
To carryout energy and exergy analyses of the liquid desiccant
dehumidification/regeneration system and the evacuated U – tube solar collector system.
To analyze the entransy dissipation due to heat and mass transfer processes between the
ambient air and the liquid desiccant.
To propose a simplified thermodynamic model for predicting the heat and mass transfer
coefficients along the cross-flow packed chamber by considering the effect of Lewis
number.
TH-1963_146103001
Page 60
Numerical studies
31
CHAPTER – 3
NUMERICAL STUDIES
In this chapter, thermal models developed for theoretically assessing the heat and mass transfer
characteristics along the liquid desiccant dehumidifier/regenerator and the heat transfer
characteristics across the evacuated U – tube solar collector are presented. This chapter mainly
focuses on the following;
To develop a thermal model for assessing the performance of dehumidifier/regenerator.
To solve developed model for dehumidifier/regenerator using backtracking algorithm.
To propose a numerical model for predicting the performance of the solar collector.
To theoretically investigate the performance of the solar collector using filler material.
3.1 Liquid desiccant dehumidification/regeneration system
Packed tower is an important component in the liquid desiccant dehumidification/regeneration
system. This tower is generally used for exchanging heat and mass between gas – liquid or
liquid –liquid interfaces. Other than packed tower, falling film type and spray type towers are
also used for heat and mass transfer interactions. But the packed type is more preferable. This
is because, it can handle strong flow fluctuations, has relatively low pressure drop and is
compact in nature. Also, it is capable of achieving relatively high mass transfer efficiency
(Perry et al, 2007). Further, it is economically feasible and can be easily scaled up to any
TH-1963_146103001
Page 61
Numerical studies
32
capacity. In this study, heat and mass interactions between the air and the desiccant solution of
a packed tower is analysed.
In the packed tower, ambient air enters into a column where it exchanges heat and mass with a
desiccant solution that enters the column in counter-flow direction. The operating conditions
of the packed tower are chosen depending upon the type of component
(dehumidifier/regenerator). If it is a dehumidifier, the heat and mass transfer processes take
place from air to desiccant solution (dehumidification process), whereas in a regenerator, the
transfer processes occur from desiccant solution to air (humidification process), as shown in
Fig. 3.1.
From the literature, it is observed that the reported mathematical/thermodynamic models were
used only for predicting the performance of the liquid desiccant dehumidifier/regenerator
employing complicated numerical procedure. Further, major challenges faced by several
researchers are the estimation of heat and mass transfer coefficients (Zhang et al. 2012; Yimo
et al. 2014; Patil et al. 2016). It is observed from the reported works that there is a lack of
profound numerical analysis for analyzing the heat and mass transfer behaviour at the air –
desiccant desiccant solution interface and also predicting the variations of
evaporation/condensation rates along the tower height. Therefore, the present study focuses on
developing a simplified thermodynamic model based on finite difference method for analyzing
the heat and mass transfer interactions that take at the air – desiccant desiccant solution
interface. In addition, the proposed model also aims at developing simplified expressions for
predicting the heat and mass transfer coefficients compared to previous models reported in the
literature. A backtracking and recursive algorithm are proposed for computing the developed
thermodynamic model in Matlab R2013a. The simulation results are validated with the
experimental data of the liquid desiccant dehumidifier/regenerator. On the basis of simulated
results, contour plots are developed for analyzing the heat and mass transfer interactions take
place along the height of the packed tower in a counter-flow direction. Also, the
evaporation/condensation rate variation is reported along the height of the counter-flow packed
tower.
3.1.1 Thermodynamic model for counter-flow packed tower
The schematic representation for heat and mass transfer processes occurring between the
desiccant solution and the ambient air in a counter-flow packed tower is shown in Fig. 3.1.
Following assumptions are considered to simplify the analysis,
TH-1963_146103001
Page 62
Numerical studies
33
Adiabatic evaporation or condensation process.
Mass flux along the packed tower for desiccant solution and air are constant (Naik and
Muthukumar, 2017).
Thermo – physical properties of air and desiccant solution do not vary with temperature.
Variation of air and desiccant properties along the width of the packed tower is negligible
(Changquin et al. 2006; Koronaki et al. 2013).
Pressure drop across the tower height is neglected (Elsarrag et al., 2005).
a) Air side
Heat and mass balance across the interface for air side is formulated as
,a a a p v a a h s l aG dh G C T d a T T dZ
(3.1)
where Ga is air mass flux (kg/m2–s), 𝜔a is air humidity ratio (kgv/kgda), Ta and Tl are the air and
desiccant desiccant solution temperature (oC), 𝛼ℎ is heat transfer coefficient (W/m2–K), as is
specific surface area per unit volume (m2/m3), ha is air enthalpy (kJ/kg), 𝛿 is latent heat of
vaporization (kJ/kg) and Z is tower height (m).
The enthalpy on the air side is given by
, , )(a p a a p v a ah C C T
(3.2)
Eq. (3.2) can be differentiated as
, ,a p a a a p v a a a adh C dT d C T d dT
(3.3)
Combining Eqs. (3.1) & (3.3), the change in air temperature along the height of the packed
tower is obtained as
, ,
h l aa
p a a p v
T TdT
dZ C C
(3.4)
where h s
h
a
a
G
; h is the function of heat transfer coefficient and air mass flux.
On integration, Eq. (3.4) can be represented as
TH-1963_146103001
Page 63
Numerical studies
34
, ,0( )
oa
ia
T z
a h
a l p a a p vT
dTdZ
T T C C
(3.5)
After integrating Eq. (3.5), the air outlet temperature can be expressed as,
, ,
1 expo i
a a h
i avg
l a p a
v
p v
a
a
g
T T z
T T C C
(3.6)
where 𝜔𝑎~𝜔𝑎𝑎𝑣𝑔
and 𝑇𝑙~𝑇𝑙𝑎𝑣𝑔
.
Here, air specific humidity ratio in the packed tower (ωa) might be equal to the inlet air specific
humidity ratio (ωa,i) or equal to the outlet air specific humidity ratio (ωa,o). Therefore ωa is
assumed as ωaavg and the average of the specific humidity is calculated along the height of the
packed tower using Eq. 3.28 presented in Section 3.1.2b. Similarly, Ta is assumed as Taavg and
the average temperature of air is calculated using Eq. 3.31 presented in Section 3.1.2c.
Eq. 3.6 can be written as
, ,
( (1 ex
) )p
( () )
o i i
a a a h
i i avg
a l a p
i
l
a
i avg
p vl a
T T T T z
T T T T C C
(3.6a)
Fig. 3.1, Energy and mass balance across a packed tower (a) counter-flow dehumidifier and
(b) counter – flow regenerator.
TH-1963_146103001
Page 64
Numerical studies
35
The major performance characteristics for heat and mass transfer are the heat transfer
coefficient and the mass transfer coefficient. To calculate them, thermal effectiveness and
moisture effectiveness are used (sections 3.1.1c and 3.1.1f).
b) Thermal effectiveness
The thermal effectiveness is given as (Gandhidasan, 2004, 2005; Naik and Muthukumar 2017)
( ) ( )
( ) ( )
i o
a l
o i
a a a aT i i i i
l a
T T T T
T T T T
(3.7)
The thermal effectiveness (𝜉𝑇) in terms of heat transfer coefficient (𝛼ℎ), height of the packed
tower (𝑧) and air mass flux is derived from Eqs. (3.6a) & (3.7) as,
, ,
1 expavg i
l a hT i i avg
l a p a a p v
T T z
T T C C
(3.8)
As 1avg i
l a
i i
l a
T T
T T
, the final expression is written as,
, ,
1 exp hT avg
p a a p v
z
C C
(3.8a)
From Eqs. (3.7) & (3.8a), the expression for air outlet temperature can be derived as,
, ,
1 expo i
a a a avg
p a a p
i i
l
v
hT T T TC C
z
(3.9)
c) Heat transfer coefficient
Sinceh s
h
a
a
G
, the heat transfer coefficient (𝛼ℎ) in terms of height of the packed tower (z)
and air mass flux (𝐺𝑎) is represented from Eq. (3.8a) as,
, ,
avg
T p aa p v
s
h
aCG C
a z
(3.10)
where 1
ln1
T
T
; T is the logarithmic function of thermal effectiveness.
TH-1963_146103001
Page 65
Numerical studies
36
d) Air outlet humidity ratio
The change in air humidity ratio along the height of the packed tower is written as (Yimo et al.
2014),
am e a
d
dZ
(3.11)
where m s
m
a
a
G
; m is the function of mass transfer coefficient and air mass flux.
On integration, Eq. (3.11) is represented as,
0
oa
ia
z
am
e a
ddZ
(3.12)
After integrating Eq. (3.12), the air outlet specific humidity is expressed as,
1 m
o iza a
i
e a
e
(3.13)
1: mzo i i
a a e a eor
(3.14)
e) Moisture effectiveness
The moisture effectiveness (ξm) is given as (Gandhidasan, 2004, 2005; Naik and Muthukumar
2017)
o i i o
a a a am i i
e ea a
(3.15)
The moisture effectiveness in terms of height of the packed tower (z), mass transfer coefficient
(𝛼𝑚), air mass flux (𝐺𝑎) and specific surface area of packing (𝑎) is formulated using Eqs. (3.13)
& (3.15) as,
1 mz
m e
(3.16)
f) Mass transfer coefficient
Sincem s
m
a
a
G
, the mass transfer coefficient in terms of height of the packed tower (z) and air
mass flux (𝐺𝑎) is represented from Eq. (3.16) as,
TH-1963_146103001
Page 66
Numerical studies
37
m
s
maG
a z
(3.17)
where 1
ln1
m
m
; m is the logarithmic function of moisture effectiveness.
g) Desiccant solution side
Heat and mass balance across the interface for the desiccant solution side is written as,
,l l a h a l a p v a aG dh G T T dZ G C T d (3.18)
The desiccant solution enthalpy is given as,
,l p l ldh C dT (3.19)
By combining Eqs. (3.11), (3.18) & (3.19), the desiccant solution temperature change along
the height of the packed tower is obtained as,
,
,
lh a l m e a p v a
p l
dTT T C T
dZ C
(3.20)
where a
l
G
G ; γ is the ratio of mass flux of desiccant solution and air.
After integrating Eq. (3.20), the desiccant solution outlet temperature for a counter-flow packed
tower is written as (Fig. 3.1),
,
,
exp
avg
e ao avg i avg avg
l a l a m p v a havg avgp l a l
T T T T C TC T T
z
(3.21)
where 𝜔𝑎~𝜔𝑎𝑎𝑣𝑔
, 𝑇𝑙~𝑇𝑙𝑎𝑣𝑔
and 𝑇𝑎~𝑇𝑎𝑎𝑣𝑔
.
h) Outlet desiccant concentration for the dehumidifier and the regenerator
The amount of water vapour desorbed from the air across the dehumidifier is equal to the
change in concentration of the liquid desiccant, therefore the change in desiccant concentration
is expressed as (Koronaki et al. 2013),
ad d (3.22)
TH-1963_146103001
Page 67
Numerical studies
38
After integrating Eq. (3.22), the outlet desiccant concentration for the packed tower is
expressed as,
exp( ( ))o i i o
l l a a (3.23)
i) Condensation rate for the dehumidifier
The rate of water vapour condensed (absorbed) from the air side to the desiccant solution side
is defined as condensation rate for the dehumidifier and is given as,
a ad G d (3.24)
: ( )o i
a a aor G (3.25)
j) Evaporation rate for the regenerator
The rate of water vapour evaporated from the desiccant solution side to the air side is defined
as evaporation rate for the regenerator and is given as,
a ad G d (3.26)
: ( )o i
a a aor G (3.27)
3.1.2 Numerical simulation
In order to analyze the heat and mass transfer distributions along the packed tower and to
predict the outlet and performance parameters of the packed tower (dehumidifier/regenerator),
thermodynamic model derived in the aforementioned section needs to be solved numerically
using an algorithm. Therefore, a backtracking algorithm is introduced to solve the developed
model and Matlab R2013a is used as a simulation software for numerical simulation purposes.
The developed thermodynamic model can be alternatively solved by a number of semi –
analytical and semi-numerical methods such as the Adomian decomposition method (ADM),
the differential transform method (DTM) and the variational iteration method (VIM) (Bizar et
al. 2004; Fatoorehchi and Abolghasemi, 2014). But in the present study, the backtracking
algorithm is chosen for simplification purpose.
a) Backtracking algorithm
Backtracking algorithm is basically an iterative method in which the generated desiccant
solution is compared with a set of conditions at each step. If the conditions are not satisfied,
backtracking is done using slightly different set of input data. This process continues till the
given set of conditions is satisfied. Then the iteration is terminated. This approach is
TH-1963_146103001
Page 68
Numerical studies
39
advantageous because the number of iterations required during the simulation is much less as
compared to other types of algorithms. Hence, the desired output can be attained quickly (Yuan
et al. 2015; Turgut, 2017). In the present study, it is necessary to take assumptions for some
unknown parameters and check which set of assumed parameters; this provides more accurate
results. Further, to validate the present model for multiple parameters, a large number of
possible desiccant solutions needs to be tested. Therefore, it is desirable to implement a
backtracking algorithm which eliminates the numerous unnecessary test runs by preventing
further iterations and advancing to the next set of conditions/instructions whenever it finds the
optimal desiccant solution.
The backtracking algorithm used for developing the numerical simulation is shown in Fig. 3.2.
The simulation procedure involves a nested loop and three iterative loops. The input parameters
that are used for obtaining the outlet and performance parameters ( 𝑇𝑎𝑜, 𝑇𝑙
𝑜, 𝜔𝑎𝑜, β𝑙
𝑜 and 𝜆) of
the packed tower are air and desiccant desiccant solution inlet temperatures (𝑇𝑎𝑖 & 𝑇𝑙
𝑖), air inlet
humidity ratio (𝜔𝑎𝑖 ), air and desiccant desiccant solution mass flux (𝐺𝑎 & 𝐺𝑙), specific humidity
at equilibrium (𝜔𝑒), desiccant desiccant solution inlet concentration in case of the dehumidifier
and the regenerator (β𝑙𝑖), air and desiccant desiccant solution thermo – physical properties and
the packed tower specifications.
Initially in the nested loop, equally spaced moisture and thermal effectiveness (𝜉𝑚 & 𝜉𝑇) values
are generated in between 0 and 1 for predicting the outlet air temperature and specific humidity
values (𝑇𝑎𝑜 & 𝜔𝑎
𝑜) using Eqs. (3.7) & (3.15). These values are compared with the experimental
results reported in the literature. The combination of 𝜉𝑚and 𝜉𝑇 is chosen depending upon the
accuracy of 𝑇𝑎𝑜 and 𝜔𝑎
𝑜. Using the predicted 𝜔𝑎𝑜 value, β𝑙
𝑜 and 𝜆 values are calculated using
Eqs. (3.23) & Eq. (3.25) or (3.26).
The average values of air temperature and specific humidity (𝑇𝑎𝑎𝑣𝑔
& 𝜔𝑎𝑎𝑣𝑔
) are calculated for
predicting 𝑇𝑙𝑜. Two iterative loops are performed to estimate these average values. In these
loops, the height of the packed tower is divided into ‘n’ equal parts using ‘n+1’ equally spaced
nodes namely A1, A2, A3, ……….., An+1 (Fig. 3.3).
b) Calculation procedure for 𝜔𝑎𝑎𝑣𝑔
The expression for outlet air specific humidity developed in the present model (Eq. (3.14)) will
be used for predicting the specific humidity at each node, i.e.
TH-1963_146103001
Page 69
Numerical studies
40
Fig. 3.2, Flowchart for numerical simulation of the developed model.
TH-1963_146103001
Page 70
Numerical studies
41
,
( 1)1i i
a e a ma k
k zexp
n
(3.28)
where k = 2, 3, 4, .………., n+1.
At node A1, the air specific humidity is defined as
Fig. 3.3, Height of the column divided into ‘n’ equal parts.
,1
i
a a (3.29)
These values from node A1 to An+1 are added and then, the sum is divided by ‘n+1’ to
obtain 𝜔𝑎𝑎𝑣𝑔
,
,1 ,2 ,3 , , 1..........
1
a a a a n a navg
an
(3.30)
c) Calculation procedure for 𝑇𝑎𝑎𝑣𝑔
The air temperature in each node is predicted using the expression for air outlet temperature
developed in the present model (Eq. (3.9)),
,
, ,
1 e
( 1)
xph
i
a k a a avg
p a a p v
i i
l
z
T T T TC
k
n
C
(3.31)
where k = 2, 3, 4, ………….., n+1.
TH-1963_146103001
Page 71
Numerical studies
42
In the Eq. (3.31), the 𝜔𝑎𝑎𝑣𝑔
value is taken from Eq. (3.30).
At node A1, the air temperature is defined as
,1
i
a aT T (3.33)
These values from A1 to An+1 are added and then, the sum is divided by ‘n+1’ to obtain 𝑇𝑎𝑎𝑣𝑔
,
,1 ,2 ,3 , , 1...........
1
a a a a n a navg
a
T T T T TT
n
(3.34)
For obtaining desiccant solution outlet temperature (𝑇𝑙𝑜), average desiccant solution
temperature (𝑇𝑙𝑎𝑣𝑔
) has to be calculated in addition to 𝑇𝑎𝑎𝑣𝑔
and 𝜔𝑎𝑎𝑣𝑔
. Therefore, an iterative
loop is performed for calculating 𝑇𝑙𝑎𝑣𝑔
. In this loop for the first iteration, 𝑇𝑙𝑜 is calculated by
assuming 𝑇𝑙𝑎𝑣𝑔
= 𝑇𝑙𝑖 using the appropriate equation (Eq. 3.21). Then, 𝑇𝑙
𝑎𝑣𝑔is updated by taking
the average of 𝑇𝑙𝑖 and 𝑇𝑙
𝑜 obtained in the first iteration. The updated value of 𝑇𝑙𝑎𝑣𝑔
is then used
to calculate 𝑇𝑙𝑜 again. This process is repeated n times to attain accurate 𝑇𝑙
𝑜(Fig. 3.2).
3.1.3 Validation of developed thermodynamic model
a) Comparison of predicted results with experimental data
To use the aforementioned model for predicting the performance parameters of the packed
tower with reasonable accuracy, proper validation is needed. Therefore, a comparison is made
between the experimental data available in the literature (Fumo and Goswami, 2002; Langroudi
et al. 2014; Chung and Ghosh, 1996) and the results predicted from the developed model.
Initially, the validation is carried out for the counter – flow dehumidifier for fifteen cases of
experimental data reported by Langroudi et al. (2014) and nine cases of experimental data
reported by Chung and Ghosh (1996). Then, the counter – flow regenerator is validated for
thirteen cases of experimental data of Fumo and Goswami (2002). Table 3.1 shows the
operating conditions used for validating the developed model.
Table 3.1, Operating conditions for the packed tower
Parameter
Langroudi et
al. (2014)
Chung and
Ghosh (1996)
Fumo and
Goswami (2002)
Height of column (m) 0.5 0.4 0.6
Desiccant desiccant solution LiBr LiCl LiCl
Air inlet temperature (oC) 27.7-37.3 21-24.1 29.4-40
TH-1963_146103001
Page 72
Numerical studies
43
Air inlet humidity ratio (gv/kgda) 13.3-20 11.1-16.8 17.7-21
Air mass flux (kg/m2s) 3.3-5.1 1.3-1.7 0.83-1.44
Desiccant desiccant solution inlet
temperature (oC) 21.8-28.2 16.4-18.9 65-65.8
Desiccant desiccant solution mass
flux (kg/m2s) 3.4-7 10.5-16.8 5.19-7.54
Desiccant inlet concentration (%) 38-48 31-37 32.8-34.9
Type of component Dehumidifier Dehumidifier Regenerator
Type of flow Counter-flow Counter-flow Counter-flow
b) Dehumidifier
Figs. 3.4 and 3.5 show the comparison of predicted values obtained from the developed model
with the experimental data available in the literature (Langroudi et al. 2014; Chung and Ghosh,
1996) for the packed tower. Fig. 3.4a – 3.4e and Table 3.2 show the comparison of predicted
values with the experimental data (Langroudi et al. 2014; Chung and Ghosh, 1996) of the
counter-flow dehumidifier. It is observed that the predicted condensation rate, air and desiccant
solution outlet temperatures and air humidity ratio have the maximum deviations of ±8.0%,
±0.6 oC, ±0.9 oC and ±6.1% and the mean deviations of ±4.5%, ±0.2 oC, ±0.3 oC and ±2.7%,
respectively with the respective experimental values reported by Langroudi et al. (2014) and
Chung and Ghosh (1996) whereas the mean and maximum deviations of desiccant solution
concentration is almost negligible.
(a) (b)
TH-1963_146103001
Page 73
Numerical studies
44
(c) (d)
(e)
Fig. 3.4, Comparison of model predictions with the experimental results reported by
Langroudi et al. (2014) and Chung and Ghosh (1996) for the counter-flow dehumidification
systems: (a) air outlet temperature, (b) desiccant outlet temperature, (c) outlet air humidity
ratio, (d) desiccant concentration at outlet and (e) condensation rate.
d) Regenerator
The comparison of predicted data with the experimental data (Fumo and Goswami, 2002) of
counter-flow regenerator are shown in Fig. 3.5a – 3.5e and Table 3.2. It is found that the
predicted values of evaporation rate, air and desiccant solution outlet temperatures, air
humidity ratio and desiccant solution concentration showed the maximum deviations of ±0.2
oC, ±0.3 oC, ±2.2%, ±1.8% and ±1.5%, respectively with the experimental values reported
by Fumo and Goswami (2002) for the counter-flow regenerator.
TH-1963_146103001
Page 74
Numerical studies
45
(a) (b)
(c) (d)
(e)
Fig. 3.5, Comparison of model predictions with the experimental results reported by Fumo
and Goswami, (2002) for the counter-flow regeneration systems: (a) air outlet temperature,
(b) desiccant outlet temperature, (c) outlet air humidity ratio, (d) desiccant concentration at
outlet and (e) evaporation rate.
TH-1963_146103001
Page 75
Numerical studies
46
From Figs. 3.4 and 3.5 and Table 3.2, it is observed that the maximum deviation for the
performance parameters rarely crosses beyond ±8% and in most of the cases, it is within ±5%.
It is also observed that the desiccant solution outlet temperature has a slightly higher
discrepancy when compared with other performance parameters. This discrepancy is due to the
assumptions made in the analysis and also, due to the fixed number of iterations carried out
during the simulation process. It is found that for most of the cases, a closer agreement is
achieved at 5000 iterations (N = 5000). By considering the maximum and mean deviations
presented in Table 3.2, it is concluded that the developed thermodynamic model is well suited
for analyzing the heat and mass transfer processes occurring across the packed tower with
better accuracy than the models reported in the literature (Langroudi et al. 2014; Chung and
Ghosh, 1996; Fumo and Goswami, 2002).
Table 3.2, Maximum and mean deviations of predicted values with the experimental data
reported in the literature for the dehumidifier and regenerator systems
Parameters
Dehumidifier Regenerator
Langroudi et al.
(2014)
Chung and Ghosh
(1996)
Fumo and Goswami
(2002)
Max. Mean Max. Mean Max. Mean
Outlet air temperature (oC) ±0.2 ±0.1 ±0.6 ±0.2 ±0.2 ±0.1
Outlet air humidity ratio 1.2% 0.7% 6.1% -2.7% 1.8% 0.7%
Outlet desiccant solution
temperature (oC) ±0.9 ±0.3 ±0.3 ±0.2 ±0.2 ±0.2
Concentration of desiccant
solution ±1.3% ±0.6% - - ±1.5% ±1.1%
Evaporation/ Condensation
rate ±3.7% ±1.3% ±8.0% ±4.5% ±1.3% ±0.4%
3.1.4 Contour plots for air and desiccant solution operating and performance parameters
Using the developed numerical model, it is also possible to analyze the heat and mass transfer
processes occurring along the height of the counter-flow packed tower. The operating (air and
desiccant inlet parameters) and performance parameters (condensation/evaporation rate)
chosen for analyzing the transfer processes of a counter-flow packed tower are given in Table
3.3. Figs. 3.6 and 3.7 show the air and desiccant solution temperature, air humidity ratio,
TH-1963_146103001
Page 76
Numerical studies
47
desiccant concentration and evaporation/condensation rate distribution plots along the height
of the counter-flow dehumidifier and regenerator (using the inlet parameters represented in
Table 3.3).
Table 3.3, Inlet and outlet parameters used for analyzing the performance characteristics of
the counter-flow packed tower
Dehumidifier (Langroudi et al. (1996)); (Desiccant solution – LiBr)
𝐺𝑎
(kg/m2s)
𝑇𝑎
(oC)
𝜔𝑎
(kgv/kgda)
𝐺𝑙
(kg/m2s)
𝑇𝑙
(oC)
𝛽𝑙
(%)
𝜆
(g/m2s)
Inlet parameters 3.3 37.3 0.0185 7 28.2 48 -
Outlet Parameters (experimental) - 30.1 0.013 - 32.4 47.9 18.3
Outlet parameters (predicted) - 30.2 0.013 - 32.09 47.87 18.3
Percentage difference (%) - -0.1 0.00 - 0.96 0.05 0.00
Regenerator (Fumo and Goswami (2002)); (Desiccant desiccant solution – LiCl)
Inlet parameters 1.10 30.1 0.0180 6.21 65.1 34.1 -
Outlet Parameters (experimental) - 59.3 0.0532 - 57.8 34.8 38.6
Outlet parameters (predicted) - 59.15 0.053 - 58.05 34.31 38.52
Percentage difference (%) - 0.25 0.9 - 0.4 1.4 0.25
In the counter-flow dehumidifier, the air is cooled and dehumidified simultaneously along its
flow direction (Fig. 3.6a, 3.6c), whereas the desiccant solution is heated and diluted along its
flow direction (Fig. 3.6b, 3.6d). The condensation rate decreases along the air flow direction
(Fig. 3.6e), because the potential for moisture transfer from air to desiccant solution decreases
due to decrease in vapour pressure difference.
In the counter-flow regenerator, the air is heated and humidified simultaneously along its flow
direction (Fig. 3.7a, 3.7c), whereas the desiccant solution is cooled and concentrated along its
flow direction (Fig. 3.7b, 3.7d). The evaporation rate decreases along the air flow direction
(Fig. 3.7e). It happens due to the decrease in vapour pressure difference between the air and
the desiccant solution.
TH-1963_146103001
Page 77
Numerical studies
48
Fig. 3.6, Contour plots for the counter – flow dehumidifier using the inlet parameters given in
Table 3: (a) Air temperature, (b) Desiccant solution temperature, (c) Air humidity ratio, (d)
Desiccant concentration and (e) Condensation rate.
TH-1963_146103001
Page 78
Numerical studies
49
Fig. 3.7, Contour plots for the counter-flow regenerator using the inlet parameters given in
Table 3: (a) Air temperature, (b) Desiccant solution temperature, (c) Air humidity ratio, (d)
Desiccant concentration and (e) Evaporation rate.
In Figs. 3.6 and 3.7, the value of condensation/evaporation rate (𝜆) obtained from the
simulation process for a particular point is much smaller when compared with the experimental
value. This is because the experimental results indicate the total evaporation/condensation rate
TH-1963_146103001
Page 79
Numerical studies
50
for the entire height of the packed tower, whereas the simulated results presented in Figs. 3.6
and 3.7, depict the individual values of 𝜆 for a specific partition of height i.e., all the values of
𝜆 obtained in the simulated plots would add up to attain the total 𝜆 given in the experimental
data.
It should be noted that most of the thermodynamic models reported in the literature
(Gandhidasan, 2004, 2005; Yimo et al. 2014) have been employed for predicting the outlet and
performance parameters ( 𝑇𝑎𝑜, 𝑇𝑙
𝑜, 𝜔𝑎𝑜, β𝑙
𝑜 and 𝜆) of the packed tower. But, this work
emphasizes on the coupled heat and mass interactions across the counter-flow packed tower
using the distribution plots for air and desiccant temperatures, air humidity ratio, desiccant
concentration and evaporation/condensation rate (Figs. 3.6 – 3.7). It is observed from these
plots that variation of air and desiccant solution temperatures, air humidity ratio and
evaporation rate are significant along the height of the regenerator whereas in the dehumidifier,
the variation of desiccant temperature, air humidity ratio and condensation rate are significant.
Further, from Figs. 3.6 and 3.7, it is also observed that the evaporation/condensation rate
always decreases along the air flow direction.
3.2 Evacuated U – tube solar collector system
The evacuated tube solar collector is similar to a heat exchanger which absorbs solar energy
and transfers it to the working fluid (Fig. 2.1). In the present investigation, a finite element
method based three dimensional evacuated U–tube solar collector model for both filled and
unfilled type is chosen because to compare the accuracy of two dimensional and one
dimensional numerical models. 3-D model is expected to provide accurate outlet parameters of
the evacuated U-tube solar collector and also useful to visualize the thermal behaviour across
and along the evacuated U-tube solar collector. The developed three dimensional numerical
model is based on following assumptions,
Solid materials (glass, aluminium or copper) and the working fluid are isotropic,
Steady state fluid flow condition along the U–tube, flow is laminar,
Only radiative heat transfer takes place across the annular–space between the inner and
outer glass tube,
Air gap between the inner glass surface and fin material (aluminium or copper) is negligible
Conductive heat transfer between the fin material and air is negligible, due to low thermal
conductivity of air medium.
TH-1963_146103001
Page 80
Numerical studies
51
The continuity and momentum equations (Eqs. 3.35 and 3.36) are solved simultaneously for
predicting the behaviour of the working fluid flowing inside the U–tube. The energy equation
(Eq. 3.41) is solved using the velocity field obtained from the solution of Eqs. 3.35 and 3.36.
In order to find the temperature distribution of the working fluid, solar irradiation on the surface
coating of the inner glass tube and the heat transfers from inner glass tube surface to the solid
fin (copper or aluminium), from solid fin to U–tube and from U–tube to the working fluid are
considered. The continuity, momentum and energy equations for both the filled and unfilled
type U–tube solar collectors are solved with an accuracy of 10-3 using the GRMS solver. In this
model, variation of working fluid thermo – physical properties on the temperature are
considered (See Fig. 2.1).
Continuity equation:
. 0V (3.35)
Momentum equation:
2
wf V V P V
(3.36)
Energy equation:
Radiation equation: solid – vacuum interface region
Outer glass: 4
. g
Tk T
V
(3.37)
Inner glass: 4
. a
Tk T
V
(3.38)
Conduction equation: solid – solid interface region
Fin: . .a fk T k T (without filler material)
(3.39)
Fin: . . .a f frk T k T k T (with filler material) (3.39a)
U–tube: . .f uk T k T (without filler material) (3.40)
U–tube: . . .f fr uk T k T k T (with filler material) (3.40a)
Convection equation: solid – liquid interface region
,. .u wf p wfk T V c T
(3.41)
TH-1963_146103001
Page 81
Numerical studies
52
3.2.1 Boundary conditions
The front, back and bottom sides of the evacuated U–tube solar collector are adiabatic
(see Fig. 2.1 and 3.8).
. 0;mn k T ( 3.42)
where ‘n’ is the normal vector.
At upper glass tube surface there is a constant heat input (ζ).
The outer surface of the glass tube and the inlet of the U–tube are at ambient temperature
(Tamb) and the working fluid inlet temperature (Tw,i), respectively.
3.2.2 Mesh generation
Free unstructured triangular mesh has been adapted to ensure that relatively small geometries
(U–tube) are discretized with a sufficient number of elements. The grid size for the working
fluid is smaller than that for the evacuated tube as it represents a smaller volume. The
distribution of elements depending upon the mesh generation is given in Table 3.4a and 3.4b.
Table 3.4a, Grid size and number of mesh elements for evacuated U–tube models.
Sl.
No.
Evacuated tube
solar collector
model
Grid size (mm) Type of mesh
element
No. of mesh
elements
Evacuated tube U–tube material
Min Max Min Max
1
Copper as U–
tube material
and air as
working fluid
(Model A)
1.26
6.66
0.50
4.65
Tetrahedral 736472
Prism 87788
Triangular 161465
Quadrilateral 128
Edge 10921
Vertex 72
Total no. of mesh elements
(radial × axial)
996846
(2716 × 367)
2
Aluminium as
U–tube material
and
1.35
7.51
0.63
5.62
Tetrahedral 814873
Prism 90744
Triangular 171465
Quadrilateral 128
Edge 10991
Vertex 72
TH-1963_146103001
Page 82
Numerical studies
53
Water as
working fluid
(Model B)
Total no. of mesh elements
(radial × axial)
1088273
(2857 × 381)
Table 3.4b, Total number of grid elements.
Grid name Number of elements
Evacuated U–tube collector model
A
(material – copper)
B
(material – aluminium)
G1 7, 68, 437 8, 47,052
G2 9, 96,846 10, 88,273
G3 11, 55,344 12, 09,828
3.2.3 Performance parameters
a) Useful heat rate
The amount of heat absorbed by the working fluid from the evacuated tube solar collector is
given as
, , ,( )useful p wf w o w iQ mc T T (3.43)
b) Collector Efficiency
The thermal performance of an evacuated tube solar collector is represented by the collector
efficiency (η). It is defined as the ratio of useful heat gained by the working fluid to the product
of effective solar radiation incident on the collector (I) and area of the collector (Ac).
, , ,( )p wf w o w i
c
mc T T
A
(3.44)
TH-1963_146103001
Page 83
Numerical studies
54
3.2.4 Validation of developed numerical model
Table 3.5, Evacuated tube collector dimensions and surface properties.
Parameters Evacuated tube
collector model - A
(Gao et al. 2014)
Evacuated tube collector
model - B (Neeraj and
Avadesh, 2015)
Outer glass tube diameter (m) 0.047 0.058
Outer glass tube thickness (m) 0.0012 0.002
Outer glass tube transmittance (τ) 0.8 0.8
Thermal conductivity of glass (W/m–K) 1.2 0.74
Inner glass tube outer diameter (m) 0.037 0.047
Inner glass tube thickness (m) 0.0012 0.002
Absorptivity of inner tube (α) 0.92 0.92
Inner glass tube inner surface, emissivity (ε) 0.8 0.8
Air gap (m) 0.001 0.001
Air thermal conductivity (W/m–K) 0.03 0.03
Type of fin Copper Aluminium
Fin thickness (mm) 0.6 0.25
Thermal Conductivity of fin (W/m–K) 368 202
U tube outer diameter (m) 0.008 0.01
U tube inner diameter (m) 0.0074 0.0095
Collector tube length (m) 1.5 1.8
Working fluid Air Water
Specific heat at constant pressure (Cp) (kJ/kg–K) 1.005 4.2
Heat transfer coefficient between U–tube and
working fluid hc(1-c) (W/m2–K)
250 700
Reynolds number (Re) Re < 4000 Re < 4000
In order to validate the numerical model, the results obtained for the outlet temperatures of the
working fluid from evacuated tube collector are compared with the data reported by Gao et al,
(2014) and Neeraj and Avadhesh (2015). The surface properties and specifications of the
models are given in Table 3.5. The boundary conditions (section 2.2) are applied to the
investigated models for numerical validation. The inlet parameters presented in Table 3.6 are
taken as initial and boundary conditions. The numerically predicted working fluid outlet
TH-1963_146103001
Page 84
Numerical studies
55
temperature shows good agreement with the experimental data reported in the literature (Gao
et al, 2014 and Neeraj and Avadhesh, 2015) (Table 3.6). The maximum and mean deviations of
the predicted data from experimental values are 2.2 °C and -0.03 °C, respectively. In all the 10
cases, the predicted values for working fluid temperature are slightly higher or lower (±2.5 °C)
than the experimental values. This small deviation could be due to the variation in thermo–
physical properties of the working fluid and experimental uncertainties and due to the
assumptions made in the developed model.
Table 3.6, Comparison of experimental results with the present model.
Working fluid – Air (Gao et al, 2014) for evacuated tube collector, Model A
Inlet parameters Outlet parameters
Case Tamb Tw,i ṁ ζ Tw,o
(°C) (°C) (kg/s) (W/m2) (°C)
Exp. Numerical difference
1 32 32 0.035 495 39.8 37.9 1.9
2 34.5 34.5 0.035 662 44.5 42.3 2.2
3 35.5 35.5 0.035 748 46.4 44.8 1.6
4 36 36 0.035 836 48 45.9 2.1
5 34 34 0.018 469 39.4 40.5 -1.1
6 35 35 0.018 621 42.3 44.1 -1.8
7 36.5 36.5 0.018 758 44.3 46.4 -2.1
8 37 37 0.018 813 46.4 47.5 -1.1
Working fluid – Water (Neeraj and Avadhesh, 2015) for evacuated tube collector,
Model B
Inlet parameters Outlet parameters
Tamb Tw,i ṁ Seff Tw,o
(°C) (°C) (kg/s) (W/m2) (°C)
Exp. Numerical difference
9 23.7 22.9 0.027 926 29 30.2 -1.2
10 23.9 56.6 0.030 860 61 61.8 -0.8
TH-1963_146103001
Page 85
Numerical studies
56
Fig. 3.8, Temperature variation across the evacuated tube solar collector (Front view).
Fig. 3.9, Temperature variation of working fluid along the collector length.
Fig. 3.8 shows the temperature distribution across the front side of evacuated tube solar
collector for case 1. As expected, maximum temperature is observed at the inner glass surface
due to high radiative heat transfer. After attaining theoretical temperature contour variation plot
for whole evacuated U–tube solar collector, individual partwise temperature variation is
analyzed along the longitudinal direction. It is observed that there is a significant variation in
temperature along the U–tube compared to other parts (aluminium fin and evacuated tube).
Therefore, only the contour plot for temperature variation along the length of the U–tube is
presented in fig. 3.9.
TH-1963_146103001
Page 86
Numerical studies
57
(a)
(b)
TH-1963_146103001
Page 87
Numerical studies
58
(c)
Fig. 3.10, Comparison of numerically predicted heat gain with experimental data (Gao
et al, 2014 and Neeraj and Avadhesh, 2015): Influence of average solar irradiance on
heat gain for working fluid air (a and b) and water (c).
(a)
TH-1963_146103001
Page 88
Numerical studies
59
(b)
(c)
Fig. 3.11, Comparison of experimental results (Gao et al, 2014 and Neeraj and
Avadhesh, 2015) with the numerical results: Influence of average solar irradiance on
efficiency of the evacuated tube solar collector (air (a and b) and water (c)).
TH-1963_146103001
Page 89
Numerical studies
60
Figs. 3.10 and 3.11 show the comparison of experimental results for heat absorption and
efficiency with the numerical predicted results. The heat gained by the working fluid increases
with increase in average solar irradiance (fig. 3.10a – 3.11c). At higher average solar irradiance,
there will be a higher heat transfer from the outer glass to the U–tube (copper or aluminum)
and subsequently, a higher potential for convective heat transfer between the U–tube and the
working fluid. It is observed from Fig. 3.11a – 3.11c that there is only a minimal increase in
efficiency with an increase in average solar irradiance. For a given average solar irradiance,
the maximum deviation of predicted data from experimental values for useful heat gained by
the working fluid and efficiency of the solar collector are found to be ± 7.7 % and ± 8.3 %
(fig. 3.10a – 3.10c & 3.11a – 3.11c), respectively.
Based on this preliminary investigation, it is concluded that the proposed numerical model is
well suited for predicting the various performance parameters such as outlet temperature of the
working fluid, useful heat rate and collector efficiency of the evacuated tube collector.
3.2.5 Grid independence test
As shown in Fig. 3.12a and 3.12b, a grid independence test is carried out by analysing the effect
of different element sizes on the variation of useful heat rate along the collector length for both
evacuated U–tube solar collector models. The details of grid elements used in both the
evacuated U–tube solar collector models (model A and B) are presented in Table 3.4a.
(b) Evacuated tube model – A.
TH-1963_146103001
Page 90
Numerical studies
61
(b) Evacuated tube model – B.
Fig. 3.12, Grid independent test.
From Fig. 3.12a and 3.12b and Table 3.4a, it is observed that for a given length, there is a small
difference in working fluid useful heat rate with increase in total grid elements from 7, 68, 437
to 11, 55,344 for the evacuated tube collector model – A (tube material – copper) and 8, 47,052
to 12, 09,828 for the evacuated tube collector model – B (tube material – Aluminium),
respectively. By varying the total grid elements from 9, 96,846 to 11, 55,344 for model A and
from 10, 88,273 to 12, 09,828 for model B, the variation in useful heat rate along the collector
length is negligible. Therefore, for saving the computational time, 9, 96,846 and 10, 88,273
elements are selected for further investigation of evacuated U–tube models A and B. The
maximum and minimum grid sizes and type of mesh element for the aforementioned grid
elements of both the evacuated U–tube collector models (model A and B) are presented in
Table 3.4b.
3.2.6 Results and discussion
Table 3.7, Operating parameters for parametric investigation.
Sl.
No. Operating parameters Operating values
1 Ambient air temperature (°C) 32
2 Working fluid inlet temperature (°C) 36
3 Mass flow rate of working fluid (kg/s) 0.030
4 Average solar irradiance (W/m2) 836
TH-1963_146103001
Page 91
Numerical studies
62
5 Dimensions of evacuated tube collector Evacuated tube Collector – Model B
(Table 3.5)
6 Working fluid Water and air
7 U–tube material Brass, copper, aluminium
8 Thermal conductivity (Young, 1992)
(W/m–K)
Copper – 368
Brass – 109
Aluminium – 202
9 Fin material Aluminium/copper
10 Density (Young, 1992) (kg/m3) Copper – 8978
Brass – 7400
Aluminium – 2712
With the developed thermal model, the variation in working fluid outlet temperature and useful
heat rate along the collector length, the influence of mass flow rate on useful heat rate along
the collector length and the effect of useful heat rate on collector efficiency are investigated
using two different working fluids (water and air) and three different collector materials (brass,
copper and aluminum). Further, the performance comparison of evacuated U–tube solar
collector with filled absorber tube and unfilled absorber tube are also investigated. The list of
parameters considered for the present analysis are given in Table 3.7.
a) Variation of temperature along the collector length
Fig. 3.13a and 3.13b shows the predicted working fluid temperature variation along the U–tube
collector length. For a particular working fluid (air or water), the outlet temperature for copper
is higher in comparison with brass and aluminium (Fig. 3.13a and 3.13b). This is due to the
difference in thermal conductivity of the U–tube material. As the copper (kcu = 401 W/m–K)
has higher thermal conductivity than brass (kbr = 205 W/m–K) and aluminium (kal = 109 W/m–
K), employing copper as a U–tube material will achieve higher heat transfer than aluminium
and brass as U–tube materials. Therefore, copper as a U–tube material will have less uniformity
in temperature along the length compared to aluminium and brass as the U–tube materials. It
is observed from Fig. 3.13a and 3.13b that for a given U–tube material, there is a significant
increase in working fluid temperature up to certain collector length (0 m to approximately 1.6
m) and after that there is only a marginal increase in working fluid temperature along the
remaining collector length (approximately 1.6 m to 0 m). This happens because from 0 to
approximately 1.6 m, the difference in working fluid and the U–tube inner wall surface
TH-1963_146103001
Page 92
Numerical studies
63
temperature is high. As the working fluid temperature increases, the temperature difference
between the working fluid and the U–tube inner wall surface decreases and hence there is only
a marginal increase in working fluid temperature.
(a)
(b)
Fig. 3.13, Comparison of working fluid temperature variation along the U–tube
collector length for different U–tube materials: (a) working fluid – water and U–tube
material – Brass, Copper and aluminium; (b) working fluid – air and U–tube material
– Brass, Copper and aluminium.
It is also observed from Fig. 3.13a and 3.13b that the difference in outlet temperature between
the brass and the copper material based U–type evacuated tube collector are 8.6 °C with water
TH-1963_146103001
Page 93
Numerical studies
64
as working fluid and 7.0 °C with air as working fluid. The difference in outlet temperature
between the brass and aluminium based U–tube evacuated tube collector are 4.0 °C with water
working fluid and 2.3 °C with air as working fluid. This indicates that for either water or air
as a working fluid, the copper U–tube is a good choice. However, if cost and density of the fin
material is an issue then aluminium may be chosen instead of copper and reducing the
aluminium fin thickness because with decrease in thickness of aluminium fin, the same heat
transfer can be obtained (equivalent to the heat transfer from the absorber tube to the copper
fin material) from the absorber tube to the aluminium fin. From Fig. 3.13a and 3.13b, it is also
found that for a particular U–tube material, the outlet temperature of water is higher compared
to air.
b) Variation of useful heat rate along the collector length
(a)
(b)
TH-1963_146103001
Page 94
Numerical studies
65
(c)
Fig. 3.14, Comparison of working fluid heat gain variation along the collector length
for different U–tube materials: (a) U–tube material – Brass and working fluid – air and
water; (b) U–tube material – Copper and working fluid – air and water and (c) U–tube
material – Aluminium and working fluid – air and water.
The variation of the numerically predicted useful heat rate of the working fluid along the U–
tube collector length is shown in Fig. 3.14a – 3.14c. It is observed that water gains more heat
in comparison with air. This happens because of the difference in specific heat of the working
fluid as well as heat transfer coefficient between the U–tube inner surface and the working
fluid. It is observed from Fig. 3.14a – 3.14c that for a given U–tube material, there is a
significant increase in the amount of heat absorbed by the working fluid up to certain collector
length (0 m to approximately 1.6 m) and after that there is only a marginal increase in working
fluid heat gain along the U–tube collector length (approximately 1.6 m to 0 m). This is due to
the fact that, from 0 m to 1.6 m collector length, the difference in heat transferred by the U–
tube inner wall surface to the working fluid is high. As the heat absorbed by the working fluid
increases, aforementioned difference will decrease. Subsequently, the convective heat transfer
between the U–tube inner wall surface and the working fluid decreases. Hence, there is only a
marginal increase in heat gained by the working fluid. From Fig. 3.14a – 3.14c, it is observed
that the difference in useful heat rate between air and water for brass, copper and aluminium
U–tube materials is found to be 71 %, 68 % and 66 %, respectively. This indicates that for all
the U–tube materials investigated, water is a better working fluid than air.
TH-1963_146103001
Page 95
Numerical studies
66
c) Effect of mass flow rate for different U–tube material/working fluid combinations
Fig. 3.15a – 3.15f illustrates the numerical results obtained for the useful heat absorbed by the
water and air at different mass flow rates varying from 0.01 kg/s to 0.05 kg/s and for different
U–tube materials. For a given flow rate, the useful heat absorption rate increases
logarithmically from 0 m to 1.6 m collector length and then there is a marginal increase (from
approximately 1.6 m to 0 m) in heat gain. For a particular collector length, as the flow rate
increases, the amount of heat absorbed by the water also increases. This indicates that higher
flow rates will absorb more heat from the inner surface of the U–tube, thereby reducing the
temperature gradient between U–tube and bulk working fluid, and maintaining constant heat
transfer along the collector length. It is observed from Fig. 3.15a, 3.15c & 3.15e that for a
particular working fluid (water), in order to achieve the high heat gain of about 0.8 kW, the
flow rate should be 0.052 kg/s, 0.02 kg/s and 0.031 kg/s, respectively, for brass, copper and
aluminium. This implies that for a low thermal conductivity material, with an increase in
working fluid flow rate higher heat gain will be attained. From Fig. 3.15a – 3.15b, it is found
that for a particular U–tube material (brass), to achieve heat gain of 0.2 kW, air and water
should operate at a flow rate of 0.011 kg/s and 0.048 kg/s, respectively. This indicates that a
higher specific heat of the fluid, attains the same heat gain at lower fluid flow rate. For a given
collector length, increasing the mass flow from 0.01 kg/s to 0.05 kg/s, improve the useful heat
absorption rate by 81 %, 84 % & 76 % for water and 81 %, 82.5 % & 80 % for air, respectively,
for brass, copper and aluminium as U–tube materials.
(a)
TH-1963_146103001
Page 96
Numerical studies
67
(b)
(c)
(d)
TH-1963_146103001
Page 97
Numerical studies
68
(e)
(f)
Fig. 3.15, Comparison of working fluid heat gain variation along the U–tube collector length for
different mass flow rates: (a) U–tube material – brass and working fluid – water; (b) U–tube
material – brass and working fluid – air; (c) U–tube material – copper and working fluid – water;
(d) U–tube material – copper and working fluid – air; (e) U–tube material – aluminium and
working fluid – water and (f) U–tube material – aluminium and working fluid – air.
TH-1963_146103001
Page 98
Numerical studies
69
d) Effect of working fluid/U–tube material combinations on collector efficiency
Fig. 3.16, Influence of useful heat gained on efficiency of the evacuated tube solar collector.
The influence of working fluid useful/net heat gain (water, air) on the efficiency of the
evacuated tube solar collector for three different U–tube materials (brass, copper and
aluminium) is illustrated in Fig. 3.16. From Fig 3.16, it is observed that for a given working
fluid, the collector efficiency is found to be higher with copper as U–tube material than brass
and aluminium, and water gives better results than air for a particular U–tube material.
e) Influence of filler material on performance of the solar collector
Fig. 3.17, Schematic of evacuated U–tube solar collector with filler material, a) Cross section
and b) Longitudinal section.
(b) (a)
TH-1963_146103001
Page 99
Numerical studies
70
Fig. 3.18, Influence of filler material on evacuated tube solar collector efficiency.
The numerical model developed in Section 2 is used for analysing the performance of the filled
type U–tube solar collector. Only difference between the filled and unfilled type U–tube solar
collector is filling of filler material (graphite/aluminium oxide/magnesium oxide) instead of air
(unfilled) between the U–tube (Fig. 3.17). Using the surface properties and dimensions of
evacuated collector model – A (Gao et al. 2014) listed in table 3.5, a parametric investigation
on the influence of a filler material between the U–tube and the absorber surface (copper fin
surface) has been carried out (Fig. 3.17). Filler materials used for performance improvement
are magnesium oxide, aluminium oxide and graphite. As the thermal conductivity of air filled
space is very low (0.03 W/m-K), the performance of evacuated tube collector filled with high
thermal conductivity powders such as aluminium oxide, magnesium oxide and graphite (30
W/m-K, 60 W/m-K and 168 W/m-K) is expected to be better (Young, 1992). Predicted results
are presented in Fig. 3.18. It is observed that the efficiency with graphite filler material is higher
compared to magnesium oxide, aluminium oxide and no filler material. This happens because
by employing filler material, the heat transfer due to conduction from inner glass surface to the
U–tube increases because of high thermal conductivity of the filler material compared to air
(unfilled). As a consequence, the thermal resistance between the inner glass tube and the fin
decreases and the useful heat gained by the working fluid due to convective heat transfer from
the filled – type U–tube to the working fluid increases. Thus, employing filler material will
enhance the heat transfer from inner glass tube surface to the U–tube and improves the
TH-1963_146103001
Page 100
Numerical studies
71
performance of the evacuated U–tube solar collector. It is also observed that at normalized heat
gain [(Tm – Tamb)/ζ], the graphite filler yields 7.8 %, 12.3 % and 15.3 % higher efficiency than
the magnesium oxide filler, the aluminium oxide filler and the case of no filler (air filled space).
From Fig. 3.18, it is concluded that employing filler material will enhance the heat transfer
from inner glass tube surface to the U–tube and improve the performance of the evacuated U–
tube solar collector.
3.3 Summary
3.3.1 Liquid desiccant dehumidifier/regenerator
A numerical model is developed for analyzing the heat and mass transfer processes occurring
along the counter-flow packed tower. For investigating the performances of dehumidifier and
regenerator, expressions for outlet parameters are derived in terms of known inlet and thermo
– physical parameters. A backtracking algorithm is proposed for simulating the developed
model. The predicted data for the outlet and performance parameters showed good agreement
with the experimental data reported in the literature. With the proposed model, variation of
operating parameters and evaporation/condensation rate along the height of the counter-flow
packed tower (dehumidifier/regenerator) are studied in detail. Distribution contour are
predicted for analyzing the heat and mass transfer processes along the height of the packed
tower and found that evaporation/condensation rate decreases along the air flow direction.
3.3.2 Evacuated U – tube solar collector
A profound numerical analysis on thermal processes occurring in an evacuated U–tube solar
collector is carried out using a 3D numerical model based on finite element method. The
performance characteristics of the solar collector, viz. outlet temperature of the working fluid,
efficiency and useful heat rate of the collector, predicted from the numerical model showed
good agreement with the experimental data available in the literature. It is found that the
average solar irradiance has a significant effect on the useful heat gained by the working fluid
and an insignificant effect on the efficiency of the solar collector. By employing three different
U–tube materials (aluminium, copper and brass), two different working fluids (air and water)
and three different filler materials (graphite, magnesium oxide and aluminium oxide), the
thermal performance of the evacuated tube solar collector is investigated theoretically.
TH-1963_146103001
Page 101
TH-1963_146103001
Page 102
Experimental studies
73
CHAPTER 4
EXPERIMENTAL STUDIES
In this chapter, the experimental studies on fabricated liquid desiccant
dehumidification/regeneration system and evacuated U – tube solar collector system are
presented. The major objectives of this chapter are,
Experimentally studying the performance of dehumidification/regeneration system.
Developing correlations for analysing vapour transfer along the packed chamber.
Experimentally investigating the performance of evacuated U – tube solar collector system.
Defining working fluid transition time for an evacuated U – tube solar collector.
4.1 Experimental studies on liquid desiccant dehumidification/regeneration system
4.1.1 Details of experimental setup and test procedure
The schematic and pictorial views of the fabricated experimental setup of the counter – flow
adiabatic liquid desiccant dehumidification/regeneration system is shown in Fig. 4.1a, 4.1b and
4.1c. The major components of these systems are packed tower, solution tank, collection tank,
centrifugal pump and centrifugal blower (Figs. 4.1a – 4.1c). The ambient air is supplied into
the packed tower using a centrifugal air blower of capacity 0.75 kW (Static pressure of the
blower: 0.73 kPa). In the counter-flow adiabatic packed tower (dehumidifier/regenerator),
Celdek structured packing made up of perforated polypropylene plastic sheets, having a
specific surface area of 179 m2/m3 is used. The flute height of the packing material is 1±0.05
TH-1963_146103001
Page 103
Experimental studies
74
cm (Fig. 4.1d). The overall length, width and height of the structured packing are about 0.6 m,
0.6 m and 0.75 m, respectively (Table 4.1). The packed tower consists of four chambers such
as solution spray chamber, structured packing chamber, air blown chamber and solution
collection chamber (shown in Fig. 4.1f) and the whole packed tower is made up of stainless
steel.
In the current experimental study, LiCl is used as a desiccant material. The fresh unused
desiccant solution is stored in a tank and the temperature of the solution is either heated to a
required temperature using a submerged stainless steel coil (during regeneration experiments
(Fig. 4.1b)) or cooled below ambient temperature by using external cooling bath (during
dehumidification experiments (Fig. 4.1a)). Distilled water is used for preparing the solution.
An anti – corrosive centrifugal pump of capacity 0.75 kW is used for pumping the desiccant
solution into the packed tower (Fig. 4.1a and 4.1b). From the liquid desiccant storage tank to
the packed tower, the solution flows through a 2.54 cm diameter stainless steel pipe. The
incoming desiccant solution from the storage tank is sprayed across the structured packing
chamber through three evenly distributed stainless steel pipes of diameter 1.27 cm and each
pipe consists of five spray nozzles of 0.4mm dia. (Fig. 4.1e). The diluted/concentrated
desiccant solution that comes out from the packed tower is collected in a collection tank during
dehumidification/regeneration experiments. Various components, dimensions and
specifications of the liquid desiccant dehumidification/regeneration system are given in Table
4.1.
Table 4.1, Components, dimensions and specifications of the liquid desiccant
dehumidification/regeneration system.
Liquid desiccant Lithium chloride solution
Packing length (m) 0.6
Packing width (m) 0.6
Packing height (m) 0.75
Specific surface area (m2/m3) 179
Type of packing material Polypropylene plastic sheets
Anti-corrosive pump capacity (kW) 0.75 (nos. 1)
Blower capacity (kW) 0.75 (nos. 1)
Immersion heater capacity (kW) 10 (nos. 5)
TH-1963_146103001
Page 104
Experimental studies
75
When the air and desiccant solution interacts in the structured packing chamber in counter-
flow direction, the heat and mass exchange takes place between the ambient air and the
desiccant solution. During this exchange process, in the dehumidifier, the ambient air desorbs
moisture to the desiccant solution due to vapour pressure difference and releases the sensible
heat due to temperature difference between the process air and the highly concentrated
desiccant solution, chemical heat due to mixing of water vapour and desiccant solution and
latent heat due to condensation of water vapour at the air – desiccant interface. As a result, the
ambient air and the solution are heated up. Whereas, in the regenerator, the ambient air absorbs
water vapour from the desiccant solution due to vapour pressure difference by taking latent
heat due to evaporation of water vapour and chemical heat due to desorption of water vapour
from the desiccant solution. As a result, the solution is cooled and concentrated. Due to sensible
heat exchange between the air and the solution, air is further heated up.
(a) Schematic of liquid desiccant dehumidification system.
TH-1963_146103001
Page 105
Experimental studies
76
(b) Schematic of liquid desiccant regeneration system.
(c) Pictorial view of the fabricated liquid desiccant dehumidification/regeneration system – (1)
Blower, (2) Air flow regulating valve, (3) Packed tower (dehumidifier/regenerator), (4)
Solution flow regulating valve, (5) Non – corrosive pump and (6) Solution tank.
TH-1963_146103001
Page 106
Experimental studies
77
(i) Flute height (ii) Packing material
(d) Structured packing material
(e) Direction of solution spray in solution spray chamber. (f) Chambers in packed tower.
Fig. 4.1, Details of liquid desiccant dehumidification/regeneration system.
For determining dimensions of the structured packing chamber (Fig. 2), the design guidelines
provided by the Elsarrag et al. (2005) was implemented. Initially, the dehumidification system
capacity is decided as 18 kW (5 TR). Based on the system capacity, the air flow rate is estimated
as 2,000 CFM (since, 1 TR = 400 CFM). From the literature, the minimum L/G ratio required
for dehumidification of ambient air/regeneration of liquid desiccant is observed to be 0.8 [47,
49]. Accordingly, the minimum solution flow rate is predicted. On the basis of air and solution
flow rates, the cross sectional area of the structured packing chamber is determined. Using the
heat and mass transfer coefficient correlations from Eqs. 3.10 and 3.17, the optimum height of
the structured packing is obtained as 0.75 m by assuming the moisture and the thermal
effectiveness as 0.65.
The air temperature and relative humidity are measured at the inlet and outlet of the packed
tower using temperature and humidity sensors (accuracy: 0.1 οC, 2% R.H.). The solution
temperatures at the entrance and exit of the packed tower are measured using T – type
thermocouples (accuracy: ±0.1 οC). Data acquisition system (Agilent – 34972A) is used for
TH-1963_146103001
Page 107
Experimental studies
78
acquiring the outputs from thermocouples. Samples of the desiccant solution at the entrance
and exit of the packed tower are collected during the experiments and analysed for estimating
the desiccant concentration using flame photometer (Model: Systronics – 128; ±1% accuracy).
Flow control valves are placed in appropriate places for regulating the desiccant solution and
the ambient air flow (Fig. 4.1a and 4.1b). A portable ultrasonic flow meter (Model: UFM6730;
±1% accuracy) and rotating vane anemometer (Model: TESTO – 490; accuracy: ± 0.1 m/s) are
used for measuring the desiccant solution and the ambient air flow rates, respectively. K – Flex
thermocol sheets are used as an insulation material for insulating the components such as
packed tower, storage tank and stainless steel pipes (connected in between the storage tank and
the packed tower).
4.1.2 Uncertainty in measurement
For evaluating the consistency/accuracy of the dependent parameters, uncertainty analysis is
carried out. The uncertainties involved in the estimation of dependent parameters such as
air/solution enthalpy, evaporation/condensation rate and energy exchange are calculated using
Eq. 4.1 (Kline and Mc – Clintok, 1953). The respective estimated values are ± 4.3 %, ± 3.2 %,
and ± 4.3 %.
2 22 2
1 2 3
1 2 3
.................... n
n
k k k kk k k k
(4.1)
where ‘Ω’ is the dependent parameter and k1, k2, k3 ………………. kn are different independent
parameters (measured quantities). The calculation procedure for uncertainties in the dependent
parameters such as air/solution enthalpy, evaporation/condensation rate and energy exchange
are presented in Appendix B.
4.1.3 Performance characteristics
In the present study, for analysing the performance of the liquid desiccant
dehumidification/regeneration system, the following three performance characteristics are
used,
TH-1963_146103001
Page 108
Experimental studies
79
(a) Overall energy exchange (Qe)
The overall energy exchange between the air and the desiccant solution along the liquid
desiccant dehumidification/regeneration system is estimated as
e s s a aQ m dh m dh (4.2)
Change in air enthalpy: ,a p m adh C dT d (4.2a)
Change in solution enthalpy: ,s p s s satdh C dT d (4.2b)
where ‘ωsat’ is the specific humidity of saturated air which is in thermal equilibrium with the
desiccant solution at the local desiccant temperature and concentration i.e. ωsat (Ts, β) and this
saturated air specific humidity is calculated using desiccant concentration versus temperature
graph available in the literature (Koronaki et al. 2013).
(b) Condensation rate (λc)
The rate of water vapour condensed from the air to the desiccant solution (absorbed by the
desiccant solution from the air) is defined as condensation rate and is given as,
c ad G d (4.3)
: ( )c a i oor G (4.3a)
(c) Evaporation rate (λe)
The rate of water vapour evaporated from the desiccant solution to the ambient air is defined
as evaporation rate and is given as,
e ad G d (4.4)
: ( )e a o ior G (4.4a)
4.1.4 Experimental results and discussion
For a given range of operating parameters (Table 4.2), the influence of relative humidity on
ambient air enthalpy, solution enthalpy, solution concentration and air specific humidity is
investigated experimentally for both dehumidification and regeneration systems and the results
are plotted in Figs. 4.2 and 4.3. In order to analyse the variation of aforementioned parameters
TH-1963_146103001
Page 109
Experimental studies
80
with relative humidity, the ambient condition has been monitored throughout the year in
accordance with humid subtropical climate. Further, percentages of increment/decrement of
aforementioned parameters from the entrance to the exit of the packed tower
(dehumidifier/regenerator) are also shown in Figs. 4.2 and 4.3. In this experimental study, the
air and desiccant solution enthalpies are calculated using Eq. 4.2a and 4.2b. The air inlet
specific humidity is obtained from the psychrometric chart using the air temperature and
relative humidity data measured during the experimental field analysis.
Table 4.2, Operating range and reference values.
Liquid desiccant
dehumidification system
Liquid desiccant
regeneration system
Parameters Range Reference value Range Reference value
Air temperature (οC) 25 – 36 30 25 – 36 30
Air specific humidity (gwv/kgda) 12.7 – 27.4 19.23 12.7 – 27.4 19.23
Ambient air flow rate (kg/m2 – s) 1.32 – 4.51 3.67 1.32 – 4.51 3.67
Solution flow rate (kg/m2 – s) 3.43 – 6.89 3.67 3.43 – 6.89 3.67
Solution temperature (οC) 23 – 31 28 61 – 73 67
Solution concentration (kgLiCl/kgsol.) 31.8 – 38.2 34 31.8 – 38.2 34
L/G ratio 0.76 – 5.22 1 0.76 – 5.22 1
From Figs. 4.2a and 4.3a, it is observed that for a given set of inlet conditions (Table 4.2), with
increase in relative humidity, the outlet ambient air enthalpy decreases during dehumidification
and regeneration processes. This is due to the fact that with increase in relative humidity, the
vapour pressure present in the ambient air increases. This results in high vapour pressure air
and leading to more dissipation of latent heat of condensation into the ambient air. Whereas in
the regeneration system, as the vapour pressure of air is a function of relative humidity, a higher
relative humidity results in lesser amount of moisture absorption from the desiccant solution.
As a consequence, lesser amount of heat interaction occurs at the interface. With increase in
relative humidity from 63% to 87%, the outlet air enthalpy decreases by 3% and 8% in the
dehumidification and regeneration systems, respectively (Figs. 4.2a and 4.3a and Table 4.3).
The reason for higher change in enthalpy of air during the regeneration process is due to higher
temperature difference between the air and the desiccant solution.
TH-1963_146103001
Page 110
Experimental studies
81
Further, from Figs. 4.2a and 4.3a and Table 4.3, it is also observed that with increase in relative
humidity from 63% to 87%, the air enthalpy difference between inlet and exit increases from
1% to 5% along the dehumidifier and decreases from 64.5% to 44.3% along the regenerator.
This happens because with increase in relative humidity, the vapour pressure difference
between the air and the desiccant solution increases in the dehumidifier and decreases in the
regenerator. By which the potential for latent heat exchange increases along the dehumidifier
and decreases along the regenerator.
(a) Air enthalphy (b) Solution enthalpy
(c) Air specific humidity
Fig. 4.2, Influence of relative humidity on operating parameters of liquid desiccant
dehumdifcation system.
For a given relative humidity, the solution enthalpy at the outlet of the dehumidifier increases
and decreases at the outlet of the regenerator (Figs. 4.2b and 4.3b). From Figs. 4.2b and 4.3b,
it is also observed that for a given set of inlet conditions (Table 4.2), as the relative humidity
increases, the relative outlet solution enthalpy increases during dehumidification and
regeneration processes. It is due to the fact that increase with relative humidity, there is a high
TH-1963_146103001
Page 111
Experimental studies
82
potential for moisture desorption from ambient air to desiccant solution whereas in the
regenerator there is a low potential for moisture absorption from desiccant solution to the
ambient air. As a consequence, latent heat transfer at the air–desiccant interface increases in
the dehumidifier and decreases in the regenerator. Thus, with increase in relative humidity from
63% to 87%, the outlet solution enthalpy increases by 15% and 4% in the dehumidification and
regeneration systems, respectively. Further, from Figs. 4.2b and 4.3b and Table 4.3, it is found
that as the relative humidity increases from 63% to 87%, the solution enthalpy difference
increases from 11.1% to 27.9% along the dehumidifier and decreases from 13% to 9.2% along
the regenerator. From this analysis, it is observed that with increase in relative humidity, the
solution enthalpy difference between the inlet and the exit of the packed tower increases during
dehumidification process and decreases during regeneration processes.
(a) Air enthalphy (b) Solution enthalpy
(C) Air specific humidity
Fig. 4.3, Influence of relative humidity on operating parameters of liquid desiccant
regneration system.
TH-1963_146103001
Page 112
Experimental studies
83
For a given relative humidity, the air specific humidity at the outlet of the dehumidifier
decreases whereas at the outlet of the regenerator it increases (Fig. 4.2c and 4.3c). From Figs.
4.2c and 4.3c, it also found that for a given set of inlet conditions (Table 4.2), with increase in
relative humidity, the outlet air specific humidity decreases significantly in the
dehumidification and the regeneration systems as shown in Figs. 4.2c and 4.3c. This happens
because with increase in relative humidity, water vapour present in the ambient air increases.
As a result, desiccant solution absorbs more amount of water vapour from the ambient air in
the dehumidification system, whereas in the regeneration system, the ambient air doesn’t
absorb a higher amount of water vapour from the desiccant solution due to low vapour pressure
difference. From Figs. 4.2c and 4.3c and Table 4.3, it is observed that as the relative humidity
increases from 63% to 87%, the ambient air specific humidity at the outlet decreases by 13%
and 6% in the dehumidification and regeneration systems, respectively.
From Figs. 4.2c and 4.3c and Table 4.3, it is also found that at relative humidity’s of 63%, 67%,
71%, 75%, 79%, 83% and 87%, the percentage decrement in ambient air specific humidity
from the entrance to the exit of the packed tower are 4.6%, 12.3%, 19.1%, 25.2%, 30.7%,
35.6% and 40.1% during dehumidification process whereas during regeneration process, they
are 53.6%, 51.9%, 50.3%, 48.7%, 47.1%, 45.4% and 43.8%, respectively. From this analysis,
it is understood that with increase in relative humidity, the difference in air specific humidity
between the entrance and the exit of the packed tower increases during dehumidification
process and decreases during regeneration process. This is due to the occurrence of high mass
transfer in the dehumidification system and low mass transfer in the regeneration system.
Table 4.3, Influence of relative humidity on operating parameters.
For a given set of inlet conditions (Table 4.2), as the relative humidity increases, there is a
significant decrease in outlet desiccant concentration (increase in conversion of concentrated
TH-1963_146103001
Page 113
Experimental studies
84
to diluted desiccant solution) in the dehumidification system whereas in the regeneration
system, outlet desiccant concentration decreases (decrease in conversion of diluted to
concentrated desiccant solution) with increase in relative humidity (Table 4.3). This is due to
increase in vapour absorption from ambient air to the desiccant solution in the dehumidification
system and due to decrease in vapour absorption from desiccant solution to the ambient air in
the regeneration system. Further, from Table 4.3, it is observed that as the relative humidity
increases, the desiccant concentration difference decreases during dehumidification and
regeneration processes.
4.1.5 Energy exchange
(a) Energy exchange – dehumidification
system.
(b) Energy exchange – regeneration
system.
Fig. 4.4, Influence of relative humidity on energy exchange.
Fig. 4.4 shows the influence of relative humidity on overall energy exchange for the liquid
desiccant dehumidification and regeneration systems. From Fig. 4.4, it is observed that with
increase in relative humidity, the overall energy exchange increases for the dehumidification
and decreases for the regeneration systems. This happens because as the relative humidity
increases, the moisture content present in the ambient air increases and this increase leads to
increase in air vapour pressure. Therefore, there is a high potential for latent heat of
condensation into the ambient air for the dehumidification system whereas in the regeneration
system, there is a low potential for latent heat of evaporation from the desiccant solution to the
ambient air. From Fig. 4, it is also observed that for a given set of inlet conditions (Table 4.2),
with increase in relative humidity from 63% to 87%, the overall energy exchange for the
dehumidification system increases by 80% and for the regeneration system, this energy
exchange decreases by 31%, respectively. From this analysis, it is found that the percentage
TH-1963_146103001
Page 114
Experimental studies
85
contribution in overall energy exchange is high for the latent energy exchange compared to
sensible energy exchange in the dehumidification and regeneration systems.
4.1.6 Experimental Correlation
In the present investigation, experimental correlations are developed for the specific humidity
difference as the function of operating parameters (air and solution inlet temperatures, L/G
ratio, air inlet specific humidity and desiccant inlet concentration) for both liquid desiccant
dehumidification and regeneration systems. In order to develop the experimental correlations,
Design Expert Software (Version 10.0.1) is used. The response surface methodology – central
composite design (RSM – CCD) design matrix is implemented for developing the experimental
correlations. This RSM – CCD technique is chosen because it optimizes the number of
experiments to be carried out.
The operating parameters such as air inlet temperature and specific humidity, L/G ratio and
desiccant inlet temperature and concertation are denoted as X1, X2, X3 and X4 for liquid
desiccant dehumidification system and Y1, Y2, Y3 and Y4 for the liquid desiccant regeneration
system, respectively. The response, specific humidity difference is designated as Δωd (gwv/kgda)
for liquid desiccant dehumidification system and as Δωr (gwv/kgda) for liquid desiccant
regeneration system. After selecting the operating parameters and their ranges (Table 4.2),
based on RSM – CCD technique, the number of runs is designed and corresponding responses
are attained from the series of experiments. The number of runs required (φ) is obtained using
Eq. 4.6.
2 2n
ck k (G. Mehrorang and N. K. Syamak, 2015) (4.6)
where ‘k’ is number of variables and kc is number of centre points
A correlation is formulated by relating the response with the independent parameters using
linear and quadratic terms as follows
Dehumidification system:4 4 3 4
2
1 1 1 1
d o i i ii i ij i j
i i i j i
X X X X
(4.7)
Regeneration system:4 4 3 4
2
1 1 1 1
r o i i ii i ij i j
i i i j i
Y Y YY
(4.7a)
TH-1963_146103001
Page 115
Experimental studies
86
where Xi and Xj and Yi and Yj are the coded values of the parameters for dehumidification and
regeneration systems, respectively and τo, τi, τii and τij are the constant, linear, quadratic and
interaction coefficients, respectively.
In order to establish a correlation between the specific humidity difference and known inlet
parameters for the liquid desiccant dehumidification/regeneration systems, number of
experimental runs needs to be designed. From Eq. 4.6, within the given range of operating
parameters, the number of experimental runs for the liquid desiccant dehumidification and
regeneration systems were estimated as 29 and 35, respectively. Using Eq. 4.7 and 4.7a,
experimental correlations of specific humidity difference for both the dehumidification and the
regeneration systems are formulated. For identifying the significance of the direct and
interactive effects of the operating parameters on the air specific humidity difference, analysis
of variance (ANOVA) is performed for each parameter and a P – value (level of marginal
significance) of less than 0.05 is chosen (B. K. Naik and P. Muthukumar, 2017; G. Mehrorang
and N. K. Syamak, 2015). During this analysis, it is observed that the relationship between the
specific humidity difference and the five operating parameters (air and solution inlet
temperatures, L/G ratio, air inlet specific humidity and desiccant inlet concentration) for liquid
desiccant dehumidification and regeneration systems are best fitted to a linear equation. The
best fit equation and the statistical parameters obtained from the analysis of variance are given
in Tab. 4.4 for both the dehumidification and regeneration systems.
Table 4.4, Coefficients of the specific humidity difference correlation.
System Correlation
Dehumidifier Δωd (gwv/kgda) = τ0 + τ1 X1 + τ2X2 + τ3 X3 + τ4 X4 + τ5 X5
Regenerator Δωr (gwv/kgda) = τ0 + τ1 Y1 + τ2Y2 + τ3 Y3 + τ4 Y4 + τ5 Y5
τ0 τ1 τ2 τ3 τ4 τ5
Δωd -0.18 -8.98×10⁻¹⁷ 1.86 ×10⁻¹⁷ -0.59 0.74 0.16
Δωr -101.72 -6.35×10⁻¹⁶ -1.5×10⁻¹⁶ 2.85 -0.47 -0.89
Statistical parameters
Regression
Statistics
Dehumidifier Regenerator
R2 0.96 0.98
Adjusted R2 0.93 0.94
TH-1963_146103001
Page 116
Experimental studies
87
F significance 1.1×10-38 7.7×10-37
P – value τ0 τ1 τ2 τ3 τ4 τ5
Dehumidifier 0.65 0.0093 0.018 2.7×10⁻³¹ 5.7×10-41 4.9×10⁻¹⁷
Regenerator 1.1×10⁻²¹ 0.041 0.038 5.1×10-39 1.4×10⁻¹³ 3.7×10⁻¹¹
(a) Correlation validation –
dehumidification system
(b) Correlation validation – regeneration
system
(c) Variation of condensation rate with L/G
ratio – dehumidification system
(d) Variation of evaporation rate with L/G
ratio – regeneration system.
Fig. 4.5 – Validation of developed experimental correlation with the experimental results and
the influence of L/G ratio on the variation of condensation and evaporation rates.
It is observed from Tab. 4.4 that the R2 values are 96% and 98% for the dehumidification and
regeneration systems whereas the adjusted R2 values are obtained as 93% and 94%,
respectively. The adjusted R2 value describes the variation obtained by the experimental
correlation after adjusting the number of variables present in it. Further, the value of adjusted
TH-1963_146103001
Page 117
Experimental studies
88
R2 indicates the perfectness of the developed correlation and higher the value of adjusted R2
signifies higher reliability of the developed correlation (B. K. Naik and P. Muthukumar, 2017;
G. Mehrorang and N. K. Syamak, 2015). From Tab. 4.4, by analysing R2, adjusted R2, F –
significance and P – value, it is concluded that the developed correlations of specific humidity
difference for both the liquid desiccant dehumidification and regeneration systems match well
with the experimental data.
For the given range of operating conditions (Tab. 4.2), Fig. 4.5 presents the comparison of
predicted condensation and evaporation rates from the developed correlations with the
experimental data obtained from the field analysis of liquid desiccant dehumidification and
regeneration systems. It is found that the condensation and evaporation rates obtained from the
developed correlation match well with the experimental data with a maximum error of ± 8%.
Fig. 4.5c and 4.5d shows the variation of condensation and evaporation rates with the L/G ratio
for dehumidification and regeneration systems, respectively. It is found that, for a given set of
inlet conditions (Tab. 4.2), with increase in L/G ratio, the condensation and evaporation rates
decrease. This can be explained by the fact that as the L/G ratio increases, the flow rate of the
desiccant solution increases or the flow rate of the ambient air decreases. Therefore, the
potential for mass exchange between the desiccant solution and the ambient air decreases and
as a result, the moisture desorption/absorption rate (evaporation/condensation rate) between
the ambient air and the desiccant solution decreases. From Fig. 4.5c and 4.5d, it is also observed
that with increase in L/G ratio from 0.8 to 3.9, the condensation rate and the evaporation rate
decrease by 51% and 58%, respectively.
4.2 Evacuated U – tube solar collector system
4.2.1 Details of experimental Setup and test procedure
The schematic and pictorial views of the fabricated evacuated U – tube solar collector system
and the details of the experimental setup are presented in Fig. 4.6a and 4.6b. The flow
arrangement between the manifold and the evacuated U – tube solar collector and the cross –
sectional and longitudinal views of the evacuated U – tube are shown in Fig. 4.6c, 4.6d and
4.6e.
The major components of this system are a centrifugal pump of capacity 0.4 kW, thirty
evacuated tubes made up of borosilicate glass, thirty copper U – tubes, three manifolds (M1,
M2 and M3), a storage tank and a collection tank. The manifolds are connected in series and
TH-1963_146103001
Page 118
Experimental studies
89
each manifold is connected with ten evacuated U – tube solar collectors in parallel (copper U
– tube integrated with evacuated tube is connected to a cold and hot header in parallel (Fig.
4.6c)). Each manifold is connected to 10 copper pipes, which are insulated with the K – flex
thermocol for reducing the heat loss to the surroundings.
(a) Evacuated U – tube solar collector system schematic
(b) Evacuated U – tube solar collector system – pictorial view. (c) Evacuated U – tube configuration
inside the manifolds – M1, M2 and M3.
TH-1963_146103001
Page 119
Experimental studies
90
(d) Cross–sectional view of evacuated U – tube. (e) Longitudinal view of evacuated U – tube.
Fig. 4.6, Evacuated U – tube solar collector system.
As shown in Fig. 4.6a, the cold working fluid is supplied from the working fluid storage tank
to the manifold – M1 through a 0.5 HP motor pump. In manifold – M1, the cold working fluid
is circulated from the cold header (Copper tube – 1.27 cm dia.) to the evenly distributed
evacuated copper U – tube solar collectors (Fig. 4.6c). The working fluid flowing inside the
copper U – tube of 0.95 cm dia. absorbs the heat gained by the evacuated tube due to the solar
radiation incident on the upper surface of the evacuated tube (Fig. 4.6d and 4.6e). Thus, the
heated working fluid enters into the hot header (Copper tube – 1.27 cm dia.) located inside the
manifold – M1. For gaining additional heat, the heated working fluid is passed into the
manifolds – M2 and M3 which are connected in series with manifold – M1 (Fig. 4.6a). The hot
working fluid coming out from manifold – M3 is supplied to the collection tank.
The atmospheric temperature and the inlet and outlet temperatures of the working fluid (water)
flowing across each manifold are measured using the T – type thermocouples (accuracy of ±0.2
οC). The solar radiation incident on the evacuated tube solar collector is measured using a
pyranometer (Apogee: Model SP – 110; accuracy of ±5 W/m2). Data acquisition system
(Agilent – 34972A) is used for acquiring the outputs of thermocouples and pyranometer. A
control valve and a turbine type flow meter (Aqua RE: Model H1305726; ±0.2% accuracy) are
fitted before the manifold – M1, for regulating the flow and for monitoring the flow rate. The
solar collector inclination angle is chosen based on maximum solar radiation that can be
incident on the evacuated U – tube solar collector system. According to humid subtropical
climate solar irradiance data, this inclination angle has been fixed at 60ο from the horizontal
plane. The dimensions, thermo – physical properties and the operating range of the evacuated
U – tube solar collector system are listed in Table 4.5.
TH-1963_146103001
Page 120
Experimental studies
91
Table 4.5, Dimensions, surface properties and operating parameters chosen for experimental
and numerical analyses of the evacuated U – tube solar collector.
Table 4.5a, Dimensions Table 4.5b, Thermo – physical properties
Outer glass tube outer diameter (cm) 5.8 Glass tube transmittance (τ) 0.91
Outer glass tube thickness (cm) 0.2 Absorptivity of coating material (α) 0.92
Inner glass tube outer diameter (cm) 4.7 Reflectivity of parabolic reflector (ρ) 0.89
Inner glass tube thickness (cm) 0.2 Water density (g/cm3) 1
Air gap (cm) 0.1 Cp of water (kJ/kg – K) 4.2
U – tube outer diameter (cm) 0.1 Copper conductivity (W/m – K) 307
U – tube inner diameter (cm) 0.95 Table 4.5c, Operating range and reference values
Collector tube length (m) 1.8 Ambient temperature (οC) 26 – 34 31
Header diameter (cm) 1.27 Solar intensity (kW/m2) 0.52 – 1.08 0.8
Header thickness (cm) 0.1 Working fluid inlet temperature (οC) 23 – 38 30
Working fluid Water Working fluid flow rate (U – tube) (ml/s) 6 – 24 15
Type of U – tube material Copper Working fluid flow rate (header) (l/s) 0.06 – 0.24 0.15
Coating material AI-N* Reynolds number (Re) Re < 4000
Hot and cold header’s material Copper
*AI-N: Aluminium Nitrate (coating material)
4.2.2 Uncertainty in measurement
For evaluating the reliability and accuracy of dependent parameters, uncertainty analysis is
carried out. The uncertainties involved in the estimation of dependent parameters such as useful
heat gained per unit area is calculated using Eq. 4.1 (Kline and Mc – Clintok, 1953) and it is
estimated as ± 3.2 %. The calculation procedure for uncertainty in the dependent parameter,
useful heat gained per unit area is presented in Appendix B.
4.2.3. Thermal modelling
a) Model description
For predicting the variation in U – tube surface temperature and working fluid heat gain rate
along the length of the U – tube, an experimental approach is complicated. Therefore, a
numerical approach is chosen. In this work, a three dimensional numerical model is developed
using COMSOL 5.3a simulation software. Fig. 4.7a shows the cross sectional view of the three
dimensional U – tube solar collector model containing working fluid inside the U – tube. In
TH-1963_146103001
Page 121
Experimental studies
92
this model, copper and water are chosen as the U – tube material and the working fluid,
respectively. The surface properties and dimensions taken for designing the U – tube model
are specified in Table 4.5a and 4.5b. As the proposed U – tube collector operates below 200
°C, the material properties are assumed to be constant. The following assumptions are made to
simplify the current numerical analysis.
Working fluid is incompressible and Newtonian.
Initially, U – tube collector surface is at uniform temperature throughout its length.
Buoyancy effect is quantified using the Boussinesq approximation.
In between the evacuated tube and the U – tube, heat transferred by the process air is
negligible.
b) Governing equations
The continuity and Naiver – Stokes momentum equations are solved simultaneously for
simulating the behaviour of working fluid flowing inside the U – tube (Eqs. 4.9 and 4.10). The
velocity field obtained from Eqs. 4.9 and 4.10 is used for solving the convective heat transfer
taking place from U – tube wall surface to the working fluid (Eq. 4.11). The continuity,
momentum and energy equations are solved using GRMS solver. The simulations are carried
out with a time step of 0.1 s.
Continuity equation:
0wfV
(4.9)
Momentum equation:
2 1.
wf
wf
wf wf T ambV P gV
V V T Tt
(4.10)
Energy equation:
2
, , .p wf p wf wf
TC C V T k T
t
(4.11)
where ρ, Vwf, and Cp,wf are the density (kg/m3), velocity (m/s) and specific heat (kJ/kg – K) of
the working fluid and k is the thermal conductivity (kW/m – K) of the U – tube material. The
elaborative derivation of the developed model is presented in Appendix A.
TH-1963_146103001
Page 122
Experimental studies
93
a) Boussinesq approximation
In buoyancy – driven flows, Boussinesq approximation model is used instead of variation of
properties with temperature model (VPT) because it converges faster. Density term is treated
as constant in all the governing equations expect for buoyancy term in momentum equation
(Eq. 4.10). Also, this approximation couples the temperature and flow fields in the momentum
equation (Ayyala et al. 2015). Boussinesq approximation considered in this model is given by
( )T T T (4.12)
where ‘ρ’ is the density of the flow, T is the operating temperature and βT is the thermal
expansion coefficient (0.000206 (1/K)) (Ayyala et al. 2015).
c) Initial and Boundary conditions
Initially there is no flow of working fluid inside the U – tube and all the domains (U – tube
and working fluid) are specified at a constant temperature of Tintial. At any time t > 0, the
inlet of the fluid flow is specified as Twf,i (Tintial = Twf,i) and fluid flow velocity is maintained
constant.
The working fluid flow rate (ṁ) and the atmospheric pressure (P = Patm =101.3 kPa) are
imposed as the boundary conditions at the entrance and exit of the U – tube, respectively.
No slip boundary condition between the U – tube material and the working fluid.
Constant heat flux along the upper surface of the U – tube i.e. ζ = τg,oτg,iαcI.
where ζ is the effective heat absorbed from the evacuated tube (kW/m2), τg,o and τg,i are the
transmissivity of the outer and inner glass surface, respectively, I is the solar intensity and
αc is the absorptivity of the coating material.
TH-1963_146103001
Page 123
Experimental studies
94
4.2.4 Mesh generation and Grid independence test
a) Mesh generation
(a) U – tube solar collector model.
(b) Mesh generated at the inlet and outlet of
the U – tube.
(c) Mesh generated at the U – bend.
Fig. 4.7, Details of U – tube solar collector module.
The domains and boundaries of the U – tube are meshed using free unstructured tetragonal
and triangular meshes. These type of meshes are chosen to ensure the discretization of
relatively smaller sections of the U – tube i.e. the entrance and the exit of the U – tube (Fig.
4.7b).
Table 4.6, Grid size and number of mesh elements for evacuated U – tube models.
Sl.
No.
Component Grid size (mm)
Number of mesh elements
U – tube material
(copper)
Working fluid
(water)
Min Max Min Max
1 U – tube solar
collector
1.31
5.63
0.50
2.65
623,127
TH-1963_146103001
Page 124
Experimental studies
95
Finer mesh sizes are applied at working fluid inlet/outlet, along the working fluid boundary
layer and across the ‘U’ bend (Fig. 4.7c). The distribution of elements depending upon the
mesh generation is given in Table 4.6.
b) Grid independence test
Simulations with different mesh element sizes were performed for testing the dependency of
numerical results on the mesh element size. Fig. 4.8, shows the surface temperature variation
of U – tube solar collector module with different no. of mesh elements viz. 867,891, 623,127
and 440,634 elements. Convergence issues were found for the developed model with mesh
elements less than 440,634. It can be observed from Fig. 4.8 that the numerical simulation
demands more number of mesh elements, due to the free convective movement of the working
fluid. For all the cases of grid independence test, initially all the domains are specified at Tintial
of 316 K and at any time t > 0, the working fluid flows at 15 ml/s with an inlet temperature of
31 °C. Also, a constant heat flux of 0.8 kW/m2 has been imposed at the upper surface of the U
– tube. From Fig. 4.8, it is noticed that the model with 623,127 elements is found to be grid
independent for the U – tube solar collector module.
Fig. 4.8, Grid independence test for U – tube solar collector module.
(Note: λt = working fluid transition time)
TH-1963_146103001
Page 125
Experimental studies
96
4.2.5 Performance characteristics
a) Instantaneous heat gain (Qi)
For a particular operating and ambient conditions, the instantaneous heat gained by the working
fluid along the length of the U – tube from the U – tube wall surface is indicated as
instantaneous heat gain and is formulated as
, , ,( ( ) )i wf p wf wf l wf iQ m c T l T (4.13)
b) Useful heat flux (Quh)
For a given ambient and operating conditions, the useful heat absorbed by the working fluid
per unit area from a U – tube wall surface is indicated as useful heat flux and it is expressed as
, , ,( )uh wf wf p wf wf o wf iQ v c T T (4.14)
4.2.6 Model validation
Fig. 4.9a, Comparison of model predictions with the experimental data for working fluid
inlet and outlet temperature difference along the manifolds M1, M2 and M3.
TH-1963_146103001
Page 126
Experimental studies
97
Fig. 4.9b, Comparison of model predictions with the experimental data reported in the
literature (Liangdong et al. 2010; Liang et al. 2011) for the working fluid temperature
difference along the U – tube.
In order to ensure the consistency of the developed numerical model, validation with the real
– time experimental data is essential. Therefore, the experimental results obtained for the
working fluid inlet and outlet temperature difference along the manifolds M1, M2 and M3 of
the evacuated U – tube solar collector system and the useful heat gained by the working fluid
along the evacuated U – tube solar collector are compared with the numerical predictions
obtained from the developed model (Figs. 4.9 – 4.11). While predicting the working fluid outlet
temperature across each manifold, it is assumed that the working fluid inlet and exit
temperatures in each manifold (M1/M2/M3) is equal to the inlet and exit temperatures of the U
– tube (since manifolds are connected in series and each manifold is integrated with ten
evacuated U – tubes in parallel). Further, to predict the working fluid outlet temperatures at the
manifolds – M2 and M3, the predicted outlet temperatures attained at the manifolds – M1 and
M2 are taken as the inlet temperatures, respectively. From Fig. 4.9, it is observed that for a
given range of operating conditions (Table 4.5c), the experimental values of working fluid
temperature difference between the inlet and exit of each manifold (M1, M2 and M3) are in
good agreement with the numerical values obtained from the simulated results and they match
within ±0.4 οC. Further, the numerical results obtained from the developed model for the
working fluid temperature difference between the inlet and the exit of the U – tube (∆Tu) are
validated with the experimental data reported in the literature (Liangdong et al. 2010; Liang et
TH-1963_146103001
Page 127
Experimental studies
98
al. 2011) as shown in Fig. 4.9b. From this figure, it is found that the developed model is in
good agreement with the experimental data available in the literature and they match within
±0.5 οC. During this validation analysis, the dimensions, surface properties and inlet parameters
of the U – tube solar collector are taken from Liangdong et al. (2010) and Liang et al. (2011),
respectively.
a) Useful heat flux for an evacuated U – tube solar collector
(a) Influence of solar intesity on useful
heat flux.
(b) Influence of working fluid inlet
temperature on useful heat flux.
(c) Influence of working fluid flow rate
on useful heat flux.
(d) Influence of ambient temperature on
useful heat flux.
Fig. 4.10, Comparison of experimental data with the developed numerical model predictions
and influences of operating parameters on useful heat flux.
In Fig. 4.10a – 4.10d, the experimental results of useful heat flux (useful heat per unit area)
attained by the working fluid from an evacuated U – tube solar collector are compared with the
results obtained from the numerical model. From Fig. 4.10a, it is observed that the useful heat
gained by the working fluid per unit area increases with increasing solar intensity incident on
TH-1963_146103001
Page 128
Experimental studies
99
the evacuated U – tube solar collector. This is due to the fact that increase in solar intensities,
the potential for heat exchange from the evacuated U – tube to the working fluid is high,
resulting in higher working fluid heat gain. Increasing in solar intensity from 0.72 kW/m2 to
0.88 kW/m2 increases the useful heat flux by 66%.
As illustrated in Fig. 4.10b, the useful heat gained by the working fluid per unit area decreases
with increase in working fluid inlet temperature. This can be explained by the fact that the heat
transfer from the evacuated U – tube to the working fluid depends upon the temperature
difference between the absorber tube and the working fluid and higher the temperature
difference, higher will be the useful heat gained by the working fluid. Increasing the working
fluid inlet temperature from 23 οC to 38 οC, the useful heat flux gets decreased by 33%. In Fig.
4.10c, it is observed that the working fluid heat gain per unit area increases significantly with
increase in working fluid flow rate from 6 ml/s to 24 ml/s. It happens because with increase in
flow rate, the heat transfer rate from the absorber tube to the working fluid increases and the
temperature difference between the absorber tube and the working fluid decreases. Thus, the
useful heat gained by the working fluid per unit area increases significantly. From Fig. 4.10d,
it is observed that with increase in ambient temperature from 27 οC to 31 οC, the useful heat
flux hardly increases only by 4%. From this analysis, it is realized that the influence of ambient
temperature doesn’t have significant effect on useful energy gained by the working fluid per
unit area.
It is concluded from Fig. 4.10 that for a given range of operating parameters and ambient
temperatures (Table 4.5c), solar intensity and working fluid inlet temperature and flow rate
have significant effect on useful heat gained by the working fluid. Further, it is also concluded
that proposed numerical model is well tested and also reliable for predicting the performance
of an evacuated U – tube solar collector.
b) Working fluid temperature difference along the manifolds – M1, M2 and M3
With reference to the results presented in Fig. 4.11a – 4.11c, it is observed that for a given
range of operating parameters (Table 4.5c), measured working fluid inlet and outlet
temperature difference along the manifolds M1, M2 and M3 match well with the numerically
predicted values. Fig. 4.11a – 4.11c also shows the variations of working fluid temperature
difference between the inlet temperature at manifold M1 and exit temperatures at manifolds
M1, M2 and M3 for different working fluid flow rates, solar intensities and working fluid inlet
TH-1963_146103001
Page 129
Experimental studies
100
temperatures. From Fig. 4.11a, it is seen that for a given set of inlet condition, with increase in
working fluid flow rate, the temperature difference between the inlet temperature at manifold
M1 and exit temperatures at manifolds M1, M2 and M3 decreases significantly. This is due to
fact that with increase in working fluid flow rate improves the heat transfer rate from the U –
tube surface to the working fluid and subsequently decrease U – tube surface temperature and
inner glass absorber surface temperature. As a result, the working fluid outlet temperature
decreases with increase in flow rate. It is also observed that with increase in flow rate from
0.06 l/s to 0.24 l/s, the temperature difference between the working fluid inlet temperature at
manifold M1 and exit temperatures at manifolds M1, M2 and M3 reduces by 3.2 οC, 6.7 οC and
11.5 οC, respectively.
In Fig. 4.11b, it is seen that for a given set of inlet condition, higher solar intensities result in
higher temperature differences along the manifolds M1, M2 and M3. This happens because as
the solar intensity increases, the heat transfer rate increases from outer glass surface to the U –
tube. As a consequence, there will be higher rate of convective heat transfer between the U –
tube and the working fluid. It is also found that as the solar intensity increases from 0.74 kW/m2
to 0.82 kW/m2, the temperature difference between the working fluid inlet temperature at
manifold M1 and exit temperatures at manifolds M1, M2 and M3 is raised by 2.8 οC, 4.2 οC and
7.6 οC, respectively. This indicates that with increase in manifolds connected in series will
enhance the working fluid exit temperature at higher solar intensities than at lower solar
intensities.
(a) Variation of temperature difference with working fluid flow rate.
TH-1963_146103001
Page 130
Experimental studies
101
(b) Variation of temperature difference with solar intensity.
(c) Variation of temperature difference with working fluid inlet temperature.
Fig. 4.11, Numerical model validation and the variation of working fluid temperature
difference along the manifolds M1, M2 and M3 for a given range of operating parameters
(Table 4.5c).
TH-1963_146103001
Page 131
Experimental studies
102
For a given set of inlet conditions, the variation in temperature difference along the manifolds
M1, M2 and M3 decrease with increase in working fluid inlet temperature as shown in Fig.
4.11c. This is due to decrease in overall heat transfer rate between the absorber surface and the
working fluid with raise in working fluid inlet temperature. From Fig. 4.11c, it is also observed
that an increase in working fluid inlet temperature from 23 οC to 38 οC, the temperature
differences between the working fluid inlet temperature at manifold M1 and exit temperatures
at manifolds M1, M2 and M3 reduces by 1 οC, 2.1 οC and 4.2 οC, respectively. This analysis
illustrates that an increase in manifolds connected in series improves the heat transfer rate at
lower working fluid inlet temperature more than at higher working fluid inlet temperature.
From Fig. 4.11, it is concluded that the manifolds connected in series give better performance
at higher solar intensities and lower working fluid flow rates and inlet temperatures. Further, it
is also observed that the developed numerical model is well suited for analysing the
performance of any evacuated U – tube solar collector systems (manifolds connected in series
and a manifold consisting of ten evacuated U – tubes integrated in parallel).
4.2.7 Working fluid transition time for an evacuated U – tube solar collector
The working fluid transition time (λt) is defined as the time taken by a working fluid to attain
a steady state condition when it is passed through an evacuated U – tube. It is measured when
the change in working fluid inlet temperature and flow rate, change in solar intensity and
ambient temperature occurs. It can be expressed as
, ,, ,t amb wf i wff T I T m (4.15)
Working fluid temperature takes some time to reach steady state value due to throttling of a
valve for attaining a required flow rate, sudden loss of power in the pump, variation in speed
of an operating pump and sudden change in ambient temperature. Here, rather than measuring
the working fluid transition time of whole solar collector system, individual evacuated U – tube
solar collector is measured i.e. the transition time for an evacuated U – tube solar collector is
measured/predicted instead of working fluid transition time at the exit of the manifold – M3.
a) Empirical correlation for working fluid transition time
For deriving an empirical correlation for working fluid transition time in terms ambient
temperature, solar intensity and working fluid inlet temperature and flow rate, Design Expert
software (version 10.0.1) is used. The response surface methodology – Box Behnken Design
TH-1963_146103001
Page 132
Experimental studies
103
technique (RSM – BBD) is implemented for developing the correlation. The advantage of this
technique lies in its practical application.
The four selected operating parameters/independent parameters such as ambient temperature,
solar intensity and working fluid inlet temperature and flow rate are defined as X1, X2, X3 and
X4, respectively. The response, working fluid transition time is denoted as λt. After the selection
of operating parameters and their ranges (Table 4.5c), based on BBD technique, the number of
runs is designed and the corresponding response is obtained from experiments. The number of
runs (ѱ) is calculated using Eq. 4.16 (Mehrorang and Syamak, 2015).
2 2n
cn n (4.16)
where n is number of variables and nc is the number of center points
To formulate a correlation, the response is related to the independent parameters by linear and
quadratic terms as follows (Mehrorang and Syamak, 2015);
4 4 3 4
2
1 1 1 1
t o i i ii i ij i j
i i i j i
X X X X
(4.17)
where Xi and Xj are the coded values of the parameters and δo, δi, δii and δij are the constants,
linear, quadratic and interaction coefficients, respectively.
Using Eq. 4.16, thirty-one experimental runs were performed to predict the working fluid
transition time (λt) in an evacuated U – tube solar collector (Table 4.5c). Using Eq. 4.17,
correlation is formulated between the working fluid transition time and the independent
parameters. In order to identify the significance of direct and interactive effects of the
independent parameters on working fluid transition time, analysis of variance (ANOVA) was
implemented for each parameter (P – value less than 0.05 is considered). During this analysis,
it is observed that the relationship between the working fluid transition time and the
independent parameters is best fitted to a first order polynomial equation. The best fit equation
and the statistical information about ANOVA are given in Table 4.7.
Table 4.7, Coefficients of the working fluid transition time correlation.
Correlation
Evacuated U – tube solar collector λt = δo+ δ1X1 + δ2X2 + δ3X3+ δ4X4
δo δ1 δ2 δ3 δ4
TH-1963_146103001
Page 133
Experimental studies
104
λt (s) -172.8 -3.24 × 10⁻¹⁵ 535.02 -3.82 -1.11 × 10⁻¹⁶
Statistical information
Regression Statistics
R2 0.93
Adjusted R2 0.89
F – value 161.47
F – significance 2.2 × 10⁻¹⁴
P – value δo δ1 δ2 δ3 δ4
0.00077 0.013 5 ×10-16 1.3×10⁻⁵ 2.5×10⁻⁷
It is observed from Tab. 4 that the R2 and the adjusted R2 values are 93 % and 89 % for the
developed correlation. The adjusted R2 value determines the variation obtained by the
correlation after adjusting number of variables present in it. High value of adjusted R2 indicates
the goodness of the developed correlation (Mehrorang and Syamak, 2015). From the P – value
listed in Table 4.7 for each independent parameter, it is observed that the ambient temperature
has insignificant effect on the working fluid transition time. This is because the P – value close
to 0.05 is the ambient temperature i.e. the independent parameter which is close to the P – value
= 0.05 will have most insignificant effect on the dependent parameter (working fluid transition
time) (Mehrorang and Syamak, 2015). Therefore, the ambient temperature has very less
influence on the working fluid transition time.
For a given range of operating and ambient conditions, the working fluid transition time
predicted from the developed empirical correlation and those obtained from the experiments
are compared in Fig. 4.12. It is found that the developed empirical correlation has a good
agreement with the experimental data with a maximum error of ±12.7 %. Here, the
experimental working fluid transition time was measured till the outlet temperature of the
evacuated U – tube reached the steady state. As the evacuated U – tube is connected in parallel
to a manifold – M1, the working fluid inlet and outlet temperatures measured at the entrance
and exit of the manifold – M1 is considered as the inlet and outlet temperatures of the evacuated
U – tube (Fig. 4.6a).
TH-1963_146103001
Page 134
Experimental studies
105
Fig. 4.12, Comparison of empirical correlation with the experimental data for the working
fluid transition time (λt) in an evacuated U – tube solar collector.
b) Case study
An experimental case study is chosen for validating the developed numerical model for
analysing the working fluid transition time condition. The inlet condition of the operating
parameters listed in Table 4.8 remains unchanged during the test period. From Fig. 4.13a, it is
observed that the time taken for a working fluid to attain steady state condition is about 144 s
and the change in the working fluid outlet temperature reduces significantly from 315.8 K (λt
= 1 s) to 309 K (λt = 144 s) and attains a steady state condition at 309 K (λt = 144 s). Further,
it is also observed from Fig. 4.13a that for a given inlet condition, the temperature difference
between the working fluid inlet and outlet temperatures after reaching steady state condition is
about 4.9 K. From Fig. 4.13a and Tab. 4.8, it is found that the numerically predicted working
fluid outlet temperature variation attains a closer agreement with the experimental result.
Table 4.8, Case study chosen for analysing the working fluid transition time
Inlet parameters
Outlet parameter (at
steady state
condition)
Working fluid transition
state temperature difference
(unsteady state to steady
state)
Working fluid
transition time
Tamb Twf,i ṁwf I Twf,o Twf,o λt
(°C) (°C) (ml/s) (kW/m2) (°C) (°C) (s)
TH-1963_146103001
Page 135
Experimental studies
106
Exp. Num. Diff. Exp. Num. Exp. Num.
30 31 15 0.8 35.5 35.9 0.4 42.8 ± 0.2 °C –
35.5 ± 0.2 °C
(ΔT = 7.3)
43 – 35.9
(ΔT = 7.1)
147 144
Fig. 4.13b shows the contours of U – tube surface temperature for the inlet condition presented
in Table 4.8. This U – tube surface temperature plot variation is difficult to obtain in a practical
situation. Therefore, a numerical simulation is carried out using COMSOL 5.3a as a simulation
software for analysing the surface temperature variation from initial condition to the steady
state condition (working fluid transition time). From Fig. 4.13b, it is observed that initially
there is no fluid flow along the U – tube (λt = 0 s). At time λt = 1 s, the working fluid starts
flowing through the U – tube and the decrement in surface temperature of the U – tube is faster
till the transition time (λt) reaches 27 s and then, the time taken to reach steady state condition
increases significantly. This happens because the temperature difference between the working
fluid and the U – tube surface is high initially (λt = 0 s) but as the time progresses, the
temperature difference between them reduces. Therefore, the time taken to reach steady state
condition increases with decrease in surface temperature and attains steady state condition at
λt = 144 s.
(a) Varition of working fluid temperature during transition time.
TH-1963_146103001
Page 136
Experimental studies
107
(b) U – tube surface temperature variation countours during working fluid transition time.
Fig. 4.13, Numerical analysis for the case study.
c) Heat transfer and fluid flow characteristics after attaining steady state condition
(a) Temperature variation contour plot. (b) Variation of instantaneous heat gain along
the length of the collector.
Fig. 4.14, Working fluid heat transfer characteristic variation along the length of the U – tube
after attaining the steady state condition.
TH-1963_146103001
Page 137
Experimental studies
108
For the given inlet condition (Table 4.8), Fig. 4.14 shows the variation of working fluid
temperature and instantaneous heat gain along the length of the U – tube after attaining steady
state condition. During the real time experimental study, the working fluid temperature
variation and the instantaneous heat gain along the length of the U – tube solar collector are
difficult to measure. Therefore, a numerical analysis is carried out for predicting the
instantaneous heat gain along the length of the U – tube. It is observed from Fig. 4.14 that there
is a significant increase in working fluid temperature and heat gain up to certain collector length
(0 m to approximately 1.8 m). After that there is only a marginal increase in working fluid
temperature and instantaneous heat gain along the U – tube collector length (approximately 1.8
m to 0 m). This happens because from 0 m to 1.8 m collector length, the difference in
temperature and heat transferred from the U – tube inner surface to the working fluid is high.
As the heat absorbed by the working fluid increases, the temperature difference and convective
heat transfer between the U – tube inner surface and the working fluid decrease. Therefore,
there is only a marginal increase in heat gained by the working fluid.
Fig. 4.15, Influence of mass flow rate on the pressure drop in the U – tube.
Since, the flow rate is increased from 6 ml/s to 24 ml/s (Table 4.5c) which is considered to be
forced convection flow through the U – tube, it is important to predict the influence of mass
flow rate on pressure drop by keeping rest of the operating parameters as constant (Fig. 4.15).
It is observed from Fig. 4.15 that with increase in flow rate, pressure drop increases. This
happens because as the flow rate increases, dynamic pressure loss due to change in flow
direction along the ‘U’ bend and frictional loss due to increase in fluid velocity increase. As a
consequence, the pressure drop along the U – tube increases. It is also observed that for a given
range of flow rate variation, the pressure drop variation is negligible because with increase in
TH-1963_146103001
Page 138
Experimental studies
109
flow rate from 6 ml/s to 24 ml/s, the pressure drop hardly increases from 0.26 mbar to 0.74
mbar.
d) Variation of working fluid transition time with operating parameters
Fig. 4.16a-c compares the transition time obtained from developed numerical model with the
developed empirical correlation at different solar intensities, working fluid inlet temperatures
and flow rates. It is observed from Fig. 4.16 that for a given range of operating parameters
(Table 4.5c), the values predicted from the developed empirical correlation match well with
the numerical model and also follows the similar trend. From Fig. 4.16a, it is found that with
increase in solar intensity, the working fluid transition time increases. This happens because as
the solar intensity increases, the convective heat transfer rate between the U – tube surface and
the incoming working fluid increases. Therefore, the time taken for the working fluid to attain
a steady state condition increases and hence, the working fluid transition time increases. From
Fig. 4.16a, it is also found that with increase in solar intensity from 0.85 kW/m2 to 1.05 kW/m2,
the percentage of increment in working fluid transition time is about 82%.
(a) Variation of working fluid transition time
with solar intensity.
(b) Variation of working fluid transition time
with working fluid inlet temperature.
TH-1963_146103001
Page 139
Experimental studies
110
(c) Variation of working fluid transition time with flow rate.
Fig. 4.16, Validation of numerical model with the developed empirical correlation for working
fluid transition time and influences of operating parameters on the variation of working fluid
transition time.
In Fig. 4.16b, it is noticed that the working fluid transition time decreases with increase in
working fluid inlet temperature. This is due to decrease in temperature difference between the
U – tube surface and the incoming working fluid. From Fig. 4.16b, it is also noticed that with
increase in working fluid inlet temperature from 23 οC to 38 οC, the percentage decrement in
working fluid transition time is about 31%. The working fluid transition time decreases with
increase in fluid flow rate as observed in Fig. 4.16c. This indicates that at lower flow rate, the
time taken for heat exchange from inner U – tube surface to the incoming working fluid is high
whereas with increase in flow rate, the time taken for an incoming working fluid to absorb heat
from the U – tube inner surface decreases. Thus, the working fluid transition time decreases
with increase in flow rate. From Fig. 4.16c, it is also observed that with increase in flow rate
from 6 ml/s to 24 ml/s, the percentage of decrement in working fluid transition time is 49%.
Form Fig. 4.16, it is concluded that the sudden change in solar intensity will have a more
significant effect on working fluid transition time than the fluctuation in working fluid flow
rate and inlet temperature.
TH-1963_146103001
Page 140
Experimental studies
111
4.3 Summary
4.3.1 Liquid desiccant dehumidification/regeneration system
An experimental setup of the liquid desiccant dehumidification/regeneration system has been
designed, fabricated and performance-tested using LiCl as a liquid desiccant. The influence of
relative humidity on overall energy exchange, air and desiccant enthalpy differences, air
specific humidity difference and desiccant concentration difference has been analysed for the
liquid desiccant dehumidification/regeneration system. For a given range of operating and
ambient parameters, an experimental correlation for specific humidity difference has been
developed in terms of known inlet parameters for the liquid desiccant dehumidification and
regeneration systems. The developed correlation is compared with the experimental data and
good agreement between them is observed with a maximum error of ±8%. Further, based on
experimental data and developed correlations, the influence of L/G ratio on condensation and
evaporation rates of the liquid desiccant dehumidification and regeneration systems,
respectively, has been studied.
4.3.2 Evacuated U – tube solar collector system
An experimental setup of an evacuated U – tube solar collector system has been designed,
fabricated and performance-tested. A simplified numerical model has been proposed for
predicting the performance of the evacuated U – tube solar collector system. Within the range
of operating parameters, the numerically predicted performance parameters of the solar
collector and solar collector system are in (good) agreement with the experimental data. The
working fluid transition time for an evacuated U – tube solar collector is defined and the
variation of transition time for various operating conditions is analysed experimentally.
Instantaneous heat gain variation along the length of the evacuated U – tube is also investigated
numerically. Based on experimental data, an empirical correlation for working fluid transition
time as a function of ambient temperature, solar intensity, working fluid inlet temperature and
working fluid flow rate is formulated.
TH-1963_146103001
Page 141
TH-1963_146103001
Page 142
Energy and Exergy Analyses
113
CHAPTER – 5
ENERGY AND EXERGY ANALYSES
Energy and exergy analyses plays a vital role in improving the performance of the liquid
desiccant ACS components such as dehumidifier, regenerator and evacuated U – tube solar
collector. Many researchers have investigated the energy and exergy analyses of the liquid
desiccant dehumidifier (Wang et al. 2010; Xiang et al. 2010; Zhang et al. 2012; Zhang et al.
2014; Zhang et al. 2017; L. Zhang et al. 2017). But very few have investigated the energy and
exergy performance of the liquid desiccant regenerator and evacuated U – tube solar collector.
From the literature, it is observed that there is a lack of profound exergy analysis which account
for the irreversibility of heat and mass transfer processes in the liquid desiccant regenerator
and irreversibility of heat transfer process in the evacuated U – tube solar collector. Therefore,
this chapter focuses on deriving the expressions for quantifying the energy exchange and
exergy destruction along the liquid desiccant regenerator and evacuated U – tube solar
collector. The major objectives of the present study are,
To develop energy and exergy analyses for the liquid desiccant regenerator.
To develop empirical correlations for exergy and energy efficiencies of the solar collector.
To quantify the energy and exergy efficiencies of the regenerator and the solar collector.
To propose a simplified approach for exergy analysis of the liquid desiccant.
To investigate exergy performance of the evacuated U – tube bundle connected in series.
TH-1963_146103001
Page 143
Energy and Exergy Analyses
114
5.1 Energy and exergy analysis of liquid desiccant regenerator
5.1.1 Energy analysis model
Schematic of energy exchange that occurs between the ambient air and the desiccant solution
is shown in Fig. 5.1. Following assumptions are made for analysing the transfer processes.
Flow is steady.
Regeneration process is adiabatic.
Thermo – physical properties of the fluids are constant irrespective of temperature.
The overall energy exchange from desiccant solution to the ambient air can be written as
( ) ( )e s s s s s a a a a adQ m h m h dh m h m h dh (5.1)
or : e s s a adQ m dh m dh (5.1a)
a) Air side
The enthalpy on the air side is given by
,( , )a a a p m a ah T C T
(5.2)
where φ is latent heat of vaporization (kJ/kg).
By differentiating Eq. 5.2, the change in air enthalpy is obtained as
,a p m a adh C dT d
(5.3)
b) Liquid desiccant side
The enthalpy on the solution side is given by
,( , )s s s p s s sh T C T
(5.4)
where ωs is the specific humidity of saturated air which is in thermal equilibrium with the
desiccant solution at the local desiccant temperature and concentration i.e. ωs (Ts, β).
‘ωs’ is calculated using following equation
( , )( , ) 0.622
( , )
sat
s ss s sat
atm s s
P TT
P P T
(5.4a)
TH-1963_146103001
Page 144
Energy and Exergy Analyses
115
where ‘Pssat’ denotes the statured vapour pressure at air – desiccant interface and it is the
function of solution temperature and concentration. The specific heat, vapour pressure and
other thermo-physical properties of the liquid desiccant (LiCl–H2O) are obtained from the
literature (M. R. Conde, 2004; Fumo and Goswami, 2002).
(a) Schematic (b) Energy balance
Fig. 5.1, Energy balance along the liquid desiccant regenerator
Differentiating Eq. 5.4;
,s p s s sdh C dT d
(5.5)
Substituting Eq. 5.3 and Eq. 5.5 in Eq. 1a, the final equation is obtained as
, ,e a p m a a s p s s sdQ m C dT d m C dT d
(5.6)
Eq. 6 can be integrated as
, , , ,
, , , ,
, ,
oa o a o s o s oe
ia i a i s i s ie
T TQ
e a p m a a a s p s s s s
T TQ
dQ m C dT m d m C dT m d
(5.7)
TH-1963_146103001
Page 145
Energy and Exergy Analyses
116
After integrating Eq. 5.7, the energy exchange between the air and the desiccant solution along
the regenerator is formulated as (Fig. 5.1b)
, ,( ) ( ) ( ) ( )o i o i i o i o
e a p m a a a a a s p s s s s s sQ m C T T m m C T T m
(5.8)
where ∆Qe = 𝑄𝑒𝑜-𝑄𝑒
𝑖
c) Desorption efficiency
Desorption/energy efficiency of the liquid desiccant regenerator is defined as the ratio of
energy exchanged between the desiccant solution and the air to the energy input and is given
by
ee i
e
Q
Q
(5.9)
where , , ,
i i i i i
e es a el a a p m a a aQ Q Q m C T m
5.1.2 Exergy analysis model
The exergy analysis plays a vital role in the design and development of efficient system as well
as improving the performance of the existing system (Dincer and Rosen, 2007). Therefore, in
the present study, the exergy destruction encountered in the liquid desiccant regenerator is
analyzed for improving the system performance. In this system, there are two fluids i.e.,
desiccant solution and ambient air interacting with each other for regeneration of liquid
desiccant. During this regeneration process, irreversible latent and sensible heats are released
from the liquid desiccant to the ambient air due to water vapour transfer and temperature
difference (Fig. 5.2a). Thus, the irreversible latent and sensible heats with respect to the
reference state is quantified as exergy destruction. For analyzing the exergy destruction,
reference state is chosen based on thermal (temperature) and chemical (specific humidity or
desiccant concentration) equilibriums of the flow streams pertained to the reference
environment.
TH-1963_146103001
Page 146
Energy and Exergy Analyses
117
(a) Exergy destruction process (See Eq.
5.19 )
(b) Qex – h chart
Fig. 5.2, Exergy destruction along the liquid desiccant regenerator.
Fig. 5.2b shows the variations of air and solution exergy flows for a given air and solution
enthalpies along the counter – flow liquid desiccant regenerator. Qex – h chart indicates the
variation of air and desiccant solution exergy destructions with respect to reference
environment and signifies the inflow and outflow of the liquid desiccant and air. Using, Qex –
h chart, the overall exergy destruction in the liquid desiccant regenerator can be obtained.
For analyzing the system (liquid desiccant regenerator) deviation from equilibrium with its
reference environment, exergy destroyed is measured. It is formulated as (Dincer and Rosen,
2007)
( , )ex r gen r genQ T S T S (5.10)
In a liquid desiccant regenerator, exergy of coupled heat and mass transfer processes between
air and desiccant solution is the sum of sensible and latent exergy (i.e. exergy destroyed due to
heat transfer represent the physical/sensible exergy and exergy destroyed due to mass transfer
represent the humid/latent exergy). Thus, Eq. 5.10 can be re-written as
es elex r r
dQ dQQ T T
T T
(5.11)
TH-1963_146103001
Page 147
Energy and Exergy Analyses
118
where Sgen = Sgens+ Sgenl= es eldQ dQ
T T for coupled heat and mass transfer process of the liquid
desiccant regenerator.
As esdQ = s pmd mC dT and eldQ = lmd m d , the exergy destroyed due to sensible
exergy and humid exergy can be formulated as
ex r p
dT dQ T m C
T T
(5.12)
a) Exergy analysis of moist air
The exergy inflow along the air side can be written as
, ,
i ia a
r r
T
i
ex a r a p m
T
dT dQ T m C
T T
(5.13)
After integrating Eq. 5.13, the exergy inflow along the air side is obtained as
, , *ln
i ii a a rex a r a p m
r a
TQ T m C
T T
(5.14)
where *
aT is the average of air temperature along the height of the regenerator
Similarly, the exergy outflow along the air side is derived as
, , *ln
o oo a a rex a r a p m
r a
TQ T m C
T T
(5.15)
b) Exergy analysis of desiccant solution
The exergy inflow along the solution side can be written as
, ,
i is s
r r
T
i
ex s r s p s
T
dT dQ T m C
T T
(5.16)
TH-1963_146103001
Page 148
Energy and Exergy Analyses
119
After integrating Eq. 5.16, the exergy inflow along the solution side is obtained as
, , *ln
i ii s s rex s r s p s
r s
TQ T m C
T T
(5.17)
where *
sT is the average of solution temperature along the height of the regenerator
Similarly, the exergy outflow along the solution side is derived as
, , *ln
o oo s s rex s r s p s
r s
TQ T m C
T T
(5.18)
Overall exergy destruction in the liquid desiccant regenerator can be obtained by (see Fig. 5.2b)
i o
exo ex exQ Q Q (5.19)
or: , , , ,
i i o o
exo ex a ex s ex a ex sQ Q Q Q Q (5.19a)
c) Exergy efficiency
Exergy efficiency is the ratio of overall exergy destruction to the inflow exergy. For the liquid
desiccant regenerator, it is defined as
1 exoex i
ex
Q
Q
(5.20)
where , ,
i i i
ex ex a ex sQ Q Q
5.1.3 Validation of developed energy and exergy analyses model
Energy exchange occurred between air and the desiccant solution during desorption of water
vapour from solution to air, i.e. amount of energy transferred to the air side, is equal to the
latent and sensible heat transfers from solution to air. Therefore, a comparison is made between
the energy generated at air side and the energy transferred from solution side for validating the
developed energy and exergy analyses model. From Fig. 5.3, it is found that the energy variance
at solution side (theoretical) holds reasonable agreement with the energy variance at air side
TH-1963_146103001
Page 149
Energy and Exergy Analyses
120
(experimental) for all the inlet conditions listed in Table 5.1a. The mean and maximum
deviations between the experimental and theoretical energy variance of the adiabatic liquid
desiccant regenerator are observed to be ±4.7 % and ±12.3 %, respectively. This deviation is
mainly due to the assumptions made in the developed energy and exergy analyses model and
experimental heat loss and uncertainty.
Fig. 5.3, Energy balance between air and desiccant solution for the experimental data
reported in the literature (Fumo and Goswami, 2002).
Table 5.1a, Desorption and exergy efficiencies of the liquid desiccant regenerator (Fumo and
Goswami, 2002).
Exp. ṁa 𝑇𝑎𝑖 ωi ṁs 𝑇𝑠
𝑖 βi ∆Qe,o ∆Qex,o ηe ηex
no. (kg/s) (°C) (gwv/kgda) (kg/s) (°C) (kgLiCl/kgsol.) (kW) (kW) (%) (%)
1 0.039 30.4 18.3 0.30 65 34 5.72 10.84 53.4 76.2
2 0.052 30.1 18 0.29 65.1 34.1 6.91 11.61 37.6 75.6
3 0.068 29.8 17.7 0.30 65.1 34.5 8.13 13.81 33.8 71.8
4 0.052 35.1 18 0.30 65.1 33.4 6.88 11.59 36.9 72.6
5 0.052 40 17.8 0.30 65 33.6 6.66 10.99 35.1 72.8
6 0.053 30.2 14.3 0.30 65.2 34 7.30 12.55 39.6 71.9
7 0.052 29.4 21 0.30 65.5 33.6 6.59 12.25 35.1 74.9
8 0.052 30.3 18.2 0.24 65.4 34.4 6.50 11.13 34.7 71.6
9 0.052 29.9 18 0.35 65.2 34.3 7.29 14.62 39.5 73.1
10 0.052 30 18.7 0.29 60.3 34.4 5.39 7.88 28.8 79.1
TH-1963_146103001
Page 150
Energy and Exergy Analyses
121
11 0.051 29.7 18.4 0.30 70 34.5 8.99 21.61 49.4 64.7
12 0.052 29.7 17.7 0.30 64.8 32.8 7.04 11.97 38.4 72.0
13 0.052 30.3 18.2 0.30 65 34.9 6.43 12.94 34.3 72.6
5.1.4 Results and discussions
Energy and exergy analyses model developed in the above section is adopted for analyzing the
energy exchange between the desiccant solution and the ambient air and exergy destruction
encountered with respect to the reference environment. The experimental data reported by
Fumo and Goswami (2002) is chosen for energy and exergy analyses of the liquid desiccant
regenerator. In these analyses, the saturated air state of ambient temperature is selected as the
reference state i.e., Tr = 25 °C and ωr = 19.7 gwv/kgda (R.H. =100%). The latent heat of
vaporization (φ) is assumed to be constant at 2346 kJ/kg for a given desiccant temperature and
concentration encountered in the system (Gandhidasan, 2005).
Overall energy and exergy analyses results of the liquid desiccant regenerator are presented in
Table 5.1a. It is observed that overall energy exchanged and exergy destroyed are in the range
of 5 – 9 kW and 8 – 22 kW, respectively. Also, desorption/energy and exergy efficiencies of
the liquid desiccant regenerator are in the range of 28 – 54 % and 64 – 80 %, respectively.
a) Energy and exergy analyses along the height of the liquid desiccant regenerator
For effective heat and mass transfer processes between the ambient air and the desiccant
solution, the vapour pressure difference and temperature difference should be high. This can
be achieved by increasing the desiccant temperature and decreasing the air specific humidity.
Therefore, the desiccant temperature and air specific humidity are varied simultaneously by
keeping the rest of the operating parameters as constant (air and desiccant flow rates, air
temperature and desiccant concentration are kept constant) and analyzed the energy exchange
and exergy destruction along the height of the counter – flow liquid desiccant regenerator.
Based on the aforementioned variation of operating parameters, experimental no. 10 and 6 from
Table 5.1a are taken as inlet condition – I and inlet condition – II for energy and exergy analyses
along the height of the liquid desiccant regenerator. During these analyses, the desiccant
temperature is increased from 60.3 °C (experimental no. 10) to 65.2 °C (experimental no. 6)
and the specific humidity is decreased from 18.7 gwv/kgda (experimental no. 10) to 14.3 gwv/kgda
(experimental no. 6) simultaneously by keeping rest of operating parameters as constant. The
height of the liquid desiccant regenerator is taken as 0.6 m (Fumo and Goswami 2002).
TH-1963_146103001
Page 151
Energy and Exergy Analyses
122
The energy exchange along the height of the counter – flow liquid desiccant regenerator is
estimated by investigating the variation of air and desiccant temperatures, air humidity ratio
and saturated humidity ratio (attained at local desiccant temperature and concentration). From
Fig. 5.4, it is observed that with increase in tower height, the air temperature and the humidity
ratio increase whereas the solution temperature and the saturated humidity ratio decrease in
both the conditions (Inlet condition – I and II). This is due to simultaneous heat and mass
exchange between the air and the desiccant solution along the tower height. It is also observed
from Fig. 5.4 that with increase in height, the solution and air temperature difference and the
difference between the air humidity ratio and saturated humidity ratio decrease. This happens
because of reduction in evaporation process from desiccant solution to the ambient air with
increase in tower height. By comparing inlet condition – I and II (Fig. 5.4a, 5.4b 5.4c, and
5.4d), it is found that the evaporation process in case of inlet condition – II is high compared
to inlet condition – I. From Fig. 5.4, it is noticed that, with further increase in tower height,
energy exchange along the liquid desiccant regenerator will be higher in case of condition – II
compared to condition – I.
(a) Inlet condition – I (b) Inlet condition – I
TH-1963_146103001
Page 152
Energy and Exergy Analyses
123
(c) Inlet condition – II (d) Inlet condition – II
Fig. 5.4, Variation of air and solution temperatures and specific humidity of the air along
the tower height.
It is observed from Fig. 5.4a and 5.4c that with increase in distance along the height of the
packed tower, the variation in air and solution temperature is about 25.8 °C and 6.1 °C for inlet
condition – I whereas for inlet condition – II this difference is observed to be 27.4 °C and 8 °C,
respectively. It is found from Fig. 5.4b and 5.4d that for inlet condition – I and II, with increase
in tower distance along the height of the packed tower, the percentage increment in air specific
humidity is about 58 % and 72 % whereas for saturated humidity ratio, the percentage
decrement is found to be 29% and 36%, respectively.
(a) Inlet condition – I (b) Inlet condition – I
TH-1963_146103001
Page 153
Energy and Exergy Analyses
124
(c) Inlet condition – II (d) Inlet condition – II
Fig. 5.5, Exergy losses along the tower height: (a) and (c) exergy losses due to sensible heat
transfer for inlet condition – I and II and (b) and (d) exergy losses due to latent heat transfer
for inlet condition – I and II, respectively.
Exergy destruction due to sensible and latent heat transfer processes along the tower height for
the ambient air and the desiccant solution of both the inlet conditions are shown in Fig. 5.5. It
is observed from Fig. 5.5 that with increase in tower height, the exergy losses associated with
sensible and latent heat transfer processes for air side increases whereas for solution side, it
decreases. This happens because with increase in tower height, the air vapour pressure and
temperature increase and the desiccant vapour pressure and temperature decrease which in turn
increases the exergy destruction along the air side and decreases the exergy destruction along
the solution side with respect to the reference state. It is observed from Fig. 5.5a and 5.5c that,
for inlet condition – I and inlet condition – II, with increase in tower distance along the height
of the packed tower, the percentage of increment in exergy destruction associated with sensible
heat transfer for air side is observed to be 16% and 19% whereas the percentage of decrement
in exergy destruction along the solution side is observed to be 71% and 69%, respectively. With
increase in distance along the height of the packed tower, the exergy destruction due to latent
heat is observed to increase by 57 % and 63 % along the air side and it is observed to decrease
by 116% and 104% along the solution side for inlet conditions – I and II, respectively (Fig.
5.5b and 5.5d). From these analyses, it is found that the exergy destruction due to latent and
sensible heat transfer is higher along the solution side compared to air side for both the
conditions.
TH-1963_146103001
Page 154
Energy and Exergy Analyses
125
Table 5.1b, Performance comparison between inlet condition – I (Exp. no. – 10 in Table 5.1a)
and inlet condition – II (Exp. no. – 6 in Table 5.1a)
Inlet condition – I Inlet condition – II %increment %decrement
∆Qe (kW) 5.39 7.30 26 –
∆Qex,o (kW) 7.88 12.55 37 –
ηe (%) 28.8 39.6 27 –
ηex (%) 79.1 71.9 – 10
From Table 5.1b and Figs. 5.4 – 5.5, it is concluded that by increasing the desiccant temperature
and decreasing the specific humidity of the regenerator, the energy exchange between the air
and the desiccant solution and exergy losses with respect to the reference state increase.
b) Influence of operating parameters on energy and exergy efficiencies of the regenerator
On the basis of results presented in Table 5.1(a), the influence of operating parameters on
desorption and exergy efficiencies of the regenerator are studied in detail (Fig. 5.6 & Table
5.2). It is found from Fig. 5.6a and Table 5.2 that with decrease in air flow rate, desorption
efficiency increases. This is because of increase in contact time between the moist air and the
desiccant solution with decrease in air flow rate. From Fig. 5.6b, 5.6c, 5.6e and 5.6f and Table
5.2, it is observed that the desorption efficiency of the regenerator increases with increase in
desiccant temperature and decreases with increase in air temperature, specific humidity and
desiccant concentration. This can be explained by the fact that, with increase in desiccant
temperature and decrease in air temperature, air specific humidity and desiccant concentration,
the partial pressure between the air and the desiccant solution increases and hence, there is a
high potential for energy exchange (heat and mass exchange) between the air and the desiccant
solution. With increase in desiccant flow rate, energy efficiency increases (Fig. 5.6d). This
happens due to less reduction in desiccant temperature with increase in desiccant flow rate.
Therefore, desiccant solution has a higher tendency to transfer water vapor to the moist air with
increase in desiccant flow rate.
TH-1963_146103001
Page 155
Energy and Exergy Analyses
126
(a) (b)
(c) (d)
(e) (f)
Fig. 5.6, Influence of air and desiccant parameters on energy and exergy efficiencies of the liquid
desiccant regenerator: (a) Air flow rate, (b) air humidity ratio, (c) Air temperature, (d) desiccant
flow rate, (e) desiccant concentration and (f) desiccant temperature.
TH-1963_146103001
Page 156
Energy and Exergy Analyses
127
Exergy efficiency of the liquid desiccant regenerator decreases with increase in air flow rate
and decrease in desiccant flow rate, (Fig. 5.6a, 5.6d and Table 5.2). This is due to the exergy
losses incurred during the evaporation of water vapour from desiccant solution to the ambient
air. With decrease in air temperature, humidity ratio and desiccant temperature, the exergy
efficiency increases (Fig. 5.6b, 5.6c and 5.6f and Table 5.2). This happens because with
decrease in air temperature, humidity ratio and desiccant temperature, energy exchange
associated with the irreversible heat and mass transfer processes decreases. Therefore, exergy
losses within the regenerator decreases and exergy efficiency increases. From Fig. 5.6e and
Table 5.2, it is observed that there is no phenomenal change in regenerator exergy efficiency
by varying the desiccant concentration.
From Fig. 5.6, it has been concluded that except desiccant concentration, rest of the operating
parameters such as desiccant and air temperatures, desiccant and air flow rates and air humidity
ratio play a prominent role in improving the liquid desiccant regeneration system performance
of the liquid desiccant regenerator.
Table 5.2, Influence of operating parameters on energy and exergy efficiencies of the
regenerator (Fig. 5.6).
Range ηe ηex
% increment/
decrement
% increment/
decrement
Air flow rate (kg/s) ( ) 39.2 – 67.6 17 6
Desiccant flow rate (kg/s) ( ) 0.24 – 0.35 14 2
Air humidity ratio (gwv/kgda) ( ) 14 – 21 13 2
Desiccant concentration (kgLiCl/kgsol.) ( ) 32.8 – 34.9 7 –
Air temperature (°C) ( ) 30.1 – 40 12 4
Desiccant temperature (°C) ( ) 60.3 – 70 72 18
*( ) – Increment; ( ) – Decrement; ( ) – Intermediate (no change);
5.2 Energy and exergy analysis of evacuated U – tube solar collector
5.2.1 Energy efficiency analysis of an evacuated U – tube solar collector
a) Energy efficiency
TH-1963_146103001
Page 157
Energy and Exergy Analyses
128
The performance of an evacuated U – tube solar collector is analysed by means of energy
efficiency (ηu). It is defined as the ratio of useful energy gained by the working fluid (Qu) to
the effective solar radiation incident onto the collector aperture area (Ac) and is formulated as
, , ,( )
2
wf p wf wf o wf iuu
c c c
m c T TQ
A D L
(5.21)
where ‘ζ’ is the effective heat absorbed from the evacuated tube (kW/m2) (ζ = τg,oτg,iαcI), Dc is
the absorber tube diameter (m) and Lc is the length of the absorber tube (m).
b) Energy efficiency empirical correlation
In order to develop a correlation for energy efficiency, the operating parameters, such as
working fluid inlet temperature, solar intensity, working fluid flow rate and ambient
temperature are identified as the influencing parameters. Based on experimental data, a
correlation is developed for theoretically analysing the energy efficiency of the evacuated U –
tube solar collector within a given range of operating parameters and specifications (Table 4.5).
The correlation for the energy efficiency of the evacuated U – tube solar collector is expressed
as
, ,, ,u amb wf i wff T I T m (5.22)
The general expression for aforementioned equation is as follows
1 2 3 , 4 5 u amb wf i wfT I T m (5.23)
where ϕ1 – ϕ4 and ϕ5 are coefficients and constants of individual model terms, respectively.
The statistical information about the developed correlation is presented in Table 5.3. The
constant and coefficients ‘ϕ1’ – ‘ϕ5’ listed in Table 5.3 are obtained using linear regression
technique. The R2 and the adjusted R2 values are 98 % and 95 %, respectively. From these
values, it is well understood that the developed correlation provides the best fit within the range
of operating parameters (Table 4.5c).
TH-1963_146103001
Page 158
Energy and Exergy Analyses
129
Table 5.3, Coefficients of the energy efficiency correlation.
Correlation
ηu (%) 1 2 3 , 4 5amb wf i wfT I T m
Coefficients ϕ1 ϕ2 ϕ3 ϕ4 ϕ5
0.65 -26.1 -0.18 5.73 14.8
Statistical information
Regression Statistics
R2 0.98
Adjusted R2 0.95
F – value 116.48
F significance 2.4×10⁻¹⁵
P – value ϕ1 ϕ2 ϕ3 ϕ4 ϕ5
5.2 × 10⁻⁴ 3.95 × 10⁻¹¹ 5.2 × 10⁻⁴ 2.48 × 10⁻¹⁵ 0.028
Fig. 5.7a and 5.7b presents the comparison of predicted energy efficiency from the developed
empirical correlation with the experimental data obtained from the evacuated U – tube solar
collector. It is found that the energy efficiency obtained from the developed correlation and
from the experimental data matches well with a maximum error of ±6.9 %. Also, for a given
range of operating conditions, the maximum and average energy efficiencies are observed to
be 72 % and 51 %. The maximum energy efficiency of the evacuated U – tube solar collector
is obtained at high solar intensity of 1.08 kW/m2 and at lower working fluid inlet temperature
and flow rate of 28.8 °C and 15 ml/s, respectively.
Fig. 5.7b presents the variation of energy efficiency as a function of normalized heat gain ((Tm
– Tamb)/I). From Fig. 5.7b, it is observed that as the normalized heat gain increases, the energy
efficiency decreases. This is due to the fact that, with increase in working fluid temperature,
the thermal losses across the evacuated U – tube solar collector increases and hence, the energy
efficiency decreases. It is also observed from Fig. 5.7b that for a given range of operating
parameters, with decrease in normalized heat gain from 15.3 (m2 – K/kW) to 0.8 (m2 – K/kW),
the energy efficiency of the evacuated U – tube solar collector increases by 89%.
TH-1963_146103001
Page 159
Energy and Exergy Analyses
130
(a) Empirical correlation validation plot (b) Variation of energy efficiency with the
normalized heat gain ((Tm – Tamb)/I).
Fig. 5.7, Comparison of empirical correlation with the experimental data for energy
efficiency of the evacuated U – tube solar collector.
5.2.2 Exergy efficiency analysis of an evacuated U – tube solar collector
a) Exergy efficiency
For minimizing the energy loss from evacuated tube heat pipe solar collector to the
surroundings and to improve the performance of the solar collector, the exergy efficiency is
chosen as a performance index. The exergy efficiency is defined as the ratio of useful exergy
delivered (Lamnatau, 2012) to the exergy absorbed by the evacuated tube solar collector
(Daghigh and Shafieian, 2016; Shah and Furbo, 2004).
,
4
,
, ,
,
( ) l
1 4 1
3 3
nwf o
wf p wf wf o wf i r
wf iud
r rc
sr s
x
r
e
ab
Tm c T T T
TEx
E T TA I
T T
x
(5.24)
where Tr is the reference temperature (K) (Tr = 298 K), I is the solar intensity (kW/m2) and Tsr
is the solar radiation temperature (Tsr = 6000 K) (Daghigh and Shafieian, 2016).
TH-1963_146103001
Page 160
Energy and Exergy Analyses
131
The overall solar intensity incident on the evacuated tube is not fully absorbed by the U – tube
due to variation in transmissivity (τg) of the inner and outer glass surface and absorptivity (αc)
of the inner glass coating surface. Therefore, the exergy efficiency of the evacuated U – tube
solar collector is modified as
,
, , ,
4
,
(
1 4
) ln
13 3
wf o
wf p wf wf o wf i r
r rc
sr sr
wf i
ex
T TA
T
Tm T T
T
T
c T
(5.25)
where ‘ζ’ is the effective heat absorbed from the evacuated tube and is written as ζ = τg,oτg,iαcI.
b) Exergy efficiency empirical correlation
In order to predict the exergy efficiency of the evacuated U – tube solar collector in terms of
known inlet parameters, an empirical correlation is developed based on data obtained from the
experimental analysis. In this correlation, the ambient temperature, working fluid inlet
temperature, solar intensity and working fluid flow rate are taken as inlet parameters. It should
be noted that this correlation is valid for a given range of operating parameters and dimensions
(Table 4.5), at the reference temperature and solar radiation temperature of 298 K and 6000 K,
respectively. The correlation for the exergy efficiency of the evacuated U – tube solar collector
can be expressed as
,, , ,ex amb wf i wff T I T m (5.26)
The empirical correlation is developed using linear regression analysis and the equation is
formulated as follows
1 2 3 , 4 5 ex amb wf i wfT I T m (5.27)
where ϕ1 – ϕ4 and ϕ5 are coefficients and constants of individual model terms, respectively.
The statistical indices presented in Table 5.4 reveal that the developed correlation is suited for
analysing the exergy efficiency of the evacuated U – tube solar collector. Also, from Fig. 5.8a
and 5.8b, it is confirmed that the exergy efficiency obtained from the developed correlation
holds good agreement with the experimental data with a maximum error of ±7.8 %. It is seen
from Fig. 5.8b that the exergy efficiency gradually increases as time progresses. At the end of
TH-1963_146103001
Page 161
Energy and Exergy Analyses
132
the day, the exergy efficiency reaches to a maximum value of 74 %. Due to high drop in
ambient temperature from 3:00 pm, the exergy efficiency of the evacuated U – tube increases
to such a high value. It is found that the maximum exergy destruction (irreversibility) is
happening during the beginning of the day.
Table 5.4, Coefficients of the exergy efficiency correlation.
Correlation
ηex (%) 1 2 3 , 4 5amb wf i wfT I T m
Coefficients ϕ1 ϕ2 ϕ3 ϕ4 ϕ5
0.68 -29.66 -0.56 1.38 57.82
Statistical information
Regression Statistics
R2 0.95
Adjusted R2 0.93
F – value 130.12
F significance 6.7×10⁻¹⁶
P – value ϕ1 ϕ2 ϕ3 ϕ4 ϕ5
6.7 × 10⁻⁵ 1.2 × 10⁻¹¹ 2.8 × 10⁻⁶ 1.9 × 10⁻¹⁵ 2.92 × 10⁻⁹
(a) Empirical correlation validation plot. (b) Exergy efficiency variation during a day.
Fig. 5.8, Comparison of empirical correlation with the experimental data for exergy efficiency
of the evacuated U – tube solar collector.
TH-1963_146103001
Page 162
Energy and Exergy Analyses
133
5.3 Energy and exergy analysis of evacuated U – tube solar collector system
5.3.1 Efficiencies of the evacuated U – tube solar collector system
a) Energy efficiency of the system
The energy efficiency for the solar collector system (evacuated U – tube solar collector bundle
connected in series) (Fig. 4.6) is reformulated based on Eq. 5.21 as
3 1, , ,
,
( )
2
wf p wf wM o wM iuu sc
c c c
m c T TQ
N A D L N
(5.28)
where ‘N’ is number of manifolds (M1, M2 and M3), TwM1,i is the working fluid inlet
temperature at manifold – M1 and TwM3,o is the working fluid outlet temperature at the outlet
of the manifold – M3.
b) Exergy efficiency of the system
The exergy efficiency for the evacuated U – tube solar collector system (Fig. 4.6a) is
reformulated based on Eq. 5.25 as
3
3 1
1
,
,
,
4
, ,
,
( ) ln
1 4 1
3 3
wM o
wf p wf wM o wM i r
wM i
ex sc
r rc
sr sr
Tm c T T T
T
T TNA
T T
(5.29)
b) Variation of energy and exergy efficiencies of the system during a sunny day
For a humid subtropical climate, the variations in energy and exergy efficiencies of the
evacuated U – tube solar collector system (three manifolds connected in series and each
manifold is integrated with ten evacuated U – tubes in parallel) are analysed experimentally
during a sunny day and their results are presented in Fig. 5.9a and 5.9b. From Fig. 5.9a, it is
found that the energy efficiency varies from 31 % – 52 % with an average value of 43 %. In
Fig. 5.9a, the peak energy efficiency is observed at 2: 00 PM. The fluctuation in energy
efficiency is due to the variation in solar intensity. It is observed from Fig. 5.9b that the exergy
efficiency varies from 27 % – 63 % with an average exergy efficiency of 41 % and increases
with time during a day. With this phenomenon, it is understood that the useful heat gained by
TH-1963_146103001
Page 163
Energy and Exergy Analyses
134
the working fluid from surroundings increases with increase in duration of time during a sunny
day. Exergy efficiency increases towards evening, but this is accompanied by a decrease of
energy efficiency. This happens because at the end of the day, high drop in ambient temperature
takes place, while the inlet and outlet temperatures of the collector will be still moderate.
Therefore, lower thermal efficiency and higher exergy efficiency is observed during evening
time.
(a) Energy efficiency (b) Exergy efficiency
Fig. 5.9, Energy and exergy efficiencies variations of the evacuated U – tube solar
collector system during a sunny day.
5. 4 Summary
5.4.1 Liquid desiccant regenerator
Energy and exergy analyses have been carried out for analysing the performance of the liquid
desiccant regeneration system. With the simplified expressions formulated in the present work,
energy required for regeneration of the liquid desiccant and exergy destroyed with respect to
reference state are quantified. Energy exchange and exergy loss along the height of the liquid
desiccant regenerator are quantified during coupled heat and mass transfer processes. The
influence of air and desiccant temperatures, air and desiccant flow rates, air humidity ratio and
desiccant concentration on desorption and exergy efficiencies of the liquid desiccant
regenerator are also investigated.
5.4.2 Evacuated U – tube solar collector
Based on experimental data, two empirical correlations for energy efficiency and exergy
efficiency as a function of ambient temperature, solar intensity, working fluid inlet temperature
TH-1963_146103001
Page 164
Energy and Exergy Analyses
135
and working fluid flow rate were formulated. The energy and exergy efficiency analyses were
performed for the individual evacuated U – tube solar collector and for the whole solar collector
system.
TH-1963_146103001
Page 165
TH-1963_146103001
Page 166
Cross Flow Dehumidifier/Regenerator
137
CHAPTER – 6
CROSS-FLOW DEHUMIDIFIER/REGENERATOR
6.1 Preface
Several researchers have investigated the performance of the liquid desiccant
dehumidifier/regenerator employing numerical models and performing experimental studies.
The estimation of air and desiccant property variations along the length and height of the
dehumidifier and the regenerator are complicated. Thus, a numerical tool, is generally used to
predict these variations. Very few models were developed for predicting the variations of air
and desiccant properties and also for predicting the heat and mass transfer characteristics along
the cross – flow liquid desiccant dehumidifier and regenerator. Only Li et al. (2005) reported
the variations of air and desiccant properties along the liquid desiccant regenerator. Further,
the models reported in the literature, generally require complicated simulation procedure for
solving the governing equations. Moreover, the major challenges faced by several researchers
are the estimation of heat and mass transfer coefficients or Lewis number. In addition, the
reported models were used for predicting either the performance of the liquid desiccant
dehumidifier or the performance of the liquid desiccant regenerator.
Therefore, this chapter focuses on proposing a simplified thermodynamic approach for
analysing the performance of the cross – flow liquid desiccant dehumidifier as well as liquid
desiccant regenerator using two developed correlations for predicting the heat and mass
transfer coefficients in terms of thermal effectiveness and moisture effectiveness. A finite
difference method is implemented for solving the developed thermodynamic model using a
recursive algorithm. Using the developed model, the variations of air and desiccant enthalpies,
TH-1963_146103001
Page 167
Cross Flow Dehumidifier/Regenerator
138
concentration of desiccant and air specific humidity along the packed tower
(dehumidifier/regenerator) are presented. In addition, Lewis number is formulated in terms of
thermal and moisture effectiveness and the influence of Lewis number on operating and
performance parameters of the packed tower is studied.
6.2 Thermodynamic model
Fig. 6.1 shows the schematic of adiabatic cross-flow packed tower (dehumidifier/regenerator).
In both the dehumidifier and the regenerator, the air and the desiccant solution flow in
longitudinal and transverse directions, respectively. As shown in Fig. 6.1, the length, height
and width of the packed tower are taken along x, y and z directions, respectively. The heat and
mass transfer processes are uniform along the z direction of the packed tower. So, the transfer
processes between the air and the desiccant remains same in any x – y plane along the z –
direction. Therefore, in the present study, transfer processes in x – y plane at particular z –
coordinate is chosen for deriving the governing equations (Fig. 6.2).
Fig. 6.1, Schematic of the cross-flow packed tower.
The assumptions considered for deriving the governing equations are,
Working fluids are Newtonian.
Velocities of working fluids are uniform along the longitudinal and transverse direction.
No heat dissipation to the surroundings.
Local heat and mass transfer coefficients do not vary during the transfer processes.
TH-1963_146103001
Page 168
Cross Flow Dehumidifier/Regenerator
139
Heat conduction and molecular diffusion among the liquid desiccant and air is negligible
along the flow direction (Rajat and Jain, 2015; Shifang et al. 2017).
Pressure drop across the tower height is neglected (Elsarrag et al., 2005).
6.2.1 Governing equations
The energy balance for the air side flow is given by
0a aa sa a h sG G a T T
h
x x
(6.1)
where a
x
and ah ssa T T are the latent heat generated during dehumidification or
humidification process and chemical heat liberated during exothermic reaction.
The energy balance for the desiccant side flow is given by
0s ss s sh s a
h XG a T T
yG
y
(6.2)
where sX
y
and sh asa T T are the latent heat generated during vapour
absorption/desorption process and chemical heat liberated during exothermic reaction.
The mass balance at the air – desiccant interface is given by,
0s as a
XG G
y x
(6.3)
The change in air humidity ratio along the length of the packed tower is given by (Yimo et al.
2014),
0m sa
a
ae
x
a
G
(6.4)
where m sa
a
e
a
G
is the mass transfer due to vapour pressure difference between liquid
desiccant and air.
TH-1963_146103001
Page 169
Cross Flow Dehumidifier/Regenerator
140
6.2.2 Heat and mass transfer coefficients
Overall heat and mass transfer coefficients ( h & m ) can be derived as follows:
a) Heat transfer coefficient at the interface
Variation of air temperature along the length of the packed tower is given by (Yimo et al. 2014),
sa
h a
TT T
x
(6.5)
where ,
h sh
a p m
a
G c
Also, the air temperature varies along the height of the packed tower. So, the change in air
temperature along the height can be written as,
ah s a
Tb T T
y
(6.6)
where b is a constant.
Thus, by combining Eqs. (5) & (6), the change in air temperature across the packed tower is
written as,
a as sa h a h a
T TdT dx dy T T dx b T T dy
x y
(6.7)
On integration, Eq. (6.7) can be represented as
0 0( )
oa
ia
T L H
ah
aT s
dTdx bdy
T T
(6.8)
After integrating Eq. (6.8);
*
1 h
avg
s
o iLa a
i
a
T Te
T T
(6.9)
where 𝐿∗ = 𝐿 + 𝑏𝐻.
TH-1963_146103001
Page 170
Cross Flow Dehumidifier/Regenerator
141
The thermal effectiveness (ξT) for the packed tower is given as (Gandhidasan, 2005, 2006)
( ) ( )
( ) ( )
i o
s a s
o i
a a a aT i i i i
a
T T T T
T T T T
(6.10)
From Eqs. (6.9) & (6.10), the thermal effectiveness can be reformulated as,
*
1 h
avg
s
i
s
iL a
T i
a
T Te
T T
(6.11)
As 1avg
s
i
s
i
a
i
a
T T
T T
, Eq. (6.11) can be represented as,
*
1 hL
T e
(6.12)
Since,
h sh
a p m
a
G c
, the heat transfer coefficient (𝛼ℎ) is represented from Eq. (6.12) as,
,
*
1ln
1
a p m
h
T
G c
aL
(6.13)
b) Mass transfer coefficient at the interface
As the air specific humidity varies in both longitudinal and transverse directions of the packed
tower, the overall change in specific humidity for the packed tower can be written as,
a aa m a m ae ed dx dy dx b dy
x y
(6.14)
where b is a constant and m s
m
a
a
G
.
On integration, Eq. (6.14) is represented as,
0 0
oa
ia
L H
am
e a
ddx bdy
(6.15)
After integrating Eq. (6.15), the air outlet specific humidity is expressed as,
*
1 m
o i
a a
i
e a
Le
(6.15a)
TH-1963_146103001
Page 171
Cross Flow Dehumidifier/Regenerator
142
where 𝐿∗ = 𝐿 + 𝑏𝐻.
The moisture effectiveness (ξm) is given as (Gandhidasan, 2005, 2006)
o i
a a
e
m i
a
(6.16)
Using Eqs. (15a) & (16) the moisture effectiveness is formulated as,
*
1 m
m
Le
(6.17)
Sincem s
m
a
a
G
, the mass transfer coefficient is represented from Eq. (6.17) as,
*
1ln
1
am
m
G
aL
(6.18)
Here, assuming * 1sa L for a cross-flow packed tower (Yimo et al. 2014), the Eqs. (6.13) &
(6.18) can be written as
1ln
1m a
m
G
(6.19)
,
1ln
1h a p m
T
G c
(6.20)
With known inlet parameters, overall heat and mass transfer coefficients for the packed tower
( h & m ) can be calculated using Eqs. (19) & (20).
The boundary conditions along the packed tower are
hs = hsi ; Xs = Xs
i, at y = 0 (6.21)
ha = hai, ωa = ωa
i, at x = 0 (6.22)
6.3 Finite difference model
In order to analyze the heat and mass transfer contours along the packed tower and to predict
the outlet parameters of the air and desiccant solution, governing equations (Eq. (6.1) – (6.4))
derived in the thermodynamic model needs be solved numerically by applying boundary
TH-1963_146103001
Page 172
Cross Flow Dehumidifier/Regenerator
143
conditions (Eq. (6.21) & Eq. (6.22)). A two dimensional x – y plane is considered as the
computational domain and discretized into L × H equally spaced grids (Fig. 6.2). By applying
boundary conditions, the governing equations are solved for each grid (i, j).
Fig. 6.2, Heat and mass transfer processes along the packed tower.
The discretized form of the governing equations for grid (i, j) are written as follows:
, 1, , , , 1, , , , , , ,( ) ( ) ( ) 0a a i j a i j a a i j a i j h s a i j s i jG h h G a T T
(6.23)
, , 1 , , , , 1 , , , , , ,( ) ( ) ( ) 0s s i j s i j s s i j s i j h s s i j a i jG h h G X X a T T
(6.24)
, 1, , , , , , ,( ) ( ) 0m sa i j a i j e i j a i j
a
a
G
(6.25)
, , 1 , , , 1, , , 0s s i j s i j a a i j a i jG X X G (6.26)
TH-1963_146103001
Page 173
Cross Flow Dehumidifier/Regenerator
144
6.3.1 Recursive Algorithm
Fig. 6.3, Recursive algorithm for solving the developed model.
Recursive algorithm utilizes the output obtained in the current iteration as an input for solving
the next iteration (Donggen et al. 2017). In the present study, recursive algorithm serves as a
tool for solving the governing equations in each grid by iterating over the computational
domain. The recursive algorithm for the computational domain is shown in Fig. 6.3. The
simulation procedure contains nested spatial loop which iterates over the computational domain
TH-1963_146103001
Page 174
Cross Flow Dehumidifier/Regenerator
145
and solves the discretized form of governing equations (Eq. (6.23) – Eq. (6.26)) in each grid
by applying boundary conditions. The input parameters chosen for simulation procedure are
the air and desiccant enthalpies (ℎ𝑎𝑖 & ℎ𝑠
𝑖 ), air specific humidity (𝜔𝑎𝑖 ), desiccant concentration
(Xsi), moisture effectiveness (ξm), thermal effectiveness (ξT), mass flux of air and desiccant
solution (Ga & Gs) and the specifications of the packed tower. The initial conditions of air and
desiccant solution for the grid (i, j) are fixed as ℎ𝑎,𝑖,𝑗=ℎ𝑎𝑖 , ℎ𝑠,𝑖,𝑗=ℎ𝑠
𝑖 , 𝜔𝑎,𝑖,𝑗=𝜔𝑎𝑖 , 𝑋𝑠,𝑖,𝑗= Xs
i and
𝐺𝑠,𝑖,𝑗=𝐺𝑠𝑖 . These initial conditions are implemented for obtaining the outlet parameters of the
grid (i, j).
The obtained outlet parameters of grid (i, j) are equal to the air inlet parameters of grid (i+1, j)
and desiccant inlet parameters of the grid (i, j+1), respectively. There are too loops in the
algorithm i.e., external loop and internal loop. In the internal loop, the ‘i’ value is incremented
every time keeping the ‘j’ value constant till ‘i’ value reaches L (length of the packed tower).
After that, the control goes to the external loop where ‘j’ value varies from 0 to H (height of
the packed tower). This process goes on till the loops reach to the last grid (L, H). The complete
procedure for predicting the outlet parameters over the entire computational domain can be
explained as follows,
(a) First set the inlet parameters of the air and desiccant solution, ξm, ξT, L and H as input
data.
(b) Set the initial conditions as ℎ𝑎,𝑖,𝑗=ℎ𝑎𝑖 , ℎ𝑠,𝑖,𝑗=ℎ𝑠
𝑖 , 𝜔𝑎,𝑖,𝑗=𝜔𝑎𝑖 , 𝑋𝑠,𝑖,𝑗=Xs
i and 𝐺𝑠,𝑖,𝑗=𝐺𝑠𝑖, set
i =1 and j =1.
(c) Calculate specific humidity (𝜔𝑎,𝑖+1,𝑗) using Eq. (6.25).
(d) Calculate air outlet enthalpy and desiccant concentration (ℎ𝑎,𝑖+1,𝑗 & 𝑋𝑠,𝑖,𝑗+1) using Eqs.
(23 & 26).
(e) Calculate the desiccant outlet enthalpy (ℎ𝑠,𝑖,𝑗+1 ) using Eq. (6.24).
(f) Increase ‘i’ value by one unit and calculate the outlet parameters of (i+1, j) grid using
outlet parameters of the previous grid (i, j).
(g) Repeat the steps (c) to (f) till i reaches the value L.
(h) If i = L, then go for the j+1 row by incrementing the value of j by one unit and calculate
the outlet parameters for each grid of j+1 row by repeating the steps (c) to (f).
(i) Continue the whole process till i = L & j = H.
(j) Terminate the process.
TH-1963_146103001
Page 175
Cross Flow Dehumidifier/Regenerator
146
The predicted outlet parameters of the packed tower can be taken as the average of their
respective values along the outlet of the computational domain i.e., the average values of
desiccant parameters at x =1 to L & y = H and the average values of air parameters at x = L &
y = 1 to H (Fig. 6.2).
6.4 Validation of the developed model
To use the developed model for studying the heat and mass transfer processes across the packed
tower (dehumidifier/regenerator), proper validation is required. For the validation of the
developed model, experimental results presented by Li et al. (2005) (dehumidifier and
regenerator), Rajat SD and Jain S (2015) (dehumidifier) are considered. The dimensions and
specifications of the packed tower used for validation purpose are listed in Table 6.1. Table 6.2
shows the comparison of the predicted values with the experimental data (Li et al. (2005); Rajat
and Jain (2015)). Using the inlet parameters given in Table 6.2, distribution of air and desiccant
parameters (contour plots) across the dehumidifier and the regenerator are presented in Figs.
6.4 and 6.5. Also, a comparison of these results is shown in Figs. 6.6 and 6.7.
Table 6.1, Dimensions and specifications of the packed tower reported by Li et al. (2005) and
Rajat and Jain (2015).
Experimental data Li et al. (2005) Rajat and Jain (2015)
Liquid desiccant LiBr-H2O LiCl-H2O
Height (m) 0.55 0.21
Length (m) 0.4 0.49
Width (m) 0.35 0.18
Specific surface area (m2/m3) 396 178
Type of component Dehumidifier and regenerator Dehumidifier
Table 6.2, Comparison of predicted results with experimental data.
Liu et al. (2005) – Regenerator
Ga
(kg/m2s)
Ta
(οC)
𝜔a(kgv/k
gda)
Gs
(kg/m2s)
Ts(οC) Xs (%)
Inlet parameters 1.41 35.4 0.021 2.77 57.3 47.1
Outlet parameters obtained by
experiments
- 46.6 0.031 - 46.1 47.6
TH-1963_146103001
Page 176
Cross Flow Dehumidifier/Regenerator
147
Outlet parameters (Liu et al. (2005)) - 46.2 0.031 - 46.3 47.4
Percentage difference (Liu et al.
(2005))
- 0.85 0.0 - -0.43 0.42
Outlet parameters using present model - 46.5 0.031 - 46 47.4
Percentage difference using present
model (%)
- 0.21 0.0 - 0.21 0.42
Liu et al. (2005) – Dehumidifier
Inlet parameters 1.97 31.7 0.013 3.08 22.9 45.7
Outlet parameters obtained by
experiments
- 26.9 0.0099 - 27.8 45.7
Outlet parameters (Liu et al. (2005)) - 27.6 0.010 - 27.5 45.6
Percentage difference (Liu et al.
(2005))
-2.60 -1.01 - 1.07 0.21
Outlet parameters using present model 27.3 0.010 - 27.4 45.62
Percentage difference using present
model (%)
-1.48 -1.01 - 1.43 0.175
Rajat SD and Jain S (2015) – Dehumidifier
Inlet parameters 0.34 40.8 0.02263 0.79 54.6 38
Outlet parameters obtained by
experiments
- 37.2 0.0123 - 37.9 37.7
Outlet parameters (Rajat SD and Jain
S (2015))
- 37.1 0.0124 - 37.2 37.76
Percentage difference (Rajat SD and
Jain S (2015))
- 0.26 -0.404 - 1.84 -0.159
Outlet parameters using present model - 37.1 0.0124 - 37.6 37.6
Percentage difference using present
model (%)
- 0.26 -0.404 - 0.79 0.26
It is observed that the predicted values of outlet parameters from the current model are in good
agreement with the experimental data (given in Table 6.2). The deviation of the predicted
values with the experimental data is less than ±2%.
TH-1963_146103001
Page 177
Cross Flow Dehumidifier/Regenerator
148
6.4.1 Distribution profiles
Figs. 6.4 and 6.5 represent the variation of air and desiccant properties along the dehumidifier
and the regenerator. The inlet parameters for analyzing the heat and mass transfer processes
across the packed tower are taken from the experimental results reported by Liu et al. (2005)
(Table 6.2). From Fig. 6.4, it is seen that as the air flows along the longitudinal direction, it
cools and dehumidifies whereas the desiccant solution that flows along transverse direction is
heated and diluted. The air enthalpy and humidity ratio is minimum at the top corner of the air
outlet (x = 0.4 m & y = 0 m; Fig. 6.4b and 6.4d). This is because the driving force for the heat
and mass transfer processes is maximum at that location due to the contact of cold and strong
solution. The desiccant enthalpy is maximum and desiccant concentration is minimum at the
left corner of the desiccant outlet (x = 0 m & y = 0.55 m; Fig. 6.4a & 6.4c). It happens because
the desiccant solution at this point contacts colder and more humid air compared to other
locations.
(a) (b)
(c) (d)
Fig. 6.4, Contour plots for air and desiccant parameters of the dehumidifier (a) desiccant
concentration (b) air specific humidity, (c) desiccant enthalpy and (d) air enthalpy.
TH-1963_146103001
Page 178
Cross Flow Dehumidifier/Regenerator
149
Along the longitudinal direction (x = 0 m to 0.4 m & y = 0.55 m), the difference in air enthalpy
and specific humidity are about 9 kJ/kg and 3 gv/kgda, respectively. Similarly, along the
transverse direction (x = 0.4 m & y = 0 m to 0.55 m), the differences in desiccant enthalpy and
concentration are 6 kJ/kg and 0.08%.
(a) (b)
(c) (d)
Fig. 6.5, Contour plots for air and desiccant parameters of the regenerator (a) desiccant concentration (b)
air specific humidity, (c) desiccant enthalpy and (d) air enthalpy.
The air in the regenerator is heated and humidified as it flows along the longitudinal direction,
while the solution cools and gets concentrated as it flows along the transverse direction (shown
in Fig. 6.5). At the air outlet (x = 0.4 m), the air at the top of the regenerator has the highest
enthalpy and specific humidity because it contacts the hotter and weaker solution (Fig. 6.5b
and 6.5d). Similarly, at the left corner of the desiccant outlet (y = 0.55 m), the solution has the
highest concentration and the lowest enthalpy because it contacts colder and drier air compared
TH-1963_146103001
Page 179
Cross Flow Dehumidifier/Regenerator
150
with other locations (Fig. 6.5a and 6.5c). Along the longitudinal direction (x = 0 m to 0.4 m &
y = 0.55 m), the differences in air enthalpy and specific humidity are 25 kJ/kg and 10 gv/kgda,
respectively. Similarly, along the transverse direction (x = 0.4m & y = 0 m to 0.55 m), the
differences in desiccant enthalpy and concentration are 40 kJ/kg and 0.3%.
6.4.2 Validation of operating parameters
(a) (b)
Fig. 6.6, Comparison of simulation results with the numerical and experimental data of (a)
desiccant solution enthalpy in dehumidifier and (b) air enthalpy in dehumidifier.
Figs. 6.6 and 6.7 present the comparison of simulated results with the experimental and
numerical results presented by Liu et al. (2005). Since, Liu et al. (2005) presented only the
experimental results for solution enthalpy, numerically predicted solution enthalpy has been
validated with experimental data of solution enthalpy of the dehumidifier and the regenerator
(Fig. 6.6a and 6.7a). As shown in Fig. 6.6a and 6.7a, the predicted outlet solution enthalpy
variation along the length of the packed tower (dehumidifier – 6.6a and regenerator – 6.7a)
matches well with the experimental and numerical data reported by Liu et al. (2005). From Fig.
6.6a, it is found that with increase in length of the dehumidifier from 0 m to 0.4 m, the desiccant
enthalpy decreases only by 0.4 %. This small decrease is due to the fact that at the left corner
of the dehumidifier (L = 0 m), the air temperature and moisture content are high compared with
the right corner (L = 0.4 m). Therefore, there is more heat transfer from air to the desiccant
solution at the left side compared to the right side of the dehumidifier. From Fig. 6.7a, it is
observed that with increase in length of the regenerator from 0 m to 0.4 m, the solution enthalpy
increases by 1.8 %. This happens because at the left corner of the regenerator (L = 0 m), air
temperature and moisture are low compared with the right corner (L = 0.4 m). Thus, there is
320
323
326
329
332
335
0 0.1 0.2 0.3 0.4 0.5
En
tha
lpy
of
air
(k
J/k
g)
Height (m)
Numerical [5]
Present Study
TH-1963_146103001
Page 180
Cross Flow Dehumidifier/Regenerator
151
high sensible and latent heat transfer from the desiccant solution to the air side at the left corner
compared to the right corner of the regenerator.
As illustrated in Fig. 6.6b and 6.7b, the predicted outlet air enthalpy variation along the height
of the packed tower (dehumidifier – Fig. 6.6b and regenerator – Fig. 6.7b) has a good agreement
with the numerical values reported by Liu et al. (2005). It is observed from Fig. 6.6b that with
increase in height of the dehumidifier from 0 m to 0.55 m, the air enthalpy increases by 0.6 %.
This is because, the air at the top of the dehumidifier (H=0) is in contact with the cold and
concentrated solution. So, the potential for heat and moisture transfer from the air to the
desiccant is high at the top in comparison with the bottom of the dehumidifier (H = 0.55 m).
(a) (b)
Fig. 6.7, Comparison of simulated results with the numerical and experimental data of (a)
desiccant enthalpy in regenerator and (b) air enthalpy in regenerator.
It is also observed from Fig. 6.7b that with increase in height from 0 m to 0.55 m, the air
enthalpy decreases merely by 0.7 %. This marginal decrease happens because, the air at the top
(H = 0 m) contacts with the hot and diluted solution. So, the potential for heat and mass transfer
is higher at the top from the desiccant to the air than at the bottom (H = 0.55 m) of the
regenerator.
6.5 Influence of Lewis number on dehumidification and regeneration processes
6.5.1 Lewis Number
Lewis number is a dimensionless number for determining the relationship between the heat and
mass transfer coefficients and is expressed as
392
395
398
401
404
407
410
0 0.1 0.2 0.3 0.4 0.5
En
tha
lpy
of
air
(k
J/k
g)
Height (m)
Numerical [5]
Present Study
TH-1963_146103001
Page 181
Cross Flow Dehumidifier/Regenerator
152
,
h
m p m
Lec
(6.27)
By substituting, Eqs. (6.19) & (20) in Eq. (6.27), Le is defined in terms of moisture and thermal
effectiveness’s as
1ln
1
1ln
1
T
m
Le
(6.28)
In section 6.5.2 and 6.5.3, by using the developed model, the influence of Lewis number on the
performance characteristics of the dehumidifier and the regenerator is studied. The operating
parameters and the packed tower specifications considered for analyzing the heat and mass
transfer processes across the packed tower are listed in Table 6.3.
Table 6.3, Constant operating parameters for the dehumidification and regeneration
processes.
Liquid desiccant LiBr-H2O
Air inlet temperature(οC) 32
Relative humidity (%) 60
Air flow rate (kg/m2 – s) 2
Desiccant flow rate(kg/m2 – s) 3.1
Desiccant inlet temperature for dehumidifier (οC) 23
Desiccant inlet temperature for Regenerator (οC) 57
Concentration of desiccant solution (% by mass) 46
Thermal Effectiveness 0.6
Height (m) 0.55
Length (m) 0.4
Specific surface area (m2/m3) 396
6.5.2 Influence of Lewis number on operating parameters
Figs. 6.8 – 6.10 describe the effect of Le on the desiccant concentration of the dehumidifier
and the regenerator. For a given height, as Le increases, the desiccant concentration increases
TH-1963_146103001
Page 182
Cross Flow Dehumidifier/Regenerator
153
in the dehumidifier and decreases in the regenerator. At a specified height (H = 27.5m), the
increase in the solution concentration is only 0.18% in the dehumidifier and the decrease in the
regenerator is about 0.43% as the Lewis number varies from 0.5 to 1.5. With increase in height,
desiccant concentration decreases in the dehumidifier and increases in the regenerator (Figs.
6.8 – 6.10). For a specified Le (Le = 1), the decrease is in the solution concentration is about
0.32% in the dehumidifier and the increase is about 1.58 % in the liquid desiccant regenerator.
(a) (b)
(c)
Fig. 6.8, Concentration profile for different Lewis numbers during the dehumidification process:
(a) Le=0.5, (b) Le=1 and (c) Le=1.5.
TH-1963_146103001
Page 183
Cross Flow Dehumidifier/Regenerator
154
(a) (b)
(c)
Fig. 6.9, Concentration profile for different Lewis numbers during the regeneration process:
(a) Le=0.5, (b) Le=1 and (c) Le=1.5.
It is also observed from Figs. 6.8 and 6.9, that with increase in length from 0 m to 0.4 m, the
desiccant concentration increases by 0.65 %, 0.26% and 0.13% for the dehumidifier and
decreases by 4.12%, 1.69% and 0.85% for the regenerator, respectively for the Le of 0.5, 1 and
1.5. As evident from the results presented in Figs. 6.8 – 6.10 that Lewis number (Le) does not
have a significant effect on solution concentration of both the dehumidifier and the regenerator.
TH-1963_146103001
Page 184
Cross Flow Dehumidifier/Regenerator
155
Fig. 6.10, Variation of the solution concentration along the height of the packed tower.
Fig. 6.11a shows the variation of air enthalpy along the length of the packed tower
(dehumidifier and regenerator) for different Lewis numbers (Le = 0.5 to 1.5). From Fig. 6.11a,
it is observed that for a given length, with increase in Le, the air enthalpy increases in the
dehumidifier and decreases in the regenerator. This happens because with increase in Le, mass
transfer rate decreases. Thus, the latent heat transfer between the desiccant solution and the
process air decreases. For a given length (L = 0.2 m), with increase in Le from 0.5 to 1.5, the
air enthalpy increases by 21% in the dehumidifier and decreases by 31% in the regenerator.
From Fig. 6.11a, it is also observed that for a given Le, with increase in length of the packed
tower, the enthalpy of the process air decreases in the dehumidifier and increases in the
regenerator. This is due to the fact that as the length increases, release in latent heat of
condensation/evaporation between the air and the desiccant solution increases.
Therefore, the air enthalpy decreases in the dehumidifier and increases in the regenerator. For
a particular Le (Le =1), with increase in length of the packed tower from 0 to 0.4 m, the enthalpy
of the air decreases by 36% in the dehumidifier and increases by 168% in the regenerator. The
variation of specific humidity of the process air along the length of the dehumidifier and
regenerator for different Lewis numbers is shown in Fig. 6.11b. It is seen from Fig. 6.11b that
at a particular length with increase in Le, the specific humidity of air increases in the
dehumidifier and decreases in the regenerator. This is because as the Le increases, moisture
transfer rate at the air – desiccant interface decreases and subsequently, change in air specific
humidity takes place. At a particular length (L = 0.2 m), with increase in Le from 0.5 to 1.5,
air specific humidity in the dehumidifier increases by 51.6% and decreases in the regenerator
by 46.1%.
46
46.2
46.4
46.6
46.8
47
45.6
45.7
45.8
45.9
46
46.1
46.2
0 0.1 0.2 0.3 0.4 0.5
Con
cen
trati
on
of
solu
tion
(R
) (
%)
Co
ncen
tra
ion
of
solu
tio
n (
D)
(%)
Height (m)
Regenerator (R)
Dehumidifier (D)
Le=0.5
Le =1
Le=1.5
TH-1963_146103001
Page 185
Cross Flow Dehumidifier/Regenerator
156
(a) (b)
(c)
Fig. 6.11, Influence of Le on the enthalpies of working fluid and specific humidity of air (a)
variation of air enthalpy along the length of the packed tower, (b) variation of air specific
humidity along the length of the packed tower and (c) variation of the desiccant enthalpy along
the height of the packed tower.
It is also found from Fig. 6.11b that for a particular Le, as the length increases, the air specific
humidity decreases in the dehumidifier and increases in the regenerator. It happens because
with increase in length, amount of moisture desorbed/absorbed from the air/desiccant in the
dehumidifier/regenerator increases. At Le = 1, as the length varies from 0 m to 0.4 m, the
decrease in air specific humidity in the dehumidifier is 44% whereas in the regenerator it
increases by 218%.
0
0.02
0.04
0.06
0.08
0.1
0.12
0
0.005
0.01
0.015
0.02
0 0.1 0.2 0.3 0.4
Sp
ecif
ic h
um
idit
y o
f air
(R
) (
kg/k
g)
Sp
ecif
ic h
um
idit
y o
f air
(D
) (k
g/k
g)
Length (m)
Regenerator (R)
Dehumidifier (D)
Le=0.5
Le =1
Le=1.5
400
500
600
700
800
900
700
710
720
730
740
750
760
0 0.1 0.2 0.3 0.4 0.5
En
thalp
y o
f so
luti
on
(R
) (
kJ/k
g)
En
thalp
y o
f so
luti
on
(D
) (k
J/k
g)
Height (m)
Regenerator (R)
Dehumidifier (D)
Le=0.5
Le =1
Le=1.5
TH-1963_146103001
Page 186
Cross Flow Dehumidifier/Regenerator
157
Fig. 6.11c illustrates, the influence of Le and height of the packed tower on the enthalpy of the
desiccant solution in the dehumidifier and regenerator. As observed from Fig. 6.11c, as Le
increases, the enthalpy of the desiccant solution decreases in the dehumidifier and increases in
the regenerator. This can be explained by the fact that as the Le increases, mass transfer rate
decreases and thereby, the heat absorbed/desorbed by the desiccant solution in the
dehumidifier/regenerator decreases. At a height of 0.275 m, the variation of Le from 0.5 to 1.5
leads to decrease in desiccant solution enthalpy by 1.6% in the dehumidifier and leads to
increase in the regenerator by 9.4%. It is also observed from Fig. 6.11c that for a given Le, as
the height increases, the enthalpy of the desiccant solution increases in the dehumidifier and
decreases in the regenerator. This variation is due to the increase in amount of heat transferred
between the desiccant and the air. At Le = 1, with increase in height from 0 m to 0.55 m, the
solution enthalpy increases by 3.15% in the dehumidifier and decreases by 16.4% in the
regenerator.
It is concluded from Fig. 6.11 that the variation of the outlet parameters is more prominent in
the regenerator as compared to the dehumidifier. This is due to higher heat and mass transfer
potentials of the regenerator. Further, it is also observed that Le is having dominant effect on
both air enthalpy and desiccant solution enthalpy.
6.5.3 Influence of Lewis number on condensation and evaporation rates
From Figs. 6.12a – 6.12d, it is observed that for a given inlet parameter, as the Le increases
from 0.5 to 1.5, both the condensation rate of the dehumidifier and the evaporation rate of the
regenerator decreases. This happens because with increase in the Le, potential for moisture
transfer decreases. This is due to decrease in vapor pressure difference between the air and
working fluid. It is also found from Fig. 6.12a – 6.12c that for a given air temperature of 28 οC,
air humidity ratio of 21 gv/kgda and desiccant concentration of 45%, increases in Le from 0.5
to 1.5, the condensation rate of the dehumidifier decreases by 45% and also the evaporation
rate of the regenerator decreases by 45%. From Fig. 6.12d, it is found that with increase in Le
from 0.5 to 1.5, the decrease in the condensation rate of the dehumidifier is about 47 % at a
desiccant temperature of 28 οC and the decrease in evaporation rate of the regenerator is about
37% at a desiccant temperature of 60 οC. It is observed from Fig. 6.12a – 6.12d that for a given
Le, with increase in the air humidity ratio, desiccant concentration and air temperature, the
condensation rate of the dehumidifier increases and it decreases with increase in the desiccant
TH-1963_146103001
Page 187
Cross Flow Dehumidifier/Regenerator
158
temperature. This is because of decrease in simultaneous heat and mass transfer potentials
across the air – desiccant interface.
(a) (b)
(c) (d)
Fig. 6.12, Influence of Le on the performances of dehumidifier and regenerator (a) variations
of evaporation and condensation rates with the inlet air specific humidity, (b) Variation of
evaporation and condensation rate with the air inlet temperature, (c) variation of evaporation
and condensation rates with the concentration of the solution and (d) variation of evaporation
and condensation rates with desiccant inlet temperature.
TH-1963_146103001
Page 188
Cross Flow Dehumidifier/Regenerator
159
From Fig. 6.12a – 6.12d, it is also found that for a specified Le, with increase in the air humidity
ratio, desiccant concentration and air temperature, the evaporation rate of the regenerator
decreases and it increases with increase in the desiccant temperature. At Le = 1, for a given air
and desiccant inlet parameters, with increase in air temperature from 24 οC to 32 οC, desiccant
concentration from 43% to 47% and air humidity ratio from 14.72 gv/kgda to 26.69 gv/kgda, the
condensation rate of the dehumidifier increases by 75%, 12.5% and 22.3 %, respectively
whereas the evaporation rate of the regenerator decreases by 28%, 10.1% and 26.14%,
respectively (Fig. 6.12a – 6.12c). It is found from Fig. 6.12d that for a given Le = 1, the increase
in the dehumidifier desiccant temperature from 23 οC to 31 οC, the condensation rate decreases
by 68% whereas with increase in the regenerator desiccant temperature from 55 οC to 63 οC,
the evaporation rate increases by 75%.
It should be noted that most of the researchers simulated the performances of the dehumidifier
and the regenerator, assuming Le as unity (Le = 1) (Jain et al. 2000; Liu et al. 2007; Donggen
et al. 2017). However, in the real situation it may vary from 0.5 to 1.5. First time, in this thesis,
Le has been varied from 0.5 to 1.5 for investigating the heat and mass transfer characteristics
of the liquid desiccant dehumidifier and regenerator. It is found that Le has significant effect
on condensation and evaporation of water vapour occurring in the dehumidifier and the
regenerator, respectively.
6.6 Summary
A two dimensional finite difference model has been developed for analyzing the variations of
air and desiccant properties and the rates of water evaporation and condensation in the packed
tower. In order to solve the developed model numerically, a recursive algorithm has been
proposed. The simulated results are in good agreement with the experimental results and as
well as the numerical prediction reported in the literature. The variation of air and desiccant
properties along the length and height of the packed tower (dehumidifier/regenerator) are
visualized through contour plots and it is found that these parameters will vary in both
transverse and longitudinal flow directions. The desiccant concentration variation along the
transverse direction is negligible whereas the air enthalpy, air specific humidity and desiccant
enthalpy have significant variation along their transverse directions. The influence of Le on
operating and performance parameters of the dehumidifier and regenerator and the influence
of inlet parameters on the performance of the packed tower are also investigated.
TH-1963_146103001
Page 189
TH-1963_146103001
Page 190
Entransy Analysis
161
CHAPTER – 7
ENTRANSY ANALYSIS
In this chapter, entransy dissipation theory of the liquid desiccant regenerator is introduced.
Expressions are derived for entransy dissipation along the liquid desiccant regenerator. A
concept of entransy efficiency of the regenerator is presented. Further, the present study
highlights the importance of entransy dissipation occurring in an adiabatic regenerator.
7.1 Entransy analysis model
Entransy is a newly defined parameter which evaluates the transport ability of heat and also, it
is used for optimizing the heat transfer process (Guo et al. 2007; Xia et al. 2009). The
relationship between the latent entransy dissipation due to irreversible mass transfer process
and sensible entransy dissipation due to irreversible heat transfer process is shown in Fig. 7.1a.
During the coupled heat and mass transfer processes in the liquid desiccant regenerator, there
will always be a vapour pressure difference and temperature difference between the ambient
air and the liquid desiccant due to latent and sensible heat dissipations existing in the system.
Thus, in order to evaluate the latent and sensible heat dissipation capabilities due to irreversible
heat and mass transfer processes, entransy is chosen as a performance tool.
TH-1963_146103001
Page 191
Entransy Analysis
162
(a) Entransy dissipiation due to sensible and latent heats
(b) Qen – h chart
Fig. 7.1, Entransy dissipation process along the liquid desiccant regenerator.
Fig. 7.1b shows the overall entransy dissipation capability (ΔQen) of counter – flow liquid
desiccant regenerator using Qen – h chart. Assuming thermo – physical properties of the air and
desiccant solution as constant, the air and desiccant solution entransy dissipation for a given
air and solution enthalpy is plotted. In order to evaluate the overall entransy dissipation during
coupled heat and mass transfer processes between the liquid desiccant and the ambient air, this
Qen – h chart is used.
The entransy dissipation for analyzing the heat transfer potential of the given system is
expressed as (Guo et al. 2007; Xia et al. 2009; Zhang et al. 2016)
TH-1963_146103001
Page 192
Entransy Analysis
163
0
( , )
T
en e eQ T Q Q dT
(7.1)
As Qe = Qes + Qel = s lm m ; for sensible and latent heat generation processes, Eq. 7.1 can
be formulated as
0 0
( , )
T T
en e s lQ T Q m dT dT
(7.2)
where ϕs and ϕl denotes the sensible and latent enthalpies (kJ/kg).
For analyzing the entransy dissipation of moist air and desiccant solution flowing along the
liquid desiccant regenerator, Eq. 7.2 can be reformulated as
Moist air:
, , ,
0 0
( , )a aT T
en a a e a a p a a a a aQ T Q m C T dT dT
, , ,T &a as a p a l aC
(7.3)
or: 21
, , ,2( , )en a a e a a p a a a a aQ T Q m C T m T
(7.3a)
Desiccant solution:
, , ,
0 0
, , ,( , ) T &s sT T
en s s e s s p s s s s s s ss s p s l sQ T Q m C T dT dT C
(7.4)
or: 21
, , ,2( , )en s s e s s p s s s s sQ T Q m C T m T (7.4a)
7.1.1 Entransy dissipation in the liquid desiccant regenerator
The overall entransy dissipation during coupled heat and mass transfer processes between the
liquid desiccant and the ambient air is defined as (see Fig. 7.1b),
, , , ,
i i o o
eno en s en a en a en sQ Q Q Q Q (7.5)
TH-1963_146103001
Page 193
Entransy Analysis
164
where,
21, ,2
i i i i
en a a p a a a a aQ m C T m T (7.5a)
21, ,2
o o o o
en a a p a a a a aQ m C T m T (7.5b)
21, ,2
i i i i
en s s p s s s s sQ m C T m T (7.5c)
21, ,2
o o o o
en s s p s s s s sQ m C T m T (7.5d)
7.1.2 Entransy efficiency
The ratio of overall entransy dissipation to the inlet entransy dissipation of the hot fluid within
a system is termed as entransy efficiency (Gu and Gan, 2014). For the liquid desiccant
regenerator, it is introduced as
,
,
1
o
en s
en i
en s
Q
Q
(7.6)
7.2 Entransy analysis of the liquid desiccant regenerator
Entransy analysis model developed in the above section is adopted for analyzing the entransy
dissipation along the liquid desiccant regenerator. The experimental data reported by Fumo and
Goswami (2002) is chosen for entransy analysis of the liquid desiccant regenerator. The latent
heat of vaporization (φ) is assumed to be constant at 2346 kJ/kg for a given desiccant
temperature and concentration encountered in the system (Gandhidasan, 2005). Overall
entransy analysis results of the liquid desiccant regenerator are presented in Table 7.1a. It is
observed that overall entransy dissipated is in the range of 4 × 10³ – 10 × 103 kW–K. Also,
entransy efficiency of the liquid desiccant regenerator is in the range of 16 – 27 %.
7.2.1 Entransy analysis along the height of the liquid desiccant regenerator
As discussed in Section 5.1.4, for analysing the entransy dissipation along the height of the
counter – flow liquid desiccant regenerator, the desiccant temperature and specific humidity
are varied simultaneously by keeping the rest of the operating parameters as constant (air and
TH-1963_146103001
Page 194
Entransy Analysis
165
desiccant flow rates, air temperature and desiccant concentration are kept constant). Based on
the aforementioned variation of operating parameters, the experiment no. 10 and 6 from Table
– 7.1a are taken as inlet condition – I and inlet condition – II for entransy analysis along the
height of the liquid desiccant regenerator. During this analysis, the desiccant temperature is
increased from 60.3 °C to 65 .2 °C and the specific humidity is decreased from 18.7 gwv/kgda
to 14.3 gwv/kgda simultaneously by keeping rest of operating parameters as constant. The height
of the liquid desiccant regenerator is taken as 0.6 m (Fumo and Goswami 2002).
Table 7.1a, Entransy analysis of liquid desiccant regenerator (Fumo and Goswami, 2002).
Exp. ṁa 𝑇𝑎𝑖 ωi ṁs 𝑇𝑠
𝑖 βi ∆Qen,o ηen
no. (kg/s) (°C) (gwv/kgda) (kg/s) (°C) (kgLiCl/kgsol.) (kW – K × 103) (%)
1 0.039 30.4 18.3 0.30 65 34 4.89 16.0
2 0.052 30.1 18 0.29 65.1 34.1 5.28 16.1
3 0.068 29.8 17.7 0.30 65.1 34.5 6.26 19.0
4 0.052 35.1 18 0.30 65.1 33.4 5.30 19.8
5 0.052 40 17.8 0.30 65 33.6 5.04 20.8
6 0.053 30.2 14.3 0.30 65.2 34 5.73 19.4
7 0.052 29.4 21 0.30 65.5 33.6 5.52 16.6
8 0.052 30.3 18.2 0.24 65.4 34.4 5.05 19.4
9 0.052 29.9 18 0.35 65.2 34.3 6.53 17.8
10 0.052 30 18.7 0.29 60.3 34.4 3.53 11.7
11 0.051 29.7 18.4 0.30 70 34.5 9.68 26.5
12 0.052 29.7 17.7 0.30 64.8 32.8 5.44 18.9
13 0.052 30.3 18.2 0.30 65 34.9 5.76 18.1
The overall sensible and latent entransy dissipations along the height of the liquid desiccant
regenerator for inlet conditions I & II are shown in Fig. 7.2. As the regenerator height increases,
overall latent and sensible entransy dissipations also increase for both the inlet conditions. This
is due to the fact that as the tower height increases, the temperature difference between the
desiccant solution and the ambient air decreases and the specific humidity difference between
the ambient air and saturated air also decreases, thereby decreasing the irreversible latent and
sensible heat transfers and increasing the sensible and latent entransy dissipation capabilities.
TH-1963_146103001
Page 195
Entransy Analysis
166
(a) Inlet condition – I (b) Inlet condition – II
Fig. 7.2, Overall latent and sensible entransy dissipations along the height of the regenerator.
By comparing the inlet conditions – I and II (Fig. 7.2a and 7.2b), it is found that the overall
latent and sensible entransy dissipations are high in case of inlet condition – II compared with
inlet condition – I. This is due to high potential for energy exchange in condition – II compared
to condition – I. From Fig. 7.2, it is found that, for inlet condition – I and II, with increase in
tower distance along the height of the packed tower, the increment in overall sensible entransy
dissipations are observed to be 3% and 4 % whereas an increment in overall latent entransy
dissipations are observed to be 24% and 32%, respectively. From this analysis, it is observed
that with increase in height, the percentage increment in overall latent entarnsy dissipation is
high compared to sensible entransy dissipation. This is due to decrease in evaporation process
with increase in tower height.
Table 7.1b, Performance comparison between inlet condition – I (Exp. no. – 10 in Table 7.1a)
and inlet condition – II (Exp. no. – 6 in Table 7.1a)
Inlet condition – I Inlet condition – II %increment %decrement
∆Qen,o (kW – K × 103) 3.53 5.73 38 –
ηen (%) 11.7 19.4 40 –
From Table 7.1b and Fig. 7.2, it is concluded that by increasing the desiccant temperature and
decreasing the specific humidity of the regenerator, entransy dissipation along the liquid
desiccant regenerator will increase.
TH-1963_146103001
Page 196
Entransy Analysis
167
7.2.2 Influence of operating parameters on entransy efficiency of the regenerator
(a) (b)
(c) (d)
(e) (f)
Fig. 7.3 – Influence of air and desiccant parameters on entransy efficiency of the liquid desiccant
regenerator: (a) Air flow rate, (b) air humidity ratio, (c) Air temperature, (d) desiccant flow rate,
(e) desiccant concentration and (f) desiccant temperature.
TH-1963_146103001
Page 197
Entransy Analysis
168
It is found from Fig. 7.3a and Table 7.2 that the regenerator entransy efficiency increases with
increase in air flow rate. This happens because, as the air flow rate increases, less vapour
transfer from the desiccant solution to the ambient air takes place. Therefore, the sensible and
latent heat transfer capabilities between the ambient air and desiccant solution increases and
this results in increase of entarnsy efficiency. With decrease in air humidity ratio and increase
in air and desiccant temperatures, the entransy efficiency increases (Fig. 7.3a – 7.3c, 7.3f) and
Table 7.2). It can be explained by the fact that when the humidity ratio decreases and air and
desiccant temperatures increase, the sensible and latent heat dissipation capabilities existing in
the regeneration system increase, thereby increasing the regenerator entarnsy efficiency. As the
desiccant flow rate increases, the entarnsy efficiency decreases (Fig. 7.3d and Table 7.2). This
happens because as the desiccant flow rate increases, the desiccant solution will be in contact
with the ambient air for shorter duration, maintaining higher potential for latent and sensible
heat transfer processes. As a consequence, latent and sensible entransy dissipations decrease.
With increase in desiccant concentration, the change in entransy efficiency is negligible (Fig.
7.3e and Table 7.2).
Table 7.2, Influence of operating parameters on entransy efficiency of the regenerator (Fig.
7.3).
Range ηen
% increment/
decrement
Air flow rate (kg/s) ( ) 39.2 – 67.6 19
Desiccant flow rate (kg/s) ( ) 0.24 – 0.35 9
Air humidity ratio (gwv/kgda) ( ) 14 – 21 17
Desiccant concentration (kgLiCl/kgsol.) ( ) 32.8 – 34.9 –
Air temperature (°C) ( ) 30.1 – 40 29
Desiccant temperature (°C) ( ) 60.3 – 70 126
*( ) – Increment; ( ) – Decrement; ( ) – Intermediate (no change);
7.3 Summary
Entransy analysis model has been developed for analysing the performance of the liquid
desiccant regeneration system. With the simplified expressions formulated in the present work,
entransy dissipation due to irreversible sensible and latent loads is quantified. A new concept
of entransy efficiency of the regenerator has been introduced. Entransy dissipation along the
TH-1963_146103001
Page 198
Entransy Analysis
169
height of the liquid desiccant regenerator is quantified during coupled heat and mass transfer
processes. The influence of air and desiccant temperatures, air and desiccant flow rates, air
humidity ratio and desiccant concentration on entransy efficiency of the liquid desiccant
regenerator is also investigated.
TH-1963_146103001
Page 199
TH-1963_146103001
Page 200
Conclusions and Future Scope
171
CHAPTER – 8
CONCLUSIONS AND FUTURE SCOPE
This chapter outlines the major conclusions drawn from the numerical, experimental, energy
and exergy analyses of the liquid desiccant dehumidification/regeneration system and
evacuated U – tube solar collector system. Further, key observations made from the entransy
dissipation theory of the liquid desiccant regenerator are also summarized.
8.1 Liquid desiccant dehumidification/regeneration system
8.1.1 Numerical studies
Developed the thermal models for counter and cross-flow liquid desiccant
dehumidifier/regenerator for analysing the heat and mass transfer aspects at the air – desiccant
interface. Introduced backtracking and recursive algorithms for solving the developed thermal
models of the counter and cross-flow liquid desiccant dehumidifier/regenerator, respectively.
Derived expressions for heat and mass transfer coefficients in terms of thermal and moisture
effectiveness. Plotted distribution contours for analysing the heat and mass transfer
characteristics along the height of the liquid desiccant dehumidifier/regenerator and observed
that condensation/evaporation rate decreases along the ambient air flow direction. Further,
theoretically analysed the effect of Lewis number and inlet parameters on the performance of
the liquid desiccant dehumidifier/regenerator. The key observations from the performance
analysis are as follows:
TH-1963_146103001
Page 201
Conclusions and Future Scope
172
With increase in Le, the variation in air and desiccant properties is more prominent in the
regenerator compared to the dehumidifier. This is because of high temperature difference
and vapour pressure difference at the air – desiccant interface of the dehumidifier.
With increase in Le from 0.5 to 1.5, condensation rate in the dehumidifier and the
evaporation rate in the regenerator decreases. It is due to decrease in mass transfer between
the air and the desiccant solution.
In order to improve the performance of the liquid desiccant dehumidifier and regenerator,
the Le should be maintained less than one (Le < 1).
It is found that the variation of Le has a significant effect on the air enthalpy and humidity
ratio and desiccant enthalpy in the packed tower and has an insignificant effect on the
desiccant concentration in the packed tower.
At Le = 1, with decrease in air specific humidity from 26.7 gv/kgda to 14.7 gv/kgda and air
temperature from 32 οC to 24 οC, condensation rate in the dehumidifier decreases by 22.3
% and 75 %, respectively whereas with decrease in desiccant temperature from 31 οC to 23
οC, it increases by 68 %.
At Le = 1, with decrease in air specific humidity from 26.7 gv/kgda to 14.7 gv/kgda and air
temperature from 32 οC to 24 οC, evaporation rate in the regenerator increases by 28% (for
both the cases) whereas with decrease in desiccant temperature from 63 οC to 55 οC, it
decreases by 75%.
8.1.2 Experimental studies
In accordance with humid subtropical climate, an experimental investigation is carried out with
the fabricated liquid desiccant dehumidification/regeneration system using LiCl as liquid
desiccant. Further, developed an experimental correlation for specific humidity ratio difference
in terms of inlet parameters. From the experimental analysis, following important observations
are made;
With increase in relative humidity, solution enthalpy and air specific humidity has
significant impact on performance of the dehumidification system whereas in the
regeneration system, solution enthalpy, air specific humidity and air enthalpy has a
significant impact.
From the developed correlations for specific humidity difference of dehumidification and
regeneration systems, it is observed that with increase in L/G ratio, from 0.8 to 3.9, the
TH-1963_146103001
Page 202
Conclusions and Future Scope
173
vapour transfer between the desiccant solution and the ambient air decreases by 51% and
58% during dehumidification and regeneration processes, respectively.
In order to increase the latent heat of condensation in the dehumidification system and
latent heat of evaporation in the regeneration system, the Lewis number (Le) needs to be
less than one and L/G ratio should be maintained as low as possible.
For a given operating conditions, it is found that as the relative humidity increases from
63% to 87%, and decreases by 39% in the dehumidification and regeneration systems,
respectively.
During maximum vapour transfer process in the dehumidification and regeneration
systems, the latent energy exchange between the desiccant solution and ambient air is
predominant than sensible energy exchange.
8.1.3 EEE analyses of liquid desiccant regenerator
Energy, exergy and entransy (EEE) models have been developed for analysing the performance
of the liquid desiccant regeneration system. With the simplified expressions formulated in the
present work, energy required for regeneration of the liquid desiccant, exergy destroyed with
respect to reference state and entransy dissipation due to irreversible sensible and latent loads
are quantified. A new concept of entransy efficiency of the regenerator has been introduced.
Energy exchange, exergy loss and entransy dissipation along the height of the liquid desiccant
regenerator are quantified during coupled heat and mass transfer processes. The influence of
air and desiccant temperatures, air and desiccant flow rates, air humidity ratio and desiccant
concentration on desorption, entransy and exergy efficiencies of the liquid desiccant
regenerator are also investigated. The major conclusions from EEE analyses of the regeneration
system are as follows:
With increase in regenerator height, the air temperature, humidity ratio and exergy
destruction of the air increase whereas the desiccant temperature, water content in the
desiccant solution and exergy destruction of the solution decrease. Also, the latent and
sensible entransy dissipation capabilities due to irreversible heat and mass transfer process
are also found to increase.
It is observed that by increasing the desiccant inlet temperature from 60.3 °C to 65.2 °C
and decreasing the air inlet humidity ratio from 18.7 gwv/kgda to 14.3 gwv/kgda
simultaneously, potential for energy exchange between the desiccant solution and air
increases by 26% and overall entransy dissipation and exergy destruction in the liquid
TH-1963_146103001
Page 203
Conclusions and Future Scope
174
desiccant regenerator increase by 39% and 37%, respectively. Also, the exergy efficiency
of the regenerator decreases by 10% whereas the entransy and desorption efficiencies of
the regenerator increase by 27% and 40%, respectively.
By investigating the influence of operating parameters on desorption, exergy and entransy
efficiencies of the regenerator, it has been concluded that the desiccant temperature has a
more significant influence on the performance of the regeneration system compared to
other operating parameters.
8.2 Evacuated U – tube solar collector system
8.2.1 Numerical studies
Developed three dimensional thermal model for analysing the heat transfer process occurring
across the evacuated U – tube solar collector and introduced a time dependent three
dimensional model for analysing the thermal process occurring along the evacuated U – solar
collector system. Numerically predicted the performance of the individual evacuated U – tube
solar collector and whole evacuated U – tube collector bundle connected in series. By
employing filler material theoretically investigated the heat transfer enhancement along the
evacuated U – tube solar collector. From the numerical studies following conclusions are
drawn.
Copper is the best material compared to brass and aluminium as a fin material and water is
better than air as working fluid.
For a given U–tube material, with increase in flow rate, the useful heat absorption capacity
increases. It is observed that by increasing the flow rate from 0.01 to 0.05 kg/s, the net heat
absorption rate of copper increases by 84 % for water as working fluid and 82.5 % for air
as working fluid.
The performance of low thermal conductive U–tube material can be improved by
increasing the flow rate of the working fluid.
For a given flow rate, a high collector efficiency is achieved for water and copper as
working fluid and U–tube material combination and a low collector efficiency is achieved
for air and brass as working fluid and U–tube material combination. For the aforementioned
working fluid and U–tube material combination, the higher/lower collector efficiency is
attained to be 76%/24%.
Compared to magnesium oxide and aluminium oxide filler material, graphite filler yields
higher efficiency. Employing graphite as filler material in between the evacuated tube
TH-1963_146103001
Page 204
Conclusions and Future Scope
175
absorber surface (fin) and the U–tube, the thermal efficiency of the existing evacuated tube
solar collector is increased by 15.3%.
8.2.2 Experimental studies
Designed and fabricated an evacuated U – tube solar collector system and experimentally
investigated the performance of this system in accordance with humid subtropical climate.
Developed an experimental correlation for working fluid transition time as a function of
process parameters. By investigating the performance of the evacuated U – tube solar collector
system experimentally, following important observations are made;
Solar intensity, working fluid flow rate and working fluid inlet temperature have significant
influence on useful heat gained by the working fluid flowing inside an evacuated U – tube
solar collector. Whereas, the ambient temperature does not have any significant effect on
useful heat flux.
For a given range of operating parameters, increasing the number of manifolds (integrated
with ten evacuated U – tubes) connected in series will provide higher temperature raise at
high solar intensity, lower working fluid inlet temperature and higher flow rate of working
fluid.
In accordance with humid subtropical climate, the maximum working fluid (water)
temperature difference between the inlet and exit of each manifold was observed as 6.1 οC.
Within the range of operating parameters investigated, the maximum working fluid
transition time in an evacuated U – tube was recorded as 327 s.
From the developed correlation for working fluid transition time, it is observed that the
ambient temperature has an insignificant effect on the variation of transition time compared
to other operating parameters such as solar intensity and working fluid inlet temperature
and flow rate.
8.2.3 Energy and exergy analyses
Developed two experimental correlations for energy efficiency and exergy efficiency as a
function of process parameters. Energy and exergy analyses of the individual evacuated U –
tube solar collector and whole solar collector system are analysed and following conclusions
are drawn;
TH-1963_146103001
Page 205
Conclusions and Future Scope
176
Within the range of parameters varied, the maximum energy efficiency of the evacuated U
– tube solar collector was found to be 72 % at a lower normalized heat gain of 0.8 (m2 –
K/kW). The average energy efficiency of the solar collector was observed as 51%.
Influences of solar intensity and working fluid flow rate on energy efficiency of the
evacuated U – tube solar collector is prominent compared to ambient and working fluid
temperatures.
During a sunny day, the peak energy efficiency of 52 % was observed in between 1: 00 PM
– 3: 00 PM whereas low energy efficiency of 31 % was observed at 8:30 AM and 5: 30 PM
for the evacuated U – tube solar collector system.
The exergy efficiency of the evacuated U – tube solar collector and the solar collector
system increase as the time progress. The exergy destruction of the evacuated U – tube
solar collector and the solar collector system is high at 8: 30 AM.
In a humid subtropical climatic conditions, the average estimated energy and exergy
efficiencies of the evacuated U – tube solar collector system during a sunny day are 43 %
and 41 %, respectively.
8.3 Future scope
The work presented in the thesis opens up several opportunities to broaden the research work
on solar driven liquid desiccant ACS components (Liquid desiccant dehumidifier, liquid
desiccant regenerator and evacuated U – tube solar collector). The scope of future work is
outlined is as follows:
8.3.1 Liquid desiccant dehumidification system
This system can be alternatively used in solar dryer applications.
Hybrid systems can be formed by integrating with solid desiccant based dehumidification
system or with another liquid desiccant based dehumidification system for deep drying
applications.
Thermal model can be extended considering the pressure drop across the packed tower.
8.3.2 Liquid desiccant regeneration system
Liquid desiccant regeneration system can be integrated with the waste heat recovery heat
exchanger for air preheating purposes.
TH-1963_146103001
Page 206
Conclusions and Future Scope
177
This system can be integrated with heat storage system (using low/medium scale heat
storage materials) for waste heat recovery.
Hybrid systems can be formed by integrating with solid desiccant based dehumidification
system or with another liquid desiccant based dehumidification system for solar dryer
applications.
Thermal model can be extended considering the pressure drop across the packed tower.
8.3.3 Evacuated U – tube solar collector system
Performance of these systems can be improved by integrating with parabolic reflector as
well as by using novel U – tube designs.
For increasing the instantaneous working fluid heat gain, no. of manifolds can be connected
in series.
Instead of evacuated U – tubes connected in parallel to the manifold, they can also be
integrated in series for maximizing the instantaneous working fluid heat gain.
For heating more amount of working fluid at less time, the manifolds can be connected in
parallel.
8.3.4 Liquid desiccant materials
The liquid desiccant materials such as potassium formate, potassium acetate, lithium
nitrate, magnesium chloride, sodium formate and sodium sulphate can be used for
dehumidification purpose.
Composite materials (mixing of two or three desiccants) may be also explored for
improving vapour absorption capability.
There are many natural liquid desiccant materials; research needs to be carried out to utilise
these desiccant materials.
TH-1963_146103001
Page 207
TH-1963_146103001
Page 208
References
179
REFERENCES
Ameel TA, Gee KG, Wood BD (1995) Performance predictions of alternative, low cost
absorbents for open-cycle absorption solar cooling, Solar Energy, vol. 54, pp. 65–73.
Ataee S, Ameri M (2015) Energy and exergy analysis of all-glass evacuated solar collector
tubes with coaxial fluid conduit, Solar Energy, vol. 118, pp. 575 – 591.
Al-Farayedhi AA, Gandhidasan P, Al-Mutairi MA (2002) Evaluation of heat and mass
transfer coefficients in a gauze-type structured packing air dehumidifier operating with
liquid desiccant, International Journal of Refrigeration, vol.25, pp. 330–339.
ASHRAE fundamentals (1989) Atlanta, Georgia: American Society of Heating, Refrigerating
and Air-Conditioning Engineers.
Ayala JAA, Rodriguez GM, Nunez MP, Ramirez ARU, Munoz AG (2015) Numerical study
of a low temperature water-in-glass evacuated tube solar collector, Int. J. Energy Convers
Manage., vol. 94, pp. 472–481.
Amir R, Davoud B (2013) Mathematical modeling of a packed-bed air dehumidifier: The
impact of empirical correlations. Journal of Petroleum Science and Engineering, vol. 108,
pp. 222 – 229.
Bravo JL, Rocha JA, Fair JR (1985) Mass transfer in gauze packing’s, Hydrocarbon
Processing, vol.64, pp. 91-105.
Babakhani D, Soleymani M (2010) Simplified analysis of heat and mass transfer model in
liquid desiccant regeneration process. Journal of the Taiwan Institute of Chemical
Engineers, vol. 41, pp. 259–267.
Badar AW, Buchholz B, Ziegler F (2011) Experimental and theoretical evaluation of the
overall heat loss coefficient of vacuum tubes of a solar collector, Int. J. Solar Energy, vol.
85, pp. 1447–1456.
Chen LC, Kuo CL, Shyu RJ (1989) The performance of a packed bed dehumidifier for solar
liquid desiccant systems, Annual Solar Energy Conference, California, pp. 371-377.
TH-1963_146103001
Page 209
References
180
Chen XY, Jiang Y, Li Z, Qu KY (2005) Field study on independent dehumidification air-
conditioning system – I: performance of liquid desiccant dehumidification system.
ASHRAE Transactions vol.111, pp. 271–76.
Chen G, Liu C, N. Li, F. Li (2017) A study on heat absorbing and vapour generating
characteristics of H2O/LiBr mixture in an evacuated tube, Applied Energy ,vol.185,pp.
294 – 299.
Chung TW, Lai CH, and Wu H (1999) Analysis of Mass Transfer Performance in an Air
Stripping Tower, Separation Science and Technology, vol.34, pp.2837-2851.
Conde MR (2004) Properties of aqueous solutions of lithium and calcium chlorides:
formulations for use in AC equipment design, Int. J. Thermal Sciences vol. 43,pp. 367–
382.
Coellner J (1986) Energymaster—Desiccant Cooling in the Marketplace, Desiccant Cooling
and Dehumidification Opportunities for Buildings Workshop, Chattanooga, TN.
Dai YJ, Zhang HF (2004) Numerical simulation and theoretical analysis of heat and mass
transfer in a cross-flow liquid desiccant air dehumidifier packed with honeycomb paper,
Energy Conversion and Management, vol.45, pp.1343-1356.
Daghigh R, Shafieian A (2016) Energy – exergy analysis of a multipurpose evacuated tube
heat pipe solar water heating – drying system, Experimental Thermal and Fluid Science
vol. 78, pp. 266 – 277.
Daou K, Wang RZ, Xia ZZ (2006) Desiccant cooling AC: a review, Renewable and
Sustainable Energy Reviews, vol.85, pp. 55–77.
Davoud B, Meysam S (2009) An analytical solution for air dehumidification by liquid
desiccant in a packed column, International Common Heat Mass, vol.36, pp. 969–77.
Datta N, Chakraborty A, Ali SM, Choo FH (2017) Experimental investigation of multi-
effect regenerator for desiccant dehumidifier: Effects of various regeneration
temperatures and solution flow rates on system performances. Int. J. Refrigeration,
vol.76, pp. 7 – 18.
Donggen P, Junming Z, Danting L (2017) Exergy analysis of a liquid desiccant evaporative
cooling system. Int. J. Refrigeration,vol. 82,pp. 495 – 508.
TH-1963_146103001
Page 210
References
181
Derringer G, Suich R (1980) Simultaneous Optimization of Several Response Variables,
Journal of Quality Technology, vol.12, pp.214–219.
Dincer I, Rosen MA, (2007) Exergy, Energy, Environment and Sustainable Development, 1st
ed., Elsevier, UK.
Diaz G (2010), Numerical investigation of transient heat and mass transfer in a parallel-flow
liquid-desiccant absorber, Heat and Mass Transfer, vol. 46, pp. 1335 – 1344.
Deng J, Wang RZ, Han GY (2011) A review of thermally activated cooling technologies for
combined cooling, heating and power systems, Progress in Energy and Combustion
Science vol.37 pp. 172-203.
Ducool, <www.ducool.com> (retrieved April 2015).
Eberlein MB (1976) Analysis and Performance Predictions of Evacuated Tubular Solar
Collectors using Air as the Working Fluid, University of Wisconsin.
Elsarrag E, Ali EEM, Jain S (2005) Design Guidelines and Performance Study on a
Structured Packed Liquid Desiccant ACS, HVAC & R Research, 11 319–337.
Factor HM, Grossman G (1980) A packed bed dehumidifier/ regenerator for solar AC with
liquid desiccants Solar Energy, vol.24, pp. 541–550.
Fang Y, Guo J, Li D, Gao X (2011) Chacterisation of rare earth modified zeolites for
dehumidification, Chemcial Engineering Journal (Chinese), vol.6, pp. 25–29.
Fumo N, Goswami DY, (2002) Study of an aqueous lithium chloride desiccant system: Air
dehumidification and desiccant regeneration,Solar Energyvol.72, pp. 351–361.
Factor HM, Grossman G (1980) A packed bed dehumidifier/regenerator for solar AC with
liquid desiccants, Solar Energy, vol. 24, pp. 541–550.
Farjallah R ,Chaabane M ,Mhiri H, Bournot P, Dhaouadi H (2016) Thermal performance
of the U – tube solar collector using computational fluid dynamics simulation, Journal of
Solar Energy Engineering, ASME Transactions, vol. 138, pp. 1– 8.
Farayedhi AA, Gandhidasan P, Al-Mutairi MA (2002) Evaluation of heat and mass transfer
coefficients in a gauze-type structured packing air dehumidifier operating with liquid
desiccant. Int. J. Refrigeration, vol.25, pp. 330 – 339.
TH-1963_146103001
Page 211
References
182
Gandhidasan P (2004) A simplified model for air dehumidification with liquid desiccant,
Solar Energy vol.76, pp. 409-416.
Gandhidasan P, (2005) Quick performance prediction of liquid desiccant regeneration in a
packed bed, Solar Energyvol.76, pp. 409–416.
Gao WZ, Liu JH, Cheng YP (2012) Experimental investigation on the heat and mass transfer
between air and liquid desiccant in a cross-flow dehumidifier, Renew. Energy, vol.37,
pp.117–123.
Gao Y, Fan R, Zhang XY, An YJ, Wang MX, Gao YK, Yu Y (2014) Thermal performance
and parameter analysis of a U-pipe evacuated solar tube collector, Int. J. Solar energy,
vol. 107, pp. 714-727.
Gautam A, Chamoli S, Kumar A, Singh S (2017) A review on technical improvements,
economic feasibility and world scenario of solar water heating system, Renewable and
Sustainable Energy Reviews , vol. 68, pp. 541 – 562.
Genius, <www.geniusac.com> (retrieved April 2015).
Gershon G, Alex J (1981) Solar cooling and AC, Energy Combustion Science journal, vol.7,
pp. 185-228.
Ghafoor A, Munir A (2015) Worldwide overview of solar thermal cooling technologies
Renewable and Sustainable Energy Reviews vol.43 pp.763-774.
Gommed K, Grossman G (2004) A Liquid Desiccant System for Solar Cooling and
Dehumidification, Journal of Solar Energy Engineering vol.126 pp. 879-885.
Guo ZY, Zhu HY, and Liang XG (2007) Entransy—A physical quantity describing heat
transfer ability, Int. J. Heat Mass Transfervol.50, pp. 2545–2556.
Gu J, Gan Z (2014) Entransy in phase – change systems, Springer Briefs in Thermal
Engineering and Applied Science, pp. 11 – 19.
Gurubalan A, Maiya MP, Tiwari S (2017) Performance characterization of membrane
dehumidifier with desiccants in flat-plate arrangement. Energy and Buildings, vol. 156,
pp. 151 – 162.
TH-1963_146103001
Page 212
References
183
Ha CX, Dai YJ, Wu JY, Wang RZ (2006) Experimental comparison of two honeycombed
desiccant wheels fabricated with silica gel and composite desiccant material, Energy
Conversion and Management, vol.47, pp. 2523–2534.
Hamed AM (2003) Desorption characteristics of desiccant bed for solar
dehumidification/humidification ACSs, Renewable Energy, vol.28, pp. 2099-2111.
Huang S, Lv Z, Liang C, Zhang X (2017) Experimental study of heat and mass transfer
characteristics in a cross-flow heating tower, Int. J. Ref., vol. 77, pp. 116 – 127.
Harding G, Zhiqiang Y, Mackey DW (1985) Heat extraction efficiency of a concentric glass
tubular evacuated collector, Int. J. Solar Energy, vol. 35, pp. 71–79.
Hazami M, Naili N, Attar I, Farhat A (2013) Solar water heating systems feasibility for
domestic requests in Tunisia: thermal potential and economic analysis, Int. J. Energy
Convers Manage., vol. 76, pp. 599–608.
Islam MR,Alan SWL, Chua KJ (2018) Studying the heat and mass transfer process of liquid
desiccant for dehumidification and cooling, Applied Energy, vol. 221, pp. 334 – 347.
Jain S, Dhar PL, Kaushik SC (1994) Evaluation of liquid desiccant based evaporative cooling
cycles for typical hot and humid climates, Heat Recovery System and CHP vol.14, pp.
621-632.
Jain S, Dhar PL, Kaushik SC (2000) Experimental studies on the dehumidifier and
regenerator of a liquid desiccant cooling system, Applied Thermal Engineering, vol.20,
pp. 253-267.
Jain S, Bansal PK (2007) Performance analysis of liquid desiccant dehumidification systems,
Int. J. Refrigeration, vol.30, pp. 861-872.
Jilier, Jilier Science and Technology Co. Ltd., China, <www.jilier.com/eng2.asp> (retrieved
April 2015).
Kathabar, <www.kathabar.com> (retrieved April 2015).
Kaya H, Arslan K, Elturgal N (2018) Experimental investigation of thermal performance of
an evacuated U-Tube solar collector with ZnO/Ethylene glycol-pure water Nano fluids,
Renewable Energy, vol.122, pp. 329 – 338.
TH-1963_146103001
Page 213
References
184
Koronaki IP, Christodoulaki RI, Papaefthimiou VD, Rogdakis ED (2013) Thermodynamic
analysis of a counter-flow adiabatic dehumidifier with different liquid desiccant
materials, Applied Thermal Engineering, vol. 50, pp. 361 – 373.
Killion JD, Garimella S (2001) A critical review of models of coupled heat and mass transfer
in falling-film absorption, Int. J. Refrigeration, vol. 24, pp. 755–797.
Kim H, Ham J, Park C, Cho H (2016) Theoretical investigation of the efficiency of a U-tube
solar collector using various nanofluids, Energy ,vol.94,pp. 497 – 507.
Kim H, Kim J, Cho H (2017) Experimental study on performance improvement of U-tube
solar collector depending on nanoparticle size and concentration of Al2O3 nanofluid,
Energy, vol. 118, pp. 1304 – 1312.
Kline S J, Clintock MC (1953) Describing uncertainties in single – sample experiments,
Journal of Mechanical Engineering pp. 3 – 12.
Khan AY, Sulsona FJ (1998) Modelling and parametric analysis of heat and mass transfer
performance of refrigerant cooled liquid desiccant absorbers, International Journal
Energy, vol.22, pp.813–832.
Khan AY, Ball HD (1992) Development of a generalized model for performance
evaluation of packed-type liquid sorbent dehumidifiers and regenerators.
ASHRAE Trans. Vol.98, pp. 525 – 533.
Khan AY (1994) Sensitivity analysis and component modelling of a packed type liquid
desiccant system at partial load operating conditions. Int. J. Energy Re, vol.18, pp. 643
– 655.
Khan AY, Martinez JL (1998) Modelling and parametric analysis of heat and mass transfer
performance of a hybrid liquid desiccant absorber. Energy Conversion Management, vol.
39, pp. 1095 – 1112.
Khin Z, Reza SM, Joachim L, Kim CN (2013) Analysis of a membrane based air-
dehumidification unit for AC in tropical climates. Applied Thermal Engineering, vol. 59,
pp. 370 – 379.
TH-1963_146103001
Page 214
References
185
Lazzarin, RM, Gasparella A, Longo GA (1999) Chemical dehumidification by liquid
desiccants theory and experiments, International Journal of Refrigeration, vol. 22, pp.
334-347.
Lamnatau C, Papanicolaou E, Belessiotis V, Kyriakis N (2012) Experimental investigation
and thermodynamic performance analysis of a solar dryer using an evacuated-tube air
collector, Applied Energy, vol. 94, pp. 232 – 243.
L-DCS Technology <www.l-dcs.de> (retrieved April 2015).
Liangdong M Zhen L, Jili Z, Ruobing L (2010) Thermal performance analysis of the glass
evacuated tube solar collector with U-tube, Building and Environment, vol. 45, pp. 1959
– 1967.
Laingdong M, Tianyi H, Zhang J, Zhao D (2016) Numerical study on the heat transfer
characteristics of filled-type solar collector with U-tube, Applied Thermal Engineering,
vol. 107, pp. 642 – 652.
Liang R, Liangdong M, Zhang J, Zhao D (2011) Theoretical and experimental investigation
of the filled-type evacuated tube solar collector with U tube, Solar Energy pp. 1735 –
1744.
Liu XH, Jiang Y, Qu KY (2006) Analytical solution of combined heat and mass transfer
processes of cross-flow dehumidifier using liquid desiccant, TaiyangnengXuebao/Acta
Energy Solar Singapore vol.27, pp.774–781.
Liu XH, Jiang Y, Xia J, Chang X (2007) Analytical solutions of coupled heat and mass
transfer processes in liquid desiccant air dehumidifier/ regenerator, Energy Conversion
Management vol.48, pp.2221–2232.
Liu XH, Jiang Y, Qu (2007) Heat and mass transfer model of cross-flow liquid desiccant air
dehumidifier/regenerator, Energy Conversion Management, vol.48, pp. 46–54.
Liu XH, Qy KY, Jiang Y (2006) Experimental study on mass transfer performances of cross-
flow dehumidifier using liquid desiccant, Energy Conversion and Management, vol.47,
pp. 2682-2692.
TH-1963_146103001
Page 215
References
186
Liu X, Jiang Y, Xia J, Chang X., (2010) Analytical solutions of coupled heat and mass transfer
processes in liquid desiccant air dehumidifier/regenerator,Energy Conversion and
Managementvol.48, pp. 2221–2232.
Luo Y, Yang H, Lu L (2014) Liquid desiccant dehumidifier: Development of a new
performance predication model based on CFD, Int. J. Heat Mass Transf., vol.69, pp.408
– 416.
Luo Y, Yang H, Lu L (2014) Dynamic and microscopic simulation of the counter-current flow
in a liquid desiccant dehumidifier, Applied Energy, vol.136, pp.1018 – 1025.
Luo Y, Yang H, Lu Land Qi R (2014) A review of the mathematical models for predicting
the heat and mass transfer process in the liquid desiccant dehumidifier, Renewable and
Sustainable Energy Reviews, vol. 31, pp. 587–599.
Longo GA, Gasparella G (2005) Experimental and Theoretical Analysis of heat and mass
transfer in a packed column dehumidifier/regenerator with liquid desiccant,Int. J. Heat
Mass Transfer vol.48, pp. 40 – 52.
Longo GA, Gasparella A (2016) Experimental measurement of thermophysical properties of
H2O/KCOOH (potassium formate) desiccant, Int. J. Ref., vol. 62, pp. 106 – 113.
Lowenstein A, Slayzak S, Kozubal E (2007) A zero carryover liquid desiccant air conditioner
for solar applications, Proceedings of International Solar Energy Conference, pp.397 –
407.
Lucio CD, Mesquita S (2007) Analysis of a Flat-Plate, Liquid-Desiccant, Dehumidifier and
Regenerator, PhD thesis, Queen’s University.
Lu ZF, Chen PL, Zhang X (2001) Approximate analytical solution of heat and mass transfer
processes in packed-type cross-flow liquid desiccant system and its experimental
verification, J Tongji University vol.29, pp.149–53.
Martin V, Goswami DY (2000) Effectiveness of Heat and Mass Transfer Processes in a
Packed Bed Liquid Desiccant Dehumidifier/Regenerator, HVAC&R Res. vol.6, pp. 21 –
39.
Mei VC, Chen FC, Lanan Z, Collier RK, Meckler G (1992) An assessment of desiccant
cooling and dehumidification technology, Oak Ridge National Laboratory.
TH-1963_146103001
Page 216
References
187
Mehrorang G, Syamak NK (2015) Removal of methylene blue from aqueous solution by
wood millet carbon optimization using response surface methodology, Spectrochimica
Acta Part A: Molecular and Biomolecular spectroscopy, vol.136, pp.141 – 148.
Mesquita LCS, Harrison SJ (2005) Non-isothermal, flat-plate liquid-desiccant regenerators:
A numerical study, International Solar Energy Conference, pp.325 – 331.
Morrison G, Budihardjo I, Behnia M (2005) Measurement and simulation of flow rate in a
water-in-glass evacuated tube solar water heater, Int. J. Solar Energy, vol. 78, pp. 257–
267.
Miller J, Lowenstein A (2008) The field operation of a thermally driven Liquid-desiccant air
conditioner, International Solar Energy Conference.
Miao RS (1997) Study of alternative liquid absorbents using a thermodynamic model and a
combined physico-optical method, PhD thesis, Department of Mechanical Engineering,
University of Illinois at Chicago, Chicago.
McDonald B, Waugman DG, Kettleborough CF (1992) A statistical analysis of a packed
tower dehumidifier, Drying Technology, vol.10, pp.223–237.
Muthukumar P, Naik BK, Goswami A (2018) Performance Evaluation of a Mechanical Draft
Cross-flow Cooling Towers Employed in a Subtropical Region, Journal of The
Institution of Engineers (India): Series C, pp. 1–9.
Naik BK, Muthukumar P (2017) A novel approach for performance assessment of
mechanical draft wet cooling towers, Applied Thermal Engineering, vol. 121, pp. 14–26.
Naik BK, Choudhary V, Muthukumar P, Somayaji C (2017) Performance Assessment of a
Counter-flow Cooling Tower–Unique Approach, Energy Procedia, vol. 109, pp. 243–
252.
Naik BK, Muthukumar P (2017) Empirical Correlation Based Models for Estimation of Air
Cooled and Water Cooled Condenser's Performance, Energy Procedia, vol. 109, pp. 293–
305.
Niagara Blower, <www.niagarablower.com> (retrieved April 2015).
TH-1963_146103001
Page 217
References
188
Nkwetta DN, Smyth M, Zacharopoulos A, Hyde T (2013), Experimental performance
evaluation and comparative analyses of heat pipe and direct flow augmented solar
collector, Applied Thermal Engineering, vol. 60, pp. 225–33.
Neeraj M, Avadhesh Y (2015) Experimental analysis of thermal performance of evacuated
tube solar air collector with phase change material for sunshine and off sunshine hours,
Int. J. Amb. Energy, pp. 2162-8246.
Oberg V, Goswami DY (1998a) A Review of Liquid Desiccant Cooling, Advances in Solar
Energy vol.12, pp.413-470.
Oberg V, Goswami DY (1998b) Experimental study of the heat and mass transfer in a packed
bed liquid desiccant air dehumidifier, Journal of Solar Energy Engineering, ASME,
vol.120, pp. 289–297.
Onda K, Takeuchi H, Okumoto Y (1968) Mass transfer coefficients between gas and liquid
phases in packed columns, Journal of Chemical Engineering of Japan, vol. 1, pp. 56 –
62.
Peng CSP, Howell JR (1981) Analysis and design of efficient absorbers for low temperature
desiccant air conditioners, ASME Journal of Solar Energy Engineering, vol. 103, pp. 67-
74.
Peng D, Zhang X (2011) An analytical model for coupled heat and mass transfer processes in
solar collector/regenerator using liquid desiccant, Applied Energy, vol. 80, pp. 2436 –
2444.
Patnaik S, Lenz TG, Lof GOG (1990) Performance studies for an experimental solar open
cycle liquid desiccant air dehumidification system, Solar Energy, vol.44, pp. 123-135.
Patek J, Klomfar J (2006) A computationally effective formulation of the thermodynamic
properties of LiBr-H2O solutions from 273 to 500 K over full composition range, Int. J.
Refrig., vol.29, pp.566–578.
Ren CQ, Jiang Y, Zhang YP (2006) Simplified analysis of coupled heat and mass transfer
processes in packed bed liquid desiccant-air contact system, Solar Energy vol.80, pp.
121–131.
TH-1963_146103001
Page 218
References
189
Robison H (1983) Operational Experience with a Liquid Desiccant Heating and Cooling
System, 18th IECEC, Orlando, FL.
Rodriguez GM, Silva ALF, Nunez MP (2018) Solar thermal networks operating with
evacuated-tube collectors, Energy, vol. 146, pp. 26 – 33.
Ren C, Jiang Y, Zhang Y (2006) Simplified analysis of coupled heat and mass transfer
processes in packed bed liquid desiccant-air contact system, Solar Energy, vol. 80, pp.
121–131.
Rajat SD, Jain S (2015) Performance characteristics of cross-flow membrane contactors for
liquid desiccant systems. Applied Energy, vol. 141, pp. 1–11.
Sarbu I, Sebarchievici C (2013) Review of solar refrigeration and cooling systems, Energy
and Buildings, vol.67, pp. 286–297.
Sabhia MA, Saidur R, Mekhilef S, Mahian O (2015) Progress and latest developments of
evacuated tube solar collectors, Renewable and Sustainable Energy Reviews, vol. 51, pp.
1038 – 1054.
Saman WY, Alizadeh S (2001) Modelling and performance analysis of a cross-flow type plate
heat exchanger for dehumidification/cooling. Solar Energy, vol. 70, pp. 361– 372.
Shahl LJ, Furbo S (2004) Vertical evacuated tubular-collectors utilizing solar radiation from
all directions, Applied Energy ,vol. 78, pp. 371 – 395.
Schlepp, Schultz (1984) High Performance Solar Desiccant Cooling System: Performance
Evaluations and Research Recommendations, SERI/TR, pp. 252-2497.
Seo YK, Yoon JW, Lee JS, Hwang YK, Jun CH, Chang JS, Wuttke S, Bazin P, Vimont
A, Daturi M, Bourrelly S, Llewellyn PL, Horcajada P, Serre C, Ferey G (2012)
Energy-efficient humidification over hierarchically porous metal-organic frame works as
advanced water adsorbents, Advanced Materials, vol. 24, pp. 806–810.
Stevens DI, Braun JE, Klein SA, (1989) An effectiveness model of liquid desiccant system
heat/mass exchangers, Solar Energy, vol. 42, pp. 449–55.
Shajimohan B, Maiya MP, Shaligram T (2007) Performance characterisation of liquid
desiccant columns for a hybrid air-conditioner, Applied thermal engineering, vol. 28, pp.
1342-1355.
TH-1963_146103001
Page 219
References
190
Shajimohan B, Shaligram T, Maiya MP (2015) Experimental investigations on performance
of liquid desiccant-vapour compression hybrid air conditioner, Applied thermal
engineering, vol.77, pp. 16-162.
Sultan GI, Hamed AM, Sultan AA (2002) The effect of inlet parameters on the performance
of packed tower regenerator, Renewable Energy vol. 26, pp. 271–283.
Shanghai Canmu, < www.cncanmu.com > (retrieved April 2015).
Shifang H, Zhenyu L, Caihua L, Xiaosong Z (2017) Experimental study of heat and mass
transfer characteristics in a cross-flow heating tower. Int. J. Refrigeration vol. 77, pp. 116
– 127.
Talal K, Kassem A, Alosaimy S, Ahmed MH, Mohammad F (2013) Solar Powered
Dehumidification Systems Using Desert Evaporative Coolers: Review, International
Journal of Engineering and Advanced Technology (IJEAT),vol. 3.
Treybal RE (1969) Mass transfer operations, 3rd ed., New York: McGraw-Hill, pp.186–211.
Tokarev M, Gordeeva L, Romannikov V, Glaznev I, Aristov Y (2002) New composite
sorbent CaCl2 in mesopores for sorption cooling/heating, International Journal of
Thermal Sciences, vol.41, pp. 470–474.
Vafai AK (2004) An investigation of heat and mass transfer between air and desiccant film in
parallel and counter-flow channels, Applied Thermal Engineering, vol. 47 pp. 1745–60.
Varela RJ, Yamamguchi S, Giannetti N, Saito K, Harada M, Miyauchi H (2018) General
correlations for the heat and mass transfer coefficients in an air-solution contactor of a
liquid desiccant system and an experimental case application, Int. J. Heat Mass Transf.,
vol. 120, pp. 851 – 860.
Varela RJ, Giannetti N, Yamaguchi S, Saito K, Wang X, Nakayama H (2018)
Experimental investigation of the wetting characteristics of an aqueous ionic liquid
solution on an aluminum fin-tube substrate, Int. J. Ref., vol. 88, pp. 472 – 482.
Vishal D, Avadesh Y (2017) Effect of Pressure Drop and Air Mass Flow Rate on the
Performance of Concentric Coaxial Glass Tube Solar Air Collector: A Theoretical
Approach, Arabian Journal for Science and Engineering, 1 – 11.
TH-1963_146103001
Page 220
References
191
Wang L, Nianping L, Zhao B (2010) Exergy performance and thermodynamic properties of
the ideal liquid desiccant dehumidification system, Energy and Buildings, vol. 42, pp.
2437 – 2444.
Wang L, Xiao F, Zhang X, Kumar R (2016) An experimental study on the dehumidification
performance of a counter-flow liquid desiccant dehumidifier, Int. J. Ref., vol. 70, pp. 289
– 301.
Wirth (1976), Niklaus Algorithms + Data Structures = Programs. Prentice-Hall 126.
Wu Q, Cai W, Shen S, Wang X, Ren H (2017) A regulation strategy of working concentration
in the dehumidifier of liquid desiccant air conditioner, vol. 202, pp. 648 – 661.
Waugaman DG, Kini A, Kettleborough CF (1993) A review of desiccant cooling systems. J.
Energy Res. Technology – Transactions ASME, vol. 115, pp. 1 – 8.
Xiong ZQ, Dai YJ, Wang RZ (2010) Exergy analysis of liquid desiccant dehumidification
system, International Journal of Green Energy vol. 7, pp. 241 – 262.
Xian Li, Liu S, Tan KK, Wang QG, Cai WJ, Xie L (2016) Dynamic modelling of a liquid
desiccant dehumidifier, Applied Energy, pp. 435 – 445.
Xia SJ, Chen LG, Sun FR (2009) Optimization for entransy dissipation minimization in heat
exchanger, Chinese Sci. Bull., vol. 54, pp. 3587–3595.
Xianhua N, Li Z, Shuai D, Xueyin L (2017) Experimental study on thermal performance of
U-type evacuated glass tubular solar collector with low inlet temperature, Solar Energy,
vol. 150, pp. 192 – 201.
Zhang T, Liu X, Zhang L, Jiang J (2012) Match properties of heat transfer and coupled heat
and mass transfer processes in air-conditioning system, Energy Conversion and
Management, vol. 59, pp. 103-113.
Zhang T, Liu X, Tang H, Liu J, Jiang Y (2016) Exergy and entransy analysis in air –
conditioning system part 1 – Similarity and distinction, Energy and buildings, vol.128,
pp. 876 – 885.
Zhang T, Liu X, Liu J, Tang H, Jiang Y (2017) Exergy and entransy analysis in air –
conditioning system part 2 – Humid air handling process, Energy and buildings, vol. 139,
pp. 10 – 21.
TH-1963_146103001
Page 221
References
192
Zhang L, Xiaohua L, Jingjing J, Yi J (2014) Exergy calculation and analysis of a
dehumidification system using liquid desiccant, Energy and Buildings, vol. 69, pp. 318
– 328.
Zhang L, HongyangW, Xiaosong Z (2014) Theoretical analysis of heat and mass transfer
characteristics of a counter – flow packing tower and liquid desiccant dehumidification
systems based on entransy theory, Energy, vol. 141, pp. 661 – 672.
Zhiqiang Y, Harding G, Window B (1985) Water-in-glass manifolds for heat extraction from
evacuated solar collector tubes, Int. J. Solar Energy, vol. 32, pp. 223–230.
Zurigat, YH, Abu-Arabi MK, Abdul-Wahab SA (2003) Air dehumidification by triethylene
glycol desiccant in a packed column, Energy Conversion & Management, vol.45, pp.
141-155.
Yimo L, HongxingY, Lin L, Ronghui Q (2014) A review of the mathematical models for
predicting the heat and mass transfer process in the liquid desiccant dehumidifier,
Renewable and Sustainable Energy Reviews, vol. 31, pp. 587–599.
Yin YG, Zhang XS, Peng DG, Li XW (2009) Model validation and case study on internally
cooled/heated dehumidifier/regenerator of liquid desiccant systems. Int. J. Ther. Sci, vol.
48, pp. 1664 – 1671.
Yunho H, Reinhard R (2007) Review of Solar Cooling Technologies, HVAC & R Research,
vol. 14, pp. 507- 528.
Yuan Z, Herold KE (2005) Thermodynamic properties of aqueous lithium bromide using a
multi property free energy correlation, HVAC&R Res., vol. 11, pp. 377–393.
Young HD (1992), University Physics, 7th Ed., Addison Wesley.
TH-1963_146103001
Page 222
Governing Equations Derivation
193
APPENDIX A
SIMPLIFIED U – TUBE SOLAR COLLECTOR MODEL
A.1 Governing Equations Derivation
Fig. A.1, U – tube solar collector model.
The continuity and Naiver – Stokes momentum equations are solved simultaneously for
simulating the behaviour of working fluid flowing inside the U – tube (Eqs. A.1 and A.2a –
A.2c). The velocity field obtained from Eqs. A.1 and A.2a – A.2c are used for solving the
convective heat transfer taking place from U – tube wall surface to the working fluid (Eq. A.3).
In order to include the effect of buoyancy and to reduce the complexity in solving the Navier
TH-1963_146103001
Page 223
Governing Equations Derivation
194
– Stokes equations, Boussinesq approximation is added to the momentum equation along the
Z – direction (Eq. A.2c) and is expressed as –gzβT(T∞ – T). The axial direction of simplified U
– tube solar collector model is shown in Fig. A.1.
Continuity equation:
, , ,0
wf x wf y wf zV V V
x y z
(A.1)
Momentum equation:
Component x
, , ,
, , ,
2 2 2
, , ,
2 2 2
1wf wf x wf x wf x
wf x wf y wf z
wf x wf x wf x
V V V V PV V V
t x y z x
V V V
x y z
(A.2a)
Component y
, , ,
, , ,
2 2 2
, , ,
2 2 2
1wf wf y wf y wf y
wf x wf y wf z
wf y wf y wf y
V V V V PV V V
t x y z y
V V V
x y z
(A.2b)
Component z
, , ,
, , ,
2 2 2
, , ,
2 2 2
wf wf z wf z wf z
wf x wf y wf z z T
wf z wf z wf z
V V V VV V V g T T
t x y z
V V V
x y z
(A.2c)
Energy equation:
, , , ,
2 2 2
2 2 2
p wf wf x wf y wf z
T T T TC V V V
t x y z
T T Tk
x y z
(A.3)
where ρ, Vwf, and Cp,wf are the density (kg/m3), velocity (m/s) and specific heat (kJ/kg – K) of
the working fluid and k is the thermal conductivity (kW/m – K) of the U – tube material.
TH-1963_146103001
Page 224
Uncertainty Analysis
195
APPENDIX B
UNCERTAINTY ANALYSIS
Kline and McClintok (1953) proposed a method for estimating the uncertainty of dependent
parameter, which depends on certain measured quantities of the experimental studies. If a
parameter ‘Ω’ depends on the independent variables such as k1, k2, k3, k4………...kn then ‘Ω’
can be expressed as a function of all the independent variables as given in Eq. B.1.
Ω = Ω (k1, k2, k3, k4………...kn) (B.1)
Then the total uncertainty of the parameter ‘∆Ω’ is given as
2 22 2
1 2 3
1 2 3
.................... n
n
k k k kk k k k
(B.2)
Thus, using Eq. B.2 the uncertainties in the dependent parameters are calculated as follows,
The uncertainty in condensation/evaporation rate is calculated using Eq. B.2a
Condensation/evaporation rate (λ):
2 2 2
2 ( )( )
v dv d
(B.2a)
TH-1963_146103001
Page 225
Uncertainty Analysis
196
The uncertainty in air and solution enthalpy are calculated using Eq. B.2b and B.2c
Air enthalpy (ha):
22
2 2a aa a
a
h hh T
T
(B.2b)
Solution enthalpy (hs):
22
2 2a ss s
s
h hh T
T
(B.2c)
The uncertainty in overall energy exchange is calculated using Eq. B.2d
Overall energy exchange (Qe):
22
2e ee a
a
Q QQ m T
m T
(B.2d)
The uncertainty in useful heat flux is calculated using Eq. B.2e
Useful heat flux (Quh):
2 2
2uh uhuh wf wf
wf wf
Q QQ v T
v T
(B.2e)
A.1 Sample calculation
a) Condensation/evaporation rate (λ)
As condensation/evaporation rate (λ) = ρAvΔω, Using Eq. B.1a, the uncertainty in
condensation/evaporation rate (𝛥𝜆𝜆⁄ ) is calculated as follows
2 2 2
2 v dv d
where
;
v v
;
A A
(B.3)
TH-1963_146103001
Page 226
Uncertainty Analysis
197
2 2 2
2v d
v d
Here, uncertainty of change in specific humidity (Δω) tends to 2(𝛥𝜔𝜔⁄ )2.
(B.4)
2 2 2
2 0.02 0.01 0.01
=±0.032
where 2%
; 1%
v
v
; 1%
d
d
(B.5)
Thus, the uncertainty in condensation/evaporation rate is obtained as ±3.2%. Similarly using
Eq. 3.2b – 3.2e, uncertainty in the estimation of air enthalpy, solution enthalpy, overall energy
exchange and useful heat flux are obtained as ±4.3%, ±4.3%, ±4.3% and ±3.2%, respectively.
TH-1963_146103001
Page 227
TH-1963_146103001
Page 228
List of Publications
199
List of Publications
Journals
1. B. Kiran Naik and P. Muthukumar, Experimental investigation and parametric studies on
structured packing chamber based liquid desiccant dehumidification and regeneration
systems, Building and Environment (2019).
DOI: https://doi.org/10.1016/j.buildenv.2018.12.028
2. B. Kiran Naik, Mrinal Bhowmik and P. Muthukumar, Experimental investigation and
numerical modelling on the performance assessments of evacuated u – tube solar collector
systems, Renewable Energy (2019).
DOI: https://doi.org/10.1016/j.renene.2018.09.066
3. B. Kiran Naik and P. Muthukumar, Energy, exergy and entransy analyses of a liquid
desiccant regenerator, International Journal of Refrigeration (2018).
DOI: https://doi.org/10.1016/j.ijrefrig.2018.08.016
4. B. Kiran Naik, P. Muthukumar and P. Sunil kumar, A novel finite difference model coupled
with recursive algorithm for analyzing heat and mass transfer processes in a cross-flow
dehumidifier/regenerator, International Journal of Thermal Sciences (2018).
DOI: https://doi.org/10.1016/j.ijthermalsci.2018.05.029
5. B. Kiran Naik, P. Muthukumar and C. Bhattacharya, Thermal modelling and parametric
investigation on coupled heat and mass transfer processes occured in a packed tower, Heat
and Mass Transfer (2018).
DOI: https://doi.org/10.1007/s00231-018-2440-1
6. B. Kiran Naik and P. Muthukumar, Performance assessment of evacuated U-tube solar
collector: a numerical study, Sadhana (2019).
DOI: https://doi.org/10.1007/s12046-018-0974-z
7. B. Kiran Naik, Ankit Varshney, P. Muthukumar and C. Somayaji, Modelling and
performance analysis of u type evacuated tube solar collector using different working fluids,
Energy Procedia (2016).
DOI: https://doi.org/10.1016/j.egypro.2016.11.189
8. B. Kiran Naik, Ankit Soni, Amit kumar, P. Muthukumar and C. Somayaji, Coupled heat and
mass transfer analysis of an adiabatic dehumidifier – unique approach, Energy Procedia
(2016).
DOI: https://doi.org/10.1016/j.egypro.2016.11.198
TH-1963_146103001
Page 229
List of Publications
200
Conferences
1. B. Kiran Naik, and P. Muthukumar, Energy, Entransy and Exergy Analyses of a Liquid
Desiccant Regenerator, International Sorption Heat Pump Conference (ISHPC – 2017),
Tokyo, Japan, Aug. 7-10, 2017.
2. B. Kiran Naik, P. Muthukumar and C. Somayaji, Thermodynamic Analysis of Liquid
Desiccant Dehumidification System - A Novel Approach, 23rd National Heat and Mass
Transfer Conference and 1st International ISHMT-ASTFE Heat and Mass Transfer
Conference IHMTC, ISRO Thiruvananthapuram, India, Dec. 17-20, 2015.
3. B. Kiran Naik, Ankit Soni, Amit kumar, P. Muthukumar and C. Somayaji, Coupled Heat
and Mass Transfer Analysis of an Adiabatic Dehumidifier – Unique Approach, 5th
International Conference on Advances in Energy Research (ICAER -2015), IIT
Bombay, Mumbai, India, Dec. 15-17, 2015.
4. B. Kiran Naik, Ankit Varshney, P. Muthukumar and C. Somayaji, Modelling and
Performance Analysis of U Type Evacuated Tube Solar Collector Using Different Working
Fluids, 5th International Conference on Advances in Energy Research (ICAER -2015),
IIT Bombay, Mumbai, India, Dec. 15-17, 2015.
5. B. Kiran Naik, Amit Kumar, Ankit Soni, P. Muthukumar and C. Somayaji, Coupled Heat
and Mass Transfer Analysis of an Adiabatic Regenerator – Unique Approach, International
Conference on Aerospace and Mechanical Engineering (ICAME - 2015), Kerala, India,
Dec. 14-16, 2015.
TH-1963_146103001