Research ArticleDesign and Simulation of a Solar Chimney PV/T Power Plant inNorthwest China
Qingjun Liu,1,2 Fei Cao ,1,3 Yanhua Liu,1 Tianyu Zhu,1 and Deyou Liu2
1College of Mechanical and Electrical Engineering, Hohai University, Changzhou 213022, China2College of Water Conservancy and Hydropower Engineering, Hohai University, Nanjing 210098, China3Sunshore Solar Energy Company Limited, Nantong 226300, China
A solar chimney PV/T power plant (SCPVTPP) is proposed. Mathematical models are established for the PV/T solar collector,the chimney, and the power conversion unit, respectively. Performances of the designed SCPVTPP are then simulated. TheSCPVTPPs with different PV module areas are finally discussed. It is found that the PV cells hold the highest temperature inthe solar collector. Temperature rise of the PV module has significant influences to its power generation. Without cooling, thePV power capacity has an average decrease of 28.71%. The contradictory influences of temperature rise and airflow coolinglead to an 11.81% decrease of the average power capacity. By adding the power generated by PVT, the total PV-related powercontribution increases by 4.72%. With the increase of the solar collector ratio, the temperature rise and the wind velocity bothfirst decrease then increase, the SCPP power productivity decreases linearly, and the PV power productivity increases linearly,whereas the PVT power productivity first increases linearly then increases superlinearly. There is a reversed solar collectorratio, exceeding which the PV generates most power. In this study, solar thermal power takes the major role when the solarPV area ratio is smaller than 0.055.
1. Introduction
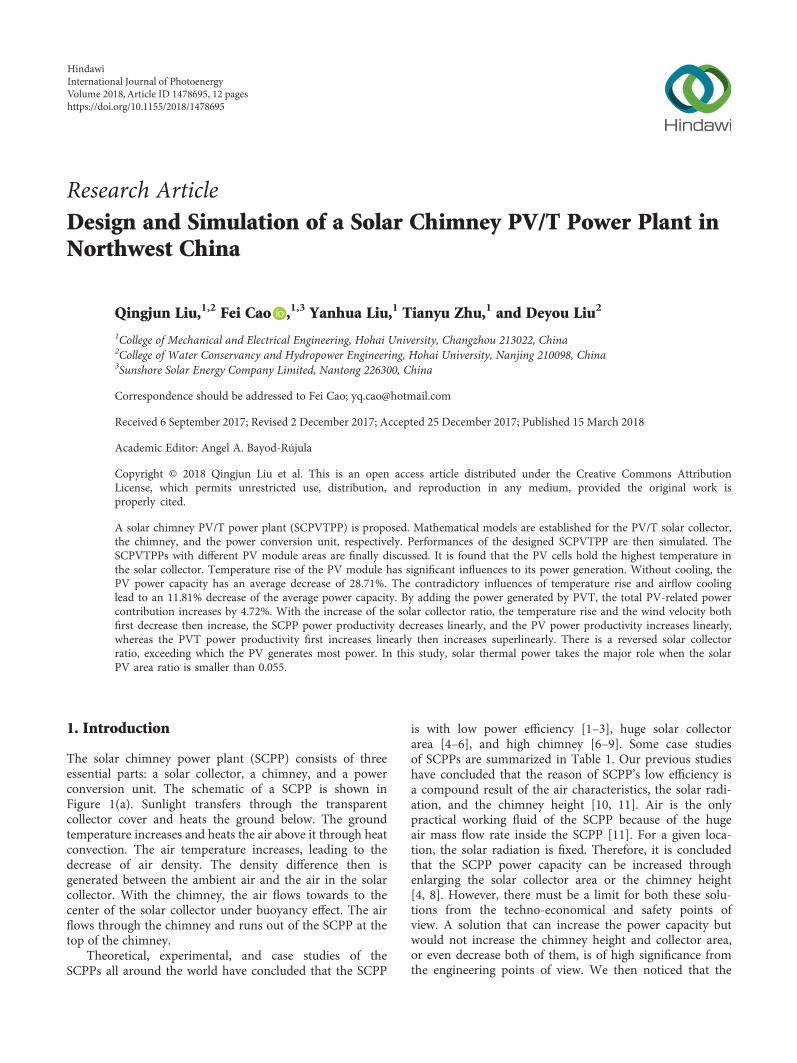
The solar chimney power plant (SCPP) consists of threeessential parts: a solar collector, a chimney, and a powerconversion unit. The schematic of a SCPP is shown inFigure 1(a). Sunlight transfers through the transparentcollector cover and heats the ground below. The groundtemperature increases and heats the air above it through heatconvection. The air temperature increases, leading to thedecrease of air density. The density difference then isgenerated between the ambient air and the air in the solarcollector. With the chimney, the air flows towards to thecenter of the solar collector under buoyancy effect. The airflows through the chimney and runs out of the SCPP at thetop of the chimney.
Theoretical, experimental, and case studies of theSCPPs all around the world have concluded that the SCPP
is with low power efficiency [1–3], huge solar collectorarea [4–6], and high chimney [6–9]. Some case studiesof SCPPs are summarized in Table 1. Our previous studieshave concluded that the reason of SCPP’s low efficiency isa compound result of the air characteristics, the solar radi-ation, and the chimney height [10, 11]. Air is the onlypractical working fluid of the SCPP because of the hugeair mass flow rate inside the SCPP [11]. For a given loca-tion, the solar radiation is fixed. Therefore, it is concludedthat the SCPP power capacity can be increased throughenlarging the solar collector area or the chimney height[4, 8]. However, there must be a limit for both these solu-tions from the techno-economical and safety points ofview. A solution that can increase the power capacity butwould not increase the chimney height and collector area,or even decrease both of them, is of high significance fromthe engineering points of view. We then noticed that the
HindawiInternational Journal of PhotoenergyVolume 2018, Article ID 1478695, 12 pageshttps://doi.org/10.1155/2018/1478695
huge solar collector, which is empty for the airflow, can beused to place the solar PV modules. On one side, the solarcollector area can be used, not influencing the airflow. Onthe other side, the PV module can be cooled by theairflow in the solar collector by forced heat convection.Correspondingly, a new solar chimney PV/T power plant(SCPVTPP) is proposed in Figure 1(b) to fulfill this target.In the system, some solar PV modules are set on theground of the solar collector. Due to the considerationsof safety and construction cost, there are no PV modulesin the vertical chimney. The solar radiation transfersthrough the transparent glass cover and then reaches thePV modules. The insulating layer and the wire connectionare set between the PV modules and the ground. Solarradiation transfers through the glass cover and reachesthe PV modules. Electricity is generated directly from thePV modules. Meanwhile, some solar radiation is convertedinto the thermal energy and heats the PV models. Thehigh-temperature PV modules then heat the air above itthrough heat convection. The other area of the solar col-lector without the PV modules absorbs the solar radiationdirectly, which leads to the temperature increase of theground. The ground then heats the air above it through
heat convection. The high-temperature air above theground and the PV modules then flows into the chimneythrough buoyancy effect. The solar PV/T technology ordevice was proposed for the purpose of cooling the PVmodule to increase its power efficiency [12] and recoveringthe waste heat to increase the system’s total efficiency [13].It has been widely utilized in the solar water heating(SWH) [14], heating ventilation air conditioning (HVAC)[15], solar-powered buildings [16], and so on. However, thelarge-scale PV/T system has not been investigated. Consider-ing this, the main tasks in this study include (1) to build amathematical model for the SCPVTPP, (2) to analyze theperformance of the SCPVTPP, and (3) to study theSCPVTPP with different PV areas.
2. Mathematical Model
A mathematical model is built for the SCPVTPP. Themathematical model can be divided into three parts,namely, the PVT solar collector model, the chimneymodel, and the power conversion unit (PCU) model. Prac-tically, the SCPVTPP has a large solar collection area, highchimney height, high PV surface temperature, and high
Sun
Collector Turbine
Chimney
Generator
Supports
Ground
(a)
Ground
Air inlet
PVmodule
Solarcollector
GroundSteel supports
Turbinegenerator
Chimney
Air outletPV
module
Chimney
Turbinegenerator
Solar collector
Zoom In
(b)
Figure 1: (a) Schematic of a conventional solar chimney power plant (SCPP). (b) Schematic of a SCPVTPP.
Table 1: Parameters of some case studies of SCPPs.
Year LocationWeather condition SCPP parameters
Power efficiencySolar radiation Collector radius Chimney height Power capacity
2012 7 cities in Iran [25]2 640W/m2 122m 194.6m 75.9 kW 0.08%1The authors of [24] did not supply the detailed solar radiation and power capacity in their literature. We calculated the results according to the results suppliedin their paper and the solar duration supplied by the China Meteorological Information Center (CMIC). 2The solar radiation and power capacity are calculatedaccording to the data supplied by the authors.
2 International Journal of Photoenergy
airflow velocity, compared with the collector height, thecollector cover thickness, and the temperature rise in thesolar collector are much smaller. Correspondingly, thenext assumptions can be made: (a) temperature rises line-arly along the airflow direction in the solar collector; (b)ignore the velocity and temperature gradient on the verti-cal direction in the solar collector; (c) ignore the velocityand temperature gradient on the cross section of the chim-ney; (d) ignore the temperature difference between the col-lector upper and back surface; (e) airflow is underadiabatic condition in the chimney; and (f) PV lower sur-face and ground up surface are connected together.
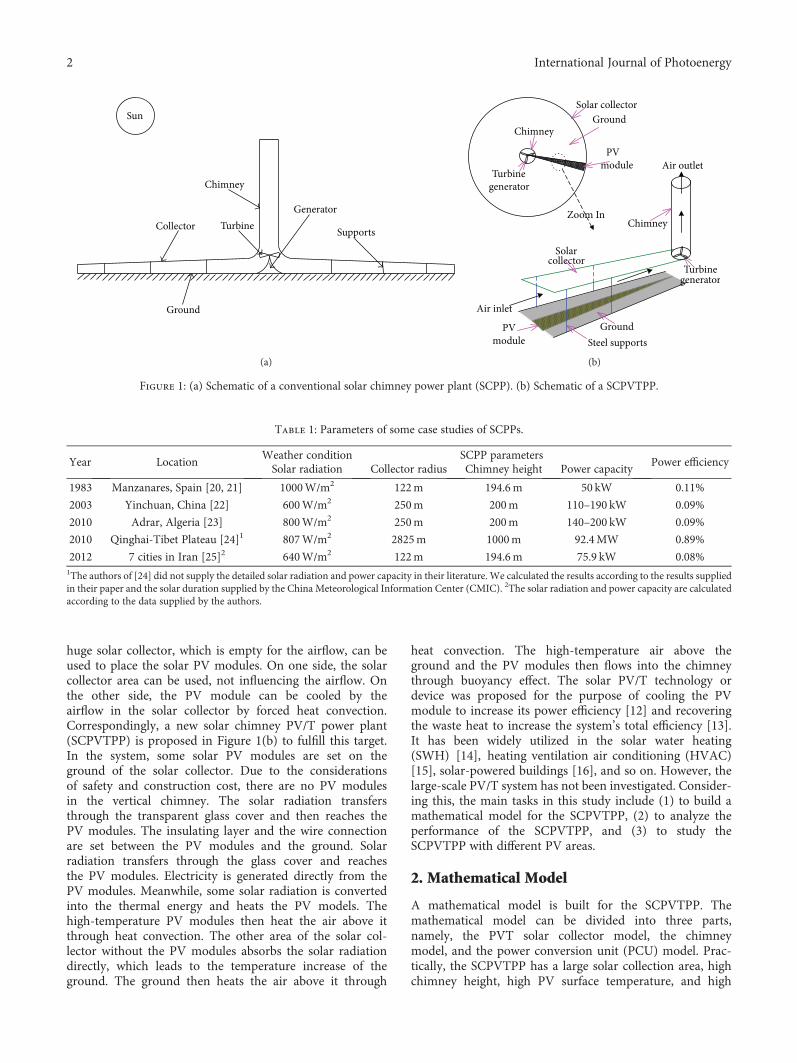
2.1. PVT Solar Collector Model. Energy balance of a rep-resentative elemental volume in the solar collector andPV is established (Figure 2). In the model, there arethree energy balance equations presented in (1), (2), and(3), respectively.
Continuity equation:
∂ρ∂t
+ 1r∂∂r
ρrvr = 0 1
Momentum equation:
∂∂t
ρvr + ρvr∂vr∂r
= −∂p∂r
+ μ∂∂r
1r∂∂r
rvr 2
Energy equation:
∂∂t
ρcpT + ∂∂r
cpρvrT = ∂SΦ∂t
3
Considering the energy balance of a representativeelemental volume, as shown in Figure 2(a), the energysource ∂SΦ/∂t is
∂SΦ∂t
= qcf rΔθΔr + qPV,f rΔθΔr + ρf cp,f∂T f
∂trΔθΔrH, 4
Collector coverLH
z𝛥z
Airflow channel
Ground
𝛥𝜃
𝜕TPV𝜕t
𝜕EPV𝜕t
𝛥S2r𝛥𝜃𝛥r
𝛥S1r𝛥𝜃𝛥r qcar𝛥𝜃𝛥r
qcfqPV, cr𝛥𝜃𝛥rqPV,f
qPV,cr𝛥𝜃𝛥r
𝜕Tccc𝜌c
𝜌f
cg𝜌g
cPV𝜌PV
r𝛥𝜃𝛥rL
r𝛥𝜃𝛥r𝛥z
r𝛥𝜃𝛥r
r𝛥𝜃𝛥r𝛥z
r𝛥𝜃𝛥rzPV +
r𝛥𝜃𝛥rH
𝜕t𝜕Tf𝜕t
𝜌foutvfout(r+𝛥r)𝛥𝜃Hout𝜌finvfinr𝛥𝜃Hin
Inlet Outlet
𝛥r
Cover absorbed energy:
Air flow absorbed energy:
PV absorbed energy:
r
z direction
r direction
PV
𝜕Tg
𝜕Tg
𝜕z𝜕Tg
𝜕z 𝜕z𝜕
𝜕tGround absorbed energy:
zPV
𝜕Tg−kg
(−kg+−kg )
𝜕z
qPV,gr𝛥𝜃𝛥r
r𝛥𝜃𝛥r
r𝛥𝜃𝛥rr𝛥𝜃𝛥r
c𝜌,f
(a)
Glass ARC
EVA TPLPV cell
Air
Ground
Collectorcover
(b)
Figure 2: Energy balance of a representative elemental volume in the solar collector and PV: (a) full view and (b) enlarged view of thePVT section.
3International Journal of Photoenergy
where the first and the second terms on the right side of(4) are the heat exchange between the collector coverand airflow and between the PV and the airflow, whichcan be expressed as
qcf rΔθΔr =∂S1∂t
rΔθΔr + qPV,crΔθΔr − qcarΔθΔr
− ccρc∂Tc
∂trΔθΔrL,
qPV,f rΔθΔr =∂S2∂t
rΔθΔr + kPV,1∂TPV∂z
∣z=0rΔθΔr
− qPV,crΔθΔr,
5
where qPV,crΔθΔr is the radiation heat exchange betweenthe PV and the collector cover, qcarΔθΔr is the convectionand radiation heat exchange between the collector coverand the ambient, kPV,1 ∂TPV/∂z ∣z=0rΔθΔr is the heat con-tribution from the PV, S1 is the solar radiation absorbedby the collector cover, and S2 is the solar radiationabsorbed by the PV module or the ground. The PV mod-ules are laid on the ground directly as shown inFigure 2(b). There are six layers in the PV modules,namely, the glass, the anti-reflective coating (ARC), theEVA (ethylene-vinyl acetate), the PV cell, and the TedlarPolymer Layer (TPL).
Taking a depth of Δz of the ith layer inside the PV layerinto consideration, we obtain
−kPV,i∂TPV∂zPV
rΔθΔrΔzPV
= −kPV,i∂TPV∂zPV
+ ∂∂zPV
−kPV,i∂TPV∂zPV
ΔzPV ∣z=z+ΔzPVrΔθΔrΔzPV
+ ∂EPV∂t
rΔθΔrΔzPV + cPV,iρPV,i∂TPV∂t
rΔθΔrΔzPV,
6
where −kPV,i ∂TPV/∂zPV + ∂/∂zPV −kPV,i ∂TPV/∂zPV ΔzPV ∣z=z+ΔzPVrΔθΔrΔzPV is the heat contribution from uppersurface z to the lower surface z + ΔzPV and EPV = 0 for thelayers excluding the PV cell. And at the depth of z = −zPV,we obtain
−kPV,6∂TPV∂zPV
rΔθΔrΔzg∣z=−zPV
= −kg∂Tg
∂zg+ ∂∂zg
−kg∂Tg
∂zgΔzg ∣z=z+Δzg rΔθΔrΔzg
+ cgρg∂Tg
∂trΔθΔrΔzg
7
And taking a depth of Δz inside the ground into consid-eration, we obtain
−kg∂Tg
∂zrΔθΔrΔz = −kg
∂Tg
∂z+ ∂∂z
−kg∂Tg
∂zΔz rΔθΔrΔz
+ cgρg∂Tg
∂trΔθΔrΔz
8∂EPV/∂t is the energy output of the PV and can be
calculated according to [17]:
EPV = S2τcηref 1 − Br TPV − Tref , 9
where τc is the transmittance of the PV cover, ηref is theefficiency of PV under standard conditions, Br is the temper-ature coefficient, and Tref is the standard testing temperatureof PV.
2.2. Chimney. Continuity equation:
∂ρ∂t
+ ∂∂z
ρvz = 0 10
Momentum equation:
∂∂t
ρvz + ρvz∂vz∂z
= −∂p∂z
− ρgz + μ∂2vz∂z2
11
Energy equation:
∂∂t
cpρT + ∂∂z
cpρvzT = 0 12
For a vertical adiabatic chimney, the pressure differencecreated in the chimney is
ΔPchi = ρa − ρo gHchi 13
And the pressure difference between the inlet and outletof the solar collector is calculated as
ΔP =outlet
inletg ρa − ρ z dz, 14
where z denotes the height. Comparing with the chimney
RPCU
HPC
U
PCU base
Turbine vane
Solar collectoroutlet
PCU
vr
vz
Solar collector cover
Chimney
v l
Figure 3: Cross-section of the PCU.
4 International Journal of Photoenergy
height, the solar collector height is much smaller. Thus,Hcol ≈ 0.
According to Boussinesq assumption and (13) and(14), the momentum equation of the chimney can be sim-plified as
−∂p∂z
− ρgz + μ∂2vz∂z2
= 0 15
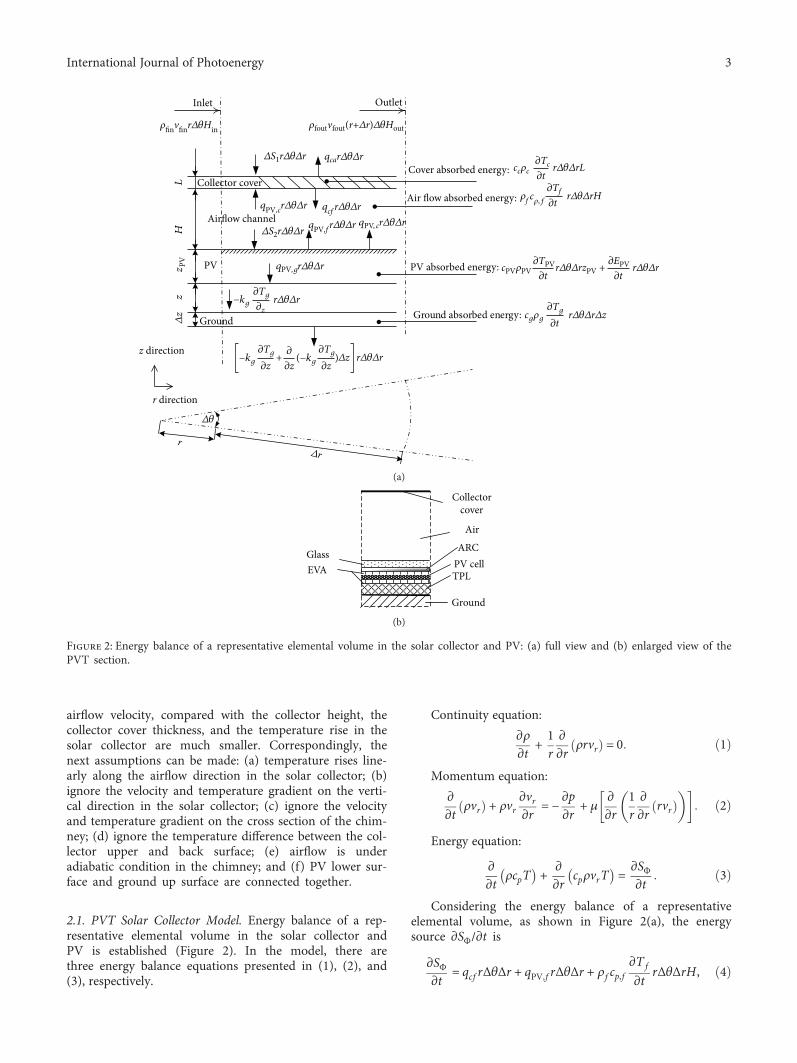
2.3. PCU. As the connection section of the PCU is irregular, arandomized coordinate along the power generator surface isbuilt for this area (Figure 3). And we can obtain the following:
Continuity equation:
∂ρ∂t
+ ∂∂l
ρvl = 0 16
Momentum equation:
∂∂t
ρvl + ρvl∂vl∂l
= −∂p∂l
− ρgl + μ∂2vl∂l2
17
Energy equation:
∂∂t
cpρT + ∂∂l
cpρvlT = ∂∂l
k∂T∂l
18
As HPCU < <Hchi and RPCU < <Rcol, we can obtain that
vr∣r=RPCU= vl∣l=0,
vz∣z=HPCU= vl∣l=LPCU ,
HPCU ≈ 0,19
where Hchi is the chimney height, Rcol is the collector radius,and LPCU is the length of the PCU channel.
Consequently, the momentum equation can be simpli-fied as
−∂p∂l
+ μ∂2vl∂l2
= 0 20
The generated pressure is consumed by four parts, that is,the friction losses in the collector and the chimney ΔPf , thekinetic energy losses at the turbine inlet ΔPin, the kinetic
Difference between newly obtainedand formal results < 10−6 ?
Readingboundarycondition
Readingconfigurationsize
Reading lasttime-stepparameters
.
.
.
Recording data and calculation completeY
N
Glass-absorbed radiationGround-absorbed radiation
SCPVTPP configuration and last time-step parameters initialization
Iterative calculation ofparameters
Difference between newly obtainedand formal results < 10−6 ?
Recording data and calculation completeY
N
Para
met
er in
tegr
atio
n
Results
Glass cover, airflow, PV, and ground temperaturesUpdraft wind speedPV power, PVT power, and SCPP powerSCPVTPP power productivity
Figure 4: Flowchart of the simulation process.
5International Journal of Photoenergy
energy losses at the chimney outlet ΔPout, and the rest is theeffective pressure which is used by the turbine to generateelectricity ΔPt .
ΔPchi = ΔPf + ΔPin + ΔPout + ΔPt
= fLth2D ρv2l + γ
12 ρv
2z +
12 ρav
2z + ΔPt ,
21
where f is the friction loss coefficient, D is the hydraulicdiameter, Lth is the length of the channel, and γ is the turbineinlet loss coefficient.
The power generated by the turbine Pele is
Pele = ηtΔPtvoAchi 22
2.4. Simulation Methodology. Equations to calculate thecoefficients, namely, the heat transfer coefficients, the losscoefficients, the friction loss, and turbine efficiency, followthe previous studies [1, 4, 18]. The equations are convertedinto the codes to solve the equations. Flowchart of thesimulation in this study is shown in Figure 4. As shown inFigure 4, the initial values of the parameters, that is, thecollector cover temperature, PV temperature, airflow tem-perature, and ground temperature, are firstly assumed. Aniterative calculation is then made to use the new values toreplace the old values. When the differences between anycorresponding new and old values are less than the maximalacceptable difference (namely, smaller than 10−6), the itera-tion process is finally stopped.
3. Result and Discussion
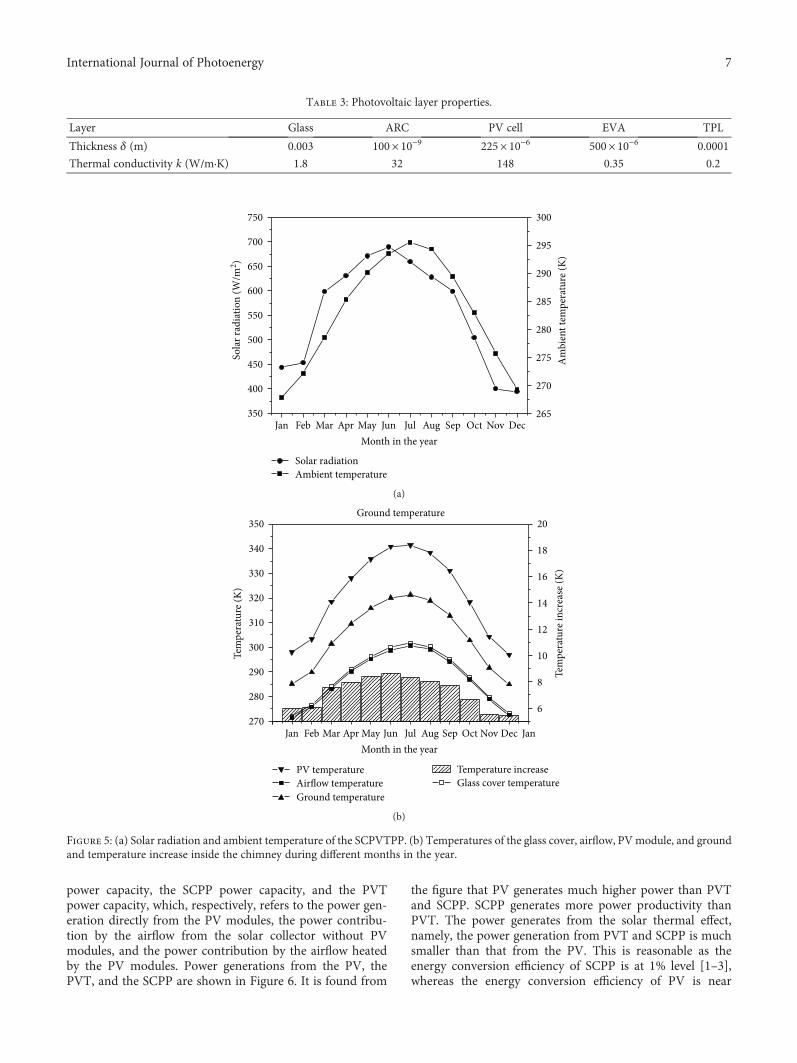
3.1. Configuration Sizes of the SCPVTPP. The configurationsizes of the SCPVTPP are shown in Table 2. The SCPVTPPis designed according to 5 and MW SCPP to [19]. And theSCPVTPP is assumed to be operated in Lanzhou. Lanzhou(103.50°E, 36.03°N) is located in the geographical center ofNorthwest China. And it has typical Northwestern Chineseclimate, that is, strong solar radiation, rare rainfall thatdiminishes from east to west, dry and cold winter, hotsummer, and broad daily temperature width. Its annualglobal solar radiation is more than 5020MJ/m2 and sunshineduration is over 2600 h per year. Its annual mean tempera-ture is 9.8°C. The properties of six layers in the PV moduleare shown in Table 3.
3.2. Temperature Increase and Wind Velocity of theSCPVTPP. As the SCPP is dominated by the buoyancy effect,temperature rise in the solar collector is of high significance.Moreover, two contradictory phenomena occur concerningthe temperature rise in the PV/T solar collector. On one side,the PV modules are sensitive to the temperature rise. The PVpower generation would decrease with the rise of tempera-ture. On the other hand, the updraft wind would enhancewith the temperature rising and the generated wind wouldreduce the temperature of the PV modules. Considering this,the meteorological data, temperatures, and wind velocity
inside the SCPVTPP are calculated and the results are shownin Figure 5.
Solar radiation and ambient temperature of Lanzhou isshown in Figure 5(a). It is found from the figure that the solarradiation first increases from January to June, with the peakof 689.73W/m2. Then the solar radiation decreases tillDecember. The tendency of the ambient temperature is sim-ilar with the solar radiation, whereas the highest ambienttemperature appears at July. Temperatures of the glass cover,airflow, PV module, and ground and the temperatureincrease inside the collector at different months in the yearare shown in Figure 5(b). It is found from the figure thatthe temperatures of the glass cover, airflow, PV module,and ground have the same tendency with the ambienttemperature, with the peak values at July. Moreover, the PVcell holds the highest temperature among the four tempera-ture groups throughout the year, followed by the groundtemperature, the glass cover temperature, and the airflowtemperature. Temperature differences between each twogroups of temperatures increase from January to July andthen decrease till December.
3.3. Power Generation. There are three parts contributing tothe power generation in the SCPVTPP, namely, the PV
Table 2: Configuration sizes and coefficients of the SCPVTPP.
Component Value
Solar collector
Collector radius 625m
Collector inlet height 3m
Collector cover emittance 0.87
Glass extinction coefficient 32m−1
Glass thickness 5mm
Refractive index 1.526
PV module
Percentage of PV area overwhole solar collector area
30%
Emittance 0.9
Density 2330 kg/m3
Specific heat capacity 677 J/(kg·K)PV cover transmittance 0.912
PV efficiency understandard conditions
0.115
Temperature coefficient (Br) 0.0045K−1
PV standardtesting temperature
298K
ChimneyHeight 550m
Radius 22.5m
Ground
Material Granite
Density 2640 kg/m3
Specific heat capacity 820 J/(kg·K)Thermal conductivity 1.73W/(m·K)Normal emittance 0.92
Reflectance 0.25
TurbineEfficiency 0.8
Inlet loss coefficient 0.056
6 International Journal of Photoenergy
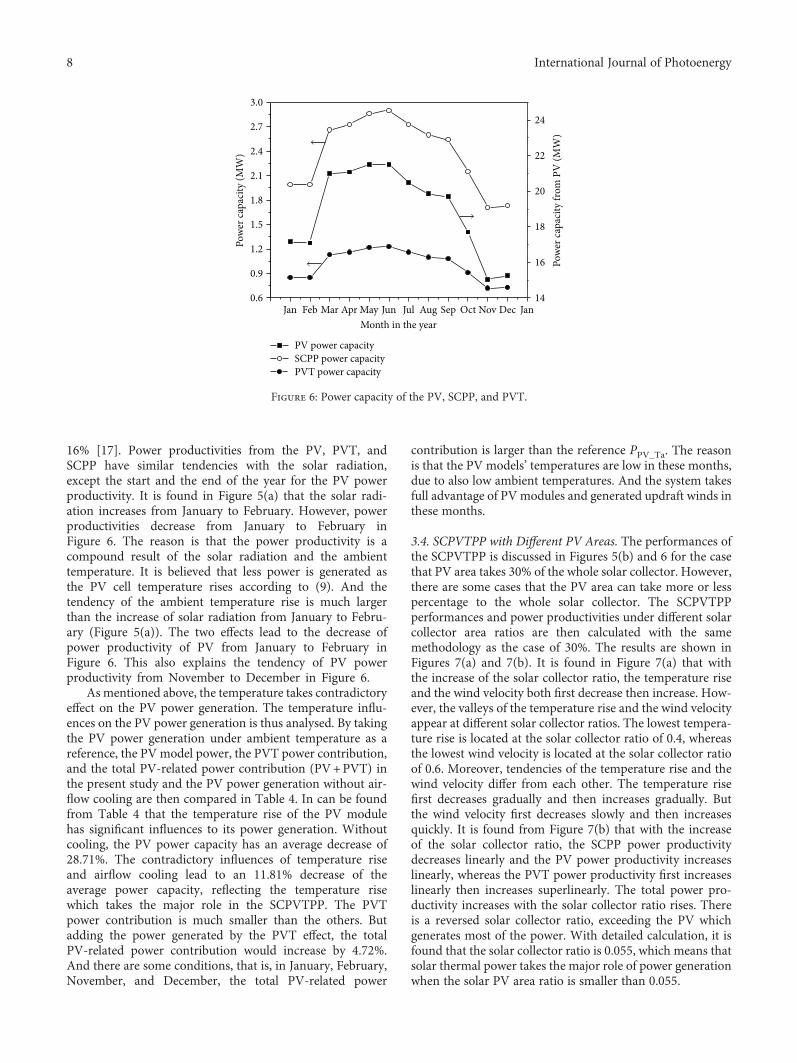
power capacity, the SCPP power capacity, and the PVTpower capacity, which, respectively, refers to the power gen-eration directly from the PV modules, the power contribu-tion by the airflow from the solar collector without PVmodules, and the power contribution by the airflow heatedby the PV modules. Power generations from the PV, thePVT, and the SCPP are shown in Figure 6. It is found from
the figure that PV generates much higher power than PVTand SCPP. SCPP generates more power productivity thanPVT. The power generates from the solar thermal effect,namely, the power generation from PVT and SCPP is muchsmaller than that from the PV. This is reasonable as theenergy conversion efficiency of SCPP is at 1% level [1–3],whereas the energy conversion efficiency of PV is near
Thermal conductivity k (W/m·K) 1.8 32 148 0.35 0.2
750
Solar radiationAmbient temperature
700
650
600
550
500
Sola
r rad
iatio
n (W
/m2 )
Am
bien
t tem
pera
ture
(K)
450
400
350Jan Feb Mar Apr May Jun Jul
Month in the yearAug Sep Oct Nov Dec
300
295
290
280
285
270
275
265
(a)
Tem
pera
ture
(K)
Tem
pera
ture
incr
ease
(K)
350
PV temperature
Ground temperatureAirflow temperature
Ground temperature
Temperature increaseGlass cover temperature
20
18
16
14
12
10
8
6
340
330
320
310
300
290
280
270Jan JanFeb Mar Apr May Jun Jul
Month in the yearAug Sep Oct Nov Dec
(b)
Figure 5: (a) Solar radiation and ambient temperature of the SCPVTPP. (b) Temperatures of the glass cover, airflow, PVmodule, and groundand temperature increase inside the chimney during different months in the year.
7International Journal of Photoenergy
16% [17]. Power productivities from the PV, PVT, andSCPP have similar tendencies with the solar radiation,except the start and the end of the year for the PV powerproductivity. It is found in Figure 5(a) that the solar radi-ation increases from January to February. However, powerproductivities decrease from January to February inFigure 6. The reason is that the power productivity is acompound result of the solar radiation and the ambienttemperature. It is believed that less power is generated asthe PV cell temperature rises according to (9). And thetendency of the ambient temperature rise is much largerthan the increase of solar radiation from January to Febru-ary (Figure 5(a)). The two effects lead to the decrease ofpower productivity of PV from January to February inFigure 6. This also explains the tendency of PV powerproductivity from November to December in Figure 6.
As mentioned above, the temperature takes contradictoryeffect on the PV power generation. The temperature influ-ences on the PV power generation is thus analysed. By takingthe PV power generation under ambient temperature as areference, the PVmodel power, the PVT power contribution,and the total PV-related power contribution (PV+PVT) inthe present study and the PV power generation without air-flow cooling are then compared in Table 4. In can be foundfrom Table 4 that the temperature rise of the PV modulehas significant influences to its power generation. Withoutcooling, the PV power capacity has an average decrease of28.71%. The contradictory influences of temperature riseand airflow cooling lead to an 11.81% decrease of theaverage power capacity, reflecting the temperature risewhich takes the major role in the SCPVTPP. The PVTpower contribution is much smaller than the others. Butadding the power generated by the PVT effect, the totalPV-related power contribution would increase by 4.72%.And there are some conditions, that is, in January, February,November, and December, the total PV-related power
contribution is larger than the reference PPV_Ta. The reasonis that the PV models’ temperatures are low in these months,due to also low ambient temperatures. And the system takesfull advantage of PVmodules and generated updraft winds inthese months.
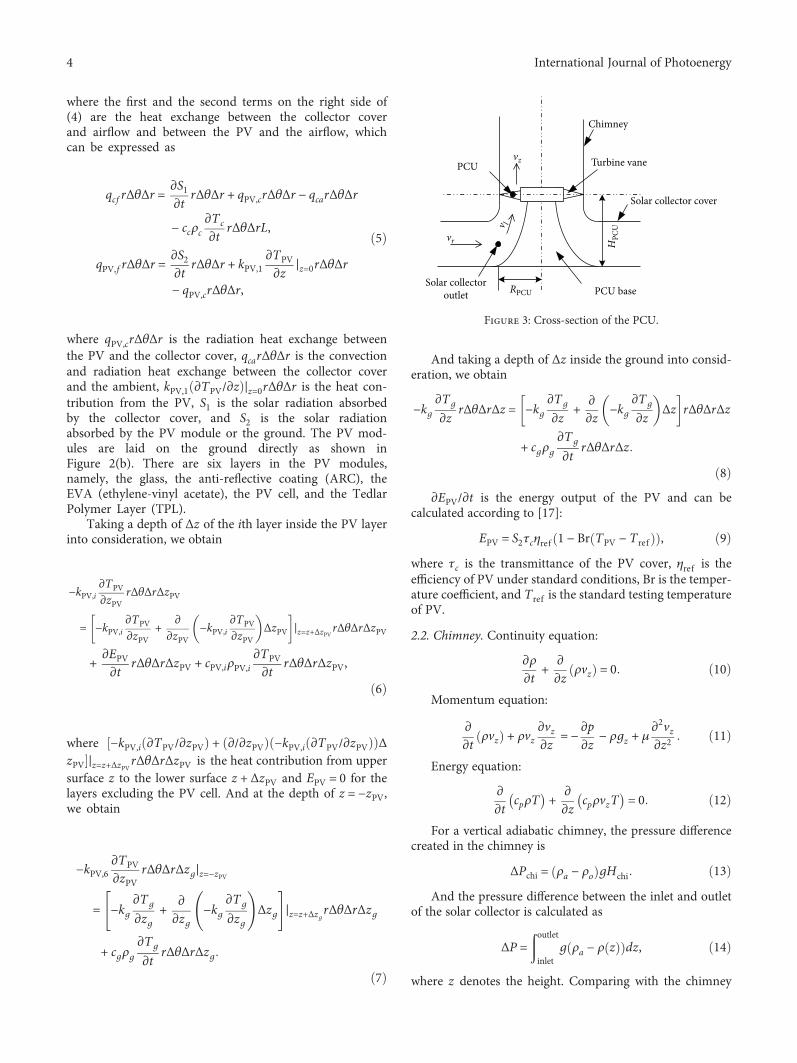
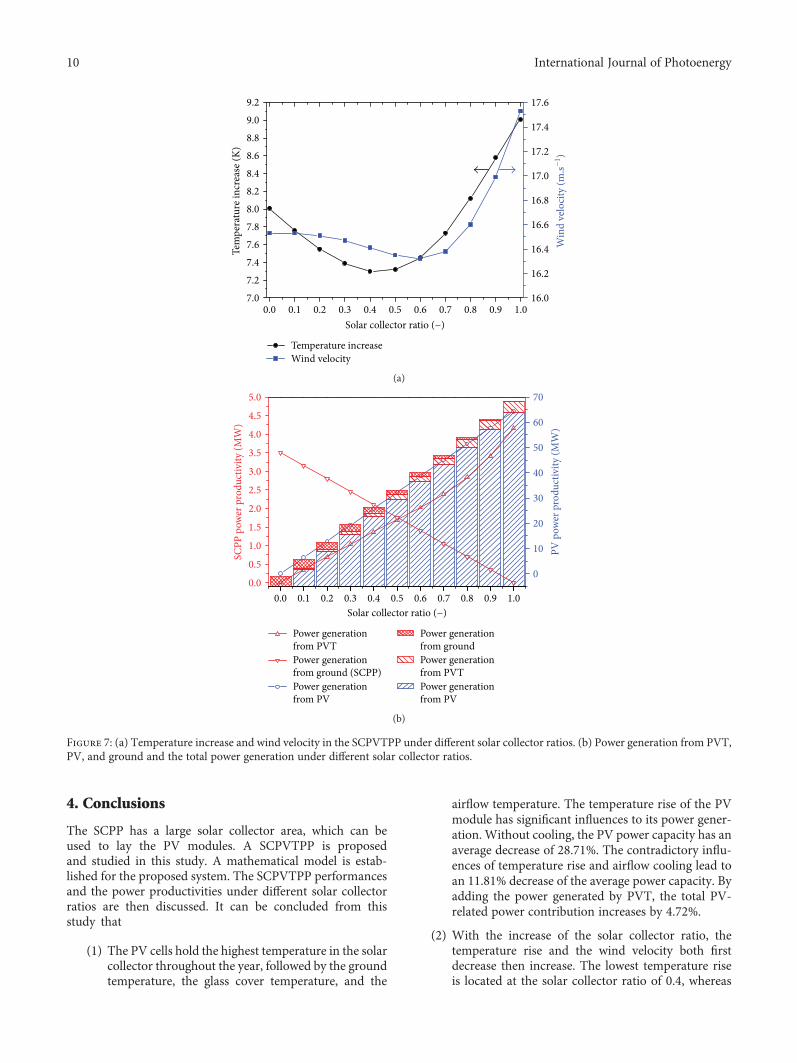
3.4. SCPVTPP with Different PV Areas. The performances ofthe SCPVTPP is discussed in Figures 5(b) and 6 for the casethat PV area takes 30% of the whole solar collector. However,there are some cases that the PV area can take more or lesspercentage to the whole solar collector. The SCPVTPPperformances and power productivities under different solarcollector area ratios are then calculated with the samemethodology as the case of 30%. The results are shown inFigures 7(a) and 7(b). It is found in Figure 7(a) that withthe increase of the solar collector ratio, the temperature riseand the wind velocity both first decrease then increase. How-ever, the valleys of the temperature rise and the wind velocityappear at different solar collector ratios. The lowest tempera-ture rise is located at the solar collector ratio of 0.4, whereasthe lowest wind velocity is located at the solar collector ratioof 0.6. Moreover, tendencies of the temperature rise and thewind velocity differ from each other. The temperature risefirst decreases gradually and then increases gradually. Butthe wind velocity first decreases slowly and then increasesquickly. It is found from Figure 7(b) that with the increaseof the solar collector ratio, the SCPP power productivitydecreases linearly and the PV power productivity increaseslinearly, whereas the PVT power productivity first increaseslinearly then increases superlinearly. The total power pro-ductivity increases with the solar collector ratio rises. Thereis a reversed solar collector ratio, exceeding the PV whichgenerates most of the power. With detailed calculation, it isfound that the solar collector ratio is 0.055, which means thatsolar thermal power takes the major role of power generationwhen the solar PV area ratio is smaller than 0.055.
Jan Feb Mar Apr May Jun Jul Aug Sep Oct Nov Dec Jan14
16
18
20
22
24
0.6
0.9
1.2
1.5
1.8
2.1
2.4
2.7
3.0
PV power capacity
PVT power capacity
Pow
er ca
paci
ty (M
W)
Pow
er ca
paci
ty fr
om P
V (M
W)
Month in the year
SCPP power capacity
Figure 6: Power capacity of the PV, SCPP, and PVT.
8 International Journal of Photoenergy
Table4:Com
parisonof
PVmod
elpo
wer,PVTpo
wercontribu
tion
,and
totalP
V-related
powercontribu
tion
(PV+PVT)in
thepresentstudy
andthePVpo
wergeneration
witho
utairflow
coolingby
taking
PVpo
wer
generation
underam
bienttemperature
asareference.
Mon
th1
23
45
67
89
1011
12Average
PVpo
wer
generation
under
ambienttemperature,P
PV_Ta
Value/M
W17.15
17.51
23.13
24.36
25.91
26.64
25.46
24.25
23.14
19.48
15.46
15.17
21.47
Percentageto
PPV_Ta/%
100.00
100.00
100.00
100.00
100.00
100.00
100.00
100.00
100.00
100.00
100.00
100.00
100.00
PVmod
elpo
wer
inthe
presentstud
yValue/M
W17.15
17.09
21.00
21.07
21.50
21.50
20.48
19.85
19.70
17.70
15.03
15.17
18.94
Percentageto
PPV_Ta/%
100.00
97.60
90.79
86.49
82.98
80.71
80.44
81.86
85.13
90.86
97.22
100.00
88.19
PVTpo
wer
contribu
tion
inthepresentstud
yValue/M
W0.85
0.85
1.13
1.16
1.22
1.23
1.16
1.10
1.08
0.91
0.72
0.73
1.01
Percentageto
PPV_Ta/%
4.96
4.85
4.89
4.76
4.71
4.62
4.56
4.54
4.67
4.67
4.66
4.81
4.72
TotalPV-related
power
contribu
tion
(PV+PVT)
Value/M
W18.00
17.94
22.13
22.23
22.72
22.73
21.64
20.95
20.78
18.61
15.75
15.90
19.95
Percentageto
PPV_Ta/%
104.96
102.46
95.68
91.26
87.69
85.32
85.00
86.39
89.80
95.53
101.88
104.81
92.91
PVpo
wer
generation
witho
utairflow
cooling
Value/M
W12.27
12.77
15.56
16.67
17.68
18.29
18.17
17.62
16.69
14.57
12.00
11.39
15.31
Percentageto
PPV_Ta/%
71.55
72.93
67.27
68.43
68.24
68.66
71.37
72.66
72.13
74.79
77.62
75.08
71.29
9International Journal of Photoenergy
4. Conclusions
The SCPP has a large solar collector area, which can beused to lay the PV modules. A SCPVTPP is proposedand studied in this study. A mathematical model is estab-lished for the proposed system. The SCPVTPP performancesand the power productivities under different solar collectorratios are then discussed. It can be concluded from thisstudy that
(1) The PV cells hold the highest temperature in the solarcollector throughout the year, followed by the groundtemperature, the glass cover temperature, and the
airflow temperature. The temperature rise of the PVmodule has significant influences to its power gener-ation. Without cooling, the PV power capacity has anaverage decrease of 28.71%. The contradictory influ-ences of temperature rise and airflow cooling lead toan 11.81% decrease of the average power capacity. Byadding the power generated by PVT, the total PV-related power contribution increases by 4.72%.
(2) With the increase of the solar collector ratio, thetemperature rise and the wind velocity both firstdecrease then increase. The lowest temperature riseis located at the solar collector ratio of 0.4, whereas
Power generationfrom PVT Power generationfrom ground (SCPP)
PV p
ower
pro
duct
ivity
(MW
)
0.0 0.1 0.2 0.3 0.4 0.5 0.6 0.7 0.8 0.9 1.0
Power generationfrom groundPower generationfrom PVTPower generationfrom PV
(b)
Figure 7: (a) Temperature increase and wind velocity in the SCPVTPP under different solar collector ratios. (b) Power generation from PVT,PV, and ground and the total power generation under different solar collector ratios.
10 International Journal of Photoenergy
the lowest wind velocity is located at the solarcollector ratio of 0.6.
(3) With the increase of the solar collector ratio, theSCPP power productivity decreases linearly and thePV power productivity increases linearly, whereasthe PVT power productivity first increases linearlythen increases superlinearly.
(4) There is a reversed solar collector ratio, exceeding thePV which generates most of the power. In this study,solar thermal power takes the major role when thesolar PV area ratio is smaller than 0.055.
Nomenclature
A: Area (m2)cp: Specific heat (J·m−2·K−1)EPV: PV power (W)f: Friction loss coefficient (−)g: Acceleration of gravity (m·s−2)h: Heat transfer coefficient (W·m−2·K−1)H: Height (m); solar radiation (W·m−2)K: Extinction coefficient (m−1)L: Length (m); channel length (m)P: Pressure (Pa); electrical power generation (W)Q: Energy flux (J·hr−1)r: Direction (−)R: Radius (m)S1: Solar radiation absorb by glass (W/m2)S2: Solar radiation absorb by PV (W/m2)T: Temperature (K)U: Compound heat coefficient (W·m−2·K−1)v: Air velocity (m·s−1)ΔPtot: Total pressure difference (Pa).
Greek Symbols
Δ: Difference (−)ρ: Air density (kg·m−3); reflectance (−)θ: Angle (°); direction (−)γ: Turbine inlet loss coefficient (−)μ: Dynamic viscosity (kg·m−1·s−1)ηt: Turbine efficiency.
Subscripts
a: Ambientc: Collector covercol: Collectorchi: Chimneyf: Airflowgro: Groundin: Turbine inleto: Outlet of the solar collectorout: Outlet of the chimneyPV: Photovoltaic.
Conflicts of Interest
The authors declare that they have no conflicts of interest.
Acknowledgments
This research was supported by the National NaturalScience Foundation of China (Grant no. 51506043), theNatural Science Foundation of Jiangsu Province (Grantno. BK20141153), the “Dayu Scholar” Foundation ofHohai University, and the China Scholarship Council(Grant no. 201706715058).
References
[1] F. Cao, L. Zhao, and L. Guo, “Simulation of a sloped solarchimney power plant in Lanzhou,” Energy Conversion andManagement, vol. 52, no. 6, pp. 2360–2366, 2011.
[2] T. Z. Ming, Y. Zheng, C. Liu, W. Liu, and Y. Pan, “Simpleanalysis on thermal performance of solar chimney powergeneration systems,” Journal of the Energy Institute, vol. 83,no. 1, pp. 6–11, 2010.
[3] X. Zhou, F. Wang, and R. M. Ochieng, “A review of solarchimney power technology,” Renewable and SustainableEnergy Reviews, vol. 14, no. 8, pp. 2315–2338, 2010.
[4] S. Larbi, A. Bouhdjar, and T. Chergui, “Performance analysisof a solar chimney power plant in the southwestern region ofAlgeria,” Renewable and Sustainable Energy Reviews, vol. 14,no. 1, pp. 470–477, 2010.
[5] R. Sangi, “Performance evaluation of solar chimney powerplants in Iran,” Renewable and Sustainable Energy Reviews,vol. 16, no. 1, pp. 704–710, 2012.
[6] C. D. Papageorgiou and P. P. Katopodis, “A modular solarcollector for desert floating solar chimney technology,” inEnergy, Environment, Ecosystems, Development and LandscapeArchitecture, pp. 126–132, WSEAS Press, Athens, Greece,2009.
[7] X. Zhou, J. Yang, B. Xiao, G. Hou, and Y. Wu, “Numericalinvestigation of a compressible flow through a solar chimney,”Heat Transfer Engineering, vol. 30, no. 8, pp. 670–676, 2009.
[8] X. Zhou, M. A. D. S. Bernardes, and R. M. Ochieng, “Influenceof atmospheric cross flow on solar updraft tower inflow,”Energy, vol. 42, no. 1, pp. 393–400, 2012.
[9] S. Nizetic, N. Ninic, and B. Klarin, “Analysis and feasibil-ity of implementing solar chimney power plants in theMediterranean region,” Energy, vol. 33, no. 11, pp. 1680–1690, 2008.
[10] F. Cao, H. Li, L. Zhao, T. Bao, and L. Guo, “Design andsimulation of the solar chimney power plants with TRNSYS,”Solar Energy, vol. 98, pp. 23–33, 2013.
[11] F. Cao, L. Zhao, H. Li, and L. Guo, “Performance analysis ofconventional and sloped solar chimney power plants inChina,” Applied Thermal Engineering, vol. 50, no. 1, pp. 582–592, 2013.
[12] J. A. Duffie and W. A. Beckman, Solar Engineering of ThermalProcesses, John Wiley & Sons, New York, NY, USA, 2006.
[13] E. C. J. Kern and M. C. Russell, “Combined photovoltaic andthermal hybrid collector systems,” in IEEE PhotovoltaicSpecialists Conference, vol. 1, pp. 1153–1157, Washington,DC, USA, 1978.
[14] L. W. Florschuetz, “Extension of the Hottel-Whillier model tothe analysis of combined photovoltaic/thermal flat plate col-lectors,” Solar Energy, vol. 22, no. 4, pp. 361–366, 1979.
11International Journal of Photoenergy
[15] A. A. Hegazy, “Comparative study of the performances of fourphotovoltaic/thermal solar air collectors,” Energy Conversionand Management, vol. 41, no. 8, pp. 861–881, 2000.
[16] H. Yang, J. Burnett, and J. Ji, “Simple approach to cooling loadcomponent calculation through PV walls,” Energy and Build-ings, vol. 31, no. 3, pp. 285–290, 2000.
[17] G. Chao, Numerical and Experimental Study of Tri-FunctionalPhotovoltaic/Thermal Collector [Ph.D. Thesis], University ofScience and Technology of China, China, 2015.
[18] X. Zhou and Y. Xu, “Solar updraft tower power generation,”Solar Energy, vol. 128, pp. 95–125, 2016.
[19] J. Schlaich, R. Bergermann, W. Schiel, and G. Weinrebe,“Design of commercial solar updraft tower systems—utiliza-tion of solar induced convective flows for power generation,”Journal of Solar Energy Engineering, vol. 127, no. 1, pp. 117–124, 2005.
[20] W. Haaf, “Solar chimneys. Part II: preliminary test resultsfrom the Manzanares pilot plant,” International Journal ofSolar Energy, vol. 2, no. 2, pp. 141–161, 1984.
[21] J. Schlaich, The Solar Chimney: Electricity from the Sun, AxelMenges, Stuttgart, Germany, 1995.
[22] Y. J. Dai, H. B. Huang, and R. Z. Wang, “Case study of solarchimney power plants in Northwestern regions of China,”Renewable Energy, vol. 28, no. 8, pp. 1295–1304, 2003.
[23] M. O. Hamdan, “Analysis of a solar chimney power plant inthe Arabian gulf region,” Renewable Energy, vol. 36, no. 10,pp. 2593–2598, 2011.
[24] X. Zhou, F. Wang, J. Fan, and R. M. Ochieng, “Performanceof solar chimney power plant in Qinghai-Tibet plateau,”Renewable and Sustainable Energy Reviews, vol. 14, no. 8,pp. 2249–2255, 2010.
[25] A. Asnaghi and S. M. Ladjevardi, “Solar chimney power plantperformance in Iran,” Renewable and Sustainable EnergyReviews, vol. 16, no. 5, pp. 3383–3390, 2012.
12 International Journal of Photoenergy
TribologyAdvances in
Hindawiwww.hindawi.com Volume 2018
Hindawiwww.hindawi.com Volume 2018
International Journal ofInternational Journal ofPhotoenergy
Hindawiwww.hindawi.com Volume 2018
Journal of
Chemistry
Hindawiwww.hindawi.com Volume 2018
Advances inPhysical Chemistry
Hindawiwww.hindawi.com
Analytical Methods in Chemistry
Journal of
Volume 2018
Bioinorganic Chemistry and ApplicationsHindawiwww.hindawi.com Volume 2018