Design and Validation of a Proportional Throttle Valve System for Liquid-Fuel Active Combustion Control by Noah H. Schiller Thesis submitted to the Faculty of Virginia Polytechnic Institute and State University in partial fulfillment of the requirements for a degree of Master of Science in Mechanical Engineering Dr. William R. Saunders, Chairman Dr. Uri Vandsburger Dr. William T. Baumann October 8, 2003 Blacksburg, Virginia Keywords: fuel modulation, piezoelectric actuator, active combustion control, proportional fuel injection, high-bandwidth valve
Transcript
Design and Validation of a Proportional Throttle Valve System for Liquid-Fuel Active Combustion Control
by
Noah H. Schiller
Thesis submitted to the Faculty of Virginia Polytechnic Institute and State University
in partial fulfillment of the requirements for a degree of
Master of Science in
Mechanical Engineering
Dr. William R. Saunders, Chairman Dr. Uri Vandsburger
Design and Validation of a Proportional Throttle Valve System for Liquid-Fuel Active Combustion Control
Noah H. Schiller
ABSTRACT High-bandwidth fuel modulation is currently one of the most promising methods for active combustion control. To attenuate the large pressure oscillations in the combustion chamber, the fuel is pulsed so that the heat release rate fluctuations damp the pressure oscillations in the combustor. This thesis focuses on the development and implementation of a high-bandwidth, proportional modulation system for liquid-fuel active combustion control. The throttle valve modulation system, discussed in this thesis, uses a 500-µm piezoelectric stack coupled with an off-the-shelf valve. After comparing three other types of actuators, the piezoelectric stack was selected because of its compact size, bandwidth capabilities, and relatively low cost. Using the acoustic resonance of the fuel line, the system is able to achieve 128% pressure modulation, relative to the mean pressure, and is capable of producing more than 75% flow modulation at 115 Hz. Additionally, at 760 Hz the system produces 40% pressure modulation and 21% flow modulation with flow rates between 0.4 and 10 gph. Control authority was demonstrated on a single-nozzle kerosene combustor which exhibits a well-pronounced instability at ~115 Hz. Using the modulation system, the fundamental peak of the combustion instability was reduced by 30 dB, and the broadband sound pressure levels inside the combustor were reduced by 12 dB. However, the most important conclusion from the combustion control experiments was not the system’s accomplishments, but rather its inability to control the combustor at high global equivalence ratios. Our work indicates that having the ability to modulate a large percentage of the primary fuel is not always sufficient for active combustion control.
iii
Acknowledgements I would like to graciously thank all of the people who helped make this work possible. Above all, I’d like to thank Dr. Saunders, whose patience, guidance and positive attitude made my research experience very rewarding. I would also like to thank all of the VACCG for their help with various aspects of this project, and for their friendship. In particular, I want to thank Wajid for his guidance in the lab; I truly enjoyed working with you. I also want to thank Anne for her help with the latter portions of the project, and for editing this thesis. Finally, I’d like to thank Bethany and my family for their endless encouragement and support.
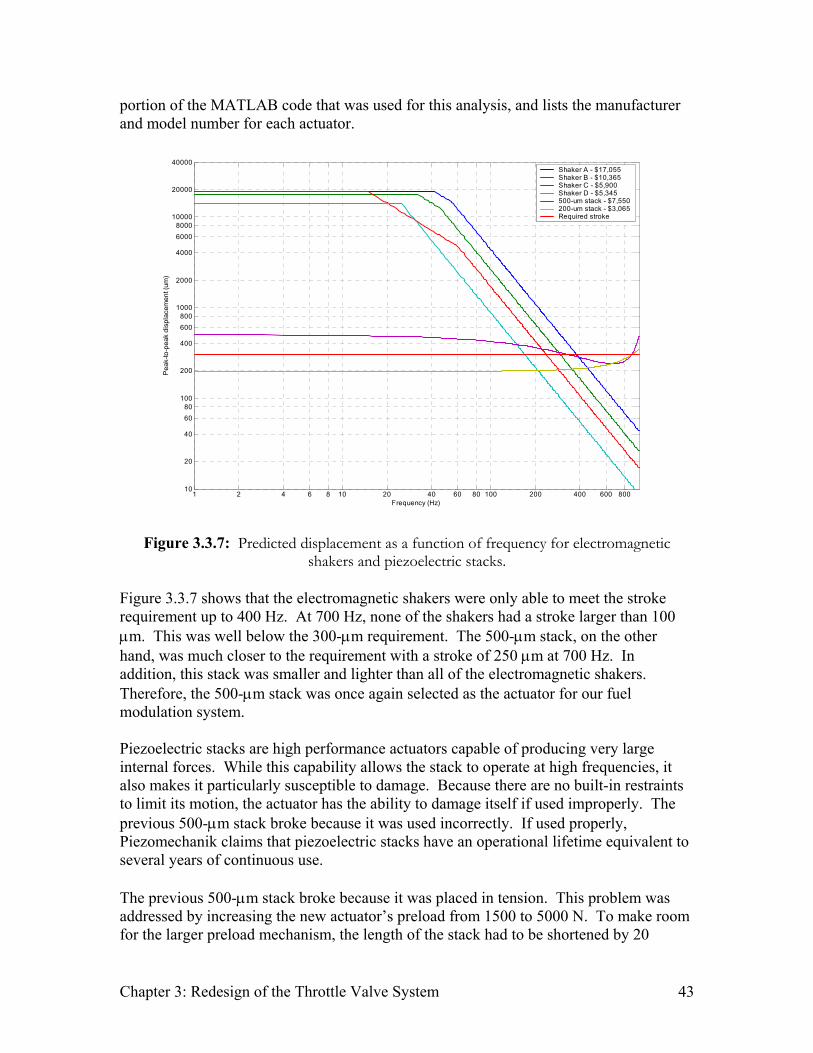
shakers and piezoelectric stacks . . . . . . . . . . . . . . . . . . . . . . . . . . . . . . 43 Figure 3.3.8: Operating range for the 500-µm stack driven with the LE 1000/100
amplifier . . . . . . . . . . . . . . . . . . . . . . . . . . . . . . . . . . . . . . . . . . . . . . . 44 Figure 3.5.1: Photograph of the valve assembly . . . . . . . . . . . . . . . . . . . . . . . . . . . . 45 Figure 3.6.1: Schematic of the system used for acoustic tuning . . . . . . . . . . . . . . . . . 47 Figure 3.6.2: a. Amplitude of the frequency response function between pressure
transducer #1 located 4” upstream of the valve and the amplifier monitor signal. b. Amplitude of the frequency response function for pressure transducer #3 located downstream of the valve (pipe length L2=134”) . . . . . . . . . . . . . . . . . . . . . . . . . . . . . . . . . . . . . . . . . . . . . . . 48
Figure 3.6.3: Conceptual relationship between the orifice area and pressure fluctuations at the valve . . . . . . . . . . . . . . . . . . . . . . . . . . . . . . . . . . . . 49
Figure 3.6.4: a. Amplitude of the frequency response function between pressure transducer #1 located 4” upstream of the valve and the amplifier monitor signal. b. Amplitude of the frequency response function for pressure transducer #3 located downstream of the valve (pipe length L2 = 134”) . . . . . . . . . . . . . . . . . . . . . . . . . . . . . . . . . . . . . . . . . . . . . . 50
Figure 3.6.5: Amplitude of the pressure fluctuations in the fuel line with and without the Swagelok 304L-HDF4-2250 expansion chamber installed . . . . . . . 51
Figure 3.6.6: Amplitude of the frequency response function for the pressure transducer located downstream of the valve (pipe length L2 = 168”) . . . 51
Figure 3.6.7: a. Amplitude of the frequency response function for pressure transducer #1 located 4” upstream of the valve. b. Amplitude of the frequency response function for pressure transducer #3 located downstream of the valve. . . . . . . . . . . . . . . . . . . . . . . . . . . . . . . . . . . . . 52
Figure 3.6.8: a. Amplitude of the frequency response function for pressure transducer #1 located upstream of the valve. b. Amplitude of the frequency response function for pressure transducer #2 located 4” downstream of the valve. c. Amplitude of the frequency response function for pressure transducer #3 located 11.5” upstream of the nozzle (pipe length L2 = 165”) . . . . . . . . . . . . . . . . . . . . . . . . . . . . . . . 53
Figure 3.7.1: Amplitude of the frequency response function for pressure transducer #3 located downstream of the valve (pipe length L2 = 134”) . 55
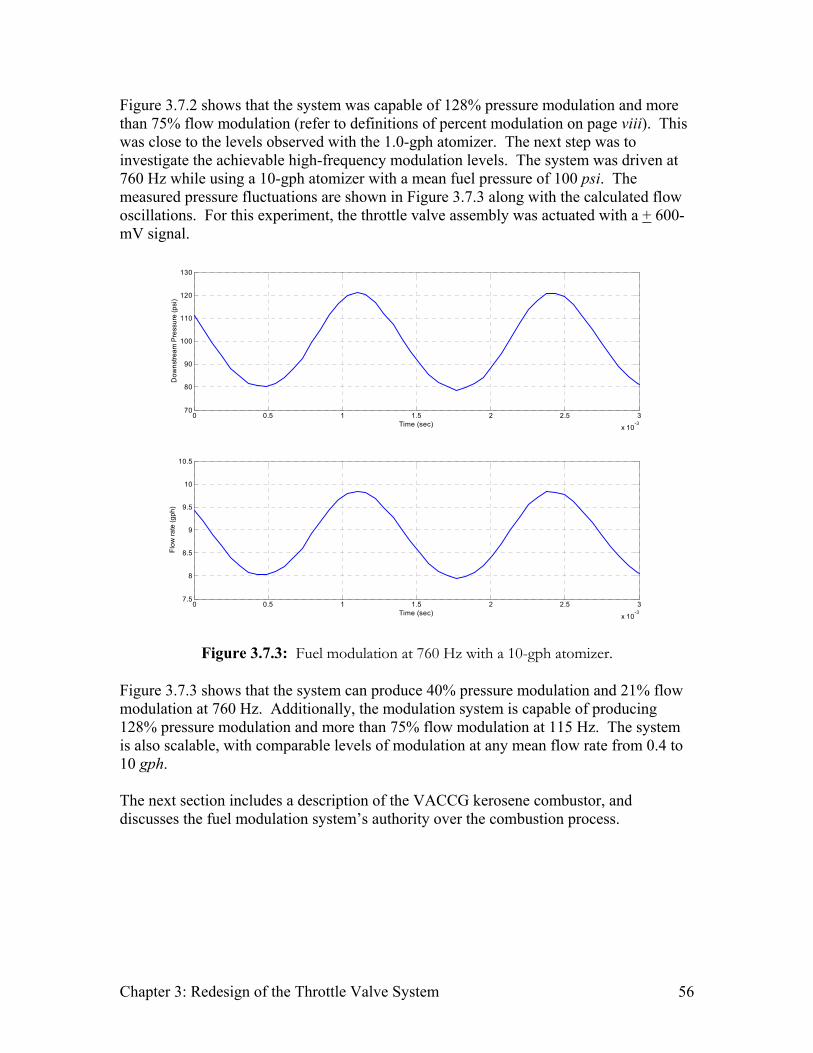
Figure 3.7.2: Fuel modulation at 115 Hz with a 10-gph atomizer . . . . . . . . . . . . . . . 55 Figure 3.7.3: Fuel modulation at 760 Hz with a 10-gph atomizer . . . . . . . . . . . . . . . 56 Figure 3.8.1: Photo of VACCG liquid-fuel combustor . . . . . . . . . . . . . . . . . . . . . . . 57 Figure 3.8.2: Schematic of the fuel and air systems for the combustor . . . . . . . . . . . 58 Figure 3.8.3: a. Photo of the flame in the stable region (φ < 0.58). b. Photo of the
flame in the first unstable region (0.58 < φ < 0.73). c. Photo of the flame in the second unstable region (φ > 0.73) . . . . . . . . . . . . . . . . . . . 59
Figure 3.8.4: a. Power spectrum of the combustor pressure in the stable region (φ < 0.58). b. Power spectrum of the combustor pressure in the first unstable region (0.58 < φ < 0.73). c. Power spectrum of the combustor pressure in the second unstable region (φ > 0.73) . . . . . . . . 59
Glossary Proportional throttle valve – A valve which regulates the flow or pressure of a fluid with any intermediate setting between fully open and fully closed. Modulation system – The components responsible for producing flow and pressure fluctuations. Flow modulation – The peak-to-peak fluctuations in the volumetric flow rate normalized by the mean flow rate:
%100modulationFlowmean
minmax
QQQ −
= .
Pressure modulation – The peak-to-peak pressure fluctuations normalized by the mean pressure:
%100modulationPressuremean
minmax
PPP −
= .
Note: The definitions for flow and pressure modulation are defined differently by some researchers. For instance, DeCastro [9] and Sun et al. [37] define percent modulation as the peak-to-peak fluctuations normalized by the peak value. The definitions used in this work match Lagimoniere [25] and Barooah et al. [3].
Chapter 1: Introduction 1
Chapter 1: Introduction 1.1 Background The recent surge in active combustion control research has been driven by the needs of the gas turbine industry. Over the past decade, the industry has faced increasingly stringent NOx emission regulations. In response to these regulations, they have switched from standard diffusion type flames to lean premixed combustors. Lean premixed combustors can effectively reduce the emission of nitrogen oxides, however, they are also susceptible to thermo-acoustic instabilities. These instabilities are caused by a self-excited loop that occurs between the heat release rate of the flame and the acoustics inside of the combustion chamber. Instabilities occur because the acoustic pressure oscillations in the combustion chamber disturb the flame resulting in fluctuations in the heat release rate, which in turn produce even larger pressure oscillations. These pressure oscillations rapidly grow to the non-linear saturation limits of the system. The resulting limit cycle can damage equipment, reduce combustor efficiency, increase emissions, and blow out the flame. These combustion instabilities can be controlled using passive or active techniques. Passive techniques, which include geometrical modifications to the combustor or the addition of devices such as Helmholtz resonators, are often only effective at frequencies above 1000 Hz [20]. For lower frequency instabilities, numerous researchers are currently studying active control techniques. Active techniques use actuators to influence the combustion process. The instability is controlled by influencing the pressure fluctuations, using a speaker for example, or by influencing the heat release rate oscillations. Although speakers can be used to effectively stabilize low power combustors, they do not have the robustness, or control authority necessary to stabilize industrial scale systems. For this reason, researchers have been studying other active control techniques for the past fifteen years. Currently, one promising method of control uses high bandwidth fuel modulation to pulse the fuel as it enters the combustor. The pulses are phased so that the heat release rate oscillations damp the pressure fluctuations in the combustion chamber. This thesis focuses on the development and implementation of a liquid-fuel modulation system for combustion control. Specifically, the modulation system is designed to operate up to 700 Hz with liquid fuel flow rates as high as 10 gph. 1.2 Motivation The Virginia Active Combustion Control Group (VACCG) first began work on a liquid fuel modulation system in 2000 with Lagimoniere [25]. The system, shown in Figure 1.2.1, consisted of a piston and check valve that were both driven by piezoelectric stacks. While the system was able to achieve significant amounts of flow modulation, it was limited to relatively small mean flow rates. Concern about the system’s inability to be
Chapter 1: Introduction 2
scaled for larger flow rates was the dominant factor in the decision to develop a new fuel modulation system.
Figure 1.2.1: Cutaway diagram of the first VACCG liquid fuel modulation system.
Adapted from DeCastro [9]. Before beginning work on a new modulation system, it was necessary to review the work that was already performed in this area. 1.3 Literature Review This section presents a representative sample of practical fuel modulation techniques related to active combustion control. For a more comprehensive review of active combustion control research, see Candel [6], DeCastro [9], Kiel [24], Lieuwen [29], and Zinn [42]. Furthermore, this section focuses on the fuel modulation techniques, and is limited to a description of the first combustion control experiments that were performed with each type of fuel modulation system. In 1988, Bloxsidge et al. [5] successfully demonstrated that fuel modulation could be used to suppress combustion instabilities. These experiments were performed on a rig, shown in Figure 1.3.1, at Cambridge University that was set up to model a low-frequency instability associated with jet afterburners. Forcing a plug axially with a mechanical shaker varied the cross sectional area of the nozzle, which controlled the flow of a premixed ethyele/air mixture through the system. This device operated with a mean mass flow rate of 0.135 kg/s, and successfully stabilized a 0.25-MW turbulent premixed burner. While Bloxsidge et al. reported that control resulted from variations in the upstream acoustic boundary condition, other researchers, including Zinn et al. [42],
Chapter 1: Introduction 3
believe that his success was at least partially due to oscillations in the flow of reactants into the combustion zone.
Figure 1.3.1: Drawing of the rig used by Bloxsidge et al. From Candel [6].
Later in the same year, Langhorne et al. [27] controlled the same rig using secondary fuel injection. In those tests, four Bosch automotive fuel injectors were used to inject ethylene into a secondary air stream that fed into the combustion chamber. These inexpensive, robust, direct-acting solenoid valves had a response time of 1 ms. With secondary fuel injection, Langhorne et al. was able to suppress the instability using only 3% additional fuel. In 1996, Hermann et al. [20] published an active combustion control paper that described a novel approach for liquid fuel modulation. The piezo-activated piston, shown in Figure 1.3.2, had a reported bandwidth of several thousand hertz. With this device, Hermann et al. controlled a 360 Hz instability on a laboratory burner using a mean fuel pressure of 218 psi and a nominal fuel flow rate of 3.1 kg/h.
Figure 1.3.2: Drawing of the piezo-driven fuel modulation system. Adapted from
Hermann et al. [20].
Chapter 1: Introduction 4
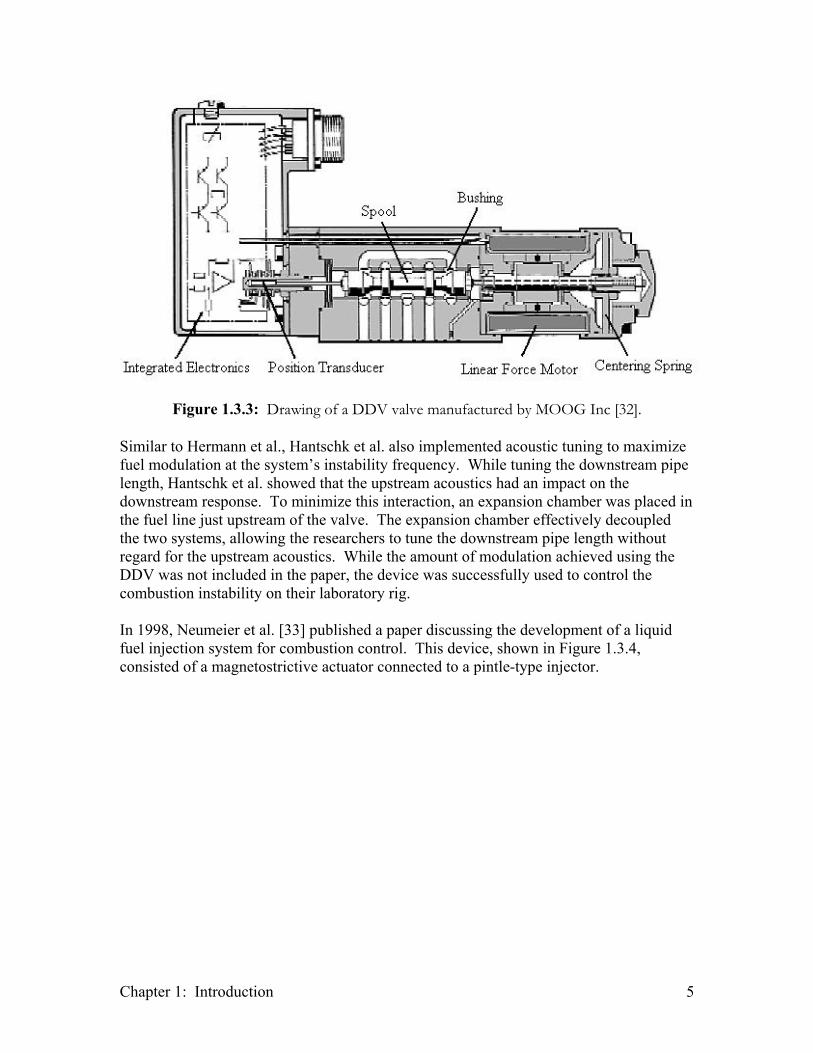
As seen in Figure 1.3.2, two pistons driven by piezoelectric elements were used to perturb the flow just before it exited the nozzle. One design constraint associated with the use of piezoelectric elements is their low tolerance for tensile stress. To address this issue, Hermann et al. used the fuel pressure to insure that the piezoelectric elements were compressed at all times. Hermann et al. were also able to make several fundamental observations concerning the use of fuel modulation for active combustion control. First, their research showed that for a stable combustor, pressure oscillations in the fuel line led to mass flow fluctuations of the fuel spray exiting the atomizer. This was illustrated indirectly by comparing the frequency response functions between the actuator input and fuel pressure measurements, and between the actuator input and flame reaction rate measurements. Since both frequency response functions showed the same shape and resonance frequency, they concluded that the pressure oscillations created by the piston were sufficient to influence the heat release rate of the flame. Another conclusion of Hermann et al.’s research was the benefit of acoustic tuning. Hermann et al. used acoustic tuning to maximize the pressure oscillations in the fuel line for a particular frequency. Tuning was accomplished by adjusting the length of the fuel supply line until the fundamental acoustic resonance of the system corresponded to the desired frequency. While relatively small pressure oscillations were possible off resonance, peak sinusoidal amplitudes of over 150 psi were achieved using the piezo-actuated device driven at the system’s resonant frequency. Hantschk et al. [17] published a combustion control paper in 1996 discussing the use of a modified direct-drive valve (DDV) manufactured by MOOG Inc. The modified version of MOOG’s high-speed servo valve had a frequency response of up to 450 Hz, much higher than standard models that can only reach 150 Hz. The increased bandwidth was required to control the 275 Hz combustion instability found in the liquid fuel system used by Hantschk et al. Figure 1.3.3 shows the schematic for a typical DDV manufactured by MOOG Inc. More information about these valves can be found at www.moog.com.
Chapter 1: Introduction 5
Figure 1.3.3: Drawing of a DDV valve manufactured by MOOG Inc [32].
Similar to Hermann et al., Hantschk et al. also implemented acoustic tuning to maximize fuel modulation at the system’s instability frequency. While tuning the downstream pipe length, Hantschk et al. showed that the upstream acoustics had an impact on the downstream response. To minimize this interaction, an expansion chamber was placed in the fuel line just upstream of the valve. The expansion chamber effectively decoupled the two systems, allowing the researchers to tune the downstream pipe length without regard for the upstream acoustics. While the amount of modulation achieved using the DDV was not included in the paper, the device was successfully used to control the combustion instability on their laboratory rig. In 1998, Neumeier et al. [33] published a paper discussing the development of a liquid fuel injection system for combustion control. This device, shown in Figure 1.3.4, consisted of a magnetostrictive actuator connected to a pintle-type injector.
Chapter 1: Introduction 6
Figure 1.3.4: Drawing of the fuel injection system used by Neumeier et al. [33].
The system was actuated by applying a current to the coil surrounding the magnetostrictive rod. The induced magnetic field caused the rod to change length, which moved the pintle. Varying the position of the pintle changed the area of the flow passage, and in turn affected the flow. The pintle was held in contact with the magnetostrictive rod at all times by a fluid pressure of 1200 psi. The system required three separate controllers. The first was a “slow” controller, used to regulate the mean fuel flow rate through the injector. A “medium” controller was implemented to modulate the pintle at frequencies necessary for combustion control (e.g. 50 – 1000 Hz), and the “fast” controller was used to improve the atomization characteristics of the injector. Neumeier et al. found that using the “fast” controller to modulate the fuel at 2400 Hz minimized the mean diameter of the droplets leaving the injector.
Chapter 1: Introduction 7
Measurements of the pressure oscillations in the combustion chamber were indirectly used to determine the device’s ability to produce heat release rate oscillations. Neumeir et al. modulated the fuel at 860 Hz and found a significant spike in the combustion pressure at this frequency. Therefore, the researchers concluded that this device had sufficient authority over the heat release rate to damp combustion instabilities. While Neumeier et al. didn’t include combustion control results in their paper, others, such as Heising et al. [19], showed that this device could successfully control combustion instabilities. The size of this fuel injector is one disadvantage of the design. Installation of the injector on some combustors might be impractical due to its size. Another concern is the proximity of the actuator to the combustion chamber. The actuators location may expose it to large thermal and mechanical fluctuations that could potentially reduce the lifetime of the device. In 2002, two combustion control papers describing novel concepts for liquid fuel modulation were published. The first, by Sun et al. [37] discussed the development of a bi-stable fluidic diverter for use in combustion control applications. The concept behind this device is illustrated in Figure 1.3.5. The device uses the wall attachment effect that is observed when a high-speed jet passes through a restricted passage. As the jet leaves the constriction, it bends towards one of the two walls and attaches on a random basis. Small amounts of flow from the control ports can be used to disrupt the primary flow causing it to deflect to the opposite side. With this device, the researchers were able to control a relatively large flow using very small control flow rates.
Figure 1.3.5: Conceptual drawing of the fluidic diverter used by Sun et al. [37].
The fluidic diverter shown in Figure 1.3.5 was controlled using automotive fuel injectors. While the device only had a bandwidth of about 100 Hz, Sun et al. believed that this could be improved by reducing the size of the fluidic diverter. Several devices could then be placed in parallel to meet the system’s flow rate requirements. An interesting property of fluidic diverters is their ability to be configured to exhibit self-excited oscillations. By connecting one of the exit ports to a control port, flow oscillations can be produced without piloted modulation. The researchers suggested that this configuration could be used as an alternative approach for flow modulation. While an actuator would still be required to change the natural frequency of the device, it would not be required to operate at high frequencies.
Chapter 1: Introduction 8
The second paper published in 2002 was written by Barooah et al. [3] from United Technologies Research Center. This paper discussed the development of a spinning drum valve capable of 30% flow modulation up to 800 Hz with flow rates greater than 400 lbm/hr. Figure 1.3.6 shows a diagram of this concept. The valve used a rotating drum with twelve evenly spaced holes. Flow passed through the valve when the holes in the drum aligned with two exit holes in the housing. This arrangement made 1 kHz modulation possible by spinning the drum at 5000 rpm. A Moog G413-404 motor was chosen for this application.
Figure 1.3.6: Schematic of the spinning valve concept used by Barooah et al. [3].
While the valve was capable of modulating flow at high frequencies, Barooah et al. had difficulty regulating the phase of the actuator. An encoder was used to measure the position of the shaft, however, due to the twelve output ports in the drum, small errors in the shaft position corresponded to large phase errors. Although the valve was effectively used in closed loop combustion experiments, improvements are still needed to resolve the phase shift/error problem associated with this system. Recently, CFD Research Corporation (CFDRC) [8] developed a high-amplitude fuel modulation system, shown in Figure 1.3.7, for combustion control in liquid-fueled combustors. The device demonstrated considerable modulation from 10 to 900 Hz. Conversations with David Black [4] from CFDRC revealed that the system was tested with mean fuel pressures in the range of 30 or 40 psi. While the mean flow rate was not specified, the low fuel pressure and limitations of the piston design imply that modulation was achieved at low flow rates.
Chapter 1: Introduction 9
Figure 1.3.7: Diagram of the CFDRC fuel modulator. Adapted from CFDRC [8].
For this project, CFDRC focused primarily on reducing the size and weight of their electromagnetic actuator. The actuator they developed had capabilities similar to the LDS 200 shaker, from Ling Dynamic Systems, with a maximum force of 4 lbs and a low frequency stroke of 0.2 inches. However, the CFDRC actuator was 11 times lighter and 8 times smaller than the LDS shaker. This literature review covered a number of different fuel modulation systems designed for active combustion control applications. Table 1.3.3 provides a summary of each system along with the advantages and disadvantages of each design.
Table 1.3.1: Summary of reviewed fuel modulation systems.
Due to the limitations associated with each of these systems, the VACCG chose to develop a new fuel modulation system. A brief outline of the work that was performed to develop the system is included in the following section. 1.4 Thesis Overview This document follows the development process, from choosing the target specifications to the system’s final evaluation on the VACCG kerosene combustor. After two designs, a throttle valve system was developed whose performance exceeded the target specifications. Although the first attempt was not particularly elegant, it provided valuable insight towards the development of the final system. Chapter 2 explains how the specifications for the fuel modulation system were chosen. It also discusses why a throttle valve system was used, and describes the development and evaluation of the first modulation system. The final section in Chapter 2 discusses the problems encountered with this design. Chapter 3 describes the redesign of the throttle valve system. It discusses the valve selection process and gives a detailed explanation of why a piezoelectric actuator was chosen. Finally, the capabilities of the system are discussed along with the combustion control results. Chapter 4 summarizes the accomplishments and failures of the modulation system. These accomplishments include the construction of a system capable of 128% pressure modulation and over 75% flow modulation at 115 Hz (refer to definitions of percent modulation on page viii). Additionally, at 760 Hz the system produced 40% pressure modulation and 21% flow modulation with flow rates between 0.4 and 10 gph. Aside from the achievements of this work, Chapter 4 also discusses unresolved problems such as the modulation system’s inability to control the VACCG kerosene combustor at high global equivalence ratios. Finally, a few suggestions are offered for improving the modulation system.
Chapter 2: Development of a Modulation System 11
Chapter 2: Development of a Modulation System 2.1 Target Specifications The goal of this project was to develop a liquid fuel modulation system capable of stabilizing not only the 40-kW VACCG combustor, but also higher power rigs. To determine a realistic set of specifications for the modulation system, members of the VACCG contacted representatives of the jet engine and gas turbine industries. Researchers from the Air Force, NASA Glenn Research Center, and Alstom Power speculated that 40% flow modulation at frequencies up to 700 Hz would be sufficient for most combustion control applications [25]. DeCastro [9] held further discussions with engineers from NASA Glenn Research Center in 2002, and found that their active combustion control validation tests were performed on a 3-atomizer rig at United Technologies Research Center (UTRC). This facility supplied 77 gph of fuel through each atomizer. For comparison, the 40-kW VACCG combustor operates with a maximum fuel flow rate of 2 gph. Since the fuel flow rate for the UTRC combustor was so much larger than the flow rate for the 40-kW VACCG combustor, designing one modulation system for both combustors would have been very challenging. Instead, the modulation system was designed to operate with mean flow rates between 0.4 and 10 gph. The upper limit of 10 gph was chosen somewhat arbitrarily. While a mean flow rate of 77 gph did not seem realistic for our initial design of a liquid-fuel modulation system, a maximum flow rate of 2 gph would have limited the modulation system to only low power, research-size combustors. As a compromise, a flow rate of 10 gph was chosen for the current project with the intention of scaling the system at a later time to meet the needs of the UTRC facility. Although many of the fuel modulation systems reviewed in the first chapter operated with on-off actuators, this is not the most efficient method for controlling combustion instabilities. The Fourier transform of the square wave, produced by on-off actuation, creates a fundamental peak with many harmonics. Active control of combustion instabilities is primarily due to the frequency component of the control signal coinciding with the fundamental mode of the instability [7]. Therefore, on-off actuation is inefficient because it wastes the energy that is spread into the harmonics. A proportional actuator, on the other hand, can be used to produce sinusoidal fuel oscillations. The Fourier transform of a sine wave produces a single peak, which allows all of the energy to be transferred to the instability frequency. Therefore, only proportional actuators were considered for the modulation system. To summarize these specifications, the fuel modulation system needed to have the ability to produce proportional modulation up to 700 Hz with mean fuel flow rates as high as 10 gph. The system had to be robust with the capability of modulating 40% of the flow rate. Additionally, installation of the system could not require substantial changes to the existing combustor.
Chapter 2: Development of a Modulation System 12
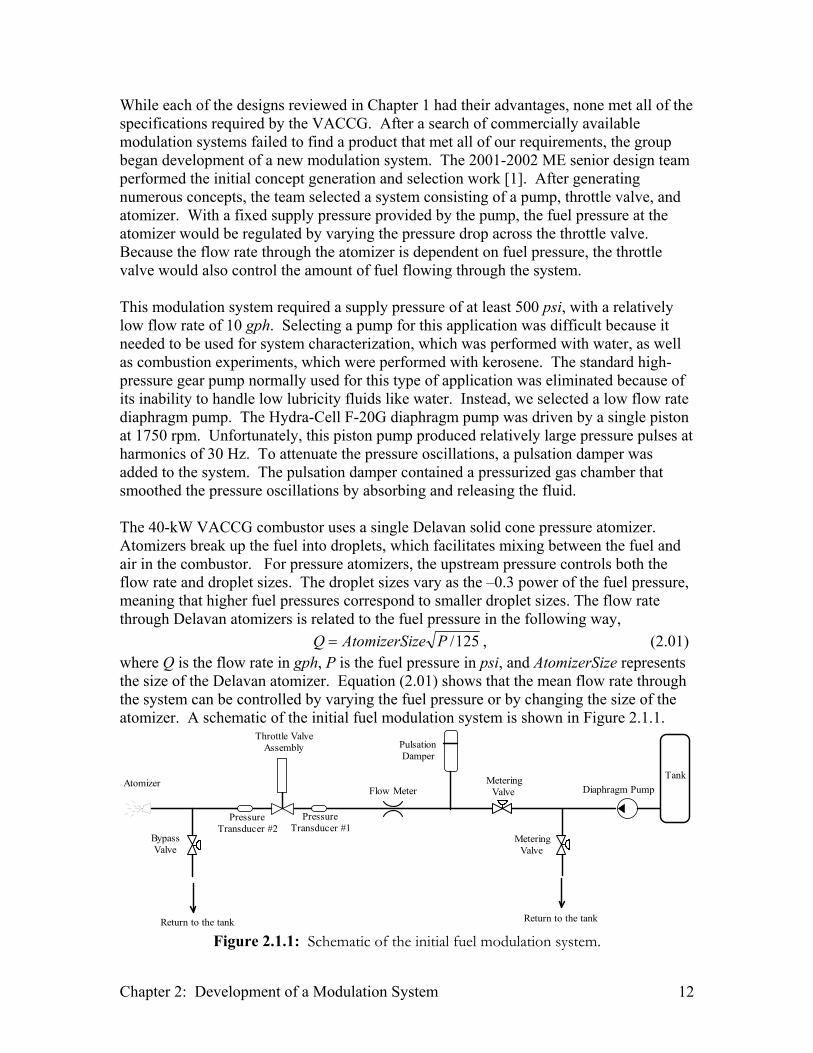
While each of the designs reviewed in Chapter 1 had their advantages, none met all of the specifications required by the VACCG. After a search of commercially available modulation systems failed to find a product that met all of our requirements, the group began development of a new modulation system. The 2001-2002 ME senior design team performed the initial concept generation and selection work [1]. After generating numerous concepts, the team selected a system consisting of a pump, throttle valve, and atomizer. With a fixed supply pressure provided by the pump, the fuel pressure at the atomizer would be regulated by varying the pressure drop across the throttle valve. Because the flow rate through the atomizer is dependent on fuel pressure, the throttle valve would also control the amount of fuel flowing through the system. This modulation system required a supply pressure of at least 500 psi, with a relatively low flow rate of 10 gph. Selecting a pump for this application was difficult because it needed to be used for system characterization, which was performed with water, as well as combustion experiments, which were performed with kerosene. The standard high-pressure gear pump normally used for this type of application was eliminated because of its inability to handle low lubricity fluids like water. Instead, we selected a low flow rate diaphragm pump. The Hydra-Cell F-20G diaphragm pump was driven by a single piston at 1750 rpm. Unfortunately, this piston pump produced relatively large pressure pulses at harmonics of 30 Hz. To attenuate the pressure oscillations, a pulsation damper was added to the system. The pulsation damper contained a pressurized gas chamber that smoothed the pressure oscillations by absorbing and releasing the fluid. The 40-kW VACCG combustor uses a single Delavan solid cone pressure atomizer. Atomizers break up the fuel into droplets, which facilitates mixing between the fuel and air in the combustor. For pressure atomizers, the upstream pressure controls both the flow rate and droplet sizes. The droplet sizes vary as the –0.3 power of the fuel pressure, meaning that higher fuel pressures correspond to smaller droplet sizes. The flow rate through Delavan atomizers is related to the fuel pressure in the following way,
125/PzeAtomizerSiQ = , (2.01) where Q is the flow rate in gph, P is the fuel pressure in psi, and AtomizerSize represents the size of the Delavan atomizer. Equation (2.01) shows that the mean flow rate through the system can be controlled by varying the fuel pressure or by changing the size of the atomizer. A schematic of the initial fuel modulation system is shown in Figure 2.1.1.
Pulsation Damper
Diaphragm PumpFlow Meter
Throttle Valve Assembly
Atomizer
PressureTransducer #2
PressureTransducer #1
Metering Valve
Tank
Metering Valve
Return to the tankReturn to the tank
Bypass Valve
Figure 2.1.1: Schematic of the initial fuel modulation system.
Chapter 2: Development of a Modulation System 13
The fuel modulation system includes two metering valves, which allow the operator to regulate the pressure upstream of the throttle valve. A flow meter and pressure transducers were also included to monitor the performance of the modulation system. To minimize the cost of the new fuel modulation system, a piezoelectric stack originally purchased for Lagimoniere’s piston system [25] was used as the actuator for the throttle valve. The custom stack, manufactured by Piezomechanik GmbH, has a maximum displacement of 500 µm with a blocked force of 1800 pounds. A detailed description of piezoelectric actuators is included in Chapter 3, so only a brief explanation will be given here. Applying an electric field to a piezoelectric material causes it to expand and contract. Even though the material is capable of generating high forces, it does not exhibit a lot of strain. A piezoelectric stack amplifies the displacement from one wafer by packing many layers on top of each other. Although piezoelectric stacks are able to produce relatively large displacements, they are extremely sensitive to tensile loads. Small tensile forces can separate the wafers, destroying the actuator. To address this problem, Piezomechanik preloaded the stack inside a casing. This allows the actuator to handle tensile forces up to the preload level. Figure 2.1.2 shows a schematic of the piezoelectric stack.
Figure 2.1.2: Schematic of a piezoelectric stack inside a casing.
A problem associated with piezoelectric stacks is that they get hot during high frequency actuation. This impacts the system because the capacitance of a piezoelectric stack rises with increasing temperature. This in turn increases the power consumption of the actuator and can severely limit the performance of the fuel modulation system. To address this problem, the VACCG requested the thermostable option from Piezomechanik. For this option, the casing is filled with thermally conductive gel, which improves the heat transfer between the stack and the casing. For high frequency actuation, the temperature of the stack could be maintained by forced cooling of the casing. A LE 1000/100 amplifier was purchased from Piezomechanik to drive the actuator. This amplifier is capable of supplying a peak current of one amp at 1000 volts. The current supplied by the amplifier for a sinusoidal voltage and purely capacitive load is defined as
Chapter 2: Development of a Modulation System 14
( ) ( )tfCVftI o ππ 2sin2= , (2.02) where f is frequency, Vo is the amplitude of the voltage signal, and C is capacitance. Using a 4.5 µF capacitor to represent the 500-µm piezoelectric stack, the system had a cut-off frequency at 189 Hz. Figure 2.1.3 shows the response, provided by Piezomechanik, for the LE 1000/100 amplifier driving a 4.5 µF load.
10 20 40 60 80 100 200 400 600 800 1000100
200
400
600
8001000
2000
Frequency (Hz)
Out
put V
olta
ge (V
)
Figure 2.1.3: Response of the LE 1000/100 amplifier driving a 4.5 µF load (provided by
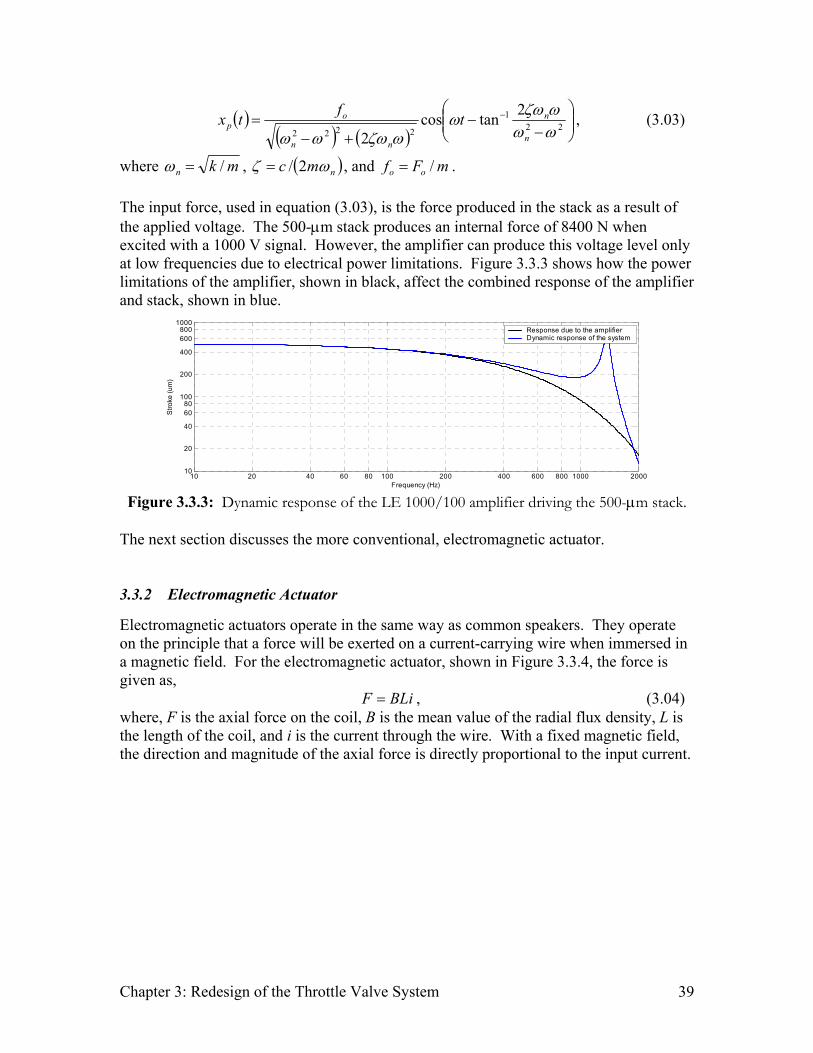
Piezomechanik). The figure indicates that a stroke of 100 µm can be expected at 800 Hz. Due to this limitation, a higher-power switching amplifier was obtained from Piezomechanik. The RCV 1000/7 amplifier was seven times more powerful than the LE 1000/100 amplifier. Using the RCV amplifier, a stroke of 500 µm could be expected up to 500 Hz, with only a 40% reduction in stroke at 800 Hz. While the high-power amplifier was available, the majority of the evaluation experiments were still performed using the LE 1000/100 amplifier. Since the low-power amplifier ended up meeting the needs of the system, the RCV 1000/7 amplifier was only used for a handful of experiments. After selecting the actuation system, the throttle valve was designed. The next section discusses how the selected actuator influenced the design process. 2.2 Throttle Valve Design The throttle valve design was partially determined by the actuator. To obtain 40% flow modulation, the small stroke from the piezoelectric stack had to produce a substantial change in the valve’s orifice area. This limitation indirectly determined the geometry of the valve. For our application, a quick opening profile was required in order to produce a large change in flow rate with only a small deflection of the valve stem. Figure 2.2.1 compares the shape of a quick opening profile with two other flow curves.
Chapter 2: Development of a Modulation System 15
0
10
20
30
40
50
60
70
80
90
100
0 10 20 30 40 50 60 70 80 90 100
Travel Percent
Flow
Rat
e Pe
rcen
tQuick opening
Regulating
Tapered needle
Figure 2.2.1: Flow profiles for three different valve geometries.
Three types of stem tips produced the curves shown in Figure 2.2.1. These are shown in Figure 2.2.2.
Figure 2.2.2: Diagrams for three types of Swagelok valves.
Aside from the shape of the valve stem, the orifice diameter is another variable that affects the throttle valve’s response. As the orifice diameter increases, a smaller deflection of the valve stem is required to produce the same change in orifice area. Other than dictating a quick opening profile with a large orifice diameter, the actuator also required a non-rotating valve stem. In addition, the valve needed to be normally closed with the ability to withstand fluid pressures up to 500 psi. The valve had to be easy to bleed as well, since small quantities of air trapped in the system are detrimental to the
Chapter 2: Development of a Modulation System 16
performance of fuel modulation systems. Furthermore, a rigid valve seat was required to ensure that no portion of the actuator’s stroke would be wasted deforming the seat. After a search of commercially available valves failed to find a product that met our requirements, a custom valve was developed. A conceptual drawing of this valve is shown in Figure 2.2.3.
Figure 2.2.3: Conceptual drawing of the throttle valve. Adapted from DeCastro [9].
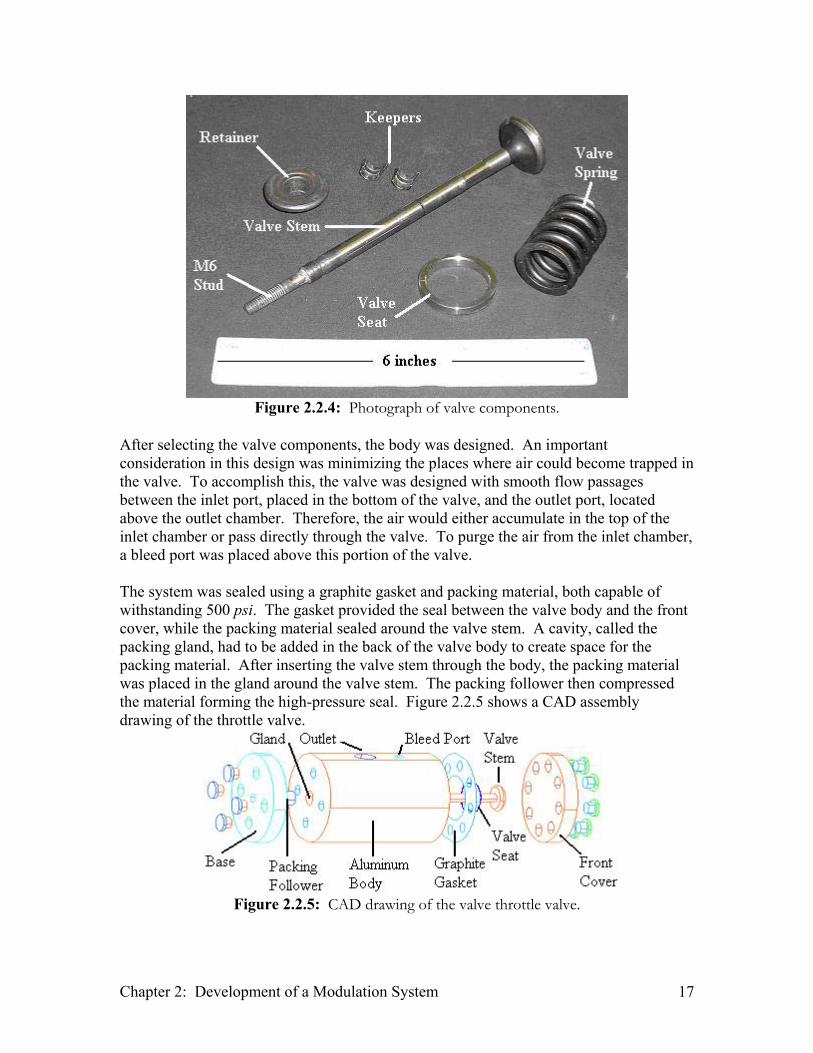
In the normally closed configuration, shown in Figure 2.2.3, the actuator pushes the valve open and then uses the pressure differential across the valve face to close it. A hardened stainless steel valve stem was purchased for this application. This automotive valve stem has a large diameter head and a quick opening profile. Since it was designed for the high temperature and pressure environment inside an internal combustion engine, the valve stem is not affected by kerosene at 500 psi. Another advantage of using the automotive valve stem is that the groove in its base facilitates the attachment of a valve spring. The valve spring was attached to the stem using automotive keepers and a valve spring retainer. Adding the valve spring preloaded the system, which reduced the risk of placing the actuator in tension. To connect the valve stem to the actuator an M6 stud was silver soldered into the base of the valve stem. Finally, a nickel alloy valve seat was selected to ensure that the valve would seal properly. Figure 2.2.4 shows the valve stem, seat, spring, retainer and keepers.
Chapter 2: Development of a Modulation System 17
Figure 2.2.4: Photograph of valve components.
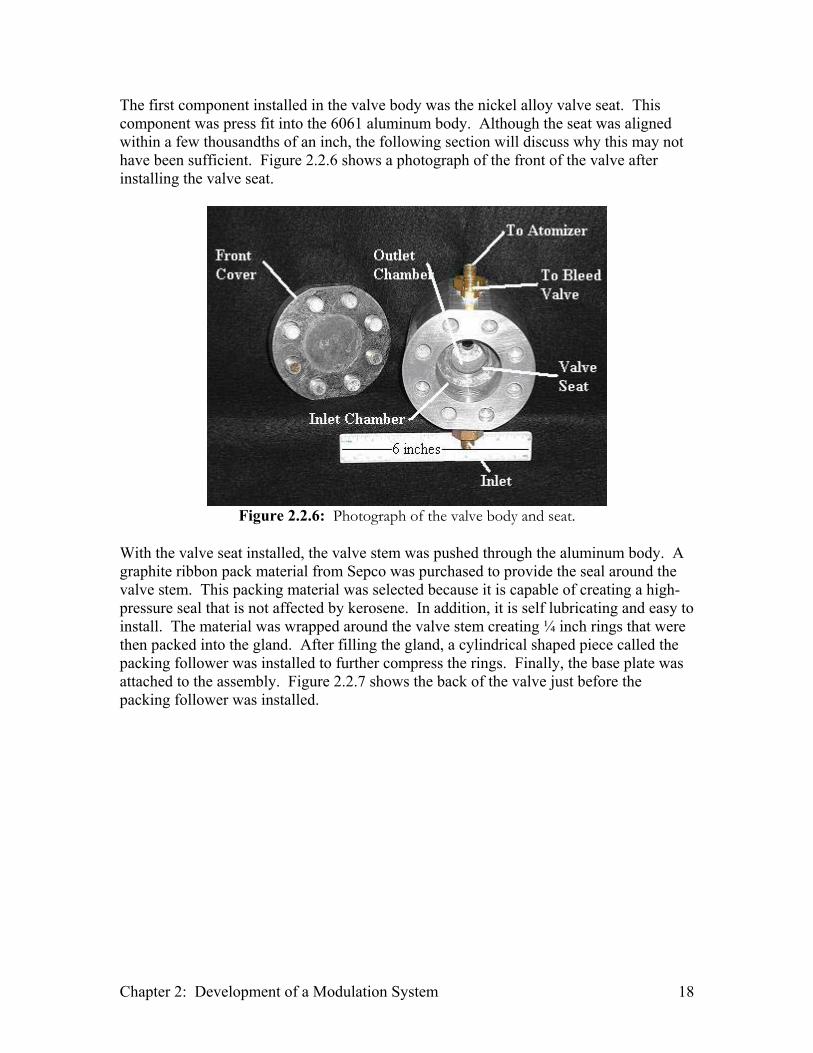
After selecting the valve components, the body was designed. An important consideration in this design was minimizing the places where air could become trapped in the valve. To accomplish this, the valve was designed with smooth flow passages between the inlet port, placed in the bottom of the valve, and the outlet port, located above the outlet chamber. Therefore, the air would either accumulate in the top of the inlet chamber or pass directly through the valve. To purge the air from the inlet chamber, a bleed port was placed above this portion of the valve. The system was sealed using a graphite gasket and packing material, both capable of withstanding 500 psi. The gasket provided the seal between the valve body and the front cover, while the packing material sealed around the valve stem. A cavity, called the packing gland, had to be added in the back of the valve body to create space for the packing material. After inserting the valve stem through the body, the packing material was placed in the gland around the valve stem. The packing follower then compressed the material forming the high-pressure seal. Figure 2.2.5 shows a CAD assembly drawing of the throttle valve.
Figure 2.2.5: CAD drawing of the valve throttle valve.
Chapter 2: Development of a Modulation System 18
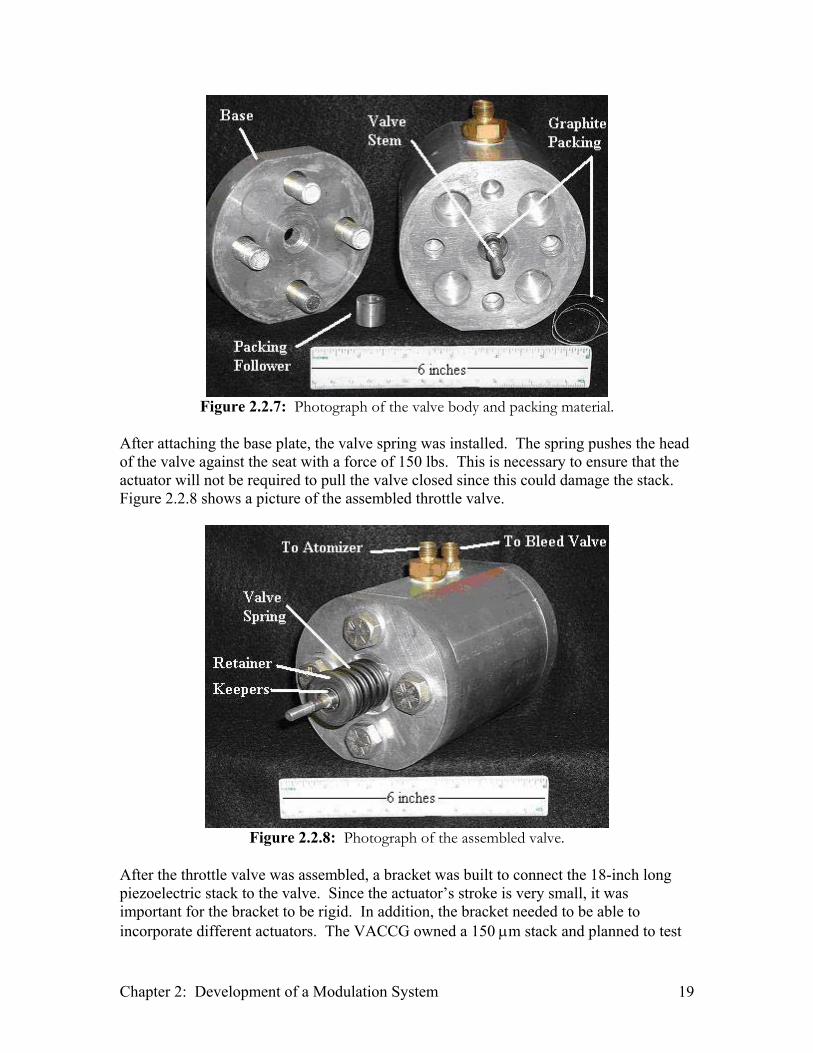
The first component installed in the valve body was the nickel alloy valve seat. This component was press fit into the 6061 aluminum body. Although the seat was aligned within a few thousandths of an inch, the following section will discuss why this may not have been sufficient. Figure 2.2.6 shows a photograph of the front of the valve after installing the valve seat.
Figure 2.2.6: Photograph of the valve body and seat.
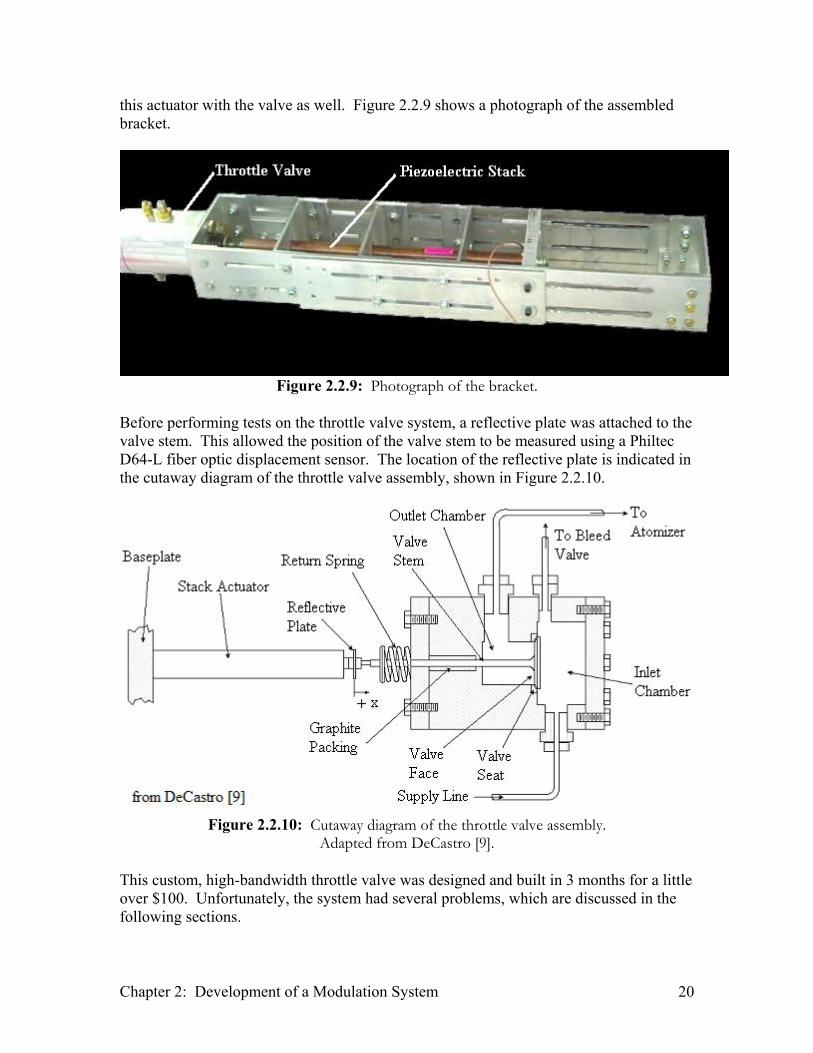
With the valve seat installed, the valve stem was pushed through the aluminum body. A graphite ribbon pack material from Sepco was purchased to provide the seal around the valve stem. This packing material was selected because it is capable of creating a high-pressure seal that is not affected by kerosene. In addition, it is self lubricating and easy to install. The material was wrapped around the valve stem creating ¼ inch rings that were then packed into the gland. After filling the gland, a cylindrical shaped piece called the packing follower was installed to further compress the rings. Finally, the base plate was attached to the assembly. Figure 2.2.7 shows the back of the valve just before the packing follower was installed.
Chapter 2: Development of a Modulation System 19
Figure 2.2.7: Photograph of the valve body and packing material.
After attaching the base plate, the valve spring was installed. The spring pushes the head of the valve against the seat with a force of 150 lbs. This is necessary to ensure that the actuator will not be required to pull the valve closed since this could damage the stack. Figure 2.2.8 shows a picture of the assembled throttle valve.
Figure 2.2.8: Photograph of the assembled valve.
After the throttle valve was assembled, a bracket was built to connect the 18-inch long piezoelectric stack to the valve. Since the actuator’s stroke is very small, it was important for the bracket to be rigid. In addition, the bracket needed to be able to incorporate different actuators. The VACCG owned a 150 µm stack and planned to test
Chapter 2: Development of a Modulation System 20
this actuator with the valve as well. Figure 2.2.9 shows a photograph of the assembled bracket.
Figure 2.2.9: Photograph of the bracket.
Before performing tests on the throttle valve system, a reflective plate was attached to the valve stem. This allowed the position of the valve stem to be measured using a Philtec D64-L fiber optic displacement sensor. The location of the reflective plate is indicated in the cutaway diagram of the throttle valve assembly, shown in Figure 2.2.10.
Figure 2.2.10: Cutaway diagram of the throttle valve assembly.
Adapted from DeCastro [9]. This custom, high-bandwidth throttle valve was designed and built in 3 months for a little over $100. Unfortunately, the system had several problems, which are discussed in the following sections.
Chapter 2: Development of a Modulation System 21
2.3 System Evaluation The first step in the evaluation process was to create a fluid model of the throttle valve system using quasi-static, incompressible assumptions. The model was based on a basic expression relating the flow rate through a restriction to the pressure drop across it:
( ) 22/ QCSGP v=∆ , (2.03) where ∆P is the pressure drop in psi, Q is the flow rate in gpm, and Cv is the flow coefficient in psigpm / . For convenience, the fluid system was represented using the circuit analogy, where the pressure differential is analogous to voltage, the square of the flow rate is analogous to current, and the specific gravity over the square of the flow coefficient is analogous to resistance. Some of the tools commonly used to analyze electrical circuits still work for this analogy, like Kirchhoff’s voltage law, although other tools, like Kirchhoff’s current law, no longer apply. Likewise, impedances still add in series, however, impedances in parallel combine as follows,
2121
21
2 ZZZZZZ
Zeq++
= . (2.04)
The fluid circuit for the fuel modulation system is shown in Figure 2.3.1. The variable impedance ZV represents the throttle valve, while the impedances ZA and ZR represent the atomizer and the return-line metering valve, respectively.
Figure 2.3.1: Circuit analogy for the modulation system.
The model was complicated by the fact that the pump behaves as a pressure dependent flow source. This means that the flow rate produced by the pump depends on the pressure it has to supply. The flow curve for the Hydra-Cell F-20G pump is shown in Figure 2.3.2.
Chapter 2: Development of a Modulation System 22
0 100 200 300 400 500 600 700 800 900 10006
7
8
9
10
11
12
13
Flow
rate
(gph
)
Pressure (psi) Figure 2.3.2: Pump curve for the Hydra-Cell F-20G.
The fluid impedance of the downstream system determines the pump’s operating point. As the impedance of the system increases, the operating point shifts along the curve, in Figure 2.3.2, toward higher pressures and lower flow rates. An empirical relationship based on this response was used to represent the pump in the system model. While the impedance of the atomizer was calculated using information provided by Delavan and the impedance of the return-line metering valve was provided by Swagelok, the characteristics of the throttle valve were still unknown. To understand how the position of the valve stem affected the valves impedance, we used an empirical relationship from Lyons [30]: ( )2/2.03.1 xp AAK += , (2.05) where K is a dimensionless loss coefficient, Ap is the inlet area, and Ax is the orifice area. For this type of valve, the orifice area was estimated as xrAx π2= , (2.06) where r is the radius of the orifice, and x is the distance between the head of the valve and the valve seat. Rewriting equation (2.05) in terms of the conventional flow coefficient, Cv, resulted in, [ ] ( )[ ] 2/122/1 /2.03.1/1200
−+= xppv AASGAC ρ , (2.07)
where Cv is the flow coefficient in psigpm / , Ap is the valve inlet area in in2, Ax is the orifice area in in2, SG is the specific gravity of the fluid, and ρ is the density of the fluid in kg/m3. To validate this relationship, equation (2.07) was used to predict the flow coefficients for several Swagelok valves as a function of valve stem position. Comparing the published values to the predictions showed that the empirical relationship from Lyons provided a rough approximation of the actual Cv values. However, since this was the only relationship available, it was still used to model the throttle valve system. The system was simulated using a 0.4-gph Delavan atomizer with an initial upstream pressure of 500 psi. Figure 2.3.3 shows the system pressure as a function of valve stem position. Notice that a displacement of less than one micron causes the downstream pressure to change from 0 to 450 psi. This indicates that the valve has a very quick opening flow profile.
Chapter 2: Development of a Modulation System 23
0 0.5 1 1.5 2 2.5 3 3.5 40
100
200
300
400
500
600
Pre
ssur
e (p
si)
Displacement (um)
Upstream PressureDownstream Pressure
Figure 2.3.3: Simulation of the fuel modulation system.
Further simulations showed that the size of the atomizer affected the system’s response. For example, with a 4.0-gph atomizer a deflection of 2.5 µm was required to fully open the valve. The following section discusses one of the problems associated with a quick opening valve. 2.3.1 Valve Seating The modulation system was experimentally evaluated using a 0.4-gph atomizer with a supply pressure of 500 psi. The initial experiments showed that the throttle valve was unable to regulate the pressure at the atomizer. After closing the valve, the downstream pressure remained near 450 psi for a few minutes before slowly decaying. The simulation described in the previous section helps explain this phenomenon. Figure 2.3.3 indicates that the gap between the valve stem and seat has to be less than half of a micron before the valve can regulate the downstream pressure. A skewed valve seat could have produced a gap much larger than half of a micron and caused the seating problem. The slow response of the downstream pressure may have been caused by small amounts of air trapped in the fuel line. In the circuit analogy, air trapped in the system is represented with a capacitor. Since capacitors discharge slowly through high impedances, the slow decay of the downstream pressure may have been caused by the high impedance atomizer. To correct the problem, a bypass line was installed between the throttle valve and atomizer. This decreased the equivalent impedance of the downstream line, improving the downstream pressure response. Depending on the bypass valve setting, the valve stem could now regulate the downstream pressure while maintaining a gap of 5 or 10 µm. A schematic of the revised modulation system is shown in Figure 2.3.4.
Chapter 2: Development of a Modulation System 24
Pulsation Damper
Diaphragm PumpFlow Meter
Throttle Valve Assembly
Atomizer
PressureTransducer #2
PressureTransducer #1
Metering Valve
PressureRegulator
Tank
Metering Valve
Return to the tankReturn to the tank
Bypass Valve
Figure 2.3.4: Schematic of the fuel modulation system with a bypass line.
With the bypass line installed, the valve was able to regulate the pressure at the atomizer. Unfortunately, other problems were soon discovered. 2.3.2 Pressure Drift The next problem with the system was the drift of the downstream pressure. With a fixed upstream pressure and valve stem position, the pressure downstream of the valve drifted, as shown in Figure 2.3.5. Note that for these experiments a valve stem position of zero means that the valve was fully closed.
0 5 10 15 20 25 30 35 400
10
20
30
40
50
60
70
80
90
100
Dow
nstre
am P
ress
ure
(psi
)
Time (sec)
0 5 10 15 20 25 30 35 400
10
20
30
40
50
60
70
80
90
100
Val
ve S
tem
Pos
ition
(um
)
Time (sec)
Figure 2.3.5: Measurements of the downstream pressure drift.
Chapter 2: Development of a Modulation System 25
The drift in the downstream pressure could have been caused by a number of factors ranging from debris in the fluid to deformation of the valve stem. Debris, possibly from the packing material, could have slowly clogged the orifice causing the drift in the system pressure. Another theory, proposed by Vaughan et al. [39], suggested that the valve stem deformed causing the pressure drift. To investigate this hypothesis, Vaughan et al. performed a finite element analysis of the valve stem using ANSYS. With a uniform pressure distribution of 435 psi on the head of the valve stem, the analysis predicted a 23-µm deformation of this component. After an investigation of this problem failed to produce conclusive results, a mean pressure controller was designed to regulate the downstream pressure. Before the controller could be designed, the system, also referred to as the plant, had to be modeled. This was accomplished by taking downstream pressure measurements for a step change in the valve stem position, and then fitting the data with a first-order curve of the form,
( )
τ
τ1
1
+=
ssG , (2.08)
where τ is the time constant of the system. Unfortunately, the time constant changes substantially depending on both the bypass valve setting and the position of the valve stem. Therefore, the controller needed to be robust to variations in the plant. Since the controller would be implemented on a digital system, a discrete model of the plant was needed. The continuous model, shown in equation (2.08), was converted to a discrete model using a zero-order hold:
( )τ
τ
T
T
ez
ezG−
−
−
−=
1 , (2.09)
where τ is the time constant, and T is the sample period. The step response of the discrete transfer function was simulated with a sample rate of 3200 Hz and a time constant of 5 seconds. Figure 2.3.6 shows that the simulation closely matches the experimental step response measured using a 4.0-gph atomizer and a closed bypass valve.
0 10 20 30 40 50 60 70 80 900
20
40
60
80
100
120
140
160
180
200
Time (sec)
Dow
nstre
am P
ress
ure
(psi
) Discrete modelExperimental step response
Figure 2.3.6: Comparison between the experimental step response and the discrete model.
Chapter 2: Development of a Modulation System 26
After modeling the plant, a controller was designed to track a step input with zero steady-state error and very little overshoot. The compensator was designed in the z-plane using the root locus method. To eliminate the steady-state error to a step input, the system needed a free integrator. This was accomplished by placing the compensator’s pole at z = 1. In order to make the system robust to variations in the plant, the compensator also needed a zero. The location of the zero was selected close to z = 1 to minimize the overshoot of the closed-loop response. Finally, the gain of the compensator was chosen to ensure that the system would be stable regardless of the valve stem position and bypass setting. The discrete compensator is shown below:
( )199.0010.0
−−
=z
zzD . (2.10)
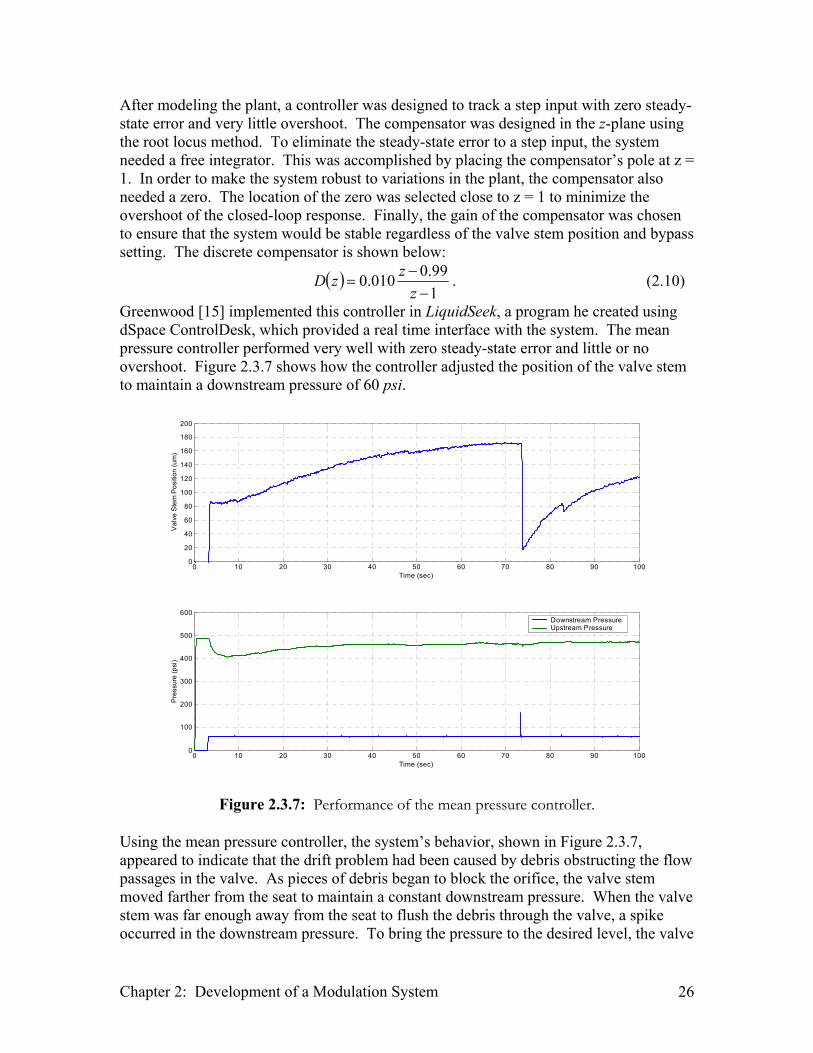
Greenwood [15] implemented this controller in LiquidSeek, a program he created using dSpace ControlDesk, which provided a real time interface with the system. The mean pressure controller performed very well with zero steady-state error and little or no overshoot. Figure 2.3.7 shows how the controller adjusted the position of the valve stem to maintain a downstream pressure of 60 psi.
0 10 20 30 40 50 60 70 80 90 1000
100
200
300
400
500
600
Time (sec)
Pre
ssur
e (p
si)
Downstream PressureUpstream Pressure
0 10 20 30 40 50 60 70 80 90 1000
20
40
60
80
100
120
140
160
180
200
Time (sec)
Val
ve S
tem
Pos
ition
(um
)
Figure 2.3.7: Performance of the mean pressure controller.
Using the mean pressure controller, the system’s behavior, shown in Figure 2.3.7, appeared to indicate that the drift problem had been caused by debris obstructing the flow passages in the valve. As pieces of debris began to block the orifice, the valve stem moved farther from the seat to maintain a constant downstream pressure. When the valve stem was far enough away from the seat to flush the debris through the valve, a spike occurred in the downstream pressure. To bring the pressure to the desired level, the valve
Chapter 2: Development of a Modulation System 27
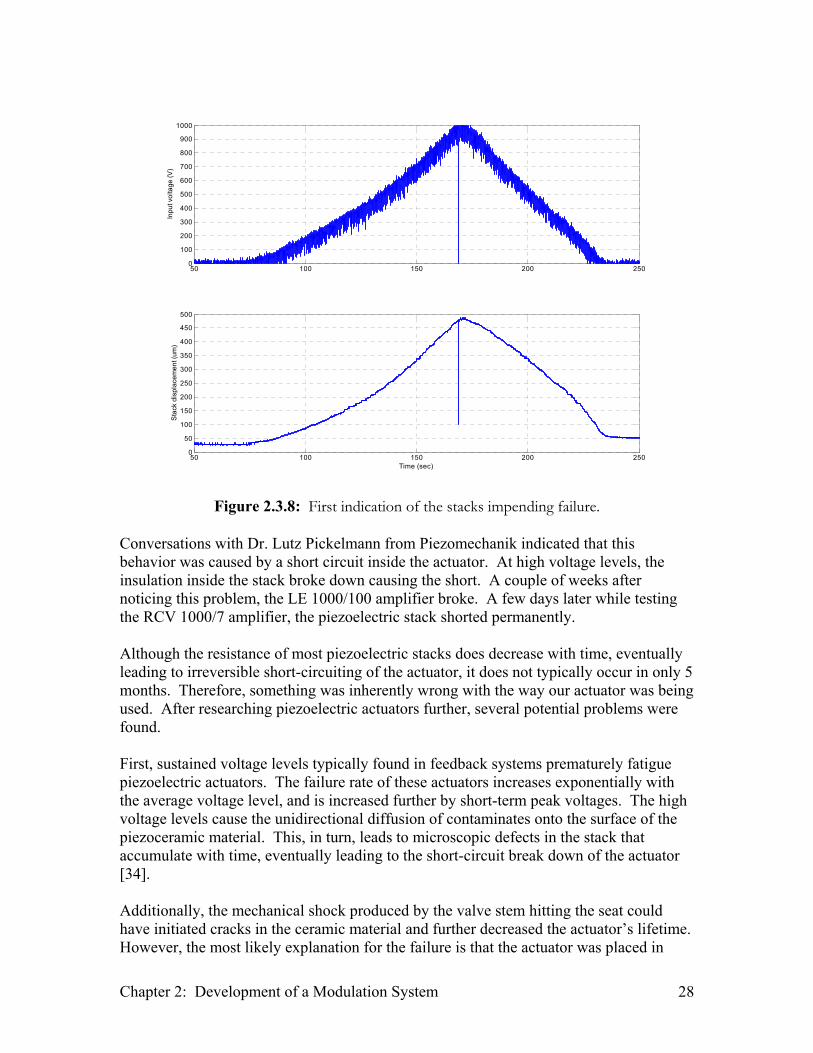
stem moved back towards the seat. Then, this process was repeated as more debris entered the valve. Because the system was not filtered, more and more debris began to accumulate in the fuel. Instead of occurring every 70 seconds, the spike in the downstream pressure began to occur every 40 or 50 seconds. After disassembling the valve, it appeared that the packing material had decayed with time, producing the majority of the debris. Impurities in the fuel could also have caused some of the system problems. For instance, the atomizers were clogging when used with the modulation system. In addition, the pressure drift problem was noticed not only with our custom valve, but with other commercially available valves as well. Therefore, installing a fuel filter in the modulation system could have eliminated a number of the system’s problems. 2.3.3 Pump Limitations Other problems with the system were created by the Hydra-Cell F-20G diaphragm pump. First, the pressure pulses created by the piston pump interfered with the throttle valve. Even with the pulsation damper installed, the pump still created fluctuations of + 20 psi upstream of the valve. As the valve was opened, these oscillations coupled into the downstream line interfering with the valve’s ability to modulate the fuel. The second problem was caused by the size of the pump. With the bypass line installed, the pump produced a higher flow rate than originally planned. Unfortunately, with this flow rate, the diaphragm pump could not maintain an adequate upstream pressure. As a result of the pump’s limitations, the system performed best when the mean downstream pressure was below 100 psi. At these mean pressures, modulation levels in excess of 40% were obtained. After installing the modulation system on the old VACCG kerosene combustor, DeCastro [9] showed that the system was able to reduce the combustor’s limit cycle amplitude by as much as 26 dB. Although a detailed description of the modulation system’s capabilities is not included here, Chapter 3 contains a thorough discussion of the capabilities of the redesigned system. 2.3.4 Stack Failure After using the system for 5 months, the piezoelectric stack began to fail. At high voltage levels, the actuator produced loud popping noises and its displacement would periodically drop to zero. This behavior is illustrated in Figure 2.3.8.
Chapter 2: Development of a Modulation System 28
50 100 150 200 2500
100
200
300
400
500
600
700
800
900
1000
Inpu
t vol
tage
(V)
50 100 150 200 2500
50
100
150
200
250
300
350
400
450
500
Sta
ck d
ispl
acem
ent (
um)
Time (sec)
Figure 2.3.8: First indication of the stacks impending failure.
Conversations with Dr. Lutz Pickelmann from Piezomechanik indicated that this behavior was caused by a short circuit inside the actuator. At high voltage levels, the insulation inside the stack broke down causing the short. A couple of weeks after noticing this problem, the LE 1000/100 amplifier broke. A few days later while testing the RCV 1000/7 amplifier, the piezoelectric stack shorted permanently. Although the resistance of most piezoelectric stacks does decrease with time, eventually leading to irreversible short-circuiting of the actuator, it does not typically occur in only 5 months. Therefore, something was inherently wrong with the way our actuator was being used. After researching piezoelectric actuators further, several potential problems were found. First, sustained voltage levels typically found in feedback systems prematurely fatigue piezoelectric actuators. The failure rate of these actuators increases exponentially with the average voltage level, and is increased further by short-term peak voltages. The high voltage levels cause the unidirectional diffusion of contaminates onto the surface of the piezoceramic material. This, in turn, leads to microscopic defects in the stack that accumulate with time, eventually leading to the short-circuit break down of the actuator [34]. Additionally, the mechanical shock produced by the valve stem hitting the seat could have initiated cracks in the ceramic material and further decreased the actuator’s lifetime. However, the most likely explanation for the failure is that the actuator was placed in
Chapter 2: Development of a Modulation System 29
tension. Static tensile loads will not damage the piezoelectric material because the end plate, shown in Figure 2.1.2, can lift from the stack. However, high frequency operation can create very large tensile forces inside the stack. This is why piezoelectric actuators need to be preloaded. Piezomechanik states that the size of the preload must be large enough to accelerate the attached mass quicker than the reset time of the actuator. A simple estimate of the required preload is given by,
2txmxmF
∆∆
== && , (2.11)
where F is the preload, m is the attached mass, ∆x is the actuator’s stroke, and ∆t is the reset time of the actuator. Our actuator was destroyed while performing experiments with the RCV 1000/7 amplifier. The documentation for this amplifier claims that it is capable of producing a 200 V step in 100 µs. Using equation (2.11), and an equivalent mass of 0.259 kg, the required preload was calculated as,
( )N
smkgF 2590
100100259.0 2 ==
µµ . (2.12)
Since the casing of the stack only provided a preload of 1500 N, any square wave or pulse produced by the amplifier could have placed the piezoelectric stack in tension. When the actuator was shipped back to Piezomechanik for repair, they confirmed that the stack had broken into three pieces because of tensile forces. The next chapter describes the new modulation system, which was developed to correct the problems associated with this design.
Chapter 3: Redesign of the Throttle Valve System 30
Chapter 3: Redesign of the Throttle Valve System 3.1 System Evaluation The throttle valve system, described in Chapter 2, had problems with valve seating, pressure drift, pump limitations, and the actuator. Although it did not meet the target specifications, the throttle valve type of system still had advantages to either a piston or spinning valve arrangement. The piston design is limited to relatively small mean flow rates, and the spinning valve has the potential for serious phase drift problems [3]. Therefore, the redesign focused on correcting the problems with the existing throttle valve system instead of pursuing a new type of modulation system. Many of the components, including the pump, valve, and actuator, had to be replaced before the revised modulation system met the specifications outlined in Chapter 2. In addition, the system needed a filter to remove debris from the fuel, and required a new bypass valve to make the system scalable. After making these modifications, the new modulation system was capable of producing 128% pressure modulation and more than 75% flow modulation at 115 Hz (refer to definitions of percent modulation on page viii). Additionally, at 760 Hz the system could produce 40% pressure modulation and 21% flow modulation with any flow rate between 0.4 and 10 gph. The revised fuel modulation system, discussed in this chapter, successfully stabilized the VACCG kerosene combustor and is currently being used to investigate the limitations associated with using primary fuel modulation for combustion control. This chapter describes the redesign process beginning with the evaluation of the bypass line. The existing bypass line had been installed to address the custom valve’s seating problem. Since this valve was being replaced, we needed to determine whether the return line was still necessary. The specifications for the modulation system stated that it needed to be capable of modulating 40% of the flow with mean flow rates between 0.4 and 10 gph. Different size atomizers would be used depending on the desired mean flow rate. Therefore, the system needed to produce 40% modulation regardless of the atomizer size. To determine if the system would be capable of this without a bypass line, the circuit analogy, shown in Figure 3.1.1, was used to predict the flow modulation as a function of atomizer size. Recall that for the circuit analogy, the pressure differential is analogous to voltage, the square of the flow rate is analogous to current, and the flow impedance can be represented as an electrical resistance. This analysis was performed with no bypass line and a fixed upstream pressure of 500 psi.
Chapter 3: Redesign of the Throttle Valve System 31
+- Za
Zv
500 psi
p1
Z b
Figure 3.1.1: Circuit analogy used to estimate the system’s performance without the
bypass line. In Figure 3.1.1, Zv represents the impedance of the throttle valve and Za represents the impedance of the atomizer. The bounds on Zv are determined by the valve geometry and the stroke of the actuator. Since both the valve and actuator needed to be replaced, the impedance range was chosen arbitrarily. For this simulation, the impedance of the valve was varied from 1 to 10 psi/gph2. Figure 3.1.2 shows how the atomizer size affects flow modulation.
0.4 0.6 0.8 1 2 4 6 8 10 200
10
20
30
40
50
60
70
80
90
100
Atomizer Size
Flow
Mod
ulat
ion
(%)
Figure 3.1.2: Percent flow modulation versus atomizer size.
As seen in Figure 3.1.2, the percent flow modulation changes substantially depending on the size of the atomizer. However, with the bypass line installed, the modulation level could be maintained regardless of the atomizer size. By adjusting a metering valve in the bypass line to maintain a constant downstream impedance, the system could operate with multiple atomizers without sacrificing performance. A Swagelok M-series valve with a vernier handle was selected for the bypass line. To maintain a constant downstream impedance of 0.75 psi/gph2, Table 3.1.1 shows the appropriate bypass valve setting for each size of atomizer.
Chapter 3: Redesign of the Throttle Valve System 32
Table 3.1.1: Bypass valve settings for a constant downstream impedance.
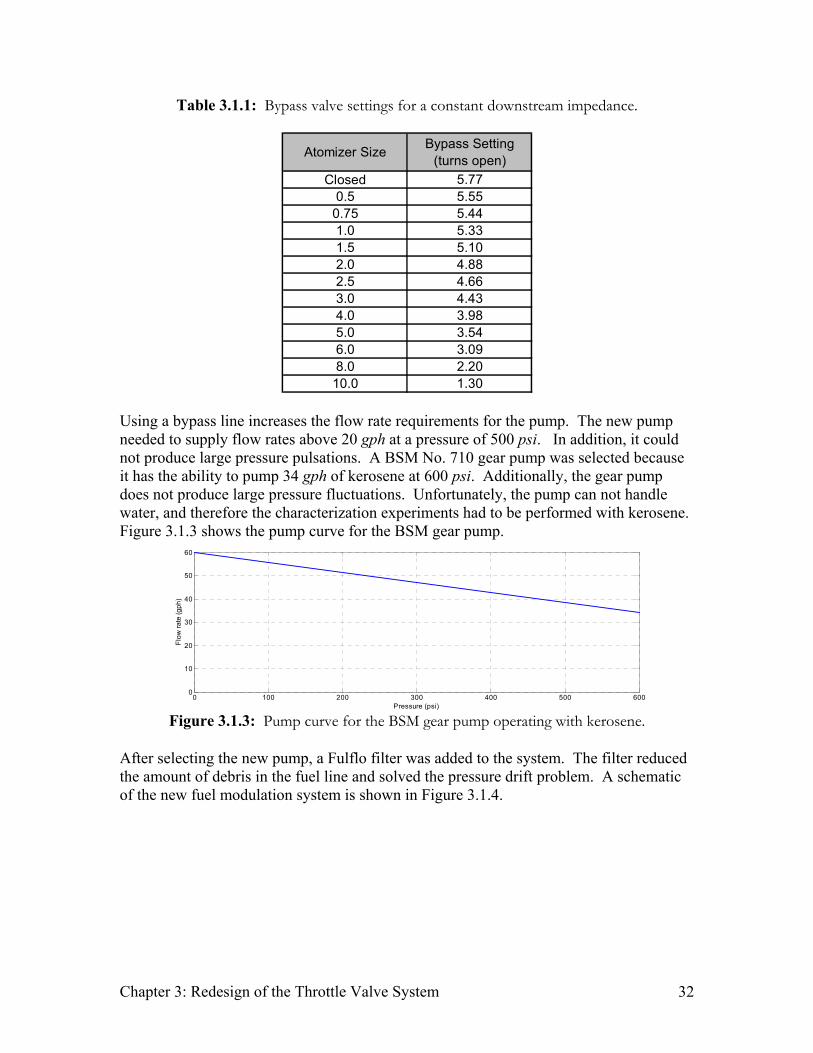
Using a bypass line increases the flow rate requirements for the pump. The new pump needed to supply flow rates above 20 gph at a pressure of 500 psi. In addition, it could not produce large pressure pulsations. A BSM No. 710 gear pump was selected because it has the ability to pump 34 gph of kerosene at 600 psi. Additionally, the gear pump does not produce large pressure fluctuations. Unfortunately, the pump can not handle water, and therefore the characterization experiments had to be performed with kerosene. Figure 3.1.3 shows the pump curve for the BSM gear pump.
0 100 200 300 400 500 6000
10
20
30
40
50
60
Flow
rate
(gph
)
Pressure (psi) Figure 3.1.3: Pump curve for the BSM gear pump operating with kerosene.
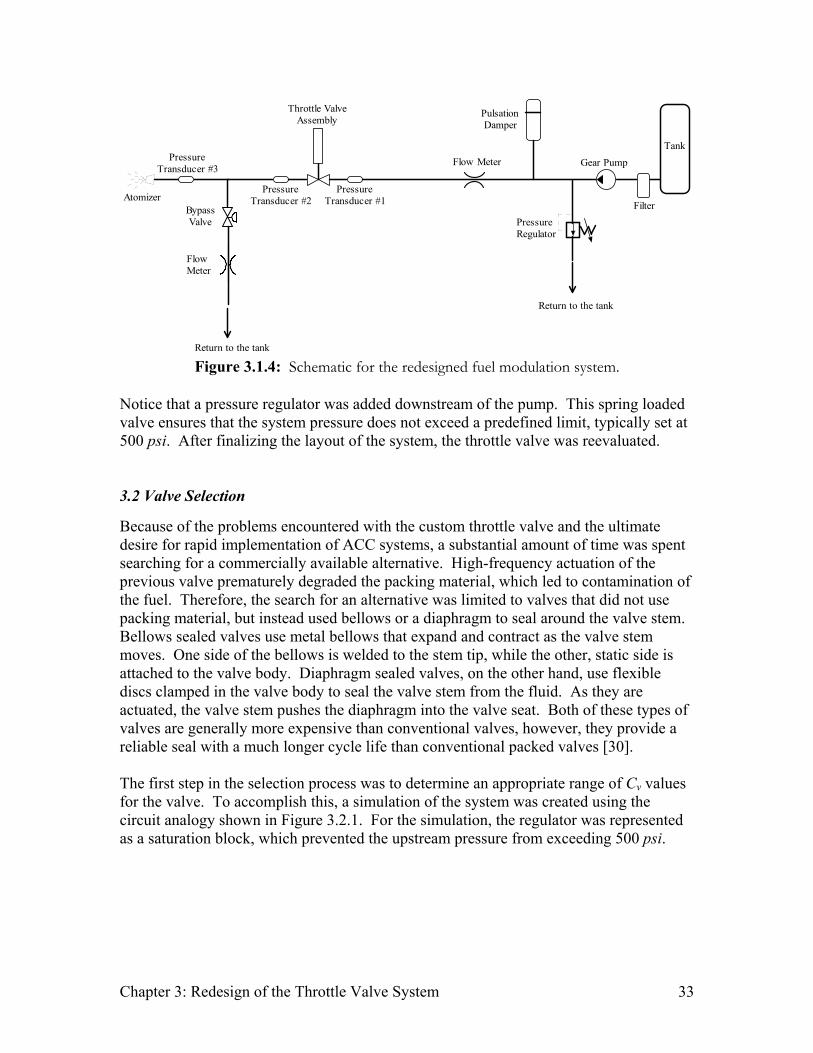
After selecting the new pump, a Fulflo filter was added to the system. The filter reduced the amount of debris in the fuel line and solved the pressure drift problem. A schematic of the new fuel modulation system is shown in Figure 3.1.4.
Chapter 3: Redesign of the Throttle Valve System 33
Pulsation Damper
Gear PumpFlow Meter
Throttle Valve Assembly
PressureTransducer #3
Return to the tank
Atomizer PressureTransducer #2
PressureTransducer #1
Bypass Valve Pressure
Regulator
FlowMeter
Return to the tank
Tank
Filter
Figure 3.1.4: Schematic for the redesigned fuel modulation system.
Notice that a pressure regulator was added downstream of the pump. This spring loaded valve ensures that the system pressure does not exceed a predefined limit, typically set at 500 psi. After finalizing the layout of the system, the throttle valve was reevaluated. 3.2 Valve Selection Because of the problems encountered with the custom throttle valve and the ultimate desire for rapid implementation of ACC systems, a substantial amount of time was spent searching for a commercially available alternative. High-frequency actuation of the previous valve prematurely degraded the packing material, which led to contamination of the fuel. Therefore, the search for an alternative was limited to valves that did not use packing material, but instead used bellows or a diaphragm to seal around the valve stem. Bellows sealed valves use metal bellows that expand and contract as the valve stem moves. One side of the bellows is welded to the stem tip, while the other, static side is attached to the valve body. Diaphragm sealed valves, on the other hand, use flexible discs clamped in the valve body to seal the valve stem from the fluid. As they are actuated, the valve stem pushes the diaphragm into the valve seat. Both of these types of valves are generally more expensive than conventional valves, however, they provide a reliable seal with a much longer cycle life than conventional packed valves [30]. The first step in the selection process was to determine an appropriate range of Cv values for the valve. To accomplish this, a simulation of the system was created using the circuit analogy shown in Figure 3.2.1. For the simulation, the regulator was represented as a saturation block, which prevented the upstream pressure from exceeding 500 psi.
Chapter 3: Redesign of the Throttle Valve System 34
Zeq
Zv
Pump Regulator
Figure 3.2.1: Circuit analogy for the redesigned modulation system.
The analysis of this circuit was similar to the one described in Section 2.3. Using kerosene, with a specific gravity of 0.815, the pressure up and downstream of the valve was simulated while varying the valve’s flow coefficient. Figure 3.2.2 shows the results of this simulation.
0 0.05 0.1 0.15 0.2 0.250
50
100
150
200
250
300
350
400
450
500
Pre
ssur
e (p
si)
Cv (gpm / psi 0.5)
Upstream PressureDownstream Pressure
Figure 3.2.2: Prediction of the system’s response to variations in the throttle valve Cv.
From Figure 3.2.2, the flow coefficient range for the valve was selected from 0 to 0.1 gpm/psi0.5. Fluctuating between these two Cv values had to be possible with only a small deflection of the valve stem. Additionally, the throttle valve needed to be robust, and use either bellows or a diaphragm to seal around the valve stem. While many valves from various manufacturers were considered, the final selection came down to four different Swagelok valves. Table 3.2.1 summarizes the advantageous and disadvantageous of each valve. The required stroke, shown in Table 3.2.1, represents the deflection necessary to change the flow coefficient of the valve from 0 to 0.1 gpm/psi0.5.
Chapter 3: Redesign of the Throttle Valve System 35
Although each of these valves had advantages, a Swagelok BN series valve was selected. The SS-BNS4-O valve required a stroke of only 300 µm and utilized an inverted bellows design, which was more robust and easier to bleed than conventional bellows. The BN series valve, shown in Figure 3.2.3, also had a stem guide and non-rotating tip for durability. Swagelok predicted the lifetime of this valve at well over 12 million cycles.
Figure 3.2.3: Diagram of the BN series valve. Adapted from Swagelok [38].
The next step was to identify an acceptable actuator. To satisfy the requirements for this application, the actuator needed a stroke of at least 300 µm with a bandwidth up to 700 Hz.
Chapter 3: Redesign of the Throttle Valve System 36
3.3 Actuator Comparison The actuator is one of the most important components of the modulation system. After the piezoelectric stack broke, the group questioned the durability of this type of actuator. Due to these concerns, a search was performed for other types of proportional, high-bandwidth, linear actuators. This section compares the force, stroke and frequency capabilities of piezoelectric stacks with more conventional electromagnetic actuators. A brief discussion of electrostrictive and magnetostrictive actuators is also included. These four different types of actuators currently represent the most promising technologies available for proportional, high-bandwidth, linear actuation. The first type of actuator discussed is the piezoelectric stack. 3.3.1 Piezoelectric Stack In a piezoelectric material, the applied electric field is proportional to the mechanical strain. The mechanism for the electromechanical coupling has to do with the orientation of electric dipoles in the material. The application of an electric field rotates the dipoles, which causes mechanical strain. These materials typically exhibit a maximum strain of 0.1 to 0.15%. For our application, a piezoelectric stack was investigated. This actuator is made up of many layers of densely packed piezoelectric wafers separated from each other with thin layers of insulation. A piezoelectric stack is in series mechanically, and in parallel electrically. In this configuration, the displacement is the summation of the motion from each layer. Electrically, these actuators behave as capacitors, which place special constraints on the driving electronics. The system’s performance is partially determined by the material properties and size of the actuator, and partially by the driving electronics. Therefore, it is critical to select the appropriate amplifier for a particular application. Piezoelectric actuators are capable of producing large forces and can be used for high frequency applications. However, stacks are extremely sensitive to tensile loads. Therefore, for dynamic applications these actuators must be preloaded to ensure that the actuator is never placed in tension. This is typically accomplished by placing the stack inside a casing. Not only does the casing put an initial preload on the actuator, but it also protects the stack from the environment. For this work, the piezoelectric stack was modeled with the lumped mass / spring system shown in Figure 3.2.1.
Chapter 3: Redesign of the Throttle Valve System 37
m
cks s
kp
F ( t )
x ( t )
Figure 3.3.1: Lumped mass/spring model of the piezoelectric stack.
In Figure 3.2.1, m represents the equivalent mass of all of the moving components, kp is the stiffness of the preload mechanism, ks represents the stiffness of the stack, and cs represents the damping in the system. Applying a preload in this manner slightly decreases the actuators available stroke since the stack has to work against the stiffness of the preload mechanism. To minimize the reduction in stroke, the stiffness of the preload mechanism should be much less than the stiffness of the stack. For example, Piezomechanik used disk springs with a stiffness of 2 or 3 N/µm to preload the 500-µm stack, which had an estimated stiffness of 16.8 N/µm. The actual stiffness of a piezoelectric stack varies depending on its electrical boundary conditions. For instance, the stiffness of the stack is smaller if the electrical leads are short circuited, than if the leads are open. In our application, the actuator would be connected to a power supply the entire time, and so the stiffness was not expected to vary drastically. The performance of the 500-µm stack was simulated using the model, shown in Figure 3.2.1, to predict the dynamic response for this type of actuator. Estimates of the stiffness of the stack and preload mechanism were available from Piezomechanik, however values for the equivalent mass and damping were still needed. An experimental modal analysis was performed to determine the natural frequency and damping ratio of this actuator. After finding the natural frequency, the equivalent mass could be calculated using Piezomechanik’s stiffness estimate. A free-free configuration was used for these tests because it was easy to achieve and repeatable. For this configuration, the stack was placed on foam so that the rigid body modes were well below the frequency range of interest. A small PCB shear accelerometer measured the actuator’s response to a low level, periodic chirp from 0 to 800 Hz. Figure 3.3.2 shows the accelerance frequency response function for the 500-µm stack.
Chapter 3: Redesign of the Throttle Valve System 38
0 1000 2000 3000 4000 5000 6000-80
-60
-40
-20
0
20
Mag
nitu
de (d
B)
Frequency [Hz]
0 1000 2000 3000 4000 5000 6000-200
-100
0
100
200
Pha
se (d
eg)
Frequency [Hz]
0 1000 2000 3000 4000 5000 60000
0.2
0.4
0.6
0.8
1
Coh
eren
ce
Frequency [Hz]
Figure 3.3.2: Experimental frequency response function for the 500-µm stack.
Figure 3.3.2 shows that the longitudinal mode of the actuator occurs at 2750 Hz in the free-free configuration. Since there were no other modes in the vicinity of the fundamental peak, a single-degree-of-freedom method was used to estimate the damping. The quadrature peak picking method outlined in Inman [21] was used to determine the damping associated with the fundamental peak. For this method, the damped natural frequency, ωd, and the frequencies, ωb and ωa, corresponding to the 3 dB down points, were used to estimate the damping ratio:
d
ab
ωωωζ
2−
= . (3.01)
Since the damping ratio was small, ζ ≈ 0.03 , ωd and ωn were approximately equal. In the model, shown in Figure 3.3.1, the actuator was mounted in a fixed-free configuration, which decreases the frequency of the fundamental longitudinal mode by a factor of two [21]. Therefore, a natural frequency of 1375 Hz and a stiffness of 16.8 N/µm were used to calculate the equivalent mass of the stack as 0.23 kg. Next, the equation of motion for the lumped mass / spring system was written: tFxkxcxm o ωcos=++ &&& , (3.02) where m is the equivalent mass of all of the moving components, k is the combined stiffness of the stack and preload mechanism, c is the damping, and Fo is the input force. The particular solution for this differential equation is discussed in Inman [21]:
Chapter 3: Redesign of the Throttle Valve System 39
( )( ) ( )
−
−+−
= −22
1
2222
2tancos2 ωω
ωζωωωζωωω n
n
nn
op tftx , (3.03)
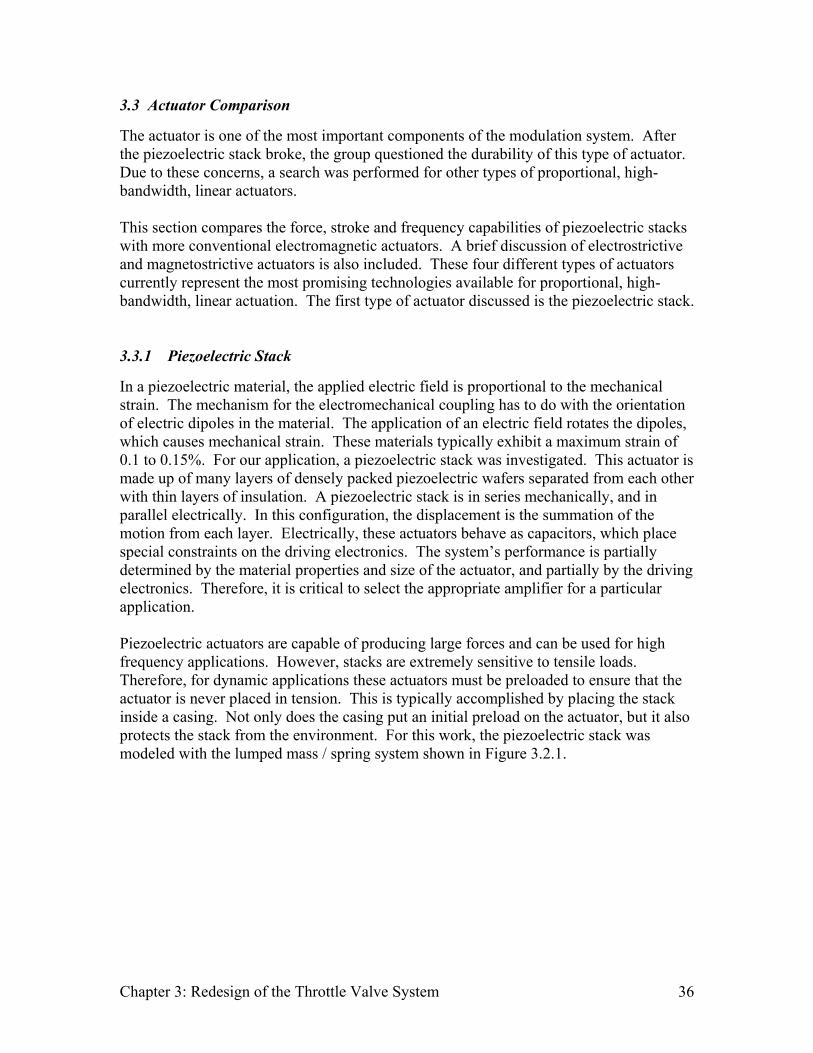
where mkn /=ω , ( )nmc ωζ 2/= , and mFf oo /= . The input force, used in equation (3.03), is the force produced in the stack as a result of the applied voltage. The 500-µm stack produces an internal force of 8400 N when excited with a 1000 V signal. However, the amplifier can produce this voltage level only at low frequencies due to electrical power limitations. Figure 3.3.3 shows how the power limitations of the amplifier, shown in black, affect the combined response of the amplifier and stack, shown in blue.
10 20 40 60 80 100 200 400 600 800 1000 200010
20
40
6080
100
200
400
600800
1000
Frequency (Hz)
Stro
ke (u
m)
Response due to the amplifierDynamic response of the system
Figure 3.3.3: Dynamic response of the LE 1000/100 amplifier driving the 500-µm stack.
The next section discusses the more conventional, electromagnetic actuator. 3.3.2 Electromagnetic Actuator Electromagnetic actuators operate in the same way as common speakers. They operate on the principle that a force will be exerted on a current-carrying wire when immersed in a magnetic field. For the electromagnetic actuator, shown in Figure 3.3.4, the force is given as, BLiF = , (3.04) where, F is the axial force on the coil, B is the mean value of the radial flux density, L is the length of the coil, and i is the current through the wire. With a fixed magnetic field, the direction and magnitude of the axial force is directly proportional to the input current.
Chapter 3: Redesign of the Throttle Valve System 40
Figure 3.3.4: Schematic of an electromagnetic linear actuator. Adapted from Lang [26].
The flexure, shown in Figure 3.3.4, allows the armature assembly to move axially while restraining radial motion. There are two prominent types of linear electromagnetic actuators, moving coil actuators, as shown in Figure 3.3.4, and moving magnet actuators. Moving coil actuators are typically larger in diameter and shorter in length, with a slightly smaller armature mass. The reduced armature mass makes them better suited for high-frequency applications. The advantage of the moving magnet design is that the coil is stationary, eliminating the need for moving leads. While many electromagnetic actuators are simple and robust, most do not operate at frequencies as high as 700 Hz. High-frequency operation is problematic because of the eddy currents created in the armature assembly and due to heat dissipation problems [41]. The solenoid is one type of electromagnetic actuator capable of high-frequency operation, unfortunately, it is not capable of proportional actuation. Another type of electromagnetic actuator capable of high-frequency operation is the shaker. These proportional actuators, typically used for shock and vibration testing, operate at frequencies up to and exceeding 10 kHz. They can produce peak forces of thousands of pounds, with low frequency displacements of a few inches. Unfortunately, they are also bulky, heavy, and relatively expensive. The shaker exhibits two dominant vibration modes. In the first mode, the armature assembly moves relative to the base. The frequency of this mode, typically between 10 and 40 Hz, is controlled by the mass of the armature assembly and the stiffness of the flexure. The second mode occurs at the structural resonance of the armature assembly, which is usually well above 1 kHz [26]. Off resonance, the displacement of these actuators is controlled by the displacement, velocity, and force limitations of the shaker. At low frequencies, the displacement is limited by the actuator’s physical dimensions. As the frequency is increased, first, the velocity restriction controls the response, and then the force limitation determines the performance of the actuator. The model for an electromagnetic shaker, used in this work, did not take into account the structural resonance of the armature assembly, or the resonant behavior of the first mode. However, this model still provided a good estimate of the actuators performance between
Chapter 3: Redesign of the Throttle Valve System 41
100 and 700 Hz. Assuming a sinusoidal profile, the displacement of the actuator can be written as,
( )tXx ωcos= , (3.05) where X is the amplitude of the displacement, and ω is the frequency. Taking the first derivative gives an expression for the velocity of the actuator,
( )tXx ωω sin−=& . (3.06) In the velocity-controlled region, equation (3.06) describes the actuator’s response. As the frequency increases, the displacement is forced to decrease because of the velocity limitation. An expression for the force is found by multiplying m, the equivalent mass of all of the moving components, by x&& , the second derivative of the displacement:
( )tXmF ωω cos2−= . (3.07) At high frequencies, the amplitude of the displacement is determined by the maximum force that the actuator can generate. In the force-controlled region, equation (3.07) shows that the displacement decreases at a rate of 40 dB/decade with increasing frequency. Figure 3.3.5 shows the displacement, velocity and force controlled regions of a typical electromagnetic shaker.
1 2 4 6 8 10 20 40 60 80 100 200 4000.1
0.2
0.40.60.8
1
2
468
10
20
40
Frequency (Hz)
Stro
ke (m
m)
Displacement controlled region
Velocity controlled region
Force controlled region
Figure 3.3.5: Sample dynamic response for an electromagnetic shaker.
Notice that the low frequency displacement of an electromagnetic shaker is much larger than the stroke of piezoelectric stacks. However, the displacement also begins to roll-off at relatively low frequencies. Before comparing these two types of actuators, an investigation into electrostrictive and magnetostrictive actuators was performed. 3.3.3 Electrostrictive and Magnetostrictive Actuators Electrostrictive ceramics are similar to piezoelectric materials in many ways. They exhibit a similar type of electromechanical coupling caused by the rotation of electric dipoles, and have similar material properties. The big difference is that the relationship between the applied electric field and the mechanical strain is nonlinear; the strain is proportional to the square of the electric field. An advantage of electrostrictive ceramics is that the material exhibits much less hysteresis than piezoelectric materials. However, the disadvantages outweigh this single advantage. The capacitance of electrostrictive materials is very large, making high frequency operation impractical. In addition, these actuators are much more sensitive to temperature fluctuations than piezoelectric
Chapter 3: Redesign of the Throttle Valve System 42
actuators. Electrostrictive ceramics are primarily used in the semiconductor industry and to position optics in laboratory conditions, and are not appropriate for our application. Magnetostrictive material, on the other hand, offered a number of advantages to piezoelectric actuators. This material changes length in the presence of a magnetic field. Since the relationship between the magnetic field and the mechanical strain is quadratic, positive expansion results regardless of the direction of the magnetic field. Therefore, a preload mechanism, similar to the type used with piezoelectric stacks, is typically employed to compress the material. Terfenol-D is a commercially available magnetostrictive material supplied by Etrema Products, Inc. Etrema claims that Terfenol-D produces five to ten times more strain than piezoceramics and can produce higher forces as well. In addition, these actuators are robust to temperature fluctuations and have a longer lifetime than piezoelectric stacks. The disadvantage of magnetostrictive actuators is that a coil has to be placed around the magnetostrictive rod to produce the magnetic field necessary for actuation. The coil makes these actuators slightly bigger and heavier than comparable piezoelectric actuators. The location of the coil with respect to the magnetostrictive rod is shown in Figure 3.3.6. Another drawback of magnetostrictive actuators is their cost. Etrema expects the cost to drop substantially in the next few years, however, right now they are still much more expensive than piezoelectric actuators. While magnetostrictive actuators offered a number of advantages, the group chose not to pursue this technology due to size and cost concerns.
Figure 3.3.6: Schematic of a magnetostrictive actuator. Adapted from MIDE [31].
After eliminating electrostrictive and magnetostrictive actuators, the search then focused on commercially available electromagnetic shakers and piezoelectric stacks. The following section discusses the selection process. 3.3.4 Actuator Selection The actuator for the proportional fuel modulation system needed to have a peak-to-peak displacement of 300 µm at frequencies up to 700 Hz. This requirement was established by our selection of the BN series valve, discussed on page 35. To evaluate each actuator, its stroke was simulated with the additional mass of the BN series valve stem, estimated as 0.085 kg. The simulation also incorporated a static force accounting for the fluid pressure in the system. Figure 3.3.7 shows the predicted performance of four different electromagnetic shakers and two different piezoelectric stacks. Appendix A contains a
Chapter 3: Redesign of the Throttle Valve System 43
portion of the MATLAB code that was used for this analysis, and lists the manufacturer and model number for each actuator.
1 2 4 6 8 10 20 40 60 80 100 200 400 600 80010
20
40
6080
100
200
400
600800
1000
2000
4000
60008000
10000
20000
40000
Frequency (Hz)
Pea
k-to
-pea
k di
spla
cem
ent (
um)
Shaker A - $17,055Shaker B - $10,365Shaker C - $5,900Shaker D - $5,345500-um stack - $7,550200-um stack - $3,065Required stroke
Figure 3.3.7: Predicted displacement as a function of frequency for electromagnetic
shakers and piezoelectric stacks. Figure 3.3.7 shows that the electromagnetic shakers were only able to meet the stroke requirement up to 400 Hz. At 700 Hz, none of the shakers had a stroke larger than 100 µm. This was well below the 300-µm requirement. The 500-µm stack, on the other hand, was much closer to the requirement with a stroke of 250 µm at 700 Hz. In addition, this stack was smaller and lighter than all of the electromagnetic shakers. Therefore, the 500-µm stack was once again selected as the actuator for our fuel modulation system. Piezoelectric stacks are high performance actuators capable of producing very large internal forces. While this capability allows the stack to operate at high frequencies, it also makes it particularly susceptible to damage. Because there are no built-in restraints to limit its motion, the actuator has the ability to damage itself if used improperly. The previous 500-µm stack broke because it was used incorrectly. If used properly, Piezomechanik claims that piezoelectric stacks have an operational lifetime equivalent to several years of continuous use. The previous 500-µm stack broke because it was placed in tension. This problem was addressed by increasing the new actuator’s preload from 1500 to 5000 N. To make room for the larger preload mechanism, the length of the stack had to be shortened by 20
Chapter 3: Redesign of the Throttle Valve System 44
millimeters. This reduced the stroke of the actuator by about 25 µm. By increasing the preload, the system could be operated at higher frequencies without the risk of placing the stack in tension. Figure 3.3.8 illustrates the limitations of the actuator system. The blue curve shows the limitation imposed by the LE 1000/100 amplifier. With a maximum current of one amp, the voltage from the amplifier begins to roll-off at 80 Hz when a 5-µF load is attached. The modified piezoelectric stack has a capacitance of 3.6 µF at room temperature, however, this increases to almost 5 µF as the actuator gets warm. The red curve, in Figure 3.3.8, shows the limitation of the stack. With a 0.15-kg load attached to the 500-µm stack, operating anywhere to the right of the red line could place the actuator in tension. This curve was created using equation (3.08). Figure 3.3.8 shows the safe voltage levels for the actuator system.
10 2 4 6 8 100 2 4 6 8 1000 2 4 60000
100
200
300
400
500
Frequency (Hz)
Sta
ck V
olta
ge A
mpl
itude
(V)
Safe region Trip amplifier Damage stack
Amplifier limitStack limit
Figure 3.3.8: Operating range for the 500-µm stack driven with the LE 1000/100
amplifier. Notice that at high frequencies it is possible to place the stack in tension before tripping the amplifier. Therefore, all experiments involving high frequency actuation, >1600 Hz, were performed with very small voltage levels of only a few millivolts. Additionally, a 4th order low pass filter was used on the input to the amplifier to attenuate signals with frequency components above 1 kHz. The next section briefly discusses two strategies for amplifying the stroke of the piezoelectric stack. 3.4 Mechanical Amplification
To meet the 300-µm requirement at all frequencies up to 700 Hz, a few methods were briefly considered for amplifying the actuator’s displacement. The first involved operating at the mechanical resonance of the stack. Although the unloaded resonant frequency of the actuator was above 1 kHz, this decreased significantly as the actuator was loaded. Unfortunately, increasing the attached mass also shifted the red curve, in Figure 3.3.8, to the left. Therefore, the actuator would have been at a greater risk for damage due to tensile loads. The second method involved using the resonant behavior of the bracket to amplify the displacement of the valve stem. Although we felt that this method had potential, it was not pursued due to the difficulties associated with manufacturing a bracket with a tunable
Chapter 3: Redesign of the Throttle Valve System 45
resonance. Since the stroke of the actuator was already close to meeting the requirement, the added complexity of a tunable bracket, or any other means of amplification for that matter, seemed unnecessary. The next section shows a photograph of the throttle valve assembly, and discusses the bracket design. 3.5 System Assembly After selecting a new valve and actuator, the bracket was designed. As opposed to the adjustable bracket designed for the previous system, this bracket was designed specifically for the refurbished 500-µm stack. Therefore, the bracket was smaller and more rigid than the previous design. Figure 3.5.1 shows how the stack and valve were attached in the bracket.
Figure 3.5.1: Photograph of the valve assembly. The system was assembled in steps. First, a 1 ¼ inch diameter aluminum cylinder was bolted to the base of the piezoelectric stack. Then, the moving end of the stack was
Chapter 3: Redesign of the Throttle Valve System 46
connected to the coupler with a threaded M6 stud. The coupler was a ¾-inch diameter, aluminum cylinder that had M6 female threads in one end, and was drilled to match the diameter of the valve stem on the other end. Next, the connecting rods were bolted to the top of the bracket. The connecting rods were ¾-inch diameter, 24-inch long, aluminum rods. Since the rods were a few inches too short, spacers were used to extend the length of the bracket. After bolting on the aluminum rods and spacers, the actuator was then connected to the top plate using a custom-made, threaded stud. One side of the stud had a diameter of 3/8 of an inch with 24 threads per inch, while the other end was 7/16 of an inch in diameter with 14 threads per inch. Both ends had right hand threads. Rotating the stud produced small changes in the position of the actuator as a result of the difference in threads. One full rotation of the stud corresponded to a displacement of 750 µm. To make the stud easier to turn, a nut was fixed along the middle of the shaft with a cotter pin. After attaching the actuator to the top of the bracket, the assembly was positioned above the valve and base plate. The valve stem slid into the coupler and was locked in place using three set screws. After bolting the connecting rods to the base, the threaded stud at the top of the assembly was used to fine tune the nominal position of the valve stem. Since the stroke of the actuator was limited, we needed to ensure that the initial position of the valve stem was correct. After installing the throttle valve assembly in the kerosene system, the nominal position was found by rotating the positioning stud at the base of the actuator until there was a 50-psi drop across the valve. Therefore, any additional displacement of the actuator would immediately affect the pressure downstream of the valve. With this design, there was nothing to prevent the actuator from overextending the valve stem into the seat. Therefore, before operating the system, the valve was slowly closed until the downstream pressure dropped to ~10 psi. At this point, the voltage applied to the actuator was recorded using the monitor output on the amplifier. For all subsequent experiments, this voltage was used as an upper bound on the input signal to the stack, since larger signals could potentially overextend the valve stem into the seat. The entire fuel modulation system, including the amplifier, actuator, valve, and bracket, was built for less than nine-thousand dollars. Appendix B lists the manufacturer and cost of each component. Before performing combustion control experiments, it was very important to maximize the pressure oscillations in the fuel line using acoustic tuning. The following section explains the acoustic tuning process and shows the modulation levels that were achieved at the instability frequency. 3.6 Acoustic Tuning For active combustion control applications, the fuel modulation system is required to produce large pressure oscillations only in a narrow frequency range. Specifically, the
Chapter 3: Redesign of the Throttle Valve System 47
modulation system must be able to operate effectively near the instability frequency of the combustor. Since the combustors instability frequency is measurable and generally stationary, it is advantageous to optimize the performance of the modulation system for this frequency. This is accomplished by adjusting the length of the fuel supply line until its acoustic resonance matches the instability frequency of the combustor. Operating the system at an acoustic resonance can add an additional 20 dB of gain to the pressure modulation levels, which corresponds to the difference between + 10 and + 100 psi oscillations in the fuel line. The tuning process used in this research was based on previous work performed by Hermann et al. [20], Hantschk et al. [17], and DeCastro [9]. Using their work as a reference, the fuel modulation system was optimized specifically for the instability frequency of ~120 Hz that occurs during operation of the VACCG kerosene combustor. Initial experiments were designed to identify the interaction between the fuel line upstream and downstream of the throttle valve. If the upstream length influenced the acoustic response downstream of the valve, then the tuning procedure would be required to take into account both sections. These experiments were designed to determine whether the large acoustic impedance due to the change in cross sectional area at the valve inhibited interaction between the two sections. A schematic of the system used for these experiments is included as Figure 3.6.1. The pipe lengths (shown in inches) and pressure transducer locations were selected to match the configuration of the VACCG kerosene combustor.
Throttle Valve Assembly
PressureTransducer #3
344 15 16
44
413 (69)
Expansion Chamber
11 58 15
From the pump
Return to the tank
Nozzle
PressureTransducer #2
PressureTransducer #1
Bypass Valve
L 2 L 1
From the pump
Closedball valve
Pressure Gauge
Figure 3.6.1: Schematic of the system used for acoustic tuning.
The acoustic response of the test section was measured with realistic combustor operating conditions. With an upstream pressure of 500 psi, the valve offset was adjusted to produce a pressure of 300 psi downstream of the valve assembly. A 1.0-gph atomizer and bypass setting of 5.33 were also selected for these tests. Actuation of the throttle valve system produced pressure fluctuations that were measured using three transducers in the fuel line shown as pressure transducers 1, 2 and 3 in Figure 3.6.1. The desired broadband excitation of the fuel was accomplished using a 200-mV chirp to drive the valve from 0 to 800 Hz. The signal from each pressure transducer was referenced to the valve input signal to produce frequency response functions of the up and downstream acoustics. Figure 3.6.2 shows the fuel line response
Chapter 3: Redesign of the Throttle Valve System 48
for two different upstream lengths, L1. The magnitude of each frequency response function is shown. The phase relationship between the two signals contains little additional information and is, therefore, not included.
0 100 200 300 400 500 600 700 800-10
0
10
20
30
40
50A
mpl
itude
(dB
psi
/Vm
on)
a.55 Hz 85 Hz
140 Hz
Original upstreamLengthened upstream
0 100 200 300 400 500 600 700 8005
10
15
20
25
30
35
40
45
50
Am
plitu
de (d
B p
si/V
mon
)
Frequency [Hz]
b.
55 Hz
85 Hz
140 Hz
Original upstreamLengthened upstream
Frequency [Hz]
Figure 3.6.2: a. Amplitude of the frequency response function between pressure transducer
#1 located 4” upstream of the valve and the amplifier monitor signal. b. Amplitude of the frequency response function for pressure transducer #3 located downstream of the valve
(pipe length L2 =134”). As expected, the fundamental resonant frequency of the upstream line decreased as the length of pipe in that section was increased. While the frequency response functions taken in the downstream section did not show this trend, they did change noticeably. Poles in the upstream frequency response function tended to produce dips in the downstream response. To explain this phenomenon, first consider the consequences of completely removing the throttle valve from the fuel line. With the valve removed, there would be no flow restriction between the two sections of the system and the pressures measured up and downstream of that point would be the same. However, installing the valve creates a flow restriction between the two sections. The value of the flow restriction is directly related to the effective orifice area of the valve. As the orifice area is decreased, the pressure gradient across the valve increases. Since the pump behaves as a flow dependent pressure source, both the up and downstream pressures vary as the orifice area is changed. Now, consider varying the orifice area in a sinusoidal fashion. It follows that both the up and downstream pressures would vary accordingly. It should be noted that
Chapter 3: Redesign of the Throttle Valve System 49
the maximum orifice area corresponds to the minimum upstream pressure and the peak downstream pressure. This concept is illustrated in Figure 3.6.3.
Orif
ice
Are
aU
pstre
am P
ress
ure
Dow
nstre
am P
ress
ure
Time
Figure 3.6.3: Conceptual relationship between the orifice area and pressure fluctuations at
the valve. An explanation for the coupled behavior between the two sections becomes clear when the forcing term driving the response in the downstream line is considered. The downstream section is driven by a ( )( )reaAressureP forcing term that varies as a function of the orifice area and upstream pressure. From Figure 3.6.3 it is clear that the upstream pressure and orifice area terms are 180 degrees out of phase. Therefore, the amplitude of the ( )( )reaAressureP term decreases as the magnitude of upstream pressure fluctuations increase. It then follows that the forcing term driving the downstream line would decrease at frequencies corresponding to upstream poles. This explains why the poles of the upstream frequency response function correspond to dips in the downstream response. Hantschk et al. observed the same phenomenon for a throttling valve fuel modulation system, but did not offer a convincing explanation for why it occurred. In his research, a vague reference to acoustic coupling was suggested as the explanation, and an expansion chamber was added to the upstream line to mitigate the coupling across the throttling valve. The addition of an expansion chamber to the upstream fuel line is an effective method of acoustically decoupling the sections of this system. While other methods exist to
Chapter 3: Redesign of the Throttle Valve System 50
decouple parts of a fluid system, such as area constrictions, the expansion chamber is a particularly good solution because it does not produce substantial steady-state pressure losses. Based on the results of the previous investigation, an expansion chamber was added to the system 19 inches upstream of the valve. The device was placed as close to the valve assembly as possible in order to maximize the fundamental resonance frequency in the section between the valve and expansion chamber. Shifting the upstream resonance frequency well above the frequency range of interest would allow the downstream to be tuned without regard to the response in the upstream section. The effect of adding the expansion chamber to the upstream line can be seen in Figure 3.6.4.
0 100 200 300 400 500 600 700 800-10
0
10
20
30
40
50
Am
plitu
de (d
B p
si/V
mon
)
Frequency [Hz]
a.
Original upstreamExpansion chamber installed
0 100 200 300 400 500 600 700 8005
10
15
20
25
30
35
40
45
50
Am
plitu
de (d
B p
si/V
mon
)
Frequency [Hz]
b. Original upstreamExpansion chamber installed
Figure 3.6.4: a. Amplitude of the frequency response function between pressure transducer #1 located 4” upstream of the valve and the amplifier monitor signal. b. Amplitude of the frequency response function for pressure transducer #3 located
downstream of the valve (pipe length L2 = 134”). Adding the expansion chamber shifted the fundamental resonance frequency of the new upstream section above 500 Hz. This eliminated the low frequency dips previously seen in the downstream response. Since the frequency range of interest was around 120 Hz, the dip in the downstream response near 500 Hz due to the upstream resonance was not a problem. Aside from the primary advantage of shifting the upstream fundamental resonance frequency, the expansion chamber also prevented unwanted pressure fluctuations originating at the pump from affecting the system. While the pressure fluctuations
Chapter 3: Redesign of the Throttle Valve System 51
created by the gear pump were not a problem for the modulation system, the expansion chamber would have been very beneficial for the previous experiments that used the piston pump. The figure below shows the pressure oscillations measured in the fuel line 11 5/8 inches upstream of the nozzle.
0 100 200 300 400 500 600 700 8000
0.1
0.2
0.3
0.4
0.5
0.6
0.7
0.8
0.9P
ress
ure
Am
plitu
de [p
si]
Frequency [Hz]
No expansion chamberExpansion chamber installed
Figure 3.6.5: Amplitude of the pressure fluctuations in the fuel line with and without the
Swagelok 304L-HDF4-2250 expansion chamber installed. With the addition of the expansion chamber, the downstream acoustics could now be tuned without regard to the upstream response. Due to the complexities associated with analytically modeling this sort of system, discussed in DeCastro [9], an experimental approach to the acoustic tuning problem was attempted. The downstream length, L2, was varied from 68 inches to 168 inches. The resulting impact on the downstream response was then investigated. Unfortunately each time a component of the system was replaced small amounts of air got trapped in the fuel line. Figure 3.6.6 shows the impact trapped air had on the downstream response. Bleeding the air from the system was a slow process that could take several hours. Fuel modulation at high pressures was found to be the only effective method of dislodging the trapped air. After installing a new component, the fuel was modulated using the throttle valve system for a few minutes at various frequencies. The system was considered adequately bled when the downstream frequency response function consistently gave the same response between modulation sessions.
0 100 200 300 400 500 600 700 8005
10
15
20
25
30
35
40
45
50
Am
plitu
de (d
B p
si/V
mon
)
Frequency (Hz)
Time 1Time 2Time 3
Figure 3.6.6: Amplitude of the frequency response function for the pressure transducer
located downstream of the valve (pipe length L2 = 168”) Twenty to thirty minutes was spent bleeding the fuel line each time the downstream section was changed. Figure 3.6.7 shows the up and downstream responses for three of these downstream lengths.
Chapter 3: Redesign of the Throttle Valve System 52
0 100 200 300 400 500 600 700 800-10
0
10
20
30
40
50
Am
plitu
de (d
B p
si/V
mon
)
Frequency (Hz)
a.
L2 - 68"L2 - 123"L2 - 168"
0 100 200 300 400 500 600 700 8005
10
15
20
25
30
35
40
45
50
Am
plitu
de (d
B p
si/V
mon
)
Frequency (Hz)
b.
105 Hz 125 Hz 210 Hz
L2 - 68"L2 - 123"L2 - 168"
Figure 3.6.7: a. Amplitude of the frequency response function for pressure transducer #1
located 4” upstream of the valve. b. Amplitude of the frequency response function for pressure transducer #3 located downstream of the valve.
As expected, increasing the downstream pipe length decreased the resonance frequency in that section of the system. Unfortunately, subsequent tests showed that there was air trapped in the atomizer when these data sets were taken. This was problematic since the resonance frequency of the system depended heavily on the amount of air trapped in the fuel line. For instance, on the day of these tests a downstream length of 134 inches produced a resonance frequency of 116 Hz. Later experiments showed that after removing additional air from the atomizer, the same downstream length produced a resonance frequency of 140 Hz. Assuming a fixed amount of air in the fuel line, the required downstream length was estimated using a basic expression describing wave motion,
λcf = (3.08)
where f is frequency, c is phase speed, and λ is wavelength. The wavelength was calculated using a phase speed of 1320 m/s, the speed of sound in kerosene, and a frequency of 120 Hz. The next step was to determine the relationship between the wavelength and the downstream pipe length. As a result of the complex acoustic boundary conditions created by the throttle valve and atomizer, the fundamental wave shape setup in the downstream line corresponded to a value between ½ and ¼ waves. Further experiments with different pipe lengths showed that at the fundamental resonance
Chapter 3: Redesign of the Throttle Valve System 53
frequency, the wavelength was consistently equal to 2.6 times the downstream length. It’s important to note that this relationship changed substantially depending on the amount of air trapped in the line. Using this relationship, a downstream length of 165 inches was chosen in order to shift the fundamental resonance frequency of the system to ~120 Hz. After installing this downstream length on the combustor system, pressure measurements were taken from each of the three transducers. Figure 3.6.8 shows the results of these tests. A description of the combustor system used in these experiments is included in the following section.
0 100 200 300 400 500 600 700 800-10
0
10
20
30
40
50
Am
plitu
de [p
si/V
mon
]
a.
0 100 200 300 400 500 600 700 800
10
20
30
40
50b.
Am
plitu
de [p
si/V
mon
]
0 100 200 300 400 500 600 700 800
10
20
30
40
50
Am
plitu
de [p
si/V
mon
]
Frequency [Hz]
c. 117 Hz
Figure 3.6.8: a. Amplitude of the frequency response function for pressure transducer #1
located upstream of the valve. b. Amplitude of the frequency response function for pressure transducer #2 located 4” downstream of the valve. c. Amplitude of the frequency
response function for pressure transducer #3 located 11.5” upstream of the nozzle (pipe length L2 = 165”).
As expected, a downstream length of 165 inches caused the fundamental resonance frequency of the system to shift to ~120 Hz. With the acoustic tuning process completed, the performance of the fuel modulation system was investigated. Using the throttle valve system, the maximum downstream pressure was bounded by the supply pressure while the minimum pressure was constrained by the performance of the atomization system. The atomization system used on the VACCG kerosene combustor consisted of a Delavan pressure atomizer. Atomizers are used to break up the fuel into small droplets allowing better mixing between the fuel and air in the combustor. As the droplet size decreases, the fuel evaporates and mixes with the air faster, improving
Chapter 3: Redesign of the Throttle Valve System 54
combustion efficiency. For pressure atomizers, the quality of atomization (droplet size) is directly related to the fuel pressure. Delavan gives a useful rule of thumb stating that the droplet size varies as the –0.3 power of the fuel pressure. This means that higher fuel pressures correspond to smaller droplets and improved combustion. Although the atomizers still function at pressures below 75 psi, the quality of atomization at these low pressures is questionable. While the valve system was capable of dropping the downstream pressure to 5 or 10 psi, the limits of the atomization system dictated a 75 psi lower bound on the pressure fluctuations in the fuel line. Another limit on the fuel line pressure levels was the desire to maintain a sinusoidal profile. For instance, with an upper bound of 450 psi imposed by the supply pressure, modulation of more than + 100 psi was not possible while maintaining a mean pressure of 350 psi. This limitation is illustrated in Figure 3.6.9. The figure shows the pressure fluctuations measured in the fuel line for three different mean pressure settings. The throttle valve assembly was actuated with a + 1 V sine wave at 120 Hz for these tests.
0 0.005 0.01 0.015 0.02 0.025 0.030
50
100
150
200
250
300
350
400
450
500
Fuel
pre
ssur
e (p
si)
Time (sec)
350 psi mean ± 100 psi300 psi mean ± 145 psi250 psi mean ± 180 psi
Figure 3.6.9: Pressure oscillations measured at transducer #3.
Figure 3.6.9 shows that the percent fuel modulation increased as the mean pressure was reduced from 350 psi to 250 psi. Unfortunately the atomization quality also declined as the mean pressure was reduced. Therefore, selecting an appropriate mean fuel pressure involved a tradeoff between maximizing the fuel modulation levels while still maintaining adequate downstream pressure levels necessary for proper atomization. As a compromise, a mean fuel supply line pressure of 300 psi was chosen for the majority of the combustor experiments. The next section discusses the scalability of the fuel modulation system. 3.7 Scalability The term scalability refers to the system’s ability to maintain modulation levels regardless of the mean flow rate through the system. This was important for our fuel modulation system since it was designed to operate with the 2-gph VACCG combustor as well as higher flow rate combustors. For this modulation system, a bypass line was incorporated so that the performance of the system could be maintained with different mean flow rates. To investigate the system’s scalability, the frequency response functions, taken with different size atomizers, were compared. For each experiment, the
Chapter 3: Redesign of the Throttle Valve System 55
bypass valve was adjusted, as specified in Table 3.2.1, to maintain a constant downstream impedance. Figure 3.7.1 shows that the magnitude of the frequency response function did not change based on the size of the atomizer.
Figure 3.7.1: Amplitude of the frequency response function for pressure transducer #3
located downstream of the valve (pipe length L2 = 134”). Section 3.6 discussed the fuel modulation levels that were possible with a 1.0-gph atomizer. The trend, noticed in Figure 3.7.1, indicates that a 10-gph atomizer, with the appropriate bypass valve setting, should produce comparable levels of modulation. To investigate this, experiments were performed with a 10-gph atomizer and a mean fuel pressure of 250 psi. The dynamic fuel pressure was measured using transducer #2 located downstream of the throttle valve. Equation (2.01), a simple relationship for the flow rate through an atomizer as a function of fuel pressure, was used to approximate the flow modulation. Figure 3.7.2 shows the pressure measurements and the calculated flow rate through the 10-gph atomizer. For this experiment, the throttle valve assembly was actuated with a + 1 V sine wave at 115 Hz.
Figure 3.7.2: Fuel modulation at 115 Hz with a 10-gph atomizer.
Chapter 3: Redesign of the Throttle Valve System 56
Figure 3.7.2 shows that the system was capable of 128% pressure modulation and more than 75% flow modulation (refer to definitions of percent modulation on page viii). This was close to the levels observed with the 1.0-gph atomizer. The next step was to investigate the achievable high-frequency modulation levels. The system was driven at 760 Hz while using a 10-gph atomizer with a mean fuel pressure of 100 psi. The measured pressure fluctuations are shown in Figure 3.7.3 along with the calculated flow oscillations. For this experiment, the throttle valve assembly was actuated with a + 600-mV signal.
0 0.5 1 1.5 2 2.5 3
x 10-3
70
80
90
100
110
120
130
Dow
nstre
am P
ress
ure
(psi
)
Time (sec)
0 0.5 1 1.5 2 2.5 3
x 10-3
7.5
8
8.5
9
9.5
10
10.5
Flow
rate
(gph
)
Time (sec)
Figure 3.7.3: Fuel modulation at 760 Hz with a 10-gph atomizer.
Figure 3.7.3 shows that the system can produce 40% pressure modulation and 21% flow modulation at 760 Hz. Additionally, the modulation system is capable of producing 128% pressure modulation and more than 75% flow modulation at 115 Hz. The system is also scalable, with comparable levels of modulation at any mean flow rate from 0.4 to 10 gph. The next section includes a description of the VACCG kerosene combustor, and discusses the fuel modulation system’s authority over the combustion process.
Chapter 3: Redesign of the Throttle Valve System 57
3.8 Combustor Performance After verifying that the modulation system was capable of producing pressure oscillations in the fuel line, testing was performed to determine whether these pressure oscillations were capable of influencing the combustion process. The VACCG combustor designed by Wajid Chishty was used for this portion of the research. A photo of this combustor is shown in Figure 3.8.1.
Figure 3.8.1: Photo of VACCG liquid-fuel combustor.
At the combustor inlet, a 1.0-gph Delavan pressure atomizer injects kerosene into a swirling air stream. The fuel is supplied to the atomizer using a BSM No. 710 gear pump able to deliver 35 gph of kerosene at pressures as high as 600 psi. To create the swirling air stream, a 100 psi compressor forces up to 70 scfm of air through 45o swirl vanes. The combustor also has three quartz viewing ports located at the base of the chimney, which provide convenient visual access to the flame. The top half of the 51-inch tall chimney is water cooled to enhance the combustor’s thermoacoustic instability. Using this chimney, the combustor has a very well pronounced instability at ~120 Hz. A simplified schematic of the entire combustion system, including the air and fuel supply lines, is included in Figure 3.8.2.
Chapter 3: Redesign of the Throttle Valve System 58
Pulsation Damper
Gear PumpFlow Meter
Throttle Valve Assembly
PressureTransducer #3
Expansion Chamber
Return to the tank
Atomizer
PressureTransducer #2
PressureTransducer #1
Bypass Valve
Return to the tank
Air Metering Valve
From the Air Compressor
PressureTransducer
Metering Valve
PressureRegulator
FlowMeter
Flow Meter
Return to the tank
Tank
ChimneyCombustor
Air Inlet
SwirlVanes
Filter
Figure 3.8.2: Schematic of the fuel and air systems for the combustor.
The combustion system is monitored using multiple pressure transducers and flow meters located in the chimney, and throughout the fuel and air lines. The signal from each transducer is processed and recorded using either an HP signal analyzer or one of the two computers in the test bay. The specifications for each transducer are included in Appendix C along with a wiring diagram for the system. For the majority of the combustion experiments, a 1.0-gph atomizer was used with a mean fuel pressure of 300 psi. Before performing fuel modulation experiments, it was necessary to investigate how variations in the fuel-to-air ratio influenced the combustion process. Generally the fuel-to-air (F/A) ratio is normalized by the stoichiometric F/A ratio to give the global equivalence ratio, φ. For this work, the global equivalence ratio was controlled using only the air flow through the system. Varying the global equivalence ratio resulted in three distinct combustion regions. Each region is defined by drastically different flame shapes and pressure signatures. Figure 3.8.3 shows pictures of the flame in each of the three regions.
Chapter 3: Redesign of the Throttle Valve System 59
a. b. c. Figure 3.8.3: a. Photo of the flame in the stable region (φ < 0.58). b. Photo of the flame in the first unstable region (0.58 < φ < 0.73). c. Photo of the flame in the second unstable
region (φ > 0.73). In the first combustion region where φ was less than 0.58, the system was relatively quiet and the flame was blue and compact. As the air flow was decreased, the system suddenly became very loud and the flame shape changed. In this region, the flame had turbulent orange fingers extending from the lower blue cone. The orange portions of the flame indicated that the fuel and air were not mixing uniformly. Large pressure oscillations in the chimney may have disrupted the mean air flow and caused the poor mixing in this region. As the air flow was decreased further, the flame once again became blue, and appeared very diffuse. For each combustion region, the pressure oscillations in the combustor were measured. Figure 3.8.4 shows the pressure oscillations measured in the chimney 6” above the atomizer.
0 100 200 300 400 500 600 700 80080
90
100
110
120
130
140
150
160
170
180
Com
bust
or p
ress
ure
(SP
L)
Frequency (Hz)
a.
b.
c.
φ < 0.580.58 < φ < 0.73φ > 0.73
Figure 3.8.4: a. Power spectrum of the combustor pressure in the stable region (φ < 0.58). b. Power spectrum of the combustor pressure in the first unstable region (0.58 < φ < 0.73).
c. Power spectrum of the combustor pressure in the second unstable region (φ > 0.73). The sharp peaks and strong harmonics in the power spectra for the upper two global equivalence ratio bands indicate that the system was unstable at those conditions. Since the gas turbine industry is primarily interested in instabilities encountered at very lean operating conditions, the remainder of this work focused only on the lower instability region with a φ between 0.58 and 0.73.
Chapter 3: Redesign of the Throttle Valve System 60
After the combustor characterization experiments were completed, the influence of the fuel modulation system on the combustion process was investigated. Initial experiments were performed in the stable combustion region. The fuel was modulated about a mean pressure of 300 psi and the resulting combustor pressure oscillations were measured. The results of this experiment are shown in Figure 3.8.5.
Figure 3.8.5: Impact of + 25 psi fuel modulation on the stable combustor.
It’s clear that the fuel modulation system was capable of influencing the combustion process under stable operating conditions. Fuel line pressure oscillations of + 25 psi produced 20 dB spikes in the combustor pressure. The narrow peaks and absence of harmonics in the power spectra indicate that the pressure oscillations in the fuel line were coupling linearly into the heat release rate. While the systems ability to influence the stable combustor was important, the ultimate goal of the fuel modulation system is to control an unstable combustor. Therefore, the fuel line pressure oscillations would also need to exhibit some influence over the unstable combustion process. For the unstable combustor, + 25 psi pressure oscillations in the fuel line were not sufficient to influence the combustion process. However, further experiments showed that modulation levels of + 45 psi did produce noticeable peaks in the unstable response. Figure 3.8.6 compares the power spectra of the combustor for stable and unstable conditions with this level of fuel modulation.
Figure 3.8.6: Impact of + 45-psi fuel modulation on the combustor at 50 Hz.
At 50 Hz, the unstable response showed an 8 dB spike in the sound pressure level inside the combustor. While this showed that the modulation system could influence the unstable combustor, it should be noted that the spike in the unstable response was 6 dB lower than the spike in the stable response. This may have been caused by the large
Chapter 3: Redesign of the Throttle Valve System 61
pressure oscillations in the unstable combustor. If these pressure oscillations disrupted the airflow, then the mixing process would also have been affected. The quality of mixing determines the time delay from when a droplet leaves the atomizer to when it burns. If unstable pressure oscillations in the combustor periodically disrupted the mixing process, then the fuel oscillations would not have been able to produce distinct heat release rate fluctuations. This would explain why the 50 Hz peak in the unstable response was smaller than the peak in the stable response. After verifying that fuel modulation could be used to influence the unstable combustion process, active combustion control experiments were attempted. The modulation system was successfully used to control the combustor using a phase shift algorithm. Unfortunately, control was only possible for certain operating conditions. The global equivalence ratio had to be very close to the stable boundary before the modulation system was able to stabilize the combustor. With higher global equivalence ratios, the system could not be stabilized regardless of the fuel modulation levels. One of the successful control experiments is shown in Figure 3.8.7.
0 100 200 300 400 500 600 700 80080
90
100
110
120
130
140
150
160
170
180
Com
bust
or p
ress
ure
(SP
L)
Frequency (Hz)
UncontrolledControlled
Figure 3.8.7: Control results achieved at the edge of the instability region.
During this experiment, the modulation system reduced the fundamental peak by 30 dB, and produced a 12 dB reduction in the broadband SPL values. However, the system’s inability to control the combustor at higher global equivalence ratios leads to perhaps the most important conclusion of the control experiments. This work indicates that having the ability to produce large pressure fluctuations in the fuel line is not sufficient for active combustion control. While research is currently being performed to determine why the combustor could not be stabilized at higher global equivalence ratios, the precise cause has not yet been determined. One investigation is focusing on the fuel as it leaves the atomizer. For this work, the fuel is being modulated and the resulting droplet sizes and velocities are being measured. Ideally, the fuel modulation system should be able to produce velocity perturbations without affecting the size of the droplets. If the droplet sizes are varying over one modulation cycle, then this might explain why the authority of the fuel modulation system over the combustion process was limited. The time required for the droplets to burn is partially determined by their size. If the droplet sizes vary substantially over one period, then the fuel would burn as a distorted sine wave. This would distribute the heat release over a larger frequency range, leaving less energy at the
Chapter 3: Redesign of the Throttle Valve System 62
fundamental frequency. Therefore, the modulation system’s authority over the instability would decrease as the heat release rate fluctuations became increasingly distorted. Other experiments are being performed to study the interaction between the unsteady acoustics in the combustor and the mixing process. If the acoustic pressure fluctuations in the chimney are disrupting the mixing process over some portion of the thermo-acoustic instability’s acoustic period, then the heat release rate fluctuations may be attenuated. Another possible explanation for the loss of authority at high global equivalence ratios has to do with the limitations of the control system. Increasing the global equivalence ratio above the lean stability limit of the system moves the combustor poles farther into the right-half plane. Therefore, a higher gain is required to stabilize the system. However, the complex conjugate poles associated with the acoustic resonance in the fuel line may move into the right half plane and destabilize the system at these high gains. Depending on the dynamics of the system, it is possible that the acoustic poles could move into the right half plane before the combustor poles are stabilized. Figure 3.8.8 shows two simplified pole-zero maps for the combustion system. The curve in green represents a system with a relatively low global equivalence ratio that can be stabilized. The curve in red illustrates what could happen to the system at a high global equivalence ratio. This system can not be stabilized regardless of the gain.
Figure 3.8.8: Root locus plot for the simplified combustion system.
Figure 3.8.8 shows that a more sophisticated controller may be necessary to improve the performance of the active combustion control system.
Chapter 4: Summary and Future Work 63
Chapter 4: Summary and Future Work 4.1 Summary The goal of this project was to design, build, and characterize a high-bandwidth fuel modulation system for active combustion control. Specifically, the modulation system needed to produce a minimum of 40% flow modulation at frequencies up to 700 Hz with liquid-fuel flow rates as high as 10 gph. After two iterations, a throttle valve system was developed whose performance exceeded these requirements. The system uses an off-the-shelf valve with a 500-µm, piezoelectric stack. The Swagelok BN series valve was selected because large changes in its flow coefficient are achieved from small deflections of the valve stem. Additionally, it is small, robust and has a bellows seal, which will not degrade due to high-frequency actuation. The proportional, high-bandwidth, piezoelectric actuator was chosen after comparing the force, stroke, and frequency capabilities of piezoelectric stacks and electromagnetic actuators. A brief investigation of electrostrictive and magnetostrictive actuators was also performed. After choosing a piezoelectric stack and amplifier, the safe operating region for these components was defined. High-frequency, high-amplitude excitation of the actuation system was avoided to prevent tripping the amplifier or placing the actuator in tension. For active combustion control applications, large pressure oscillations are only necessary in a narrow frequency range around the combustor’s instability frequency. Therefore, it is advantageous to optimize the system for those frequencies. This was accomplished by adjusting the length of the fuel line downstream of the valve until its acoustic resonance matched the instability frequency of the combustor, ~115 Hz. Before tuning the downstream pipe length, an acoustic filter had to be installed to eliminate the interaction between the upstream and downstream acoustics. An expansion chamber was placed a few inches upstream of the valve for this purpose. After tuning the downstream length, the system produced 128% pressure modulation and more than 75% flow modulation at 115 Hz (refer to definitions of percent modulation on page viii). Additionally, at 760 Hz the system produced 40% pressure modulation and 21% flow modulation with flow rates between 0.4 and 10 gph. These modulation levels were obtained while ensuring that the downstream pressure always remained above 75 psi, so that the atomization quality would not decline. Higher modulation levels can be achieved by lowering the mean pressure, but this comes at the expense of atomization quality. Furthermore, since no more than 40% of the actuator’s stroke was used for any of the modulation experiments, a relatively low voltage was applied to the stack. This is beneficial because low voltage operation substantially improves the lifetime of piezoelectric actuators. In summary, the proportional fuel modulation system exceeds the target specifications with more than 75% flow modulation at flow rates up to 10 gph. Additionally, the system has a bandwidth above 700 Hz, and produces reliable, repeatable modulation. The VACCG kerosene combustor was used for the combustion control experiments. Using a phase shift algorithm, the fuel modulation system reduced the fundamental peak
Chapter 4: Summary and Future Work 64
of the ~115 Hz instability by 30 dB, and produced a 12 dB reduction in the broadband sound pressure levels inside the combustor. However, the most important conclusion from the combustion control experiments was not the system’s accomplishments, but rather its inability to control the combustor at high global equivalence ratios. Our work indicates that having the ability to produce large pressure fluctuations in the primary fuel line is not sufficient for active combustion control. Although the reason is not yet known, one theory suggests that the pressure fluctuations in the chimney disrupt the fuel spray and smear out the oscillations before the fuel has a chance to burn. To investigate this hypothesis, the VACCG is currently comparing the velocity of the fuel droplets leaving the atomizer with the acoustic fluctuations in the chamber. This work is being performed by Wajid Chishty using Phase Doppler Anemometry (PDA) to measure the change in both the size and velocity of the fuel particles while applying different levels of acoustic excitation. Following this work, research will consider ways to improve the coupling between the pressure in the fuel line and the heat release rate. Possible alternatives include using secondary atomizers to inject the fuel closer to the flame, increasing the mean velocity of the fuel, and changing the droplet size. Each of these changes should make the spray more resistant to acoustic disturbances. The following section offers suggestions for improving the modulation system. 4.2 Future Work The modulation system could be improved by increasing the actuator’s bandwidth, and by making the system smaller and more durable. The bandwidth of the current system is limited by both the actuator’s preload and the amplifier’s capabilities. By increasing the preload, the system could be operated at higher frequencies without the risk of placing the stack in tension. Unfortunately, this would also make the actuator susceptible to buckling due to its long slender design. To address the buckling concern, we would either have to shorten the length, or increase the diameter of the stack before increasing the preload. Decreasing the length of the actuator also decreases the stroke, which is undesirable. Unfortunately, increasing the diameter of the stack increases its capacitance. A higher capacitance would reduce the bandwidth of the system due to the amplifier’s electrical power limitations. A piezoelectric ring actuator offers a possible solution to this problem. These actuators are very similar to stacks; however, since they are hollow, ring actuators have a smaller capacitance than typical piezoelectric stacks with similar stroke capabilities. Therefore, a large diameter ring actuator with a high preload could be investigated as a means to increase the bandwidth of the system. The durability of the actuation system could be improved using a bipolar, piezoelectric actuator. Bipolar actuators are driven with both positive and negative voltage levels. Because the mean voltage is zero, the electrochemical degradation of these actuators occurs much slower than it does with unipolar actuators. Therefore, the lifetime of
Chapter 4: Summary and Future Work 65
bipolar actuators is exponentially longer than the lifetime of standard piezoelectric stacks [34]. Using a bipolar actuator, it would be advantageous to replace the threaded stud, currently used to adjust the nominal position of the valve stem, with a high-resolution, linear actuator. This actuator would only be used at low frequencies to control the mean fuel pressure in the system. Because the bipolar actuator would not be used for mean pressure control, 100% of its stroke could be used for fuel modulation. Additionally, the bipolar actuator would never be required to maintain a DC voltage that could potentially reduce its lifetime. Limiting user interaction with the equipment would be another way to make the modulation system more robust. Creating a program to run the modulation system would allow inexperienced users to operate the equipment without risking misuse and possible damage to the actuator, amplifier, and valve. Modulation experiments could then be performed without any specialized knowledge about the system using the program’s graphical user interface. Ultimately, the size of the modulation system must be reduced to make it more valuable for active combustion control applications. Both the 18-inch long actuator and the high-voltage amplifier are relatively large and heavy. Therefore, the VACCG is currently investigating smaller actuators with less stringent power requirements. One project is attempting to place small actuators inside an atomizer. The narrow flow passages in the atomizer should make modulation possible with a very small actuator stroke. Aside from the space advantages associated with placing the actuator inside the atomizer, the system could also be used to control droplet size. Unfortunately, it might not be possible to install a downstream bypass line in this type of injection system. Without the return line, the system would be simpler, however, it would also be limited to a relatively narrow range of mean flow rates. Operating outside of this range could significantly reduce the performance of the injection system. In addition to changing the modulation system, a more sophisticated controller could be implemented to improve the performance of the active combustion control system at high global equivalence ratios. Although the exact dynamics of the combustor are still unknown, the dynamics associated with the acoustics in the fuel line as well as the band-pass filter should both be taken into account when designing this controller.
Appendix 66
Appendix A: Actuator Comparison
Table A.1: Actuator list.
Component Manufacturer Model Number Amplifier System cost
Shaker A Ling Dynamic Systems LDS V456 PA 1000L $17,055
Shaker B Ling Dynamic Systems LDS V408 PA 500L $10,365
Shaker C Ling Electronics LVS 40 $5,900
Shaker D Ling Dynamic Systems LDS V408 PA 100E $5,345
500-µm stack Piezomechanik Pst 1000/16/500 VS25 LE 1000/100 $7,550
200-µm stack Piezomechanik Pst 1000/10/200 LE 1000/100 $3,065
Matlab code for Figure 3.3.7 clear all; close all; clc; %%%% Swagelok BN series Valve %%%% d = 0.168; % Valve Orifice Area (in) Fexternal = 500 * ( pi / 4 * d ^ 2 ) * 4.4; % Fluid force (N) Requirement = 300*ones(1,1000); % Required stroke (um) mv = 0.085; % Estimated mass BN series valve stem (kg) f=linspace(1,1000,1000); w=2*pi*f; %%%% LDS V203-PA 25E %%%% Xmax = .005; %System displacement pk-pk (m) Vmax = 1.49; %System velocity sine peak (m/s) Fmax = 17.8; %System sine force peak (N) m_armature = 0.02 ; %Armature mass (kg) F = Fmax - Fexternal ; % Available force (N) m = m_armature + mv; % Total moving mass (kg) x_X = Xmax * ones(1,1000) * 10 ^ 6; % Disp. controlled region (um) x_V = Vmax ./ (2 * pi * f) * 10 ^ 6 * 2; % Vel. controlled region (um) x_A = F ./ (m * (2 * pi * f).^2) * 10 ^ 6 * 2; % Force controlled region (um) for i = 1:1000; x_comparison(i,:) = [x_X(i) x_V(i) x_A(i)];
Appendix 67
X1(i) = min(x_comparison(i,:)); end %%%% LDS V408-PA 100E %%%% Xmax = .014; %System displacement pk-pk (m) Vmax = 1.52; %System velocity sine peak (m/s) Fmax = 98; %System sine force peak (N) m_armature = 0.2 ; %Armature mass (kg) F = Fmax - Fexternal ; % Available force (N) m = m_armature + mv; % Total moving mass (kg) x_X = Xmax * ones(1,1000) * 10 ^ 6; % Disp. controlled region (um) x_V = Vmax ./ (2 * pi * f) * 10 ^ 6 * 2; % Vel. controlled region (um) x_A = F ./ (m * (2 * pi * f).^2) * 10 ^ 6 * 2; % Force controlled region (um) for i = 1:1000; x_comparison(i,:) = [x_X(i) x_V(i) x_A(i)]; X2(i) = min(x_comparison(i,:)); end . . . %%%% Pst 1000/16/500 %%%% Fo = 8400 * exp (- 0.0018 * f) - 4.5; % Roll-off of amplifier m = .272 + mv; % Total moving mass (kg) k = 16.8*10^6; zeta = 0.03; %estimated from modal tests wn=sqrt(k/m); wd=wn*sqrt(1-zeta^2); fo=Fo/m; X8 =( fo ./ sqrt( (wn ^ 2 - w .^ 2) .^ 2 + (2 * zeta * wn * w) .^ 2 ) ) * 10 ^ 6; %%%% Pst 1000/10/200 %%%% Fo = 2000 * exp (- 4 * 10 ^ -5 * f) - 4.5; % Roll-off of amplifier m = .028 + mv; % Total moving mass (kg) k = 10*10^6; zeta = 0.03; wn=sqrt(k/m); wd=wn*sqrt(1-zeta^2); fo=Fo/m; X9 =( fo ./ sqrt( (wn ^ 2 - w .^ 2) .^ 2 + (2 * zeta * wn * w) .^ 2 ) ) * 10 ^ 6; %%%% Plots %%%% figure loglog(f,X4,f,X3,f,X6,f,X2,f,X8,f,X9,f,Requirement,'r:','LineWidth',2); xlabel('Frequency (Hz)','FontSize',12); ylabel('Peak-to-peak displacement (um)','FontSize',12); l=legend('Shaker A - $17,055','Shaker B - $10,365','Shaker C - $5,900',... 'Shaker D - $5,345','500-um stack - $7,550','200-um stack - $3,065',... 'Required stroke'); set(l,'FontSize',12); grid on; grid minor; axis([1 10^3 10 40000]); h=gca; set(h,'FontSize',12); set(h,'XMinorTick','off') set(h,'XTick',[1 2 4 6 8 10 20 40 60 80 100 200 400 600 800]); set(h,'YTick',[10 20 40 60 80 100 200 400 600 800 1000 2000 4000 6000 8000 10000 20000 40000 60000]); set(h,'YMinorTick','off')
Fuel line pressure transducer #3 (11 5/8" upstream of the nozzle)
Omega DPX101-1K dynamic pressure
transducer
n/a (Uses ICP
power) n/a 4.95 mV/psi n/a
Combustor pressure transducer (in the chimney
6" above the nozzle)
SenSym SX01D diaphragm pressure
transducer 10 3.75x20 4.0
mV/V/psi 0.435 mV/Pa
Air pressure transducer (Spare)
SenSym SX05D diaphragm pressure
transducer 10 5x20 3.0
mV/V/psi 0.435 mV/Pa
Inline flow meter AW Company Model HEF1 flow meter n/a n/a n/a
Bypass flow meter AW Company Model HEF1 flow meter n/a n/a n/a
Air flow meter Eldridge Products Inc.
Model 8710NH-SSS-000-DC24 Air flow meter
n/a n/a n/a
Note:
=
=
ref
rms
ref
rms
pp
ppSPL 102
2
10 log20log10 , where uPapref 20= .
Specifically,
×
= −610 1020000435.0
11707.0log20
cSPL , where 1c is measured in volts.
Appendix 70
Throttle Valve Assembly
Combustor Pressure Transducer
Pressure Transducer #1 (Upstream)
Pressure Transducer #2 (Downstream)
Pressure Transducer #3 (Nozzle)
Strain Gage Amp
DS 1103A/D 1 5 9 13 17
D/A 1
HP FFTAnalyzer
Piezo AmpRef Mon Out
B PFilter
L PFilter
ICP Pwr Supply
dSPACEComputer
LabVIEWComputer
NationalInstruments A/D
In-line Flow Meter
Bypass Flow Meter
Air Flow Meter
Figure C.1: Wiring diagram for the combustion system.
Bibliography 71
Bibliography [1] Abdel-Wahab, S., Bier, A., Brar, J., Cordivari, M., Early, P., Sides, J., Development of a Pulsed Fuel Injection System for Active Combustion Control, ME 4015/4016 Senior Design Report, 2002. [2] Ashley, S., 1998, “Magnetostrictive actuators,” Mechanical Engineering, [online] June, http://www.memagazine.org/backissues/june98/features/magnet/magnet.html (Accessed 15 September 2003). [3] Barooah, P., Anderson, T.J., Cohen, J.M., “Active Combustion Instability Control with Spinning Valve Actuator,” ASME paper no. GT-2002-30042, American Society of Mechanical Engineers, International Gas Turbine Institute, Turbo Expo, Vol. 2 A, pp. 197-207, 2002. [4] Black, D., CFD Research Corporation, Personal conversations, (24 September 2003). [5] Bloxidge, G.J., Dowling, A.P., Hooper, N., Langhorne, P.J., “Active Control of Reheat Buzz,” AIAA Journal, Vol. 26 No. 7, pp. 783-790, 1988. [6] Candel, S.M., “Combustion Instabilities Coupled by Pressure Waves and Their Active Control,” 24th Symposium on Combustion, pp. 1277-1296, 1992. [7] Carson, J.M., Subharmonic and Non-Subharmonic Pulsed Control of Thermoacoustic Instabilities: Analysis and Experiment, Master’s Thesis, Virginia Polytechnic Institute and State University, December 2001. [8] CFD Research Corporation website: Description and diagram of their electromagnetic fuel actuator. http://www.cfdrc.com/applications/combustion/electromag.html (Accessed 23 September 2003). [9] DeCastro, J.A., Design and Validation of High-Bandwidth Fuel Injection Systems for Control of Combustion Instabilities, Master’s Thesis, Virginia Polytechnic Institute and State University, February 2003. [10] Delavan Spray Technologies, Industrial Spray Nozzles and Accessories, USA, 1998. [11] Dong, S., Du, X-H., Bouchilloux, P., Uchino, K., “Piezoelectric Ring-Morph Actuators for Valve Application,” Journal of Electroceramics, Vol. 8 No. 2, 155-161, 2002. [12] Eisenhower, B.A., Identification of Thermoacoustic Dynamics Exhibiting Limit Cycle Behavior, Master’s Thesis, Virginia Polytechnic Institute and State University, May 2000. [13] Etrema Products, Inc: General information about TERFENOL-D. http://www.etrema-usa.com/terfenol/index.asp (Accessed 15 September 2003). [14] Franklin, G.F., Powell, D.J., Workman, M., Digital Control of Dynamic Systems, 3rd ed., Addison-Wesley, California, 1998.
Bibliography 72
[15] Greenwood, A., Implementation of Adaptive Filter Algorithms for the Suppression of Thermoacoustic Instabilities, Master’s Thesis, Virginia Polytechnic Institute and State University, February 2003. [16] H2W Technologies, Inc: General voice coil principles. http://www.h2wtech.com/noncommdcactu.htm (Accessed 15 September 2003). [17] Hantschk, C., Hermann, J., Vortmeyer, D., “Active Instability Control with Direct-Drive Servo Valves in Liquid-Fueled Combustion Systems,” 26th International Symposium on Combustion, pp. 2835-2841, 1996. [18] Hassler, B., “A 700 Hz Valve for Dispensing High Viscosity Molten Polymers using a Piezo-Electrically Driven Star Frame Mechanical Amplifier,” 2000. [19] Heising, R., Lubarsky, E., Neumair, M., Neumeier, Y., Zinn, B.T., “Periodic Liquid Fuel Sprays Combustion Processes and their Damping of Combustion Instabilities,” AIAA paper no. AIAA 2000-1024, presented at the AIAA 38th Aerospace Sciences Meeting, Reno, NV Jan. 10-13, 2000. [20] Hermann, J., Gleis, S., Vortmeyer, D., “Active Instability Control of Spray Combustors by Modulation of the Liquid Fuel Flow Rate,” Combustion and Science, Vol. 118 pp. 1-25, 1996. [21] Inman, D.J., Engineering Vibration, 2nd ed., Prentice Hall, New Jersey, pp. 97-101 and 510-513, 2001. [22] Jaw, L.C., Wu, D.N., Zhou, G.A., Bryg, D.J., Walsh, M., “A High-Response High-Gain Actuator for Active Flow Control,” AIAA paper no. AIAA 99-2128, presented at the 35th AIAA/ASME/SAE/ASEE Joint Propulsion Conference and Exhibit, Los Angeles, CA June 20-24, 1999. [23] Kappei, F., Lee, J.Y., Johnson, C.E., Lubarsky, E., Neumeier, Y., Zinn, B.T., “Investigation of Oscillatory Combustion Processes in Actively Controlled Liquid Fuel Combustor,” AIAA paper no. AIAA 2000-3348, presented at the 36th Joint Propulsion Conference & Exhibit, Huntsville, AL July 16-19, 2000. [24] Kiel, B., “Review of Advances in Combustion Control, Actuation, Sensing, Modeling and Related Technologies for Air Breathing Gas Turbines,” AIAA paper no. AIAA 2001-0481, presented at the 39th Aerospace Sciences Meeting and Exhibit, Reno, NV Jan. 8-11, 2001. [25] Lagimoniere, E.E., The Design and Construction of a High-Bandwidth Proportional Fuel Injector for Liquid Fuel Active Combustion Control, Master’s Thesis, Virginia Polytechnic Institute and State University, August 2001. [26] Lang, G.F., Snyder, D., 2001, “Understanding the Physics of Electrodynamic Shaker Performance,” Sound and Vibration, [online] Dynamic Testing Reference Issue, http://www.dataphysics.com/DP-Physics%20of%20Shaker%20Performance.pdf (Accessed 15 September 2003). [27] Langhorne, P.J., Dowling, A.P., Hooper, N., “Practical Active Combustion Control System for Combustion Oscillations,” Journal of Propulsion and Power, Vol. 6 No 3, pp. 324-333, 1990.
Bibliography 73
[28] Leo, D., Class Notes ME5984: Smart Structures / Active Materials, Virginia Tech, 2001. [29] Lieuwen, T., McManus, K., “That Elusive Hum,” Mechanical Engineering, June 2002 pp. 53-55. [30] Lyons, J.L., Lyons’ Valve Designer’s Handbook, New York: Van Nostrand Reinhold Co., 1982. [31] Mide Technology Corporation: Schematic of a magnetostrictive actuator. http://www.mide.com/pdfs/magnetostrictive_actuators.pdf (Accessed 15 September 2003). [32] MOOG: Schematic of a servo-proportional valve. http://www.moog.com (Accessed 2002). [33] Neumeier, Y., Lubarsky, E., Heising, R., Israeli, O., Neumaier, M., Zinn, B.T., “Liquid Injector Actuator for Control of Combustion Processes,” AIAA paper no. AIAA 98-3540, presented at the 34th AIAA/ASME/SAE/ASEE Joint Propulsion Conference & Exhibit, Cleveland, OH, July 13-15, 1998. [34] Piezomechanik GmbH website: General actuator data and product specifications. http://www.piezomechanik.com/ (Accessed 2002-2003). [35] Roberts, D., Hagood, N., Su, Y-H., Li, H., Carretero, J., “Design of a Piezoelectrically-Driven Hydraulic Amplification Microvalve for High Pressure, High Frequency Applications,” Proceedings of the SPIE, Vol. 3985, 2000. [36] Seume, J.R., Vortmeyer, N., Krause, W., Hermann, J., Hantschk, C.-C., Zangl, P., Gleis, S., Vortmeyer, D., Orthmann, A., “Application of Active Combustion Instability Control to a Heavy Duty Gas Turbine,” ASME paper no. 97-AA-119, presented at the ASME ASIA Congress & Exhibition, 1997. [37] Sun, F., Cohen, J.M., Anderson, T.J., “Liquid Fuel Modulation by Fluidic Valve for Active Combustion Control,” ASME paper no. GT-2002-30607, presented at the ASME Turbo Expo, Amsterdam, Netherlands, June 3-6, 2002. [38] Swagelok website: Information on valve sizing and product specifications. http://www.swagelok.com (Accessed 2003). [39] Vaughan, R., Campbell, J., Coffield, B., Glanville, J., Griffith, J., Griggs, T., Hamilton, L., Little, R., Manley, S., McNinney, B., Shoaf, J., Thawley, S., Warren, J., High Bandwidth Actively Controlled Fuel Injection System to Eliminate Combustion Instability, ME 4015/4016 Senior Design Report, 2003. [40] Wicks, A., Class Notes ME 5534: Experimental Modal Analysis, Virginia Tech, 2003. [41] Wilson, M., H2W Technologies Inc, (2003), Personal conversations. [42] Zinn, B.T., Neumeier, Y., “An Overview of Active Control of Combustion Instabilities,” AIAA paper no. AIAA 97-0461, presented at the 35th Aerospace Sciences Meeting & Exhibit, Reno, NV, Jan. 6-9, 1997.
Vita 74
Vita Noah Harrison Schiller was born in Dyke, Virginia on December 17, 1979. He graduated in Mechanical Engineering from Virginia Tech in 2002 with his Bachelor’s Degree. In the fall of 2003 he will receive his Master’s Degree in Mechanical Engineering from Virginia Tech.