Clients People Performance Design, Construction and Startup of the First Enhanced Nutrient Removal Plant in Maryland Funded by the Chesapeake Bay Restoration Fund Rip Copithorn, Jeff Sturdevant, Vince Maillard GHD
Transcript
Clients People Performance
Design, Construction and Startup of the
First Enhanced Nutrient Removal Plant in Maryland Funded by the
Chesapeake Bay Restoration Fund
Rip Copithorn, Jeff Sturdevant, Vince Maillard
GHD
Introduction
• Chesapeake Bay 2000 Agreement• Maryland, Virginia, Pennsylvania, DC• Reduce N and P by 20 million and 1 million lbs, resp.• Follows the 1983 agreement that resulted in the BNR
program• Enhanced Nutrient Removal (ENR) Program
• ENR Program requires WWTFs to achieve annual average effluent TN of 3 mg/L and TP of 0.3 mg/L
• New limits achieve only 1/3 of the reduction in Agreement
USGS MD-DE-DC Water Science Center
Background • All WWTFs in the
Chesapeake Bay watershed will be subject to strict effluent nutrient loading limits:• Maryland, Pennsylvania,
and Virginia already have nutrient limits
• Delaware, New York, and West Virginia are developing similar requirements
• All WWTFs 0.5 mgd or greater (total of 66 plants)• Required to upgrade to BNR levels first• ENR eligible items are 100% fundable• Statewide “flush tax” ($50/yr per household)• Easton, MD was first plant to enter the ENR
program in MD in 2003
Easton, MD
Nitrogen Removal
20 mg/L 10 mg/L 5 mg/L 0 mg/L
Nitrification BNR ENR UNR
Easton Goal (3 mg/L)
Permit = 4.0 mg/L
Approximate Limit of Technology
Previous MD Goal/ Standard
Original Permit had NH3 Removal Only
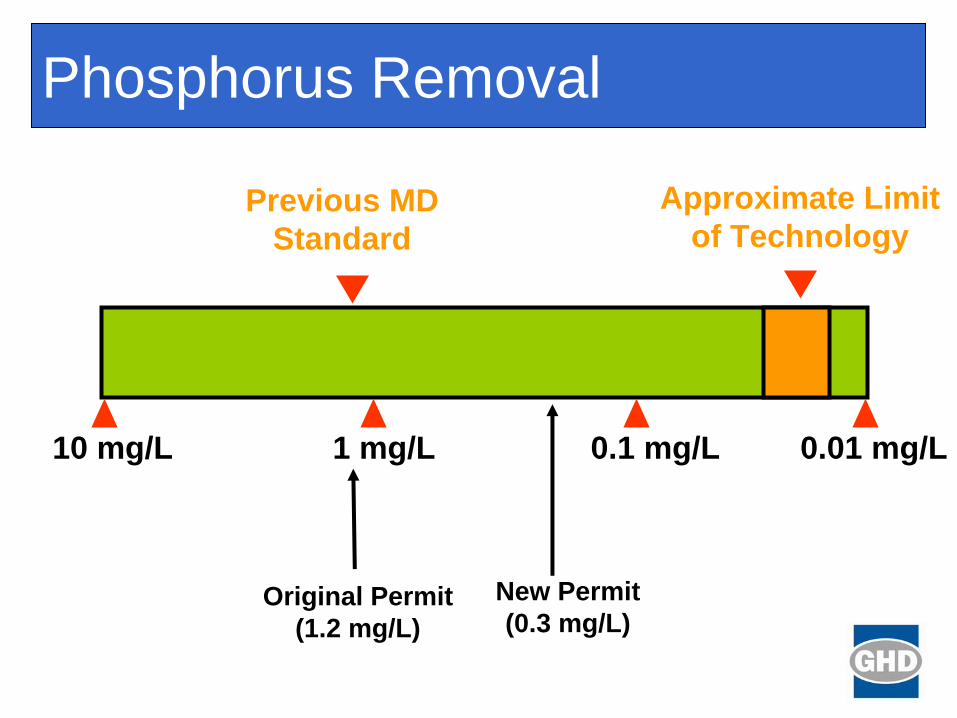
Phosphorus Removal
10 mg/L 1 mg/L 0.1 mg/L 0.01 mg/L
New Permit(0.3 mg/L)
Approximate Limit of Technology
Original Permit (1.2 mg/L)
Previous MD Standard
Overview of Existing Facility
Overland Flow Terraces
Facultative Lagoons
Cl2 & SO2 Buildings
Laboratory
Chlorine Contact
Tank
Outfall
Maintenance Building
Existing Process Flow Diagram
Primary Lagoon
SecondaryLagoon
OverlandFlow
Terraces (5)
PostAeration
Cl2SO2
Raw Influent Outfall
Recycle Pumps
Existing Facility
• Capacity = 2.35 mgd• Limits
BOD5 (6/1 - 10/31) 20 mg/l(11/1 – 5/31) 30 mg/l
Ammonia (6/1 – 10/31) 5 mg/l
New Facility
• Average = 4.0 mgd• Design (Max Month) = 5.5 mgd• Peak Day = 7.8 mgd (higher flows equalized)• Limits
BOD5 (4/1 - 9/30) 11 mg/l(10/1 – 3/31) 30 mg/l
TSS 30 mg/LAmmonia (4/1 - 9/30) 2.1 mg/l
(10/1 – 3/31) 3.7 mg/lTP 1.2 mg/L
Future Limits and Current Goals
On an average annual basis• TN – 4.0 mg/L (goal 3.0 mg/L)• TP – 0.3 mg/L
Workshop 2Qualitative and quantitative analysis of remaining alternatives
•Biolac •Orbal•Bardenpho
Selection of EIMCO 5-Stage Bardenpho System
Overview of New Facility
Preliminary Treatment
5-Stage Bardenpho Reactors
Secondary Clarifiers
Operations Building
Pump & Blower Building
Waste Sludge Holding Tanks
Effluent FiltersSolids
Processing Building
Dried Biosolids
Storage SiloUV Disinfection
Easton WWTF Bioreactors
Process includes two (2) parallel oxidation ditches followed by post- anoxic and re-aeration tanks, clarifiers, and deep bed continuously- backwashing up-flow filters
Easton WWTF Bioreactors
Oxidation ditches configured as 5-stage Bardenpho process with a “racetrack” style central aerobic cell aerated w/ vertical shaft surface aerators
Easton WWTF Bioreactors
Process cut-away showing the Bioreactors at the Easton WWTF
OVIVO Eimco Water Technologies (EWT) Carrousel® System Surface Aerator
Anaerobic andPre-Anoxic ZonesAerated “Racetrack”
Zone
Easton WWTF Bioreactors
SCADA control screen for the Bioreactors at the Easton WWTF
Easton WWTF Bioreactor Volume
1The second post anoxic zone was placed into service from October 2008 to April 2009 and October 2009 to March 2010.
Because influent flow and load are only about 60% of the full design values, the plant operators have only operated one of the two bioreactors since the plant went on line.
• Existing process required no sludge treatment or disposal
• New process will produce approximately 5,000 lbs dry solids per day under average conditions
• Outline of major decisions• Class A or B Bio-Solids • Treatment method to meet Class A or B• Dewatering Method• Storage and/or disposal of final product
New Solids Process Flow Diagram
AeratedHolding Tanks Dryer Storage
SiloCentrifuge
Distribution or DisposalLandfill Daily CoverLandscapingNurseriesFarmsGeneral Public
DisposalLandfill
Construction
• $26,000,000 construction cost (50% BNR, 25% ENR)• Notice to proceed – 12/04• Liquid Processes Operational
• Oxidation Ditch – 10/06 (one train, limited controls)• Filter – 12/06 (no chemical addition until mid 1/07)
• Solids Processes Operational – 1/07• Substantial Completion – 3/07• Startup of Oxidation Ditch w/o seeding• Only one train available for > 50% flow• Limited controls due to sequencing of work