Page 1
ww.sciencedirect.com
b i o s y s t em s e n g i n e e r i n g 1 2 6 ( 2 0 1 4 ) 9 2e1 0 3
Available online at w
ScienceDirect
journal homepage: www.elsevier .com/locate/ issn/15375110
Research Paper
Design criteria for structural design of silage silowalls
Hans E. von Wachenfelt a,*, N. Christer Nilsson a, Goran I. €Ostergard b,N. Anders Olofsson b, J. Marie Karlsson b
a Swedish University of Agricultural Sciences, Department of Biosystem and technology, P.O.
Box 86, SE 230 53 Alnarp, Swedenb Abetong AB, Heidelberg Cement Group, PO Box 24, SE 351 03 V€axjo, Sweden
a r t i c l e i n f o
Article history:
Received 22 January 2014
Received in revised form
18 June 2014
Accepted 8 July 2014
Published online
Keywords:
Bunker silo
Wall
Silage
Pressure
Force
* Corresponding author.E-mail address: hans.von.wachenfelt@slu
http://dx.doi.org/10.1016/j.biosystemseng.2011537-5110/© 2014 IAgrE. Published by Elsevie
Existing Swedish design guidelines (JBR) cover silo wall heights up to about 3 m. These
guidelinespresumably overestimate the forces andpressures exerted by silage juicewhensilo
walls aremore than 3mhigh, which could result in over-sizing,material waste and increased
capital costs. This study determined silage physical properties in terms of horizontal wall
pressure and evaluated silage juice levels in silos with a wall height of 3 m ormore.
Wall pressure was measured by transducers mounted on a steel ladder rack placed
vertically along the internal silo wall. The ladder rack also permitted measurement of
silage juice levels in slotted steel pipes. The pressure on the transducers was recorded by a
data acquisition system displaying static and total loads (pressures imposed by silage
material without and with the compaction machine, respectively).
The static pressure at the bottom of the silo wall (4 m) was 16 kPa during filling and
compaction, and 22 kPa 1e4 months after filling. The silage juice did not interact with
compaction. The wall pressure increased by 30% after filling, but the increase was only
significant at 1 m from the silo bottom. The dynamic load was 17 kPa when the compaction
machine passed 0.1 m from the silo wall.
New guidelines are proposed based on the results and on the Eurocode for ultimate
limit states (ULS) for two stages; filling and the utility period. The design bending moment
for ULS was 21% lower than specified in JBR.
© 2014 IAgrE. Published by Elsevier Ltd. All rights reserved.
1. Introduction
1.1. Problem description
There is growing interest among farmers in increasing their
local production of animal feed since this can reduce trans-
port and therefore the climate carbon footprint. A large
.se (H.E. von Wachenfelt4.07.007r Ltd. All rights reserved
amount of the roughage used by Swedish livestock is silage
based on grass and maize, which is stored in bunker silos. A
typical bunker silo consists of a concrete slab and in-situ or
precast concrete or wood wall panels. In the past bunker wall
height in Sweden were typically 2e3 m, but in recent years
bunker silos with wall heights of 4 m or higher have become
more common. Investment in bunker silos has doubled in
Sweden during the last 10 years.
).
.
Page 2
Nomenclature
Bunker silo A silo consisting of a concrete slab and in-situ
or precast concrete or wood wall panels.
Hydrostatic load Load resulting from silage juice.
DM Silage dry matter (%), mainly depending on
moisture content, fibre content, forage chopping
length and processing.
Visco-elastic material Silage is a visco-elastic material,
conceptually consisting of masses,
springs and voids and liquid.
Horizontal pressure (q) Horizontal forces acting on a silo
wall (Nm�2 or Pa).
TE Silage surface top edge.
z z is the distance from compacted surface top edge
(TE) to the level where the pressure is to be
calculated (m).
Point load (F) Load concentration in one point (N).
ULS Ultimate limit states according to Eurocode 0, see
Table 1.
j Combination factor, j, which reduce the design
values of variable loads when they act together,
j¼0�1.0.
gd For ULS design using the partial factor method of
EN 1990 to EN 1999, the safety class for a structural
element is taken into consideration by using the
partial factor gd as follows: safety class 1�3,
gd¼0.83�1.0.
Compaction vehicle Usually a farm tractor used for silage
compaction in the silo.
Qtot Pressure sensors recording of the load against the
silo wall when a compaction machine is passing
(Pa).
Qstat Wall load recordedwithout a compactionmachine
in the vicinity (Pa).
Qdyn Dynamic load from the compaction machine:
Qdyn¼QtoteQstat (Pa).
Dead load Vehicle self-weight (N).
b i o s y s t em s e n g i n e e r i n g 1 2 6 ( 2 0 1 4 ) 9 2e1 0 3 93
The structural design of silo walls is based on the hori-
zontal loads exerted by the silage during silo filling and stor-
age. The hydrostatic load from the silage juice also has to be
considered. The magnitude of this latter load is entirely
dependent on the level to which the silage juice rises in the
silo. In the Swedish design guidelines, JBR (SJV, 1995), the silo
wall pressure exerted by the silage juice is taken to be the
corresponding pressure arising from having a similar amount
of water in the silo.
1.2. Literature and preliminary work
Although silage is no longer harvested in its unwilted form in
Sweden, as a result of location the silage juice levels can vary
considerably between cuts within the same farm. Variations
in silage dry matter (DM) at harvest are probably higher in
Scandinavia than in the rest of Europe because there can be
more precipitation in periods with lower temperatures, mak-
ing forage drying slower, especially in autumn (Savoie, Amyot,
& Thriault, 2002).
A number of factors determine the density of DM and thus
the amount of silage juice. Factors include: moisture content,
fibre content, forage chopping length and processing, but DM
level is mainly dependent on the moisture content of the crop
at harvest (Savoie et al., 2002; Schemel, Furll, & Hoffmann,
2010; Stewart & McCullough, 1974).
According to O'Donnell (1993), silage juice level and flow
are completely dependent on the silo construction and
drainage system. Factors that determine the drainage flow
from the silo are the pressure within the silo, material
permeability and whether a proper drainage system is
installed. A typical amount of silage juice from grass silage at
18% DM is 150 l t�1 (Stewart & McCullough, 1974), whereas
bunker grass silage with DM � 30% produces very little or no
silage juice (Bastiman, 1976).
Silage is a visco-elastic material (Tang, Jofriet, & LeLievre,
1987b), conceptually consisting of masses, springs and voids
and liquid. The spring properties depend upon the type of
silage material. The voids in the silage can be divided into two
categories, macro andmicro voids. Macro voids are the spaces
between cut fibres, while micro voids consist of the cellular
structure of the plant material, where the moisture is mainly
contained. Under load, the micro voids become too small to
contain the liquid and it starts to be expelled as free liquid. If
the DM is lower than 35%, the silage in the lower part of the
silo is likely to become saturated, resulting in silage juice
(Tang, Jofriet, & LeLievre, 1987a). The expelled juice usually
seeps through the silage and drains out of the silo, causing
nutrient losses and environmental problems (Tang et al.,
1987b). The estimated level of silage juice in a silo is of crit-
ical importance for its design; the amount of building mate-
rials required in the structural design of the walls and their
attachment to the concrete slab.
The Swedish guidelines are based on extremely high loads
compared with international design guidelines (Fig. 1) and
research findings (Gruyaert, De Belie, Matthys, Van Nuffel, &
Sonck, 2007; Kangro, 1986; LBS, 1983; Martens, 1993; Negi &
Jofriet, 1986; Nilsson, 1982; SJV, 1995; Van Nuffel, Vangeyte,
Baert, Maertens, & Sonck, 2008). In ASABE (2008), the design
loads do not include hydrostatic load, but they do include the
mass bulk density of the silage as a factor in the silo wall
pressure calculations. Silage pressure normal to the wall is
determined as an equivalent-liquid pressure (Zhao & Jofriet,
1991, 1992). However, it can be assumed that the design
loads of today are different from these assumptions since
different types of silage and heavier compactionmachines are
being used.
A preliminary investigation showed that Swedish guide-
lines (SJV, 1995) specified higher design loads than interna-
tional guidelines for silo wall heights of 2 m or more. For
example, for a silo wall height of 4 m, the design load in the
guidelines is approximately twice that stated in other sources.
At present, work is underway at the Swedish Standards
Institute (SIS) to revise the standard on bunker silos and the
Page 3
b i o s y s t em s e n g i n e e r i n g 1 2 6 ( 2 0 1 4 ) 9 2e1 0 394
guidelines on bunker silo design. For this work, new sup-
porting data are needed. Altogether, the current evidence in-
dicates that the Swedish design guidelines are incorrect, e.g.
the actual pressure from the silage juice is probably consid-
erably lower. More exact and reliable values need to be
determined using field measurements.
1.3. Existing building codes related to bunker silo design
The present Swedish design guidelines, LALT (LBS, 1983) and
JBR (SJV, 1995), were developed for bunker silos of up to 3 m
height. With increasing wall height they are no longer appli-
cable, but they are still used in the absence of other relevant
design guidelines.
These guidelines specify a load fromthe silage itself, but also
a pressure from silage juice corresponding to a water column
level of 1.5mbelow themaximumsilage filling level. This silage
juice level is based on measurements by Kangro (1986) carried
out duringfilling of a silowithawall height of 2m.However, the
validity of thesemeasurements can be questioned. The effect of
this extra load is less important with lower wall height, but at
4 m or more the over-dimensioning can be considerable since
practical experience has shown that the extra pressure from
silage juice appears to be overestimated. The outflow of silage
juice does not appear to be of the order assumed since unwilted
silage is no longer harvested in Sweden.
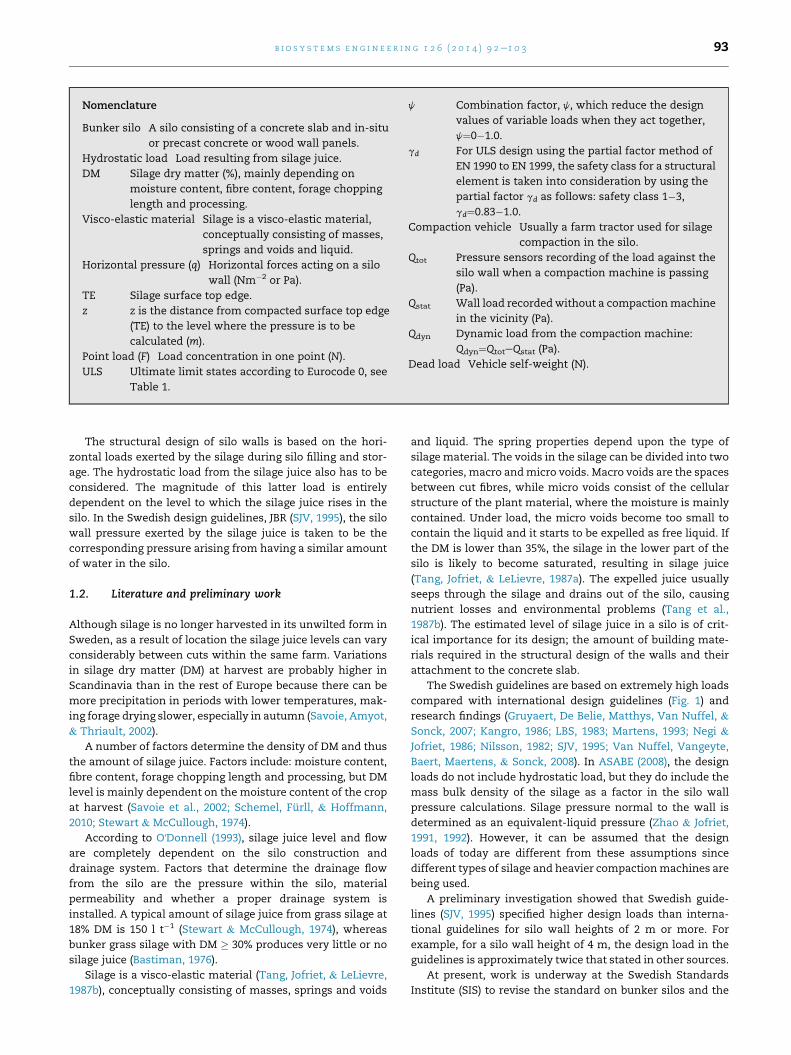
According to JBR (SJV, 1995) the following equations apply:
Horizontal pressure, qhk on the silo wall (variable load with
j ¼ 1.0).
qhk ¼ 7:5þ 2:5*z kNm�2 for 0< z< z0qhk ¼ 7:5þ 2:5*zþ 7:5 z� z0ð Þ kNm�2 for z0 < z< 4 m
where
z is the distance from compacted surface top edge (TE) to
the level where the pressure is to be calculated, and
z0 is the distance from compacted surface TE to the
maximum silage juice level. The normal silage juice level is
Fig. 1 e Current JBR guideline (SJV, 1995) compared with
other guidelines and recommendations for silo wall load.
The vertical axis (z) represents the distance below the
silage top surface and the horizontal axis (qh) the
horizontal pressure on the silo wall given in different
guidelines.
regarded as being 1.5 m below TE for silos without a
drainage system.
In addition, two point loads caused by the compaction
machine should be considered, each amounting to 0.1 � T kN,
or at least 6 kN, where T is the total weight of the compaction
machine. These point loads are assumed to act at level
z ¼ 0.6 m below TE with a centre-to-centre distance of 2.5 m
(SJV, 1995). The point loads are regarded as variable, with j¼ 0.
Eurocode design guidelines (Eurocode, 2010) define four
different ultimate limit states (ULS), which must be verified
when relevant to the situation in question (Table 1).
1.3.1. Loads and load combinationsThe compaction machine is regarded as a variable load with a
combination factor j0 ¼ 1.0.
Pressure from soil on the bunker silo wall is regarded as a
permanent geotechnical load.
Load from a vehicle outside the silo is regarded as a vari-
able geotechnical load.
AccordingtoEKS8 (Boverket, 2011), thecalculation ismade in
safety class1 (gd¼ 0.83; i.e.minor riskof seriouspersonal injury).
1.3.2. Filled silo with soil pressureUsing the Eurocode for ULS (Table 1), a load combination of
structure and geo stability (STR/GEO), set B, equations 6:10a
and 6:10b must be complied with, using soil pressure ac-
cording to STR/GEO and equation 6:10 set C (favourable value)
(Eurocode, 2010). Possible vehicular traffic outside the silo
should also be considered.
1.3.3. Empty silo with soil pressureAgain, using the load combination STR/GEO, set B, equations
6:10a and 6:10b must be complied with, with soil pressure
according to STR/GEO and equation 6:10 set C (unfavourable
value) (Eurocode, 2010). Possible vehicular traffic outside the
silo should also be considered.
1.4. Aims and objectives
The overall aim of this study was to provide data to support
new guidelines on designing bunker silo walls suitable for on-
farm storage of silage at an economical price for the farmer.
Specific objectives were to determine silage physical
properties of importance for the horizontal wall pressure and
evaluate the maximum silage juice level in silos with a wall
height of 3 m or more. The data obtained were intended to
form a basis for new national design guidelines and a revised
Swedish standard. The ultimate goal was to lower the in-
vestment costs for silage bunker silos. The starting hypothesis
was that the existing design guidelines overestimate the loads
originating from silage and silage juice.
2. Materials and methods
2.1. Measuring system
The measuring system consisted of two ladder racks, each
with four pressure sensors. Thesewere placed vertically along
Page 4
Table 1 e Ultimate limit states (ULS) according to Eurocode 0 (Eurocode, 2010).
Terms in Eurocode 0 Description
EQU (Equilibrium) Loss of equilibrium of the structure (or part of it), considered as a
rigid body.
STR (Structure) Interior failure or deformation of the structure (or part of it),
where the material strength is decisive.
GEO (Geo stability) Failure or excessive deformation in supports and foundations,
where strength of earth or rock is decisive.
FAT (Fatigue) Failure caused by fatigue of the structure (or part of it).
b i o s y s t em s e n g i n e e r i n g 1 2 6 ( 2 0 1 4 ) 9 2e1 0 3 95
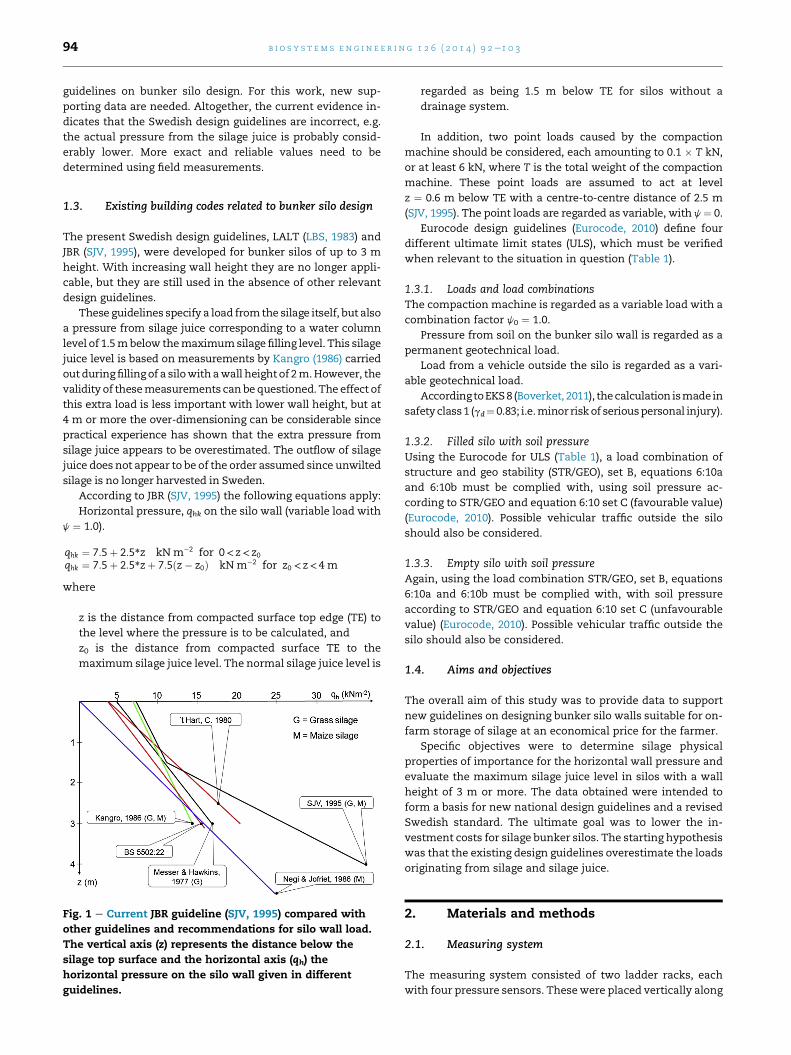
the internal face of the silo wall from the bottom to the top.
The load sensors (FSR A401, TEKSCAN Inc., Boston, USA) were
less than 1 mm thick and were mounted on the rack at a
spacing of 1.0 m, with the first sensor at 0.05 m from the silo
bottom (Fig. 2).
The sensors were individually connected to an amplifier
and a computer-based measuring programme (DataLink type
NOS. DLK 900, Biometrics Ltd, Gwent, UK), from which the
data were imported to Microsoft Excel. The system recording
rate was 0.1 Hz and the pressure range was 0e34 kPa.
2.2. Calibration
Each sensor was calibrated individually by a standardised 5
PSI 1800 � 2000 bladder (PB5B, TEKSCAN Inc., Boston, USA) with
load increasing step-wise from zero to 28 kPa. A calibration
equation was determined for each sensor. To protect them
from the corrosive effects of silage juice, the sensor cable
connections were sealed with silicone. Malfunction of sensors
due to silage juice has been reported by Kangro (1986) and
Zhao and Jofriet (1991). After sealing, the sensor was cali-
brated again before being mounted on the ladder rack. The
sensorwas then attached, with adhesive tape on both sides, to
the flat steel part of the ladder. The sensor connection and
cable were also fastened using tape (Fig. 2).
2.3. Measurement procedure
Information concerning the distance from the wheel to the
silo wall, and direction of travel, were obtained from the driver
of the compaction machine through a signal when starting to
compact the silage close to the silo wall and during track-by-
Fig. 2 e a) Bottom sensor mounted on the measuring rack with a
sensors was loaded at different pressures.
track compaction between the silo walls. The tracks were
recorded with information on place, time, starting point dis-
tance to the silo wall, silage height, type of compaction ma-
chine and number of tracks, following the procedure
described by Kangro (1986). To provide an explanation of the
wall pressure and silage juice level, the method of compac-
tion, weight and tyre width of the compaction machine and
silo packing procedures were recorded alongside these mea-
surements. Fibre type and silage chop length information
were obtained from the farmers. Silage DM content was ob-
tained from silage analysis. Fibre type and silage chop length
did not differ between farms and thesewere therefore omitted
from the analysis.
A measurement sequence started by measuring the static
load from the silage. Thereafter, the number of tracks by the
compaction machine was recorded and at the end of the
process the static loadwasmeasured again. The criterion for a
successful measurement sequence was that the static load at
the start and the finish should have the same value (Kangro,
1986).
2.4. Experiment design
The combined silage juice level and silage wall pressure pro-
file measurements were performed during the 1st to 4th har-
vests of wilted grass and maize silage. These measurements
were conducted in bunker silos with no drainage system and a
wall height of 3e4 m, on farms in the Swedish provinces of
V€astergotland, Skane and €Oland (Table 2).
The silage juice level was determined using a measuring
stick, measuring the juice level inside slotted 16-mm steel
pipes placed vertically along the silo walls as single pipes, or
slotted pipe to the left. b) calibration bladder by which the
Page 5
Table 2 e Dimensions of the silos from which the silage juice level and silo wall pressure measurements were conductedduring two seasons.
Silo dimensions Boras Falkoping Klippan Skurup Svalov Varberg €Oland €Onnestad
Length, m 30 30 42 15 15 42 30 12
Width, m 12 12 10 6 6 10 12 6
Height, m 4 4 4 3 3 3 3 2
b i o s y s t em s e n g i n e e r i n g 1 2 6 ( 2 0 1 4 ) 9 2e1 0 396
as part of a steel ladder rack (Fig. 3). The measurements were
performed during two harvesting seasons. In the first season,
themeasurements were conducted by farmers during the first
14 d after filling in 14 silos using six evenly distributed pipes in
each silo. In the second season, the measurements were
conducted monthly by the researchers in 10 silos during 1e4
months after filling, depending on harvest date, using two
pipes and two ladder racks. By combining data on silage juice
level and silage wall pressure during a longer period of time
after harvest, changes in wall pressure could be studied over
time. To examine the correlation between silage juice and
silage DM, a regression calculation was performed in Mini-
tab™ (Minitab, 2007).
The vertically-placed pressure sensors recorded the static
load against the silo wall at different levels, both during filling
and afterwards. The total load from the silage material and
from the passing compaction vehicle (usually a farm tractor)
was recorded by the pressure sensors at different levels during
silo filling.
The load (Q) recorded when the compaction machine was
passing was designated total load (Qtot) and the load recorded
without the compaction machine in the vicinity was desig-
nated static load (Qstat). The extra (dynamic) load from the
compaction machine (Qdyn) was thus: Qdyn ¼ Qtot � Qstat.
The silos were filled with silage in layers of approximately
0.25 m at a time, distributed over half the silo surface. The
material was compacted by driving the compaction machine
track-by-track across the surface 2e4 times for every new
silage layer. A series ofmeasurementswas conducted for each
silage layer at filling. During each series, Qstat and Qtot values
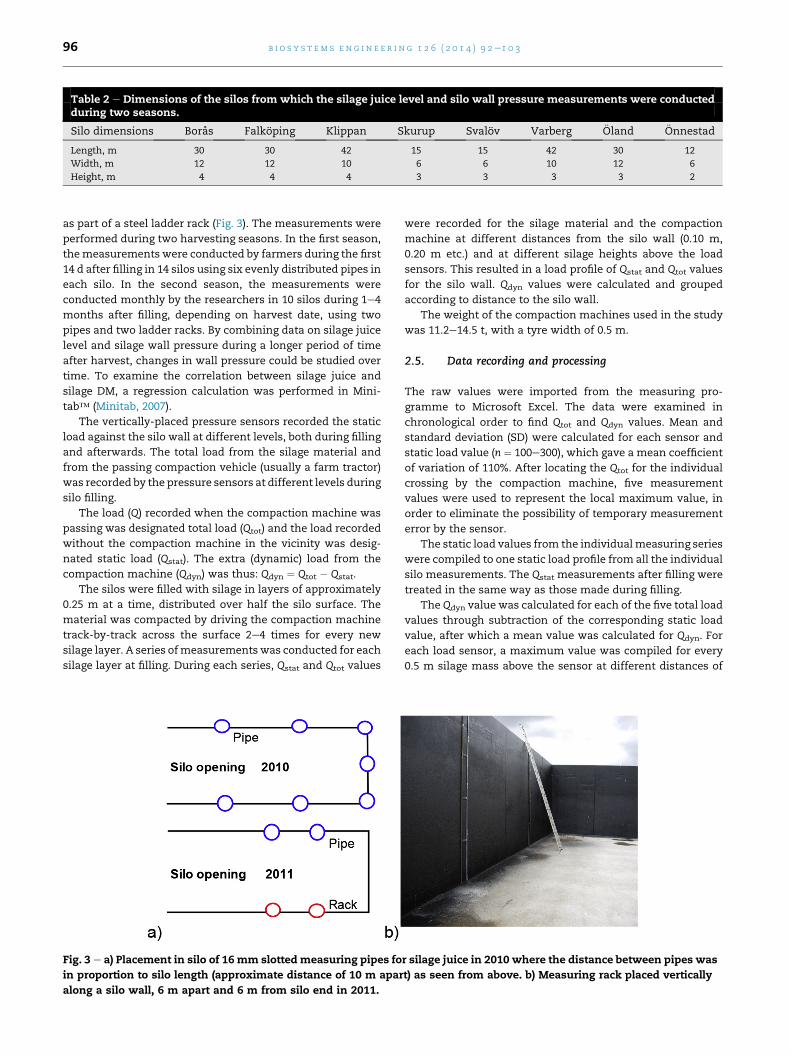
Fig. 3 e a) Placement in silo of 16 mm slotted measuring pipes fo
in proportion to silo length (approximate distance of 10 m apar
along a silo wall, 6 m apart and 6 m from silo end in 2011.
were recorded for the silage material and the compaction
machine at different distances from the silo wall (0.10 m,
0.20 m etc.) and at different silage heights above the load
sensors. This resulted in a load profile of Qstat and Qtot values
for the silo wall. Qdyn values were calculated and grouped
according to distance to the silo wall.
The weight of the compaction machines used in the study
was 11.2e14.5 t, with a tyre width of 0.5 m.
2.5. Data recording and processing
The raw values were imported from the measuring pro-
gramme to Microsoft Excel. The data were examined in
chronological order to find Qtot and Qdyn values. Mean and
standard deviation (SD) were calculated for each sensor and
static load value (n ¼ 100e300), which gave a mean coefficient
of variation of 110%. After locating the Qtot for the individual
crossing by the compaction machine, five measurement
values were used to represent the local maximum value, in
order to eliminate the possibility of temporary measurement
error by the sensor.
The static load values from the individualmeasuring series
were compiled to one static load profile from all the individual
silo measurements. The Qstat measurements after filling were
treated in the same way as those made during filling.
The Qdyn value was calculated for each of the five total load
values through subtraction of the corresponding static load
value, after which a mean value was calculated for Qdyn. For
each load sensor, a maximum value was compiled for every
0.5 m silage mass above the sensor at different distances of
r silage juice in 2010 where the distance between pipes was
t) as seen from above. b) Measuring rack placed vertically
Page 6
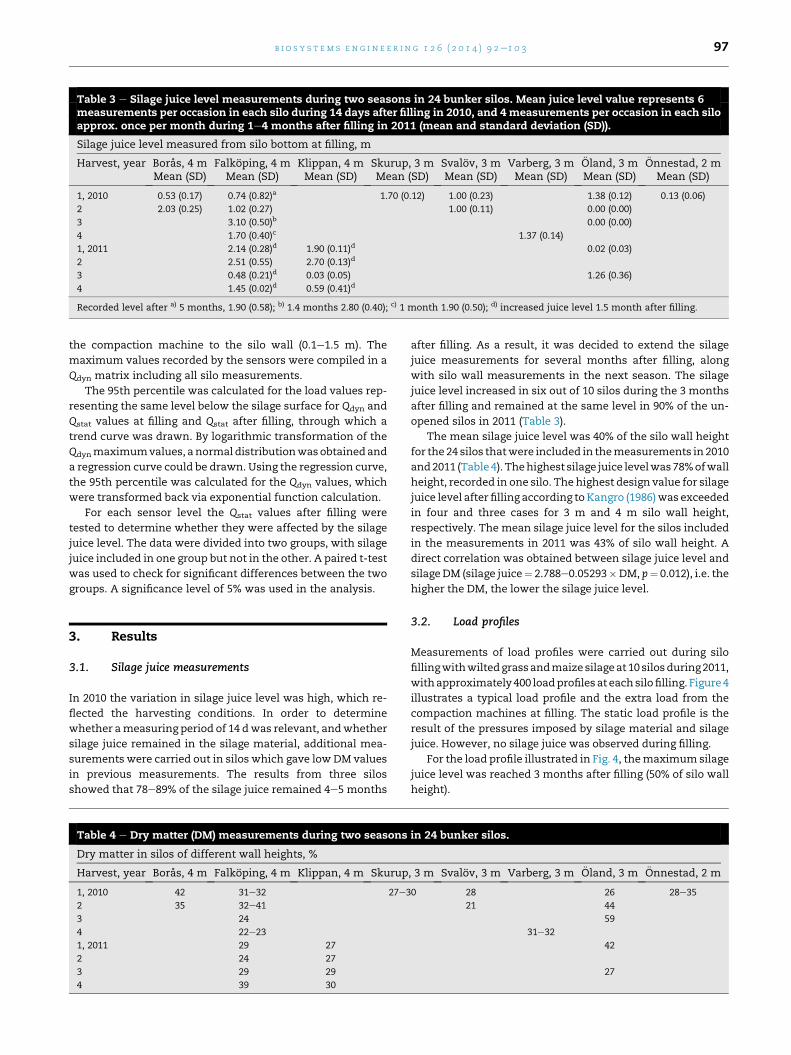
Table 3 e Silage juice level measurements during two seasons in 24 bunker silos. Mean juice level value represents 6measurements per occasion in each silo during 14 days after filling in 2010, and 4 measurements per occasion in each siloapprox. once per month during 1e4 months after filling in 2011 (mean and standard deviation (SD)).
Silage juice level measured from silo bottom at filling, m
Harvest, year Boras, 4 mMean (SD)
Falkoping, 4 mMean (SD)
Klippan, 4 mMean (SD)
Skurup, 3 mMean (SD)
Svalov, 3 mMean (SD)
Varberg, 3 mMean (SD)
€Oland, 3 mMean (SD)
€Onnestad, 2 mMean (SD)
1, 2010 0.53 (0.17) 0.74 (0.82)a 1.70 (0.12) 1.00 (0.23) 1.38 (0.12) 0.13 (0.06)
2 2.03 (0.25) 1.02 (0.27) 1.00 (0.11) 0.00 (0.00)
3 3.10 (0.50)b 0.00 (0.00)
4 1.70 (0.40)c 1.37 (0.14)
1, 2011 2.14 (0.28)d 1.90 (0.11)d 0.02 (0.03)
2 2.51 (0.55) 2.70 (0.13)d
3 0.48 (0.21)d 0.03 (0.05) 1.26 (0.36)
4 1.45 (0.02)d 0.59 (0.41)d
Recorded level after a) 5 months, 1.90 (0.58); b) 1.4 months 2.80 (0.40); c) 1 month 1.90 (0.50); d) increased juice level 1.5 month after filling.
b i o s y s t em s e n g i n e e r i n g 1 2 6 ( 2 0 1 4 ) 9 2e1 0 3 97
the compaction machine to the silo wall (0.1e1.5 m). The
maximum values recorded by the sensors were compiled in a
Qdyn matrix including all silo measurements.
The 95th percentile was calculated for the load values rep-
resenting the same level below the silage surface for Qdyn and
Qstat values at filling and Qstat after filling, through which a
trend curve was drawn. By logarithmic transformation of the
Qdynmaximumvalues, a normaldistributionwasobtainedand
a regression curve could be drawn. Using the regression curve,
the 95th percentile was calculated for the Qdyn values, which
were transformed back via exponential function calculation.
For each sensor level the Qstat values after filling were
tested to determine whether they were affected by the silage
juice level. The data were divided into two groups, with silage
juice included in one group but not in the other. A paired t-test
was used to check for significant differences between the two
groups. A significance level of 5% was used in the analysis.
3. Results
3.1. Silage juice measurements
In 2010 the variation in silage juice level was high, which re-
flected the harvesting conditions. In order to determine
whether ameasuring period of 14 dwas relevant, andwhether
silage juice remained in the silage material, additional mea-
surements were carried out in silos which gave low DM values
in previous measurements. The results from three silos
showed that 78e89% of the silage juice remained 4e5 months
Table 4 e Dry matter (DM) measurements during two seasons
Dry matter in silos of different wall heights, %
Harvest, year Boras, 4 m Falkoping, 4 m Klippan, 4 m Skurup
1, 2010 42 31e32 27e3
2 35 32e41
3 24
4 22e23
1, 2011 29 27
2 24 27
3 29 29
4 39 30
after filling. As a result, it was decided to extend the silage
juice measurements for several months after filling, along
with silo wall measurements in the next season. The silage
juice level increased in six out of 10 silos during the 3 months
after filling and remained at the same level in 90% of the un-
opened silos in 2011 (Table 3).
The mean silage juice level was 40% of the silo wall height
for the 24 silos thatwere included in themeasurements in 2010
and2011 (Table 4). Thehighest silage juice levelwas78%ofwall
height, recorded in one silo. The highest design value for silage
juice level after filling according to Kangro (1986)was exceeded
in four and three cases for 3 m and 4 m silo wall height,
respectively. The mean silage juice level for the silos included
in the measurements in 2011 was 43% of silo wall height. A
direct correlation was obtained between silage juice level and
silageDM (silage juice¼ 2.788e0.05293�DM, p¼ 0.012), i.e. the
higher the DM, the lower the silage juice level.
3.2. Load profiles
Measurements of load profiles were carried out during silo
fillingwithwiltedgrassandmaize silageat 10 silosduring2011,
withapproximately 400 loadprofilesat each silofilling. Figure4
illustrates a typical load profile and the extra load from the
compaction machines at filling. The static load profile is the
result of the pressures imposed by silage material and silage
juice. However, no silage juice was observed during filling.
For the load profile illustrated in Fig. 4, themaximumsilage
juice level was reached 3 months after filling (50% of silo wall
height).
in 24 bunker silos.
, 3 m Svalov, 3 m Varberg, 3 m €Oland, 3 m €Onnestad, 2 m
0 28 26 28e35
21 44
59
31e32
42
27
Page 7
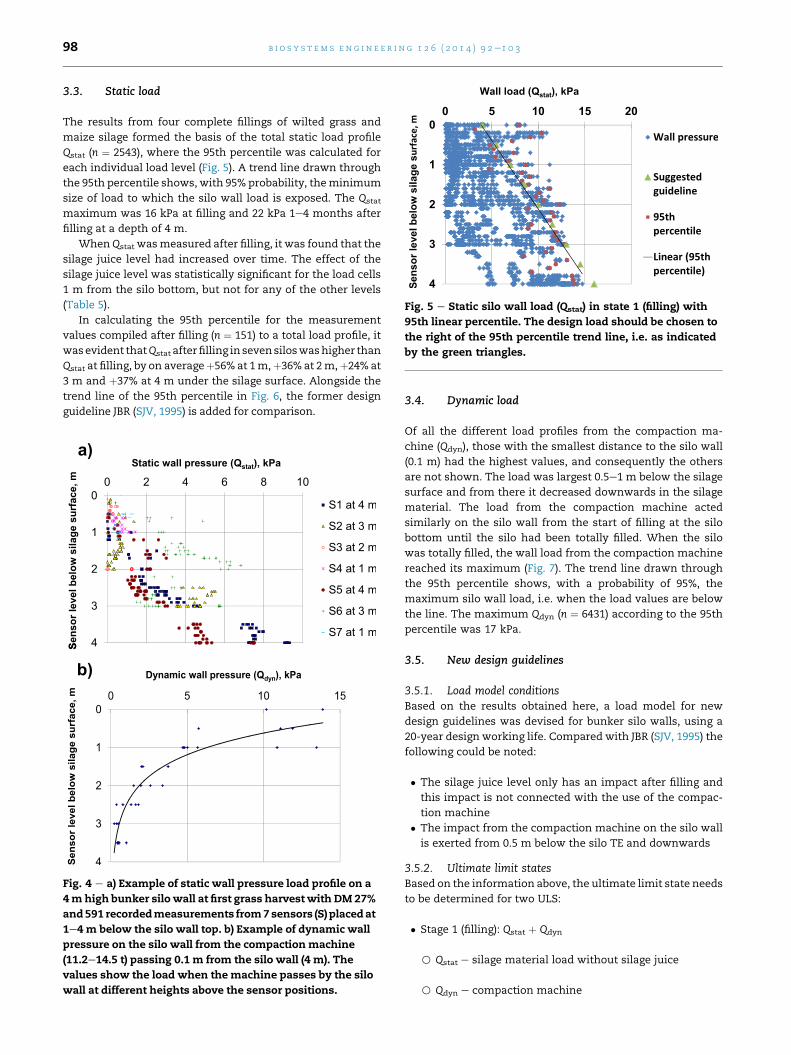
Fig. 5 e Static silo wall load (Qstat) in state 1 (filling) with
95th linear percentile. The design load should be chosen to
the right of the 95th percentile trend line, i.e. as indicated
by the green triangles.
b i o s y s t em s e n g i n e e r i n g 1 2 6 ( 2 0 1 4 ) 9 2e1 0 398
3.3. Static load
The results from four complete fillings of wilted grass and
maize silage formed the basis of the total static load profile
Qstat (n ¼ 2543), where the 95th percentile was calculated for
each individual load level (Fig. 5). A trend line drawn through
the 95th percentile shows, with 95% probability, theminimum
size of load to which the silo wall load is exposed. The Qstat
maximum was 16 kPa at filling and 22 kPa 1e4 months after
filling at a depth of 4 m.
WhenQstat wasmeasured after filling, it was found that the
silage juice level had increased over time. The effect of the
silage juice level was statistically significant for the load cells
1 m from the silo bottom, but not for any of the other levels
(Table 5).
In calculating the 95th percentile for the measurement
values compiled after filling (n ¼ 151) to a total load profile, it
wasevident thatQstat after filling in sevensiloswashigher than
Qstat at filling, by on averageþ56% at 1m,þ36% at 2m,þ24% at
3 m and þ37% at 4 m under the silage surface. Alongside the
trend line of the 95th percentile in Fig. 6, the former design
guideline JBR (SJV, 1995) is added for comparison.
S
Fig. 4 e a) Example of static wall pressure load profile on a
4mhigh bunker silo wall at first grass harvest with DM 27%
and591 recordedmeasurements from7sensors (S) placedat
1e4 m below the silo wall top. b) Example of dynamic wall
pressure on the silo wall from the compactionmachine
(11.2e14.5 t) passing 0.1 m from the silo wall (4 m). The
values show the load when the machine passes by the silo
wall at different heights above the sensor positions.
3.4. Dynamic load
Of all the different load profiles from the compaction ma-
chine (Qdyn), those with the smallest distance to the silo wall
(0.1 m) had the highest values, and consequently the others
are not shown. The load was largest 0.5e1 m below the silage
surface and from there it decreased downwards in the silage
material. The load from the compaction machine acted
similarly on the silo wall from the start of filling at the silo
bottom until the silo had been totally filled. When the silo
was totally filled, the wall load from the compaction machine
reached its maximum (Fig. 7). The trend line drawn through
the 95th percentile shows, with a probability of 95%, the
maximum silo wall load, i.e. when the load values are below
the line. The maximum Qdyn (n ¼ 6431) according to the 95th
percentile was 17 kPa.
3.5. New design guidelines
3.5.1. Load model conditionsBased on the results obtained here, a load model for new
design guidelines was devised for bunker silo walls, using a
20-year design working life. Compared with JBR (SJV, 1995) the
following could be noted:
� The silage juice level only has an impact after filling and
this impact is not connected with the use of the compac-
tion machine
� The impact from the compaction machine on the silo wall
is exerted from 0.5 m below the silo TE and downwards
3.5.2. Ultimate limit statesBased on the information above, the ultimate limit state needs
to be determined for two ULS:
� Stage 1 (filling): Qstat þ Qdyn
B Qstat e silage material load without silage juice
B Qdyn e compaction machine
Page 8
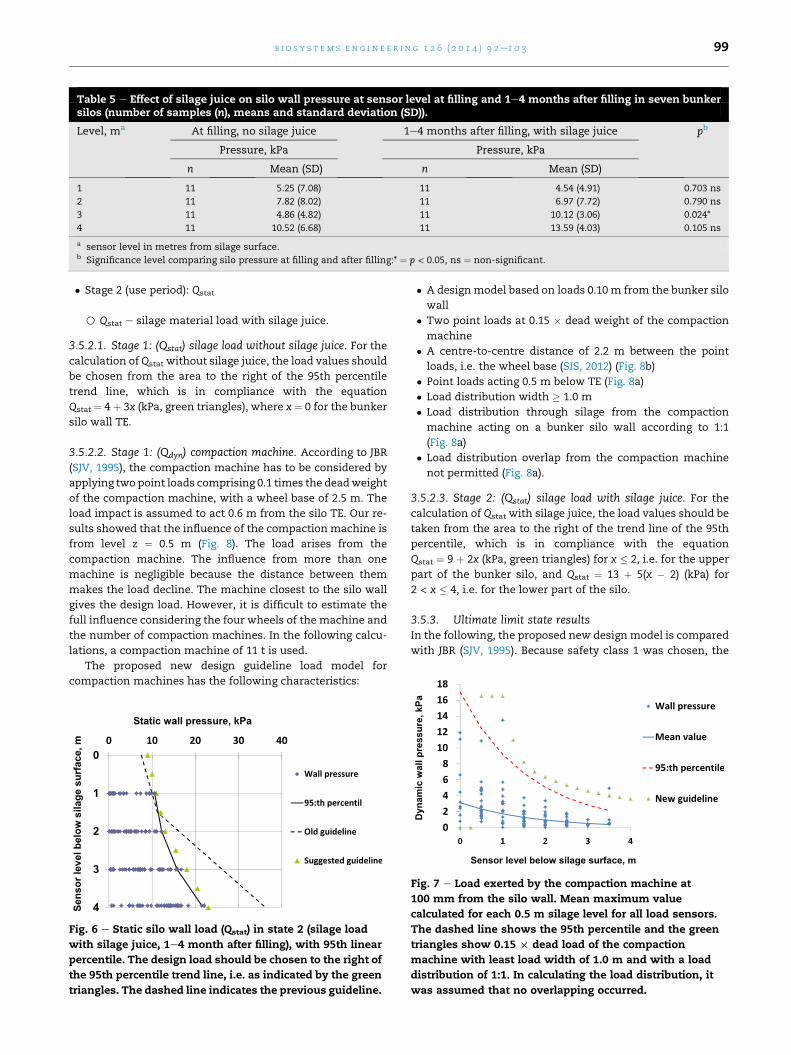
Table 5 e Effect of silage juice on silo wall pressure at sensor level at filling and 1e4 months after filling in seven bunkersilos (number of samples (n), means and standard deviation (SD)).
Level, ma At filling, no silage juice 1e4 months after filling, with silage juice pb
Pressure, kPa Pressure, kPa
n Mean (SD) n Mean (SD)
1 11 5.25 (7.08) 11 4.54 (4.91) 0.703 ns
2 11 7.82 (8.02) 11 6.97 (7.72) 0.790 ns
3 11 4.86 (4.82) 11 10.12 (3.06) 0.024*
4 11 10.52 (6.68) 11 13.59 (4.03) 0.105 ns
a sensor level in metres from silage surface.b Significance level comparing silo pressure at filling and after filling:* ¼ p < 0.05, ns ¼ non-significant.
b i o s y s t em s e n g i n e e r i n g 1 2 6 ( 2 0 1 4 ) 9 2e1 0 3 99
� Stage 2 (use period): Qstat
B Qstat e silage material load with silage juice.
3.5.2.1. Stage 1: (Qstat) silage load without silage juice. For thecalculation of Qstat without silage juice, the load values should
be chosen from the area to the right of the 95th percentile
trend line, which is in compliance with the equation
Qstat ¼ 4 þ 3x (kPa, green triangles), where x ¼ 0 for the bunker
silo wall TE.
3.5.2.2. Stage 1: (Qdyn) compaction machine. According to JBR
(SJV, 1995), the compaction machine has to be considered by
applying two point loads comprising 0.1 times the deadweight
of the compaction machine, with a wheel base of 2.5 m. The
load impact is assumed to act 0.6 m from the silo TE. Our re-
sults showed that the influence of the compaction machine is
from level z ¼ 0.5 m (Fig. 8). The load arises from the
compaction machine. The influence from more than one
machine is negligible because the distance between them
makes the load decline. The machine closest to the silo wall
gives the design load. However, it is difficult to estimate the
full influence considering the four wheels of the machine and
the number of compaction machines. In the following calcu-
lations, a compaction machine of 11 t is used.
The proposed new design guideline load model for
compaction machines has the following characteristics:
Fig. 6 e Static silo wall load (Qstat) in state 2 (silage load
with silage juice, 1e4 month after filling), with 95th linear
percentile. The design load should be chosen to the right of
the 95th percentile trend line, i.e. as indicated by the green
triangles. The dashed line indicates the previous guideline.
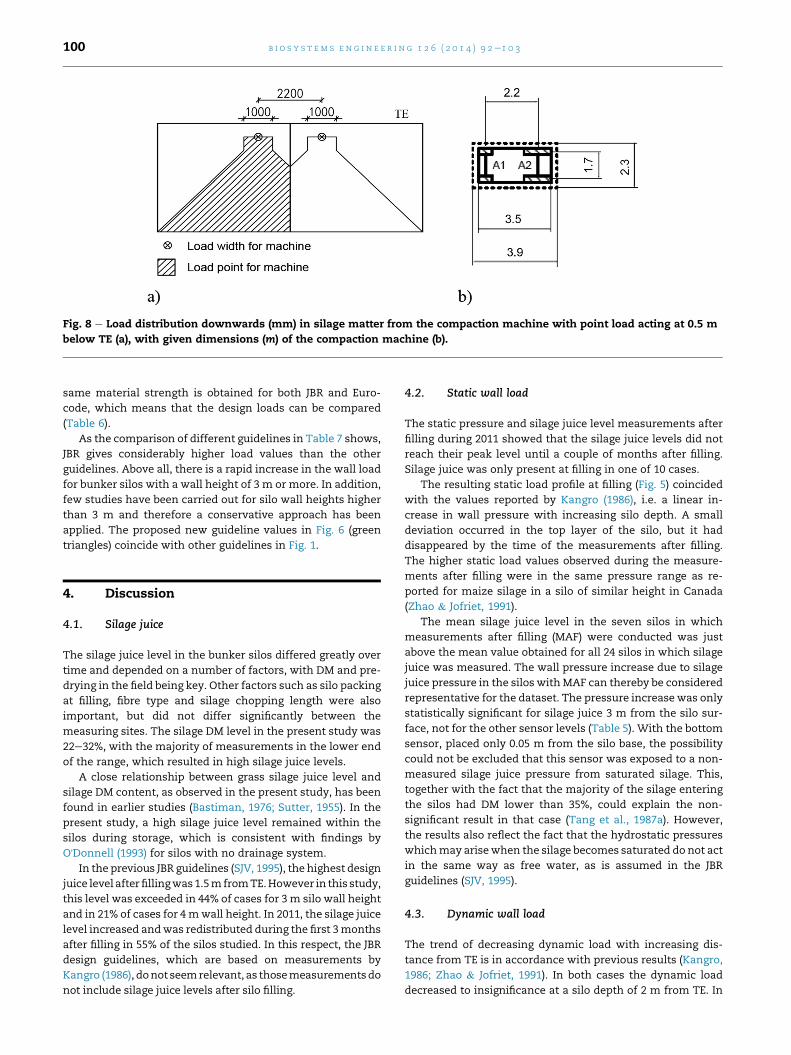
� A designmodel based on loads 0.10 m from the bunker silo
wall
� Two point loads at 0.15 � dead weight of the compaction
machine
� A centre-to-centre distance of 2.2 m between the point
loads, i.e. the wheel base (SIS, 2012) (Fig. 8b)
� Point loads acting 0.5 m below TE (Fig. 8a)
� Load distribution width � 1.0 m
� Load distribution through silage from the compaction
machine acting on a bunker silo wall according to 1:1
(Fig. 8a)
� Load distribution overlap from the compaction machine
not permitted (Fig. 8a).
3.5.2.3. Stage 2: (Qstat) silage load with silage juice. For the
calculation of Qstat with silage juice, the load values should be
taken from the area to the right of the trend line of the 95th
percentile, which is in compliance with the equation
Qstat ¼ 9 þ 2x (kPa, green triangles) for x � 2, i.e. for the upper
part of the bunker silo, and Qstat ¼ 13 þ 5(x � 2) (kPa) for
2 < x � 4, i.e. for the lower part of the silo.
3.5.3. Ultimate limit state resultsIn the following, the proposed new design model is compared
with JBR (SJV, 1995). Because safety class 1 was chosen, the
Fig. 7 e Load exerted by the compaction machine at
100 mm from the silo wall. Mean maximum value
calculated for each 0.5 m silage level for all load sensors.
The dashed line shows the 95th percentile and the green
triangles show 0.15 £ dead load of the compaction
machine with least load width of 1.0 m and with a load
distribution of 1:1. In calculating the load distribution, it
was assumed that no overlapping occurred.
Page 9
Fig. 8 e Load distribution downwards (mm) in silage matter from the compaction machine with point load acting at 0.5 m
below TE (a), with given dimensions (m) of the compaction machine (b).
b i o s y s t em s e n g i n e e r i n g 1 2 6 ( 2 0 1 4 ) 9 2e1 0 3100
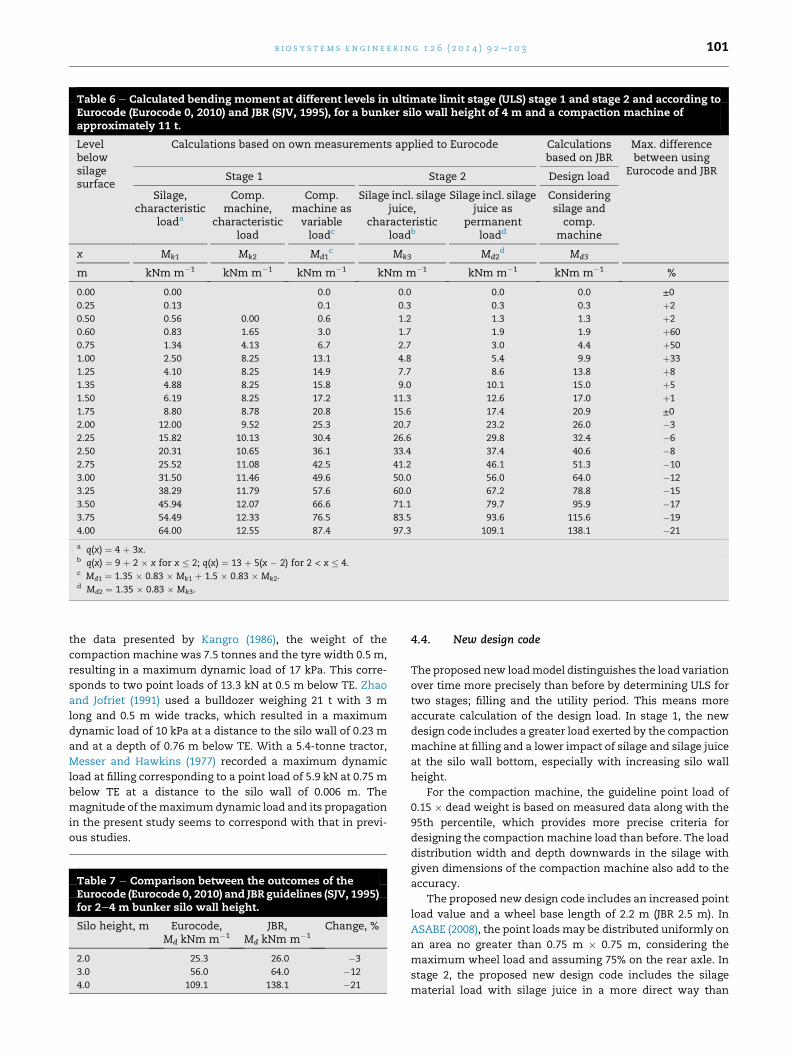
same material strength is obtained for both JBR and Euro-
code, which means that the design loads can be compared
(Table 6).
As the comparison of different guidelines in Table 7 shows,
JBR gives considerably higher load values than the other
guidelines. Above all, there is a rapid increase in the wall load
for bunker silos with a wall height of 3 m or more. In addition,
few studies have been carried out for silo wall heights higher
than 3 m and therefore a conservative approach has been
applied. The proposed new guideline values in Fig. 6 (green
triangles) coincide with other guidelines in Fig. 1.
4. Discussion
4.1. Silage juice
The silage juice level in the bunker silos differed greatly over
time and depended on a number of factors, with DM and pre-
drying in the field being key. Other factors such as silo packing
at filling, fibre type and silage chopping length were also
important, but did not differ significantly between the
measuring sites. The silage DM level in the present study was
22e32%, with the majority of measurements in the lower end
of the range, which resulted in high silage juice levels.
A close relationship between grass silage juice level and
silage DM content, as observed in the present study, has been
found in earlier studies (Bastiman, 1976; Sutter, 1955). In the
present study, a high silage juice level remained within the
silos during storage, which is consistent with findings by
O'Donnell (1993) for silos with no drainage system.
In the previous JBR guidelines (SJV, 1995), the highest design
juice level after fillingwas1.5mfromTE.However in this study,
this level was exceeded in 44% of cases for 3 m silo wall height
and in 21% of cases for 4mwall height. In 2011, the silage juice
level increased andwas redistributed during the first 3months
after filling in 55% of the silos studied. In this respect, the JBR
design guidelines, which are based on measurements by
Kangro (1986), donot seemrelevant, as thosemeasurementsdo
not include silage juice levels after silo filling.
4.2. Static wall load
The static pressure and silage juice level measurements after
filling during 2011 showed that the silage juice levels did not
reach their peak level until a couple of months after filling.
Silage juice was only present at filling in one of 10 cases.
The resulting static load profile at filling (Fig. 5) coincided
with the values reported by Kangro (1986), i.e. a linear in-
crease in wall pressure with increasing silo depth. A small
deviation occurred in the top layer of the silo, but it had
disappeared by the time of the measurements after filling.
The higher static load values observed during the measure-
ments after filling were in the same pressure range as re-
ported for maize silage in a silo of similar height in Canada
(Zhao & Jofriet, 1991).
The mean silage juice level in the seven silos in which
measurements after filling (MAF) were conducted was just
above the mean value obtained for all 24 silos in which silage
juice was measured. The wall pressure increase due to silage
juice pressure in the silos withMAF can thereby be considered
representative for the dataset. The pressure increase was only
statistically significant for silage juice 3 m from the silo sur-
face, not for the other sensor levels (Table 5). With the bottom
sensor, placed only 0.05 m from the silo base, the possibility
could not be excluded that this sensor was exposed to a non-
measured silage juice pressure from saturated silage. This,
together with the fact that the majority of the silage entering
the silos had DM lower than 35%, could explain the non-
significant result in that case (Tang et al., 1987a). However,
the results also reflect the fact that the hydrostatic pressures
whichmay arisewhen the silage becomes saturated do not act
in the same way as free water, as is assumed in the JBR
guidelines (SJV, 1995).
4.3. Dynamic wall load
The trend of decreasing dynamic load with increasing dis-
tance from TE is in accordance with previous results (Kangro,
1986; Zhao & Jofriet, 1991). In both cases the dynamic load
decreased to insignificance at a silo depth of 2 m from TE. In
Page 10
Table 6 e Calculated bending moment at different levels in ultimate limit stage (ULS) stage 1 and stage 2 and according toEurocode (Eurocode 0, 2010) and JBR (SJV, 1995), for a bunker silo wall height of 4 m and a compaction machine ofapproximately 11 t.
Levelbelowsilagesurface
Calculations based on own measurements applied to Eurocode Calculationsbased on JBR
Max. differencebetween using
Eurocode and JBRStage 1 Stage 2 Design load
Silage,characteristic
loada
Comp.machine,
characteristicload
Comp.machine asvariableloadc
Silage incl. silagejuice,
characteristicloadb
Silage incl. silagejuice as
permanentloadd
Consideringsilage andcomp.
machine
x Mk1 Mk2 Md1c Mk3 Md2
d Md3
m kNm m�1 kNm m�1 kNm m�1 kNm m�1 kNm m�1 kNm m�1 %
0.00 0.00 0.0 0.0 0.0 0.0 ±00.25 0.13 0.1 0.3 0.3 0.3 þ2
0.50 0.56 0.00 0.6 1.2 1.3 1.3 þ2
0.60 0.83 1.65 3.0 1.7 1.9 1.9 þ60
0.75 1.34 4.13 6.7 2.7 3.0 4.4 þ50
1.00 2.50 8.25 13.1 4.8 5.4 9.9 þ33
1.25 4.10 8.25 14.9 7.7 8.6 13.8 þ8
1.35 4.88 8.25 15.8 9.0 10.1 15.0 þ5
1.50 6.19 8.25 17.2 11.3 12.6 17.0 þ1
1.75 8.80 8.78 20.8 15.6 17.4 20.9 ±02.00 12.00 9.52 25.3 20.7 23.2 26.0 �3
2.25 15.82 10.13 30.4 26.6 29.8 32.4 �6
2.50 20.31 10.65 36.1 33.4 37.4 40.6 �8
2.75 25.52 11.08 42.5 41.2 46.1 51.3 �10
3.00 31.50 11.46 49.6 50.0 56.0 64.0 �12
3.25 38.29 11.79 57.6 60.0 67.2 78.8 �15
3.50 45.94 12.07 66.6 71.1 79.7 95.9 �17
3.75 54.49 12.33 76.5 83.5 93.6 115.6 �19
4.00 64.00 12.55 87.4 97.3 109.1 138.1 �21
a q(x) ¼ 4 þ 3x.b q(x) ¼ 9 þ 2 � x for x � 2; q(x) ¼ 13 þ 5(x � 2) for 2 < x � 4.c Md1 ¼ 1.35 � 0.83 � Mk1 þ 1.5 � 0.83 � Mk2.d Md2 ¼ 1.35 � 0.83 � Mk3.
b i o s y s t em s e n g i n e e r i n g 1 2 6 ( 2 0 1 4 ) 9 2e1 0 3 101
the data presented by Kangro (1986), the weight of the
compactionmachine was 7.5 tonnes and the tyre width 0.5 m,
resulting in a maximum dynamic load of 17 kPa. This corre-
sponds to two point loads of 13.3 kN at 0.5 m below TE. Zhao
and Jofriet (1991) used a bulldozer weighing 21 t with 3 m
long and 0.5 m wide tracks, which resulted in a maximum
dynamic load of 10 kPa at a distance to the silo wall of 0.23 m
and at a depth of 0.76 m below TE. With a 5.4-tonne tractor,
Messer and Hawkins (1977) recorded a maximum dynamic
load at filling corresponding to a point load of 5.9 kN at 0.75 m
below TE at a distance to the silo wall of 0.006 m. The
magnitude of themaximumdynamic load and its propagation
in the present study seems to correspond with that in previ-
ous studies.
Table 7 e Comparison between the outcomes of theEurocode (Eurocode 0, 2010) and JBR guidelines (SJV, 1995)for 2e4 m bunker silo wall height.
Silo height, m Eurocode,Md kNm m�1
JBR,Md kNm m�1
Change, %
2.0 25.3 26.0 �3
3.0 56.0 64.0 �12
4.0 109.1 138.1 �21
4.4. New design code
The proposed new loadmodel distinguishes the load variation
over time more precisely than before by determining ULS for
two stages; filling and the utility period. This means more
accurate calculation of the design load. In stage 1, the new
design code includes a greater load exerted by the compaction
machine at filling and a lower impact of silage and silage juice
at the silo wall bottom, especially with increasing silo wall
height.
For the compaction machine, the guideline point load of
0.15 � dead weight is based on measured data along with the
95th percentile, which provides more precise criteria for
designing the compactionmachine load than before. The load
distribution width and depth downwards in the silage with
given dimensions of the compaction machine also add to the
accuracy.
The proposed new design code includes an increased point
load value and a wheel base length of 2.2 m (JBR 2.5 m). In
ASABE (2008), the point loadsmay be distributed uniformly on
an area no greater than 0.75 m � 0.75 m, considering the
maximum wheel load and assuming 75% on the rear axle. In
stage 2, the proposed new design code includes the silage
material load with silage juice in a more direct way than
Page 11
b i o s y s t em s e n g i n e e r i n g 1 2 6 ( 2 0 1 4 ) 9 2e1 0 3102
ASABE (2008), where the standard design loads for bunker
silos do not include hydrostatic load, but the mass bulk den-
sity of the silage is included as a factor in the silo wall pressure
calculation.
5. Summary and conclusions
This study on silowall design evaluatedmaximum silage juice
levels, while the existing guidelines presumably overestimate
the forces arising from silage juice for silos with wall height
greater than 3 m.
The silage juice levels were measured by reading the level
on measuring sticks in slotted 16-mm pipes placed vertically
along the internal silo walls, or in one of the legs of a vertical
ladder rack. Measurements in wilted grass and maize were
carried out in 24 silos during two seasons, while pressure
profiles were measured during 10 cuts of wilted grass and
maize harvests in one season, with approximately 400 pres-
sure profiles per cut.
The pressure profile was measured by transducers moun-
ted on the vertical ladder rack, which sent recordings to a data
acquisition system displaying static load (pressures imposed
by silage material when the compaction machine was not
present) and total load (pressure exerted by silage material
plus the compaction machine passing in front of the trans-
ducer racks). The difference between static load and total load
was taken as the dynamic load.
The static silo wall (4 m) pressure was 16 kPa during
filling and compaction and 22 kPa at the silo bottom 1e4
months after filling. The hydrostatic pressures occurring
when the silage became saturated with silage juice did not
act as free water and the silage juice only had an effect after
filling and did not interact with compaction. The dynamic
load was approximately 17 kPa when the vehicle passed
0.1 m from the silo wall. The horizontal load acting on the
silo wall was greatest 0.5e1 m under the silage surface with
compaction machine tyre width 0.5 m and machine weight
11.2e14.5 t.
New guidelines are proposed here based on the results
obtained and the Eurocode for ultimate limit states (ULS).
The data indicated a need to determine the ULS for two
stages: 1 (filling): compaction machine and silage material
load without silage juice; and 2 (utility period): silage ma-
terial load with silage juice. The design bending moment for
ULS was found to be 21% lower than in the existing JBR
guidelines.
Acknowledgements
The authors gratefully acknowledge financial support from
the Swedish Farmers Accident Insurance Fund (V10-0050 &
V12-0039), Swedish Farmers' Foundation for Agricultural
Research (HO 941 285) and Alnarp Partnership (456) for the
research work reported in this paper. Special thanks to Anette
Knutsson, Patrik Lennwall and Thorbjorn Berg for supporting
our measurements, to Anders Prahl, Magnus Nilsson and to
Jan-Eric Englund for statistical advice.
r e f e r e n c e s
ASABE. (2008). Design loads for bunker (horizontal) silos. ASAEEP538.2 OCT2008.
Bastiman, B. (1976). Factors affecting silage effluent production.Experimental Husbandry, 31, 40e46.
Boverket. (2011). Boverkets foreskrifter och allm€anna rad omtill€ampning av europeiska konstruktionsstandarder (Eurokoder)[Boverket mandatory provisions and general recommendations onthe application of European design standards (Eurocodes)].Boverkets Forfattningssamling, BFS 2011:10, EKS 8. TheSwedish National Board of Housing, Building and Planning.
BSI. (1993). BS 5502 e 22: Buildings and structures for agriculture. Codeof practice for design, construction and loading. London, UK:British Standard Institute.
Eurocode. (2010). Eurocode 0 e Basis of structural design. EN1990:2002/A1:2005/AC:2010. Brussels: European Committee forStandardization.
Gruyaert, E., De Belie, N., Matthys, S., Van Nuffel, A., & Sonck, B.(2007). Pressures and deformations of bunker silo walls.Biosystems Engineering, 97, 61e74.
Kangro, A. (1986). Load measurements in bunker silos for silage.Report 48. Lund: Swedish University of Agricultural Sciences,department of Agricultural Buildings.
LBS. (1983). LALT-publikation 2 e Byggnadskonstruktioner [LALTpublication 2 e Building constructions]. Jonkoping: Swedish Boardof Agriculture.
Martens, P. (1993). Die Neufassung der DIN 11622 e G€arfuttersilosund Gutterbeh€alter. In Proceedings of the Symposium Concrete fora Sustainable Agriculture. BIBM, Cembureau, ERMCO, CIGR.Bologna, Italy 21e23 April 1993.
Messer, H. J. M., & Hawkins, J. C. (1977). The loads exerted by grasssilage on bunker silo walls. Journal of Agricultural EngineeringResearch, 22(4), 327e339.
Minitab. (2007). Minitab release 15 for Windows. State College, PA,USA: Minitab Inc.
Negi, S. C., & Jofriet, J. C. (November 1986). Computer-aidedprediction of silo-wall pressures. ASAE. Applied Engineering inAgriculture, 2(2). St. Joseph, Michigan.
Nilsson, L. (1982). Laster i ensilagesilor e genomgang av litteratur ochnormer [The loads in horizontal silos e a literature review of silodesign codes]. Report 23. Lund: Swedish University ofAgricultural Sciences, Department of Agricultural Buildings.
O'Donnell, C. (1993). A study of the effects of silage effluent on concrete.Master of English Science Thesis. National University ofIreland.
Savoie, P., Amyot, A., & Thriault, R. (2002). Effect of moisturecontent, chopping, and processing on silage effluent.Transactions of the ASAE, 45(4), 907e914.
Schemel, H., Furll, C., & Hoffmann, T. (2010). Compression ofchopped grass maize and grass in a bunker silo with vibratingrollers. In AgEng Clermont-Ferrand, France, September 6e8, 2010.ref 015.
SIS. (2012). Ekonomibyggnader e Till€ampningar till Boverkets ochJordbruksverkets regler avseende utformning av ekonomibyggnaderfor jordbruk, skogsbruk och tr€adgardsn€aring samt h€astverksamhet[Farm building design based on codes from The Swedish NationalBoard of Housing, Building and Planning and The Swedish Board ofAgriculture]. SIS-TS 37:2012. Stockholm: Swedish StandardsInstitute Publishers AB.
SJV. (1995). Jordbruksverkets Bygg Rad (JBR) (Swedish board ofagriculture, building advice (JBR). Jonkoping.
Stewart, T. A., & McCullough, I. I. (1974). Silage effluent, quantitiesproduced composition and disposal. Agriculture in NorthernIreland, 48, 368e374.
Sutter, A. (1955). Problems of waste effluent from silage. Project 307.(pp. 74e82). OEEC.
Page 12
b i o s y s t em s e n g i n e e r i n g 1 2 6 ( 2 0 1 4 ) 9 2e1 0 3 103
't Hart, C. (1980). Constructieve richtlijnen voor sleufsilo's voor deopslag van kuilvoer [Constructive guidelines for horizontalsilos for the storage of silage]. PT Bouwkunde, Wegen- enWaterbouw, 35(10), 584e587.
Tang, J., Jofriet, J. C., & LeLievre, B. (1987a). A saturation criterionfor ensiled plant material. Canadian Agricultural Engineering, 30,93e98.
Tang, J., Jofriet, J. C., & LeLievre, B. (1987b). Juice flow from silages.Canadian Agricultural Engineering, 30, 99e106.
Van Nuffel, A., Vangeyte, J., Baert, J., Maertens, W., & Sonck, B.(2008). Is literature on the pressure on farm trench silos walls
still accurate?. In Paper P-105 presented at AgEng 2008International Conference on Agricultural Engineering, 23e25 June2008, Hersonissos, Crete, Greece.
Zhao, Q., & Jofriet, J. C. (1991). Structural loads on bunker silowalls: experimental study. Journal of Agricultural EngineeringResearch, 50, 273e290.
Zhao, Q., & Jofriet, J. C. (1992). Structural loads on bunker silowalls: numerical study. Journal of Agricultural EngineeringResearch, 51, 1e13.


![Buckling Analysis of Cold Formed Silo Column - · PDF fileBuckling Analysis of Cold Formed Silo Column Karol Rejowski ... Eurocode 3 [9] buckling formula for the silo design basing](https://static.documents.pub/doc/80x56/5a9dff167f8b9ada718c45e4/buckling-analysis-of-cold-formed-silo-column-analysis-of-cold-formed-silo-column.jpg)


