19
Design Decisions for Embedding BI into Your Application Dean Yao Director of Marketing Mike Poplawski Systems Engineer
| Date post: | 03-Aug-2015 |
| Category: |
Software |
| Upload: | mia-yuan-cao |
| View: | 41 times |
| Download: | 1 times |

Design Decisions for Embedding BI into Your Application
Dean Yao Director of Marketing
Mike Poplawski Systems Engineer

High Performance and Scalable Intelligent push-down technology In-memory cubes Server clustering
Self-ServiceSo easy anyone can create & use Interactive charts, controls, widgets
Flexible Any data source: from RDB to Big Data and Cloud Customizable and embeddable Delivery options
Advanced, Embedded Data Visualization Platform:
JReport Highlights
2

3
Ease of Embedding
Complex Systems
Simplistic Solutions
Embeddable Power
Legacy Tools
Perf
orm
ance
and
Fea
ture
s Traditional BI
Open Source
JReport
Market Positioning

JReport Solution Areas
Embedded BI Dashboards & Reports
Analytics Mobile BI
Visualize. Analyze. Discover.
4

ACME Financials
Company Sales
BI Platform – Security, administrative features
– Customizable look and feel
Metadata Management
– Organize/publish/search of: dimensions, hierarchies, measures, formula, components, reports into catalogs
Development Tools
– JReport Designer: build components, reports, dashboards
– API for application embedding
Embedded Solution
5

6
Any application Embedded into customers’ applications or products Typically hosted “on-premise” Customizable, manageable, secure, scalable
Software as a Service (SaaS)Web based for internal users or external subscribers Typically hosted in the cloudVariety of licensing models for subscribers
JReport works with all deployment types.
Ways to Embed BI

Integration Options
7
Functional Integration
Standalone JReport
URL API
Java APIs
Server Integrated
Application Embedded
Deployment Integration
JReport Server JReport
Server Business layer
Application
Web layer

UI Integration
8
URL Integration
Example to call a report by URL: http://localhost:8888/jinfonet/tryView.jsp? jrs.cmd=jrs.try_vw&jrs.catalog=SampleReports/SampleReports.cat
&jrs.report=SampleReports/MultimediaObjects.cls&jrs.result_type=8

• Flexible data sources • Sort, filter, link to reports,
drill into details, expand/collapse groups • Themes, profiles, print layouts • Security and Governance • 1-click data interaction
Ad Hoc Reporting
9

Ad Hoc Analytics
• Visual Analysis • Interactive UI with drag-
and-drop functionality • Quickly change data views • Powered by in-memory
cubes
10

• Easily drag/drop from library • Reuse reports, components, analytics • 3rd party widgets e.g. Google Maps • Sort, filter, drill, pivot, slice-n-dice,
parameters, export • Synchronized refresh • HTML5
JDashboard: Interactive Visualization
11
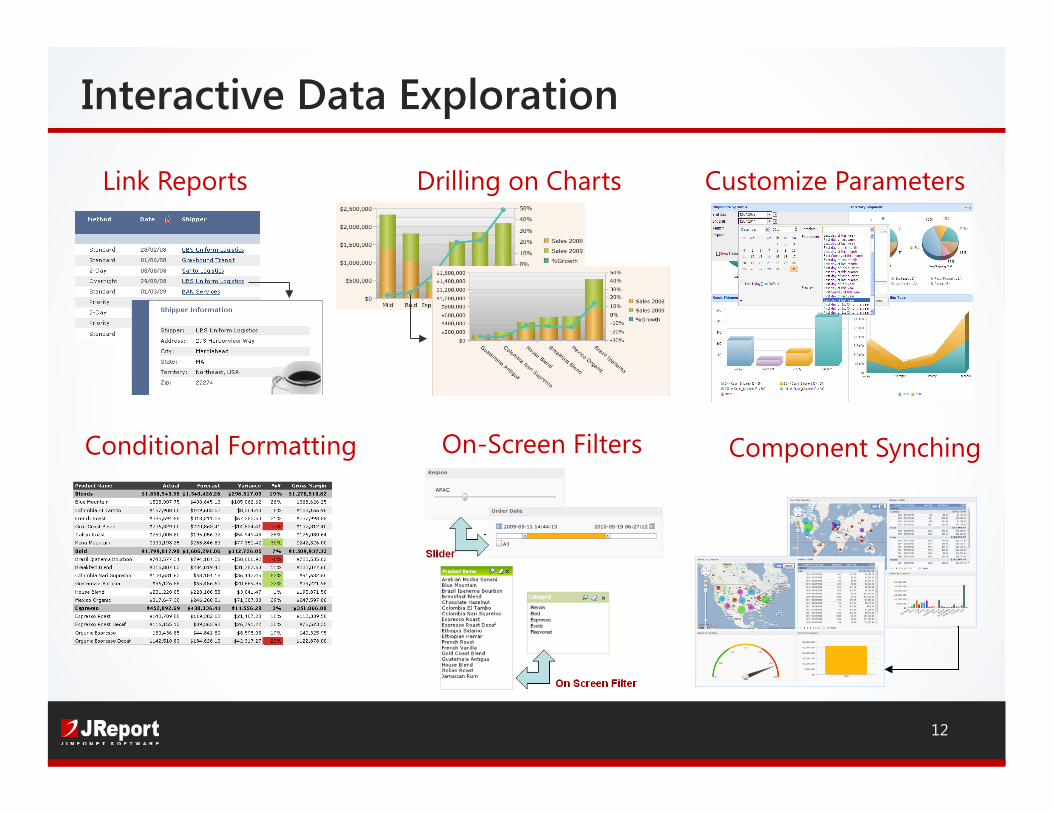
Drilling on Charts Link Reports Customize Parameters
Conditional Formatting On-Screen Filters Component Synching
Interactive Data Exploration
12

Motion Charts
Scrollable Charts
Real-time Charts
Live Charts
13

• Big Data – large, complex set of data – Genomics data, traffic data, social media data
• NoSQL databases – non-relational, distributed, open-source and horizontally scalable – MapReduce – parallel processing using Master-Worker nodes
• MongoDB – aggregations and detailed data • Apache Hadoop – MapR, Hortonworks, Cloudera
• Visualization of Big Data
Big Data and Visualization
14

15
Information Delivery
Web Mobile

JReport 13.1 Highlights
• Visual Analysis – VA as dashboard components – Rich data discovery – Product unity
• Enhanced SaaS enablement – Full multi-tenancy – Tools for developers
• Flexibility, usability, security – Multiple data sources (distributed joins) – Richer customization
16

Demo: What You’ll See
17
1. Embedded Reports & Dashboards
2. Geo Analysis and Heatmaps
3. Visual Analysis + JDashboard

Government ISV/OEM Healthcare / Healthcare Insurance
Telecom Consumer / Manufacturing
Financial Services
Global Customer Base
18

19
• Look for our follow-up email ! Exclusive JReport 13.1 Trial ! Free Proof of Concept ! Whitepaper: Embedded Reporting, Dashboards and Analytics in
OEM/SaaS Applications
• On-Demand Product Demo – Watch it anytime
• For more info, visit: www.jinfonet.com E-mail: [email protected] Phone: (240) 477-1000 Follow us @Jinfonet
Next Steps


