33
Design Evaluation Design Evaluation Demand Forecasting Demand Forecasting 1

Design Evaluation Design Evaluation Demand ForecastingDemand Forecasting
1

““The art of prophecy is very difficult The art of prophecy is very difficult ––especially with respect to the future.especially with respect to the future.””
Mark TwainMark Twain
2
40% of New Products Fail40% of New Products Fail
►►No Basic Need for Product No Basic Need for Product
►►Overall Product Does Not Meet NeedOverall Product Does Not Meet Need
►►Idea Not Properly CommunicatedIdea Not Properly Communicated
3
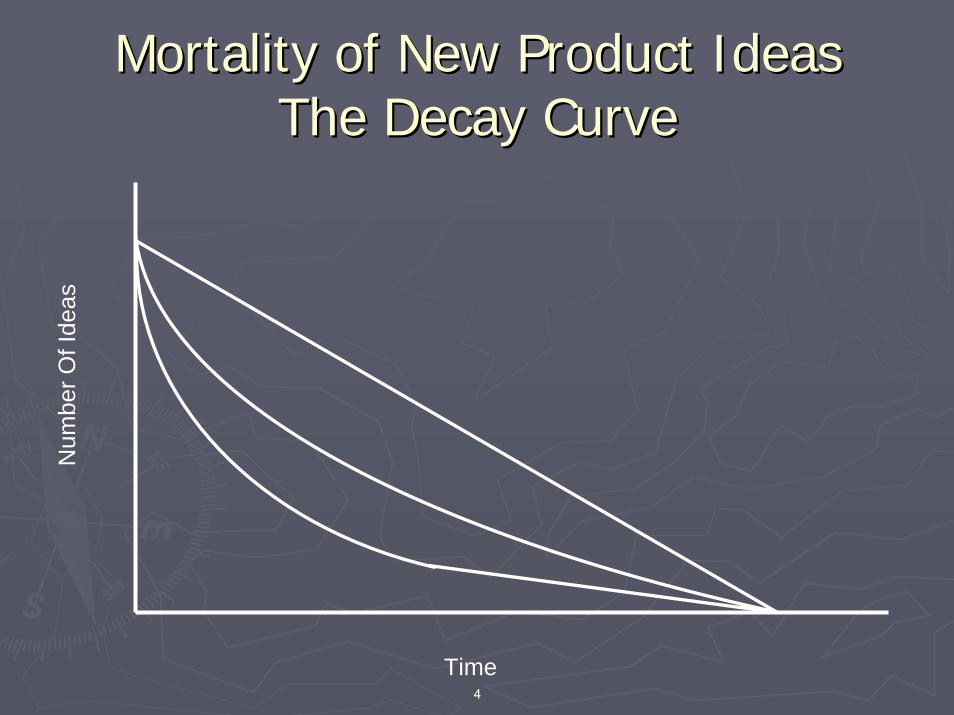
Mortality of New Product IdeasMortality of New Product IdeasThe Decay CurveThe Decay Curve
Num
ber O
f Ide
as
Time4
What it takesWhat it takes
►► A system or process to weed out projectsA system or process to weed out projects
►► An understanding of how innovations are An understanding of how innovations are embracedembraced
5

Product Adoption PatternsProduct Adoption Patterns
µ+2σµ+σ µ+3σµ-2σ µ µµ-3σ -1σ
Late
Maj
orit
y 3
4 %
Laggards 16%
Earl
y M
ajor
ity
34
%
Early Adopters13.5%
Innovators2.5%
Time Until Adoption6
Early AdoptersEarly Adopters
►►Hi Education, Income, Status, LiteracyHi Education, Income, Status, Literacy►►Empathy, Less Dogmatic, Ability to Abstract, Empathy, Less Dogmatic, Ability to Abstract,
Rational, Intelligent, Able to Cope with Risk, Rational, Intelligent, Able to Cope with Risk, Aspiration, Positive Attitude to Science, Aspiration, Positive Attitude to Science,
►►Social Participation, Media Exposure, Social Participation, Media Exposure, InformationInformation
►►No Relationship to AgeNo Relationship to Age
7

Innovation vs. ImitationInnovation vs. Imitation
►►Innovators are not influenced by who Innovators are not influenced by who already has boughtalready has bought
►►Imitators become more likely to purchase Imitators become more likely to purchase with more previous buyerswith more previous buyers
8
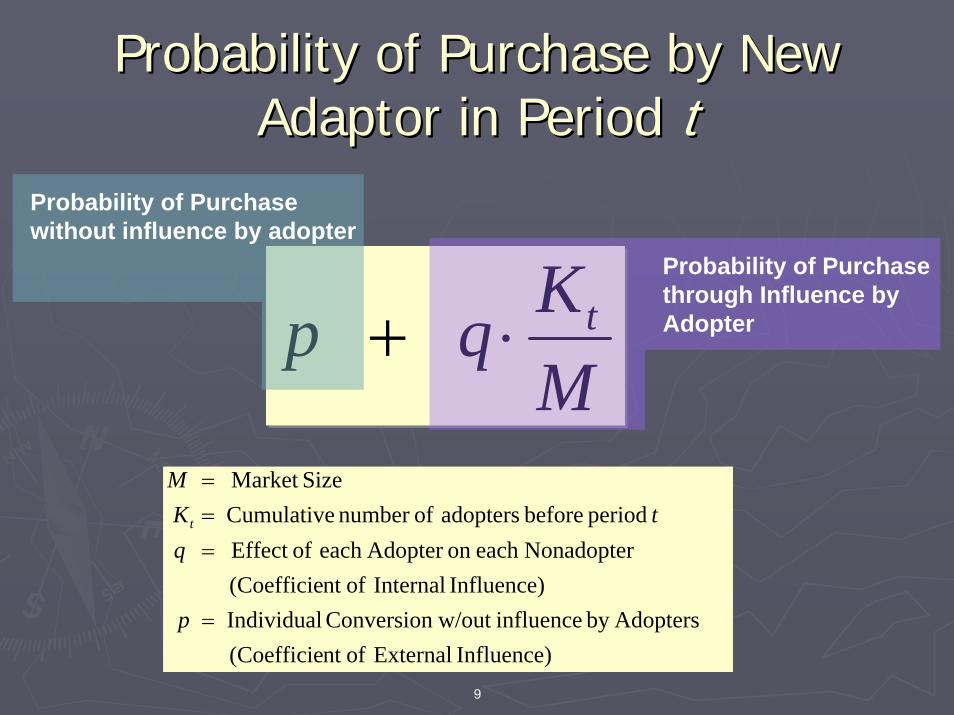
Probability of Purchase by New Probability of Purchase by New Adaptor in Period Adaptor in Period tt
MKqp t⋅+
Probability of Purchase without influence by adopter
Probability of Purchase through Influence by Adopter
Influence) External ofnt (CoefficieAdoptersby influence w/out Conversion Individual
Influence) Internal ofnt (CoefficieNonadoptereach on Adopter each ofEffect
period before adopters ofnumber CumulativeSizeMarket
=
===
p
qtK
M
t
9
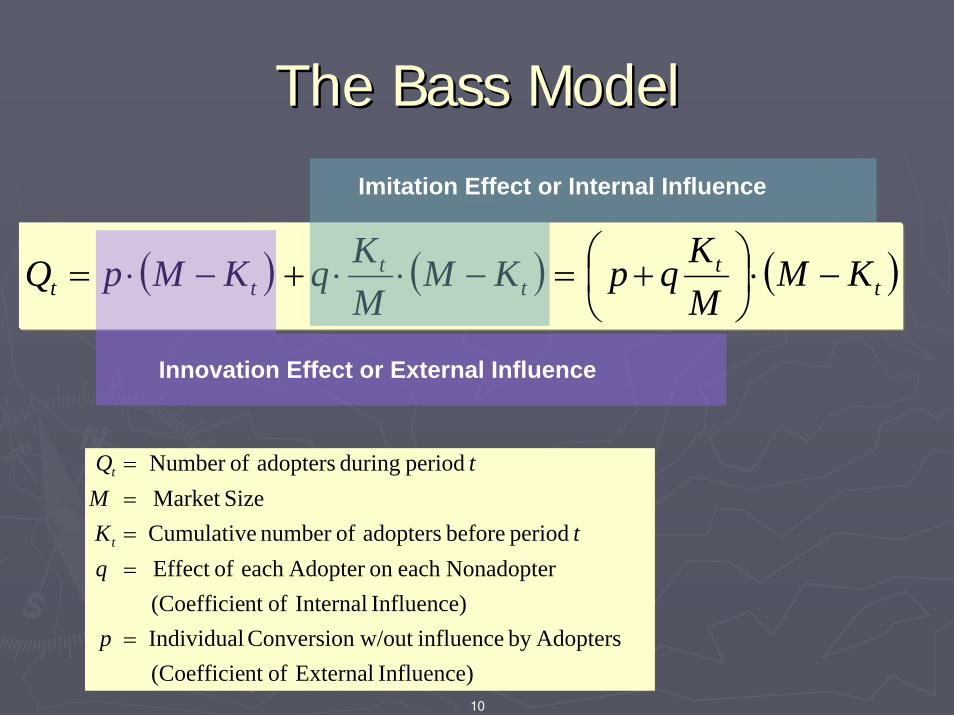
The Bass ModelThe Bass Model
( ) ( ) ( )tt
tt
tt KMMKqpKM
MKqKMpQ −⋅⎟
⎠⎞
⎜⎝⎛ +=−⋅⋅+−⋅=
Innovation Effect or External Influence
Imitation Effect or Internal Influence
Influence) External ofnt (CoefficieAdoptersby influence w/out Conversion Individual
Influence) Internal ofnt (CoefficieNonadoptereach on Adopter each ofEffect
period before adopters ofnumber CumulativeSizeMarket
period during adopters ofNumber
=
====
p
qtK
MtQ
t
t
10
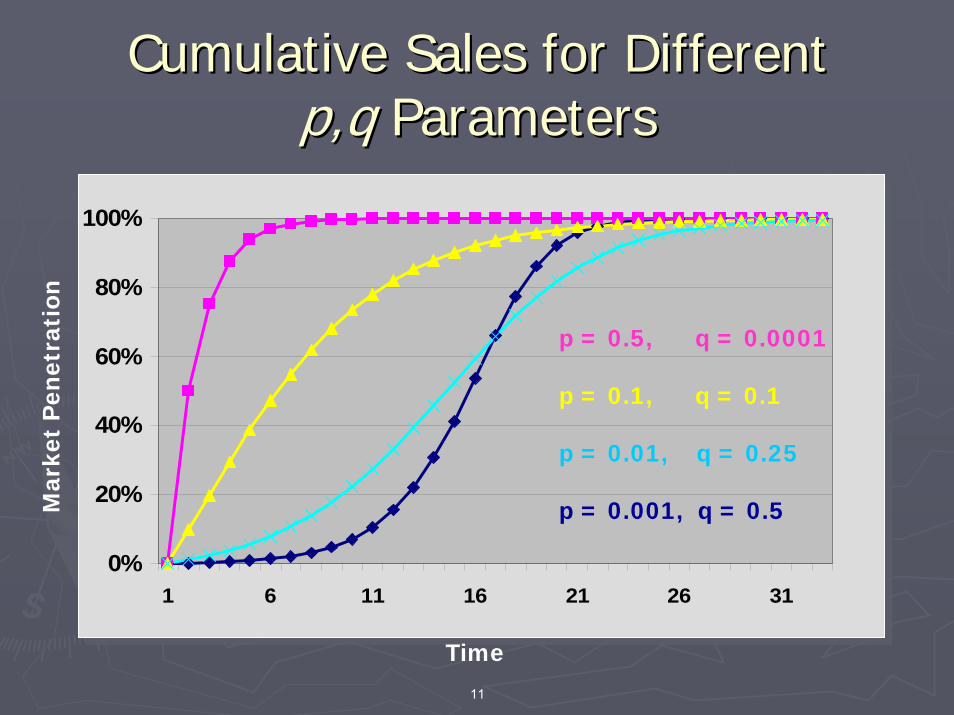
Cumulative Sales for Different Cumulative Sales for Different p,qp,q ParametersParameters
0%
20%
40%
60%
80%
100%
1 6 11 16 21 26 31
Time
p = 0.5, q = 0.0001
p = 0.1, q = 0.1
p = 0.01, q = 0.25
p = 0.001, q = 0.5Mar
ket
Pen
etra
tion
11
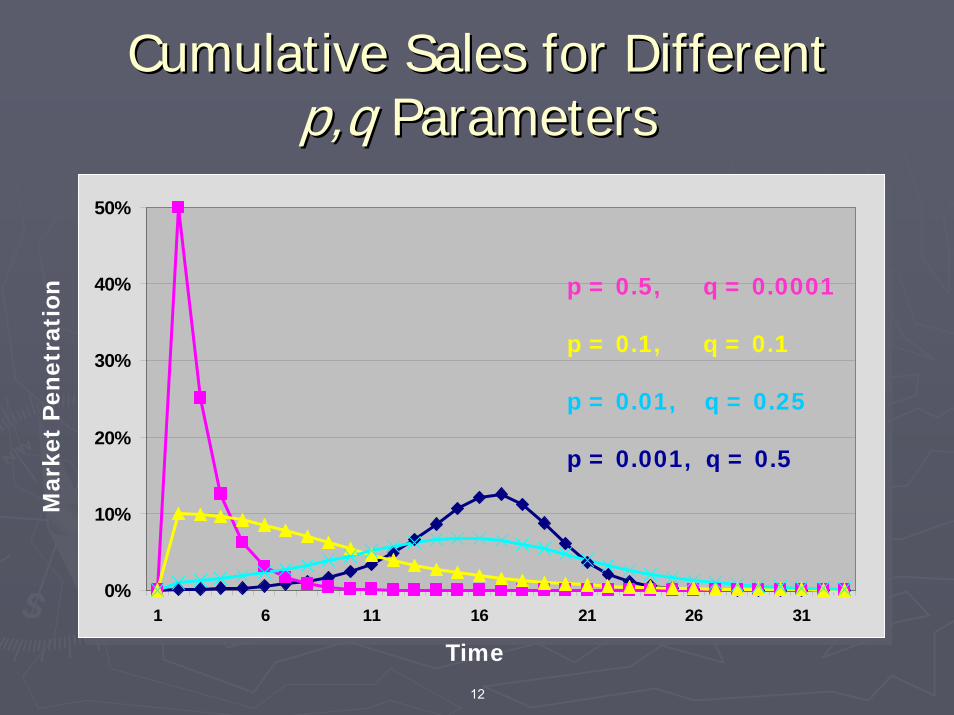
Cumulative Sales for Different Cumulative Sales for Different p,qp,q ParametersParameters
0%
10%
20%
30%
40%
50%
1 6 11 16 21 26 31
Time
p = 0.5, q = 0.0001
p = 0.1, q = 0.1
p = 0.01, q = 0.25
p = 0.001, q = 0.5
Mar
ket
Pen
etra
tion
12
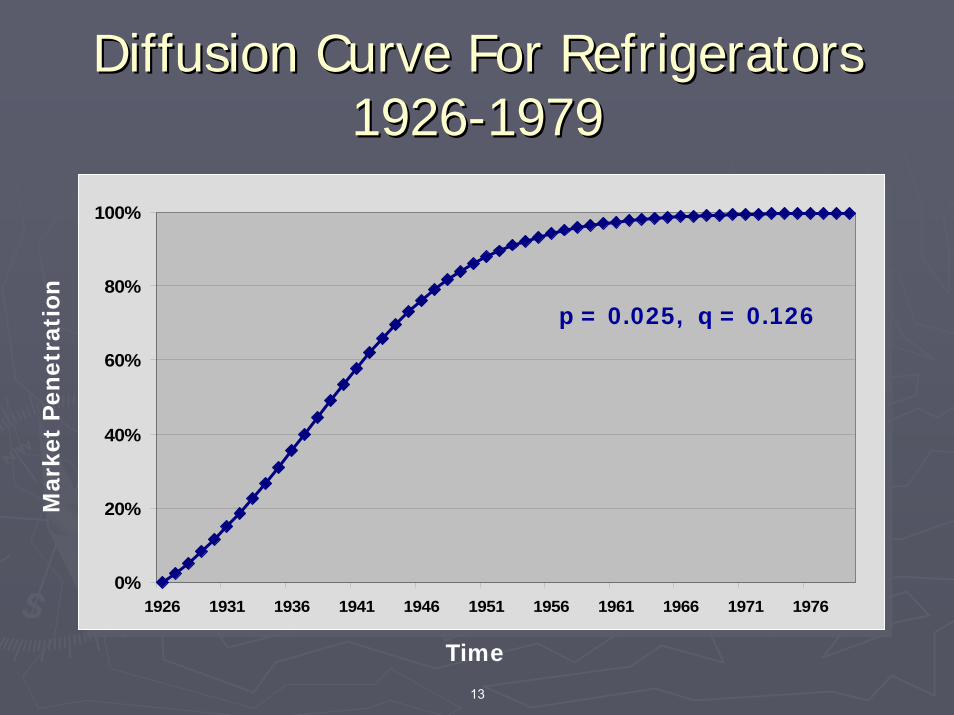
Diffusion Curve For RefrigeratorsDiffusion Curve For Refrigerators19261926--19791979
Time
0%
20%
40%
60%
80%
100%
1926 1931 1936 1941 1946 1951 1956 1961 1966 1971 1976
p = 0.025, q = 0.126
Mar
ket
Pen
etra
tion
13
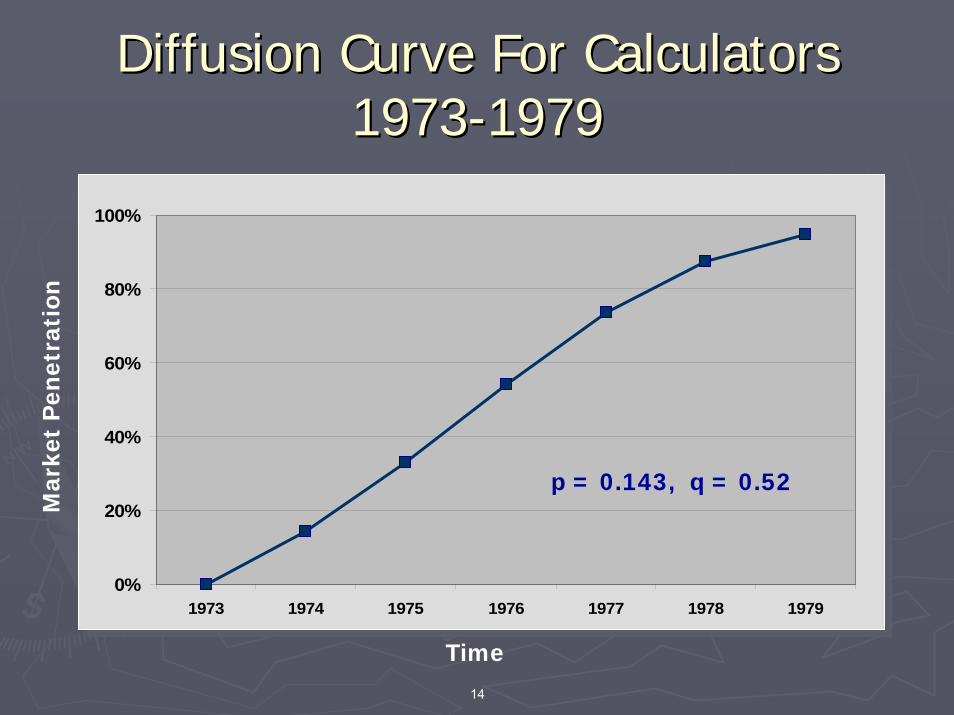
Diffusion Curve For CalculatorsDiffusion Curve For Calculators19731973--19791979
Time
0%
20%
40%
60%
80%
100%
1973 1974 1975 1976 1977 1978 1979
p = 0.143, q = 0.52
Mar
ket
Pen
etra
tion
14
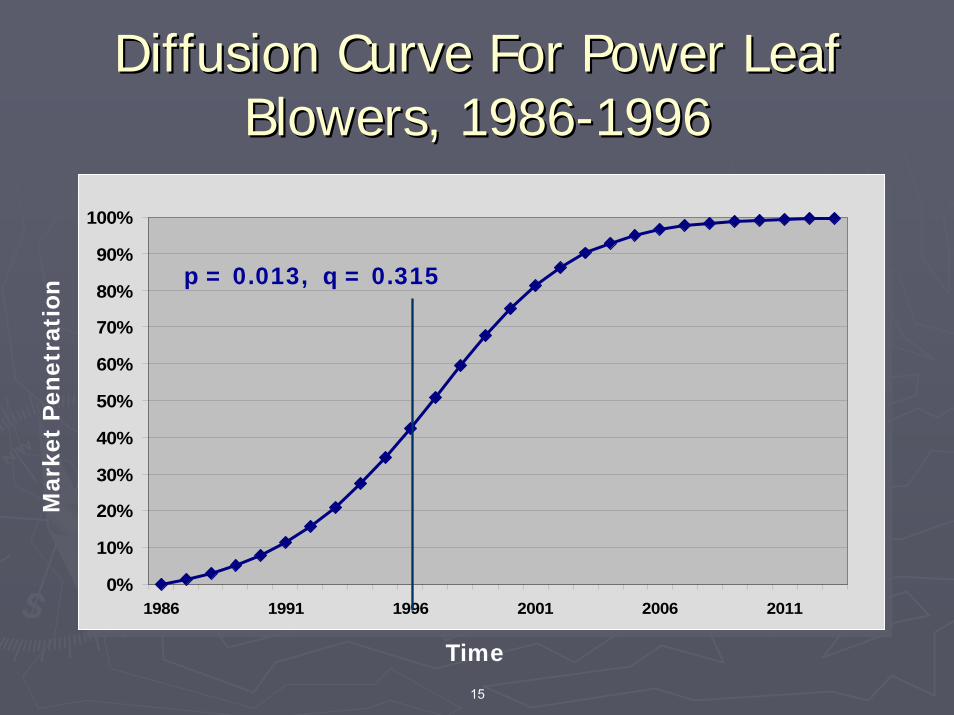
Diffusion Curve For Power Leaf Diffusion Curve For Power Leaf Blowers, 1986Blowers, 1986--19961996
Mar
ket
Pen
etra
tion
Time
0%
10%
20%
30%
40%
50%
60%
70%
80%
90%
100%
1986 1991 1996 2001 2006 2011
p = 0.013, q = 0.315
15
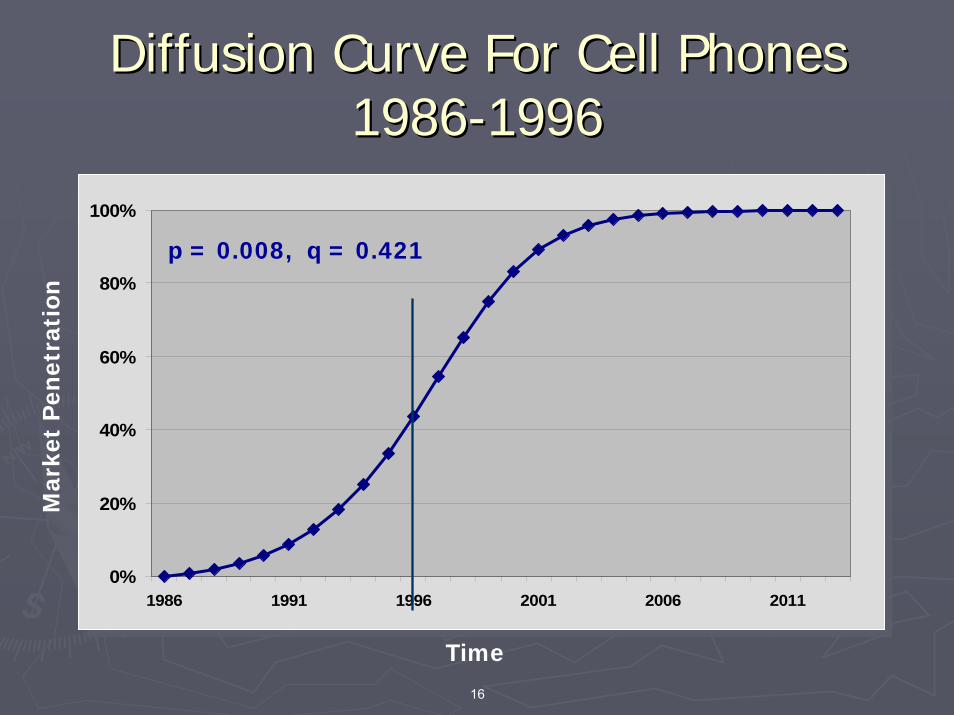
Diffusion Curve For Cell PhonesDiffusion Curve For Cell Phones19861986--19961996
0%
20%
40%
60%
80%
100%
1986 1991 1996 2001 2006 2011
p = 0.008, q = 0.421
Mar
ket
Pen
etra
tion
Time 16
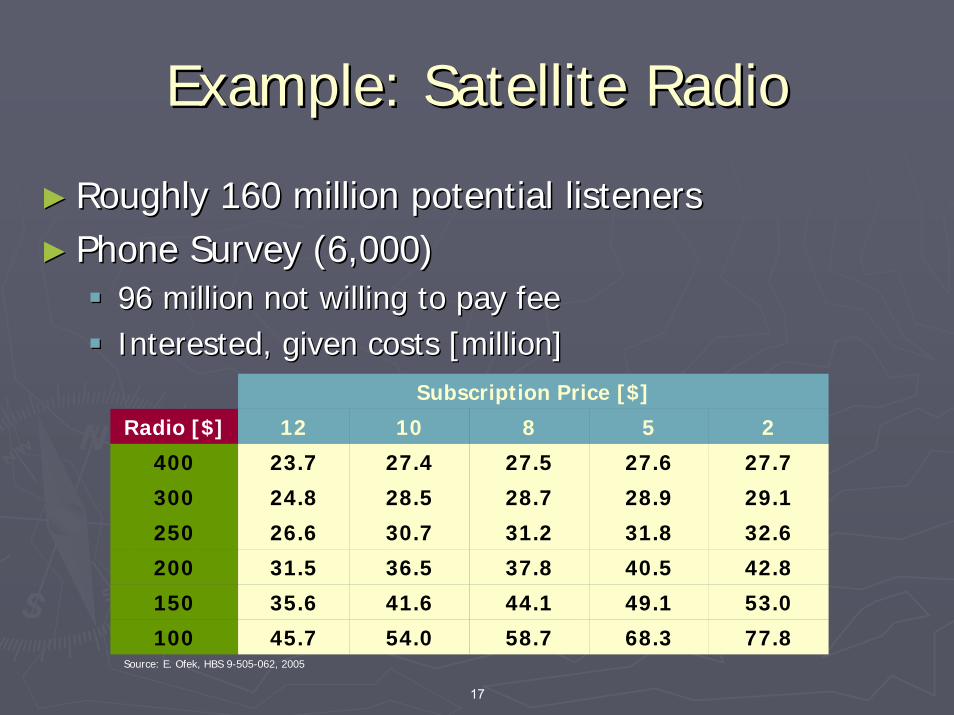
Example: Satellite RadioExample: Satellite Radio
►► Roughly 160 million potential listenersRoughly 160 million potential listeners►► Phone Survey (6,000)Phone Survey (6,000)
96 million not willing to pay fee96 million not willing to pay feeInterested, given costs [million]Interested, given costs [million]
Subscription Price [$]
Radio [$] 12 10 8 5 2
400 23.7 27.4 27.5 27.6 27.7
300 24.8 28.5 28.7 28.9 29.1
250 26.6 30.7 31.2 31.8 32.6
200 31.5 36.5 37.8 40.5 42.8
150 35.6 41.6 44.1 49.1 53.0
100 45.7 54.0 58.7 68.3 77.8Source: E. Ofek, HBS 9-505-062, 2005
17
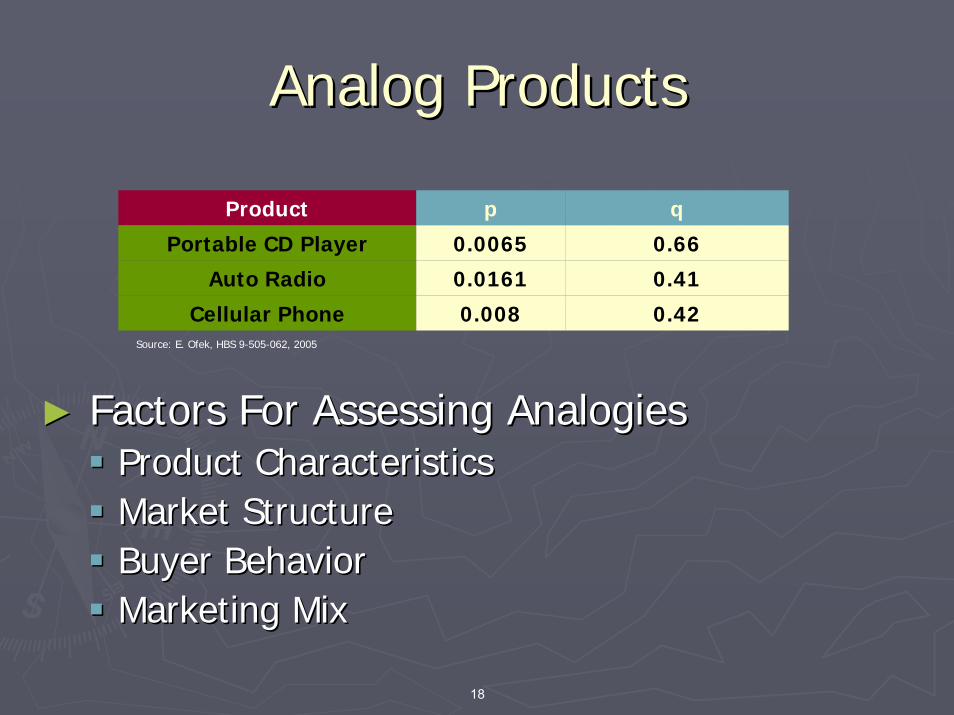
Analog ProductsAnalog Products
Product p q
Portable CD Player 0.0065 0.66
Auto Radio 0.0161 0.41
Cellular Phone 0.008 0.42Source: E. Ofek, HBS 9-505-062, 2005
►► Factors For Assessing AnalogiesFactors For Assessing AnalogiesProduct CharacteristicsProduct CharacteristicsMarket StructureMarket StructureBuyer BehaviorBuyer BehaviorMarketing MixMarketing Mix
18
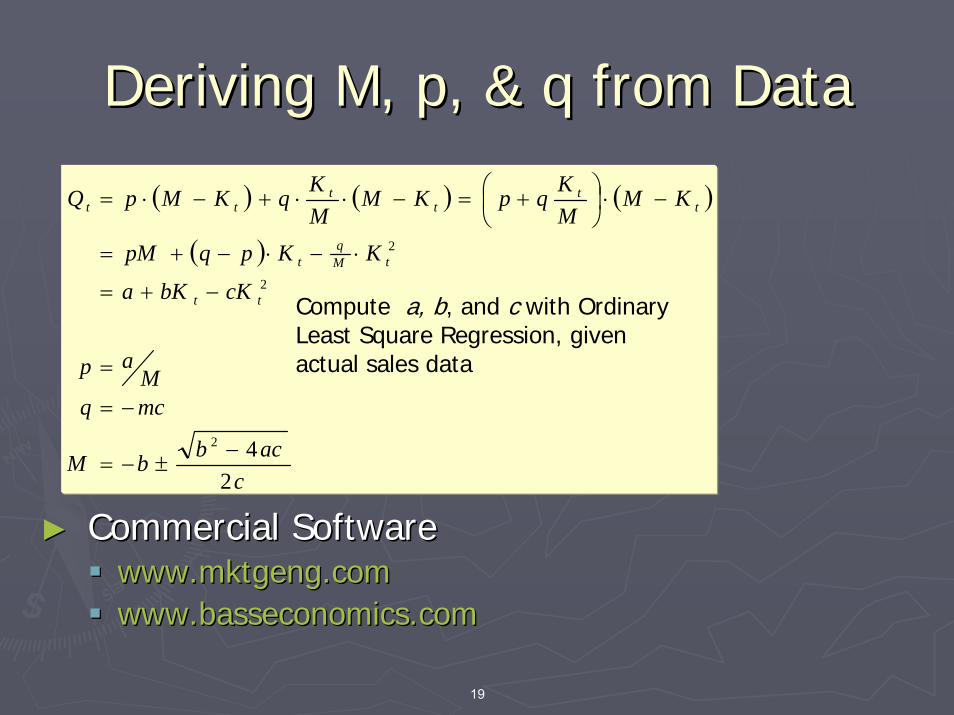
Deriving M, p, & q from DataDeriving M, p, & q from Data
( ) ( ) ( )
( )
cacbbM
mcqM
ap
cKbKa
KKpqpM
KMMKqpKM
MKqKMpQ
tt
tMq
t
tt
tt
tt
242
2
2
−±−=
−=
=
−+=
⋅−⋅−+=
−⋅⎟⎠⎞
⎜⎝⎛ +=−⋅⋅+−⋅=
Compute a, b, and c with Ordinary Least Square Regression, given actual sales data
►► Commercial SoftwareCommercial Softwarewww.mktgeng.comwww.mktgeng.comwww.basseconomics.comwww.basseconomics.com
19
Limits of the Bass ModelLimits of the Bass Model
►► Static market potentialStatic market potential►► Static geographic boundariesStatic geographic boundaries►► Independence of other innovationsIndependence of other innovations►► Simple Simple ““not adopt to adoptnot adopt to adopt”” frameworkframework►► Limitless supplyLimitless supply►► No repeat or replacement salesNo repeat or replacement sales►► Individual decision process neglectedIndividual decision process neglected►► DeterministicDeterministic►►
20

RogerRoger’’s Five Factorss Five Factors
►► Relative AdvantageRelative AdvantageProduct performance relative to incumbentProduct performance relative to incumbent
►► CompatibilityCompatibilityConsistency with existing values/experiencesConsistency with existing values/experiences
►► ComplexityComplexityEase of UseEase of Use
►► TriabilityTriabilityPossibility to experiment with productPossibility to experiment with product
►► ObservabilityObservabilityVisibility of usage and impactVisibility of usage and impact
21
Example: Example: SegwaySegway
►► Relative AdvantageRelative Advantage►► CompatibilityCompatibility►► ComplexityComplexity►► TriabilityTriability►► ObservabilityObservability
22
Example: ViagraExample: Viagra
►► Relative AdvantageRelative Advantage►► CompatibilityCompatibility►► ComplexityComplexity►► TriabilityTriability►► ObservabilityObservability
23

AA--TT--AA--RR
►► AAwarenesswarenessWho is aware of the product?Who is aware of the product?
►► TTrialrialWho wants to try the product? Who wants to try the product?
►► AAvailabilityvailabilityWho has access to the product?Who has access to the product?
►► RRepeatepeatWho wants to try product again?Who wants to try product again?
24

The AThe A--TT--AA--R ModelR Model
►► Units Sold = Market PotentialUnits Sold = Market Potential* Percentage aware* Percentage aware* Percent who try* Percent who try* Percent who have access* Percent who have access* Percent who will repeat * Percent who will repeat * Number of repeats per year* Number of repeats per year
25
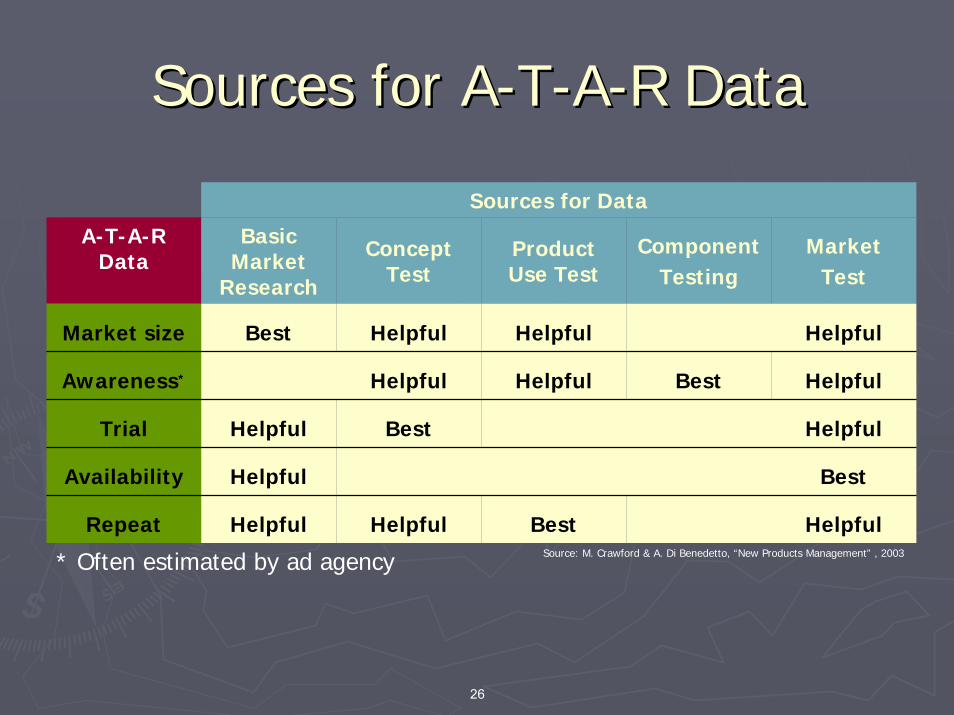
Sources for ASources for A--TT--AA--R DataR Data
Sources for Data
A-T-A-R Data
Basic Market
Research
Concept Test
Product Use Test
Component Testing
MarketTest
Market size Best Helpful Helpful Helpful
Awareness* Helpful Helpful Best Helpful
Trial Helpful Best Helpful
Availability Helpful Best
Repeat Helpful Helpful Best Helpful
* Often estimated by ad agency Source: M. Crawford & A. Di Benedetto, “New Products Management” , 2003
26
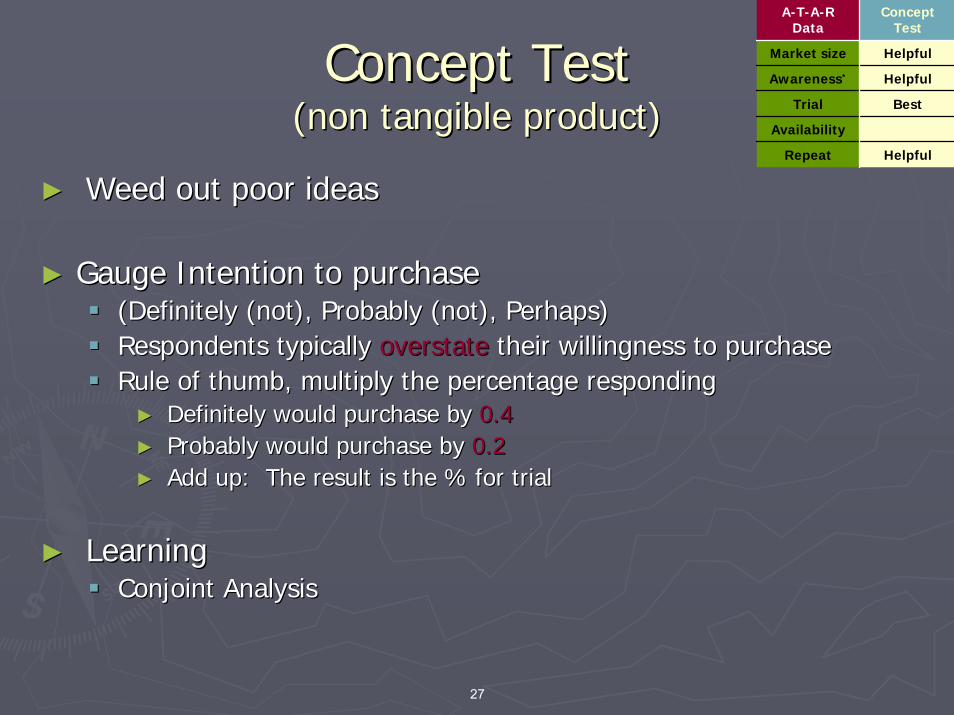
Concept Test Concept Test (non tangible product)(non tangible product)
►► Weed out poor ideasWeed out poor ideas
►► Gauge Intention to purchaseGauge Intention to purchase(Definitely (not), Probably (not), Perhaps)(Definitely (not), Probably (not), Perhaps)Respondents typically Respondents typically overstateoverstate their willingness to purchasetheir willingness to purchaseRule of thumb, multiply the percentage respondingRule of thumb, multiply the percentage responding►► Definitely would purchase by Definitely would purchase by 0.40.4►► Probably would purchase by Probably would purchase by 0.20.2►► Add up: The result is the % for trialAdd up: The result is the % for trial
►► LearningLearningConjoint AnalysisConjoint Analysis
A-T-A-R Data
Concept Test
Market size Helpful
Awareness* Helpful
Trial Best
Availability
Repeat Helpful
27
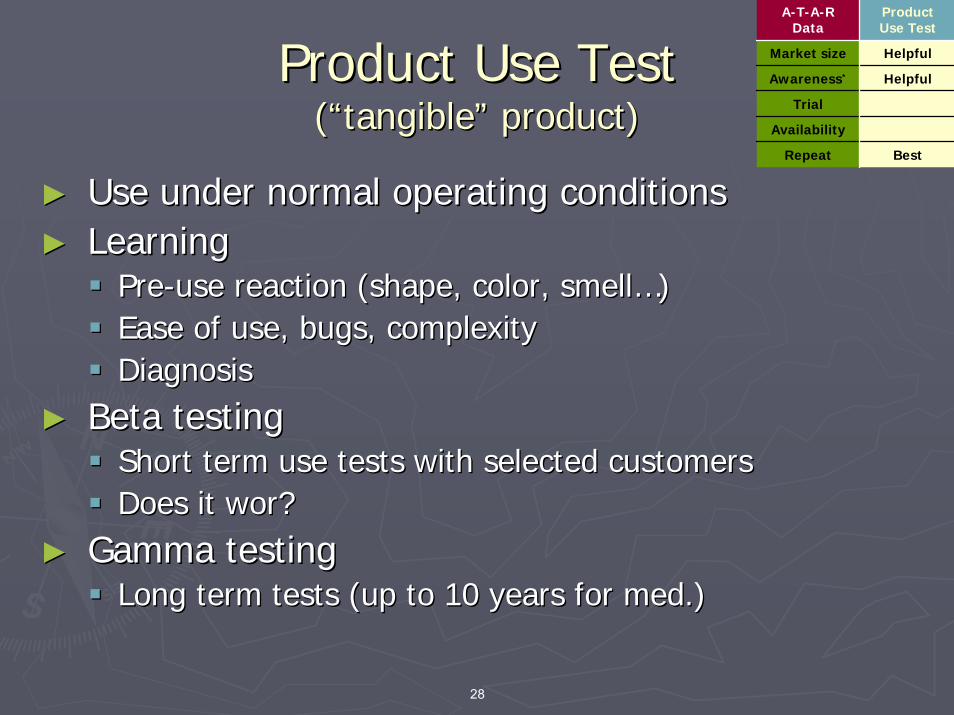
Product Use TestProduct Use Test((““tangibletangible”” product)product)
►► Use under normal operating conditionsUse under normal operating conditions►► LearningLearning
PrePre--use reaction (shape, color, smelluse reaction (shape, color, smell……))Ease of use, bugs, complexityEase of use, bugs, complexityDiagnosisDiagnosis
►► Beta testingBeta testingShort term use tests with selected customersShort term use tests with selected customersDoes it Does it worwor??
►► Gamma testingGamma testingLong term tests (up to 10 years for med.) Long term tests (up to 10 years for med.)
A-T-A-R Data
Product Use Test
Market size Helpful
Awareness* Helpful
Trial
Availability
Repeat Best
28
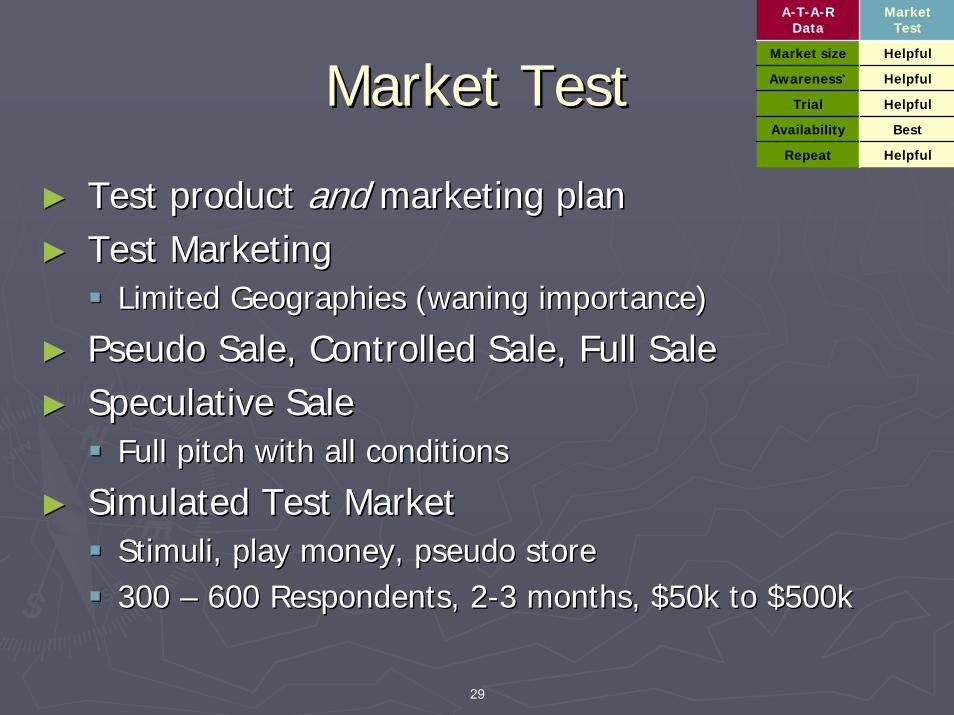
Market TestMarket Test
►► Test product Test product and and marketing planmarketing plan►► Test MarketingTest Marketing
Limited Geographies (waning importance)Limited Geographies (waning importance)
►► Pseudo Sale, Controlled Sale, Full SalePseudo Sale, Controlled Sale, Full Sale►► Speculative SaleSpeculative Sale
Full pitch with all conditionsFull pitch with all conditions
►► Simulated Test MarketSimulated Test MarketStimuli, play money, pseudo storeStimuli, play money, pseudo store300 300 –– 600 Respondents, 2600 Respondents, 2--3 months, $50k to $500k3 months, $50k to $500k
A-T-A-R Data
Market Test
Market size Helpful
Awareness* Helpful
Trial Helpful
Availability Best
Repeat Helpful
29
Additional ReadingAdditional Reading
►► E. Rogers: E. Rogers: ““Diffusion of InnovationsDiffusion of Innovations””, , 55thth Edition, 2003Edition, 2003
►► G. A. Moore: G. A. Moore: ““Crossing the ChasmCrossing the Chasm””33rdrd Edition 2002 Edition 2002
►► M. Crawford & A. Di M. Crawford & A. Di BenedettoBenedetto, , ““New Products ManagementNew Products Management”” , ,
77thth Edition, 2003Edition, 2003
►► G. G. LilienLilien, P. , P. KotlerKotler, & K.S. , & K.S. MoorthyMoorthy““Marketing ModelsMarketing Models””
1992, (fairly technical, limited availability)1992, (fairly technical, limited availability)
30

TomorrowTomorrow
►►Industry Leaders in Technology and Industry Leaders in Technology and Management LectureManagement Lecture
►►James DysonJames Dyson
31
Next ThursdayNext Thursday
►► Simon Pitts from Ford Motor CompanySimon Pitts from Ford Motor Company►► Professional BehaviorProfessional Behavior
Please be on Time!!!Please be on Time!!!
►► No TAs on siteNo TAs on site
32

MIT OpenCourseWarehttps://ocw.mit.edu
15.783J / 2.739J Product Design and DevelopmentSpring 2006
For information about citing these materials or our Terms of Use, visit: https://ocw.mit.edu/terms.


