17
Design, Monitoring and Evaluation using the livelihoods framework Karen Westley
| Date post: | 17-Dec-2015 |
| Category: |
Documents |
| Upload: | jordan-mathews |
| View: | 224 times |
| Download: | 0 times |
Design, Monitoring and Evaluation using the livelihoods
framework
Karen Westley
D,M&E in the livelihoods framework
Part I – CI Standards for Impact Evaluation
Part II – Applying the livelihoods approach to D,M&E in the project cycle
CI Impact Evaluation Initiative
Process history Project/logframe review Menu of livelihood indicators Development of standards D,M&E capacity assessment Training and capacity building Lesson learning
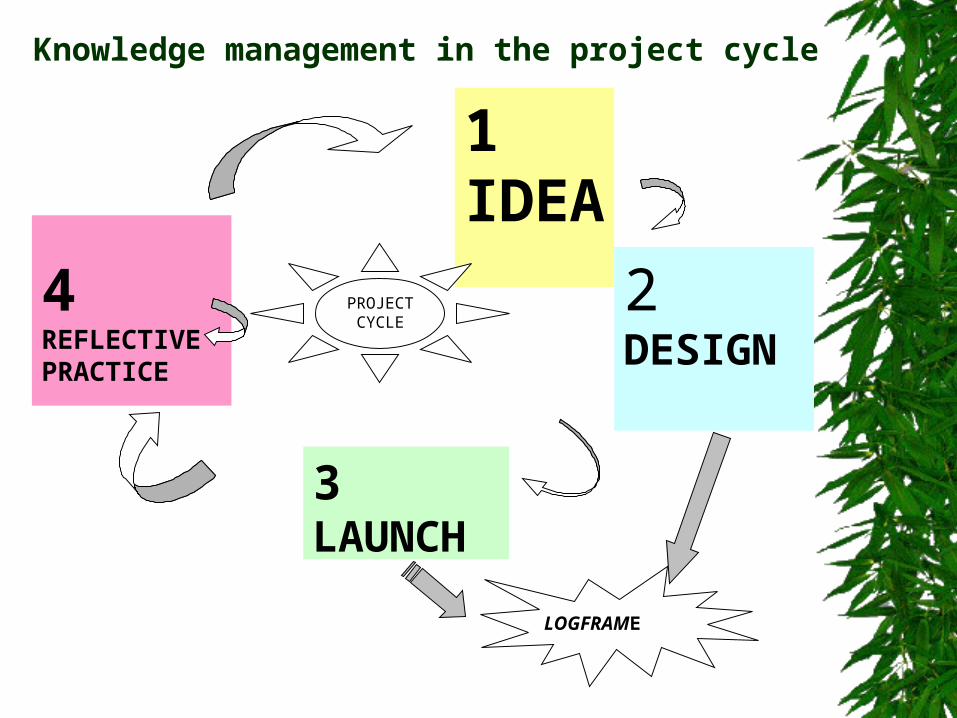
1IDEA 2
DESIGN
3LAUNCH
4REFLECTIVE PRACTICE
LOGFRAME
PROJECT CYCLE
Knowledge management in the project cycle
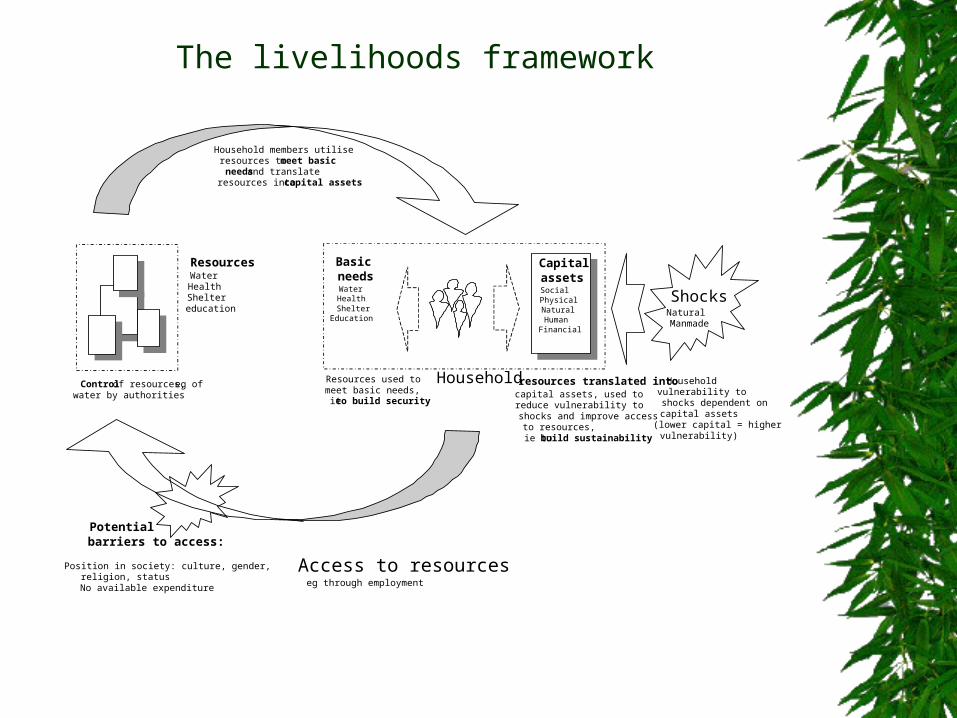
The livelihoods framework
Householdresources translated intocapital assets, used to reduce vulnerability to shocks and improve access to resources, ie to build sustainability
ResourcesWaterHealthSheltereducation
Shocks Natural Manmade
Household vulnerability to shocks dependent on capital assets
(lower capital = higher vulnerability)
Basic needsWaterHealthShelter
Education
Access to resources eg through employment
Resources used to meet basic needs, ie to build security
Potential barriers to access:
Position in society: culture, gender, religion, statusNo available expenditure
Household members utilise resources to meet basic needs and translate resources into capital assets
Control of resources,eg of water by authorities
Capital assets SocialPhysicalNaturalHumanFinancial
Capital assets SocialPhysicalNaturalHumanFinancial
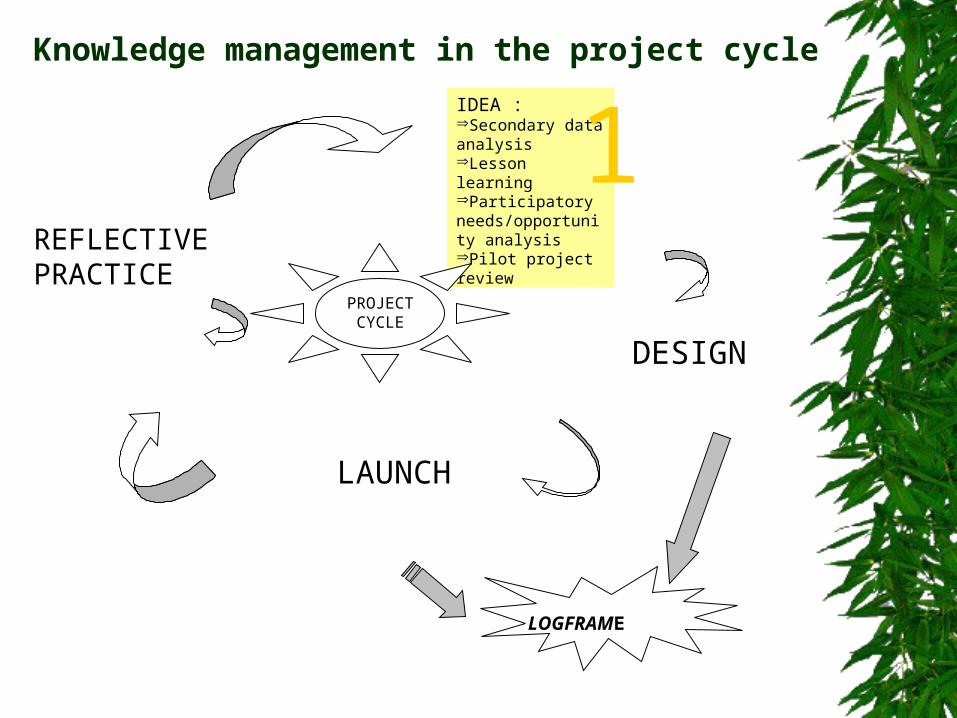
IDEA :Secondary data analysisLesson learningParticipatory needs/opportunity analysisPilot project review
DESIGN
LAUNCH
REFLECTIVE PRACTICE
LOGFRAME
PROJECT CYCLE
Knowledge management in the project cycle
1
Brief overview of process Selecting and sequencing tools in the
livelihoods framework Data recording Analysis Cost: around $100,000 plus staff time
Participatory livelihoods assessmentKosovo, July, 2000
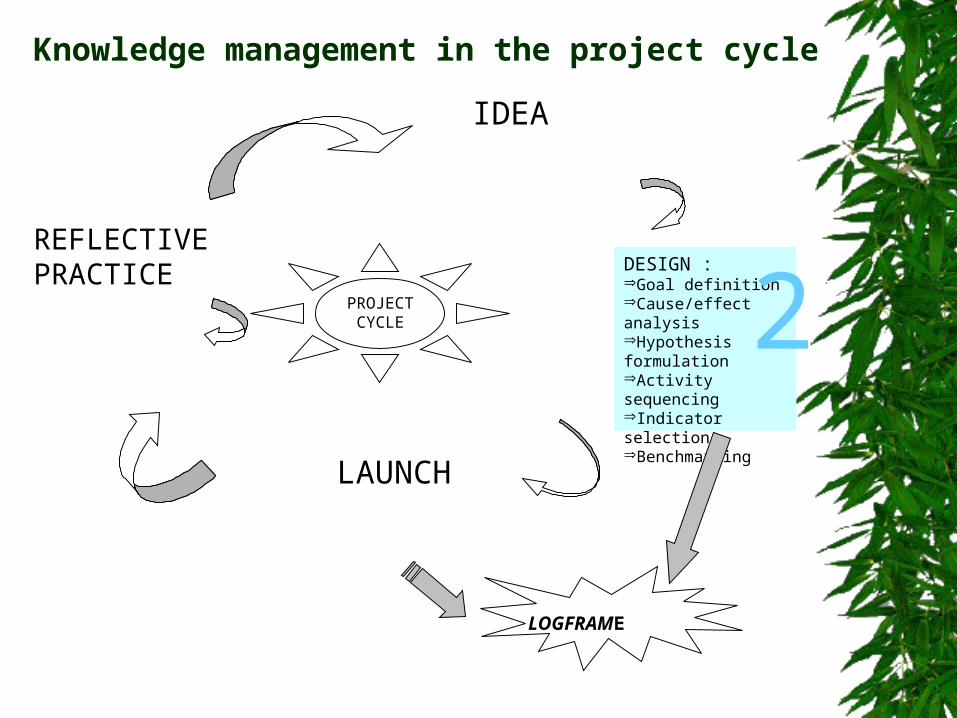
IDEA
DESIGN :Goal definitionCause/effect analysisHypothesis formulationActivity sequencingIndicator selectionBenchmarking
LAUNCH
REFLECTIVE PRACTICE
LOGFRAME
PROJECT CYCLE
Knowledge management in the project cycle
2
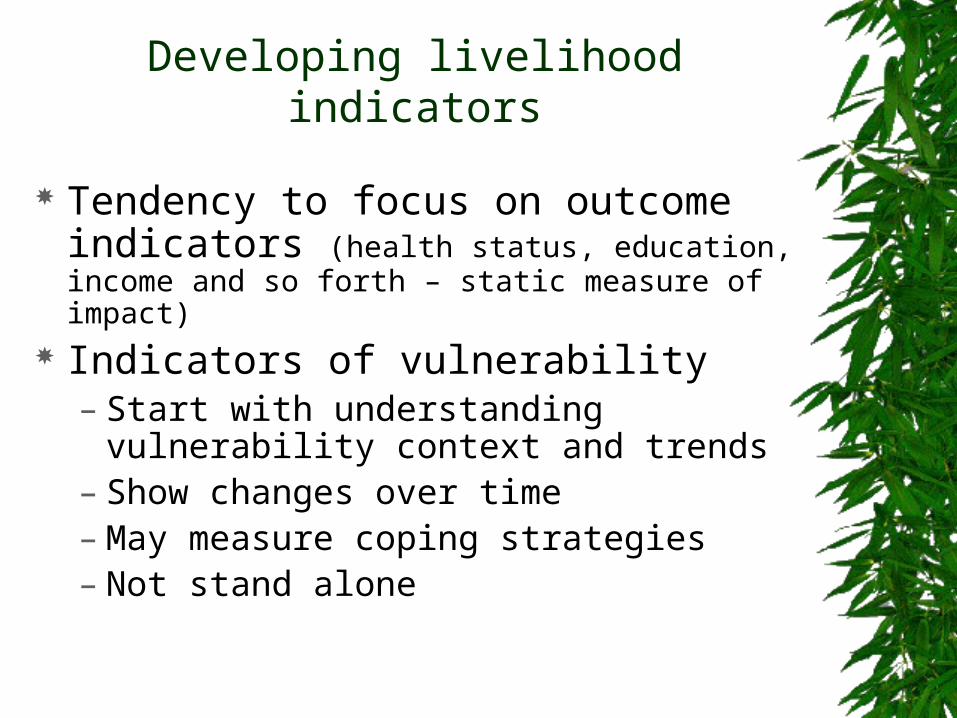
Developing livelihood indicators
Tendency to focus on outcome indicators (health status, education, income and so forth – static measure of impact)
Indicators of vulnerability– Start with understanding vulnerability
context and trends– Show changes over time– May measure coping strategies– Not stand alone
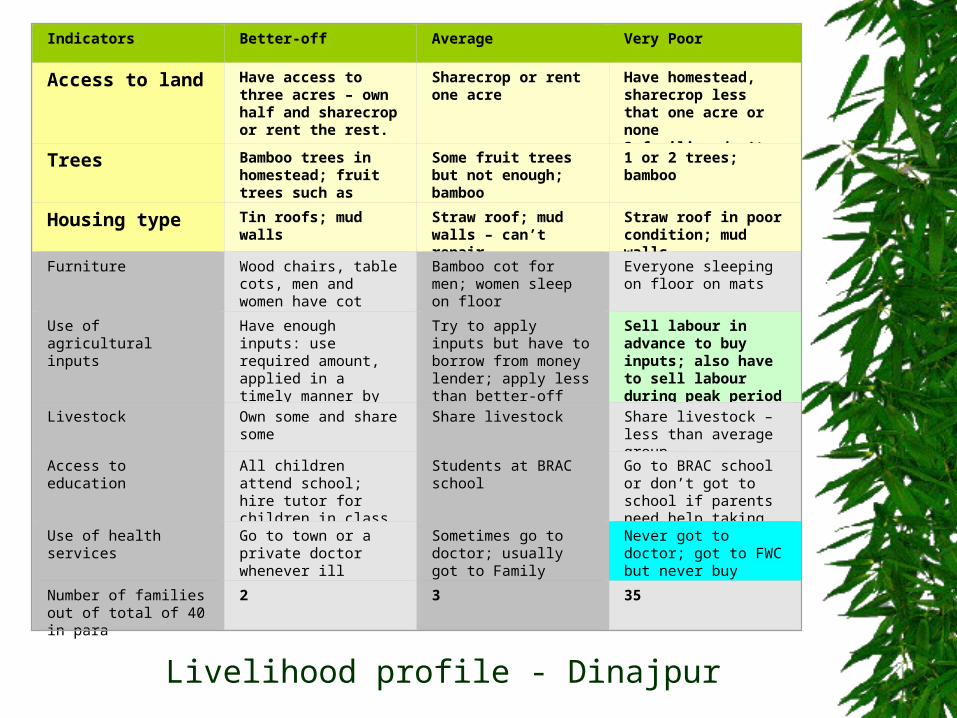
Indicators Better-off Average Very Poor
Access to land Have access to three acres – own half and sharecrop or rent the rest.
Sharecrop or rent one acre
Have homestead, sharecrop less that one acre or none3 families don’t even have homestead.Trees Bamboo trees in
homestead; fruit trees such as mango and jack fruit
Some fruit trees but not enough; bamboo
1 or 2 trees; bamboo
Housing type Tin roofs; mud walls
Straw roof; mud walls – can’t repair
Straw roof in poor condition; mud walls
Furniture Wood chairs, table cots, men and women have cot
Bamboo cot for men; women sleep on floor
Everyone sleeping on floor on mats
Use of agricultural inputs
Have enough inputs: use required amount, applied in a timely manner by hired labour
Try to apply inputs but have to borrow from money lender; apply less than better-off group
Sell labour in advance to buy inputs; also have to sell labour during peak period so cannot apply inputs on time; sometimes don’t apply any inputs
Livestock Own some and share some
Share livestock Share livestock – less than average group
Access to education All children attend school; hire tutor for children in class five and six
Students at BRAC school
Go to BRAC school or don’t got to school if parents need help taking care of livestock while they are working
Use of health services Go to town or a private doctor whenever ill
Sometimes go to doctor; usually got to Family Welfare Centre (FWC)
Never got to doctor; got to FWC but never buy prescription
Number of families out of total of 40 in para
2 3 35
Livelihood profile - Dinajpur
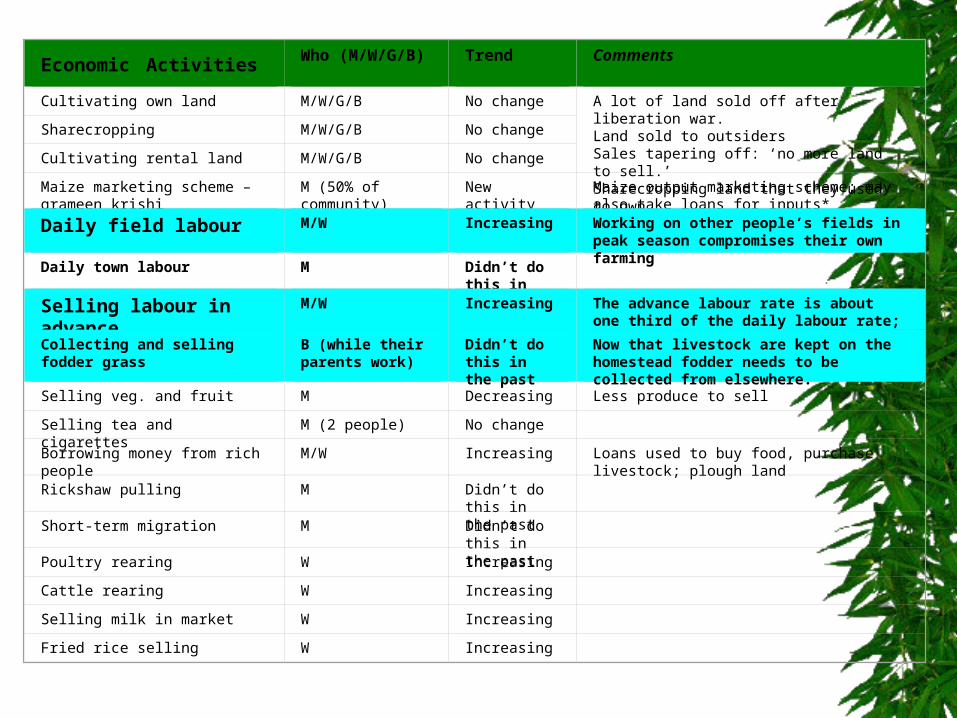
Economic Activities Who (M/W/G/B) Trend Comments
Cultivating own land M/W/G/B No change A lot of land sold off after liberation war.Land sold to outsiders Sales tapering off: ‘no more land to sell.’Sharecropping land that they used to own
Sharecropping M/W/G/B No change
Cultivating rental land M/W/G/B No change
Maize marketing scheme – grameen krishi
M (50% of community)
New activity since last year
Maize output marketing scheme; may also take loans for inputs*
Daily field labour M/W Increasing Working on other people’s fields in peak season compromises their own farming
Daily town labour M Didn’t do this in the past
Selling labour in advance M/W Increasing The advance labour rate is about one third of the daily labour rate; this is a coping strategy Collecting and selling fodder
grassB (while their parents work)
Didn’t do this in the past
Now that livestock are kept on the homestead fodder needs to be collected from elsewhere.
Selling veg. and fruit M Decreasing Less produce to sell
Selling tea and cigarettes M (2 people) No change
Borrowing money from rich people M/W Increasing Loans used to buy food, purchase livestock; plough land
Rickshaw pulling M Didn’t do this in the past
Short-term migration M Didn’t do this in the past
Poultry rearing W Increasing
Cattle rearing W Increasing
Selling milk in market W Increasing
Fried rice selling W Increasing
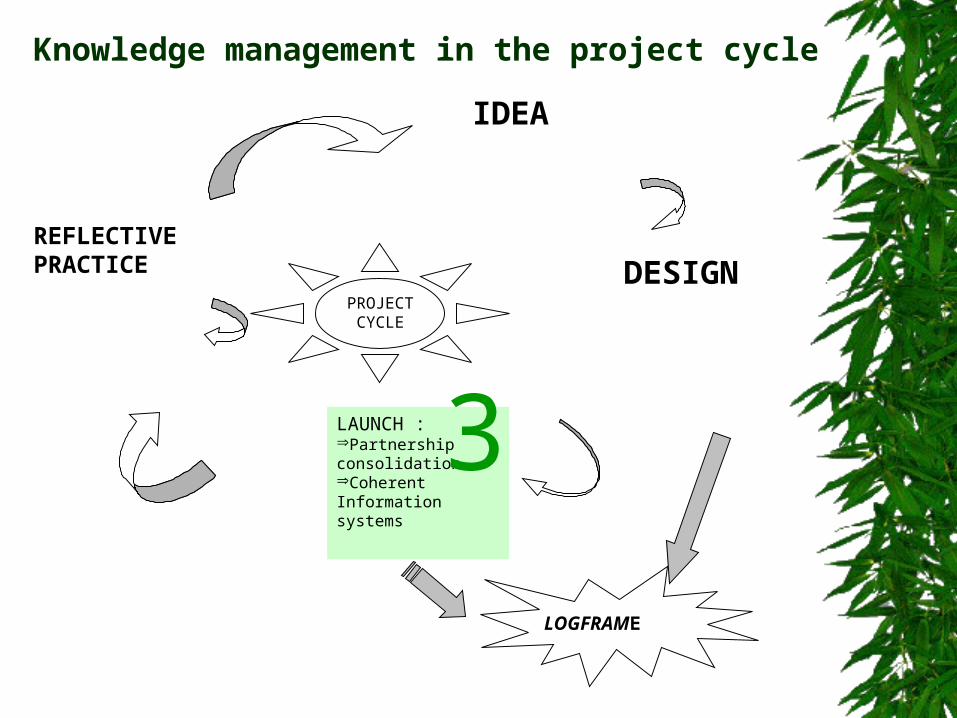
IDEA
DESIGN
LAUNCH :Partnership consolidationCoherent Information systems
REFLECTIVE PRACTICE
LOGFRAME
PROJECT CYCLE
Knowledge management in the project cycle
3
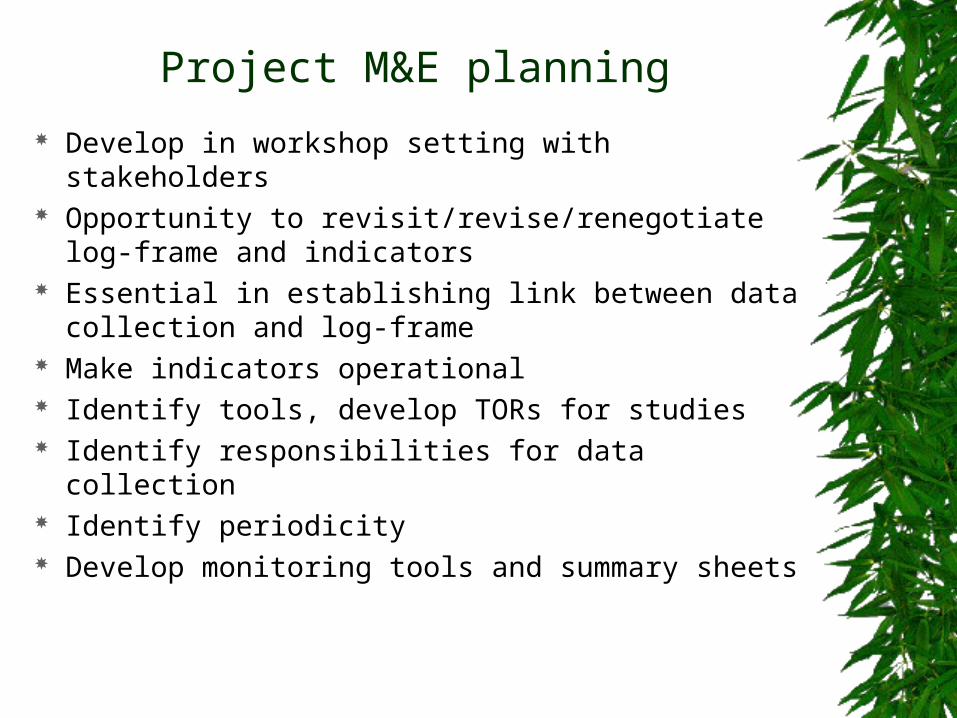
Project M&E planning
Develop in workshop setting with stakeholders Opportunity to revisit/revise/renegotiate log-frame
and indicators Essential in establishing link between data
collection and log-frame Make indicators operational Identify tools, develop TORs for studies Identify responsibilities for data collection Identify periodicity Develop monitoring tools and summary sheets
IDEA
DESIGN
LAUNCH
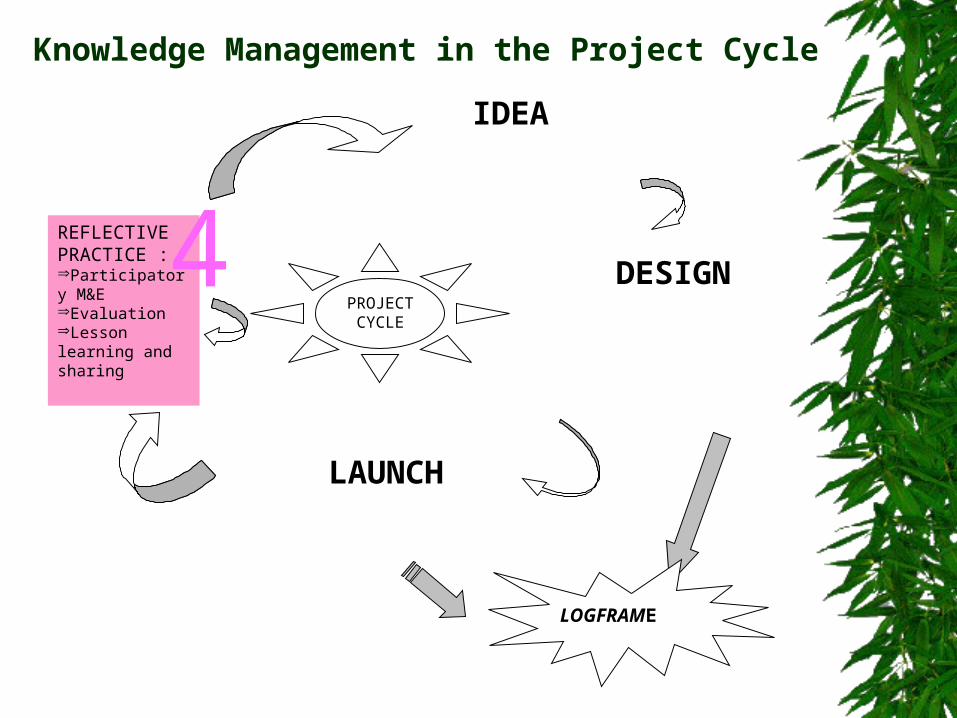
REFLECTIVE PRACTICE :Participatory M&EEvaluationLesson learning and sharing
LOGFRAME
PROJECT CYCLE
Knowledge Management in the Project Cycle
4
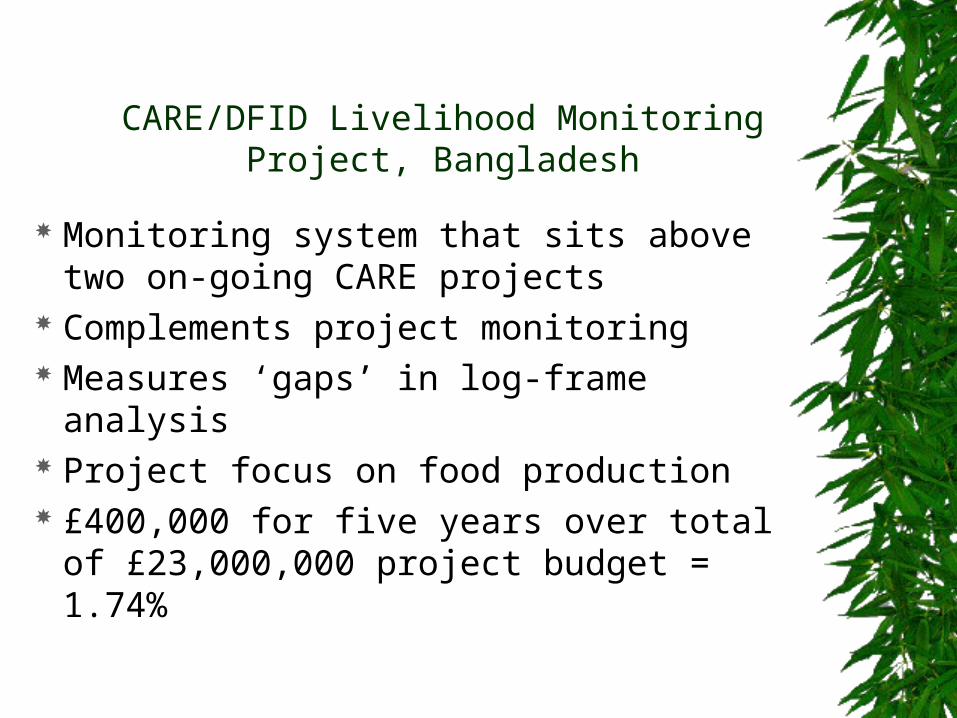
CARE/DFID Livelihood Monitoring Project, Bangladesh
Monitoring system that sits above two on-going CARE projects
Complements project monitoring Measures ‘gaps’ in log-frame analysis Project focus on food production £400,000 for five years over total of
£23,000,000 project budget = 1.74%
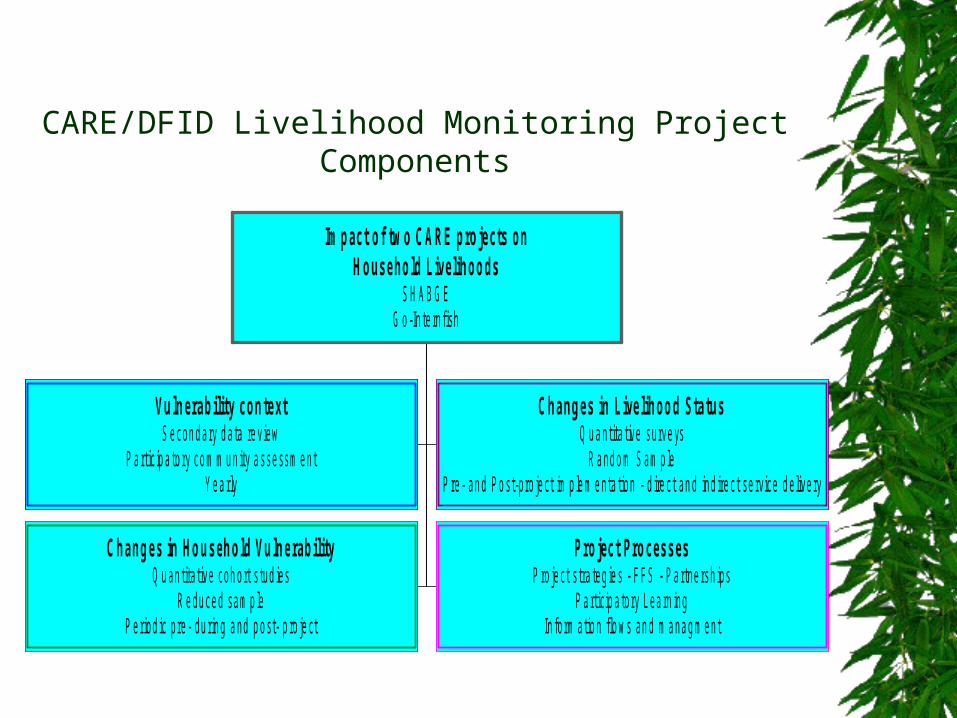
CARE/DFID Livelihood Monitoring Project Components
V u ln erab ility con textS e con d ary d a ta re v iew
P a rtic ip a to ry co m m u n ity a sse ssm e ntY e a rly
C h ang es in L ive lih oo d Sta tusQ u a ntita t ive su rve ys
R a nd o m S am p leP re - an d P o s t-p ro je ct im p le m e nta tion - d ire c t an d ind ire c t se rvice d e live ry
C h ang es in Ho u seh o ld V u ln erab ilityQ u an tita t ive coh o rt s tud ies
R e du ce d sam p leP e riod ic p re - du ring a nd p o st- p ro je ct
P ro jec t Pro cessesP ro je ct s tra teg ie s - F F S - P a rtne rsh ips
P a rtic ip a to ry L ea rn ingIn fo rm atio n f lo w s an d m a na g m e nt
Im p ac t o f tw o C A RE p ro jects onH o useho ld L ivelih oo ds
S H A B G EG o -In te rn fish