Design of a Brain-Computer System to Measure Brain Activity during a Dolphin-Assisted Therapy using the TGAM1 EEG Sensor Jaime Moreno 1 , Oswaldo Morales 1 , Liliana Chanona 1 , Ricardo Tejeida 2 , Pedro Flores 3 , V´ ıctor Calder´ on 4 1 Instituto Polit´ ecnico Nacional, ESIME, Zacatenco, Mexico 2 Instituto Polit´ ecnico Nacional, EST, Mexico 3 Secretar´ ıa de Salud, Mexico 4 Delfiniti, S.A. de C.V. Ixtapa, Mexico [email protected]Abstract. The recent proliferation of sensors technology applications in therapies to children disabilities to promote positive behavior among such children has produced optimistic results in developing a variety of skills and abilities in them. Dolphin-Assisted Therapy (DAT) has also become a topic of public and research interest for these disorders intervention and treatment. This work exposes the development of a system that controls brain-computer interaction when a patient with different abilities takes a DAT. The study was carried out at Definiti Ixtapa facilities and shows that brain activity increases by 376% during a DAT. A TAGM1 sensor was used to develop the system, which is connected to the Bluetooth 4.0 communication protocol, which is isolated from environmental condi- tions, which is brackish and humid. In this way, we explore the behavior of Obsessive Compulsive Disorder and neurotypic children using Fast Fourier Transform (FFT) from Electroencephalogram (EEG). Keywords: artificial intelligence, EEG, FFT, TGAM1, dolphin-assisted therapy, BCI. 1 Introduction Dolphins have had a therapeutic effect in the treatment of a number of human race conditions, both psychological and physical. Underwater communication sounds made by the dolphins play a part in this therapeutic effect. Dolphins appear to sense electrical fields from humans and attempt to communicate using the same frequencies. This has generated several aspects: (a) dolphin acoustic emissions, recorded in sea water, may bring about modifications in human brain- wave activity, (b) dolphin interaction may give patients pain relief due to the increased release of hormones into the blood, (c) dolphin interaction may produce complex neurological, (d) stimulation which helps relaxation, helps reduce stress levels and thereby strengthens the immune system, and (e) dolphin’s ultrasonic 139 ISSN 1870-4069 Research in Computing Science 148(11), 2019 pp. 139–151; rec. 2019-06-18; acc. 2019-08-10
Transcript
Design of a Brain-Computer System to MeasureBrain Activity during a Dolphin-AssistedTherapy using the TGAM1 EEG Sensor
Abstract. The recent proliferation of sensors technology applications intherapies to children disabilities to promote positive behavior among suchchildren has produced optimistic results in developing a variety of skillsand abilities in them. Dolphin-Assisted Therapy (DAT) has also becomea topic of public and research interest for these disorders intervention andtreatment. This work exposes the development of a system that controlsbrain-computer interaction when a patient with different abilities takesa DAT. The study was carried out at Definiti Ixtapa facilities and showsthat brain activity increases by 376% during a DAT. A TAGM1 sensorwas used to develop the system, which is connected to the Bluetooth 4.0communication protocol, which is isolated from environmental condi-tions, which is brackish and humid. In this way, we explore the behaviorof Obsessive Compulsive Disorder and neurotypic children using FastFourier Transform (FFT) from Electroencephalogram (EEG).
Dolphins have had a therapeutic effect in the treatment of a number of humanrace conditions, both psychological and physical. Underwater communicationsounds made by the dolphins play a part in this therapeutic effect. Dolphinsappear to sense electrical fields from humans and attempt to communicate usingthe same frequencies. This has generated several aspects: (a) dolphin acousticemissions, recorded in sea water, may bring about modifications in human brain-wave activity, (b) dolphin interaction may give patients pain relief due to theincreased release of hormones into the blood, (c) dolphin interaction may producecomplex neurological, (d) stimulation which helps relaxation, helps reduce stresslevels and thereby strengthens the immune system, and (e) dolphin’s ultrasonic
139
ISSN 1870-4069
Research in Computing Science 148(11), 2019pp. 139–151; rec. 2019-06-18; acc. 2019-08-10
energy may cause significant cellular changes within the living tissue of thecentral nervous system [3].
Based on the above aspects, there has been developed an alternate treatmentfor people with diverse psychological and physical disabilities or disorders likeAutism, Attention Deficit, Down Syndrome, Infantile Cerebral Palsy, and Ob-sessive Compulsive Disorder. This treatment is called Dolphin-Assisted Therapy(DAT). DAT is a growing area of interest to the general public, with reports ofpain relief, extinction of depression and improved learning in children with dif-ferent disabilities. [2]. DAT aims to improve functioning through complementingand reinforcing existing therapies, rather than replacing them [3].
In case of Obsessive Compulsive Disorder (OCD), this is characterized byintrusive, troubling thoughts (obsessions), and repetitive, ritualistic behaviors(compulsions) which are time consuming, significantly impair functioning and/orcause distress. When an obsession occurs, it almost always corresponds with amassive increase in anxiety and distress. Common obsessions include contamina-tion fears, worries about harm to self or others, the need for symmetry, exactnessand order, religious/moralistic concerns, forbidden thoughts (e.g., sexual or ag-gressive), or a need to seek reassurance or confess. Common compulsions include:cleaning/washing, checking, counting, repeating, straightening, routinized be-haviors, confessing, praying, seeking reassurance, touching, tapping or rubbing,and avoidance. Unlike in adults, children need not view their symptoms asnonsensical to meet diagnostic criteria [6].
Younger children will not be able to recognize that their obsessions andcompulsions are both unnecessary (e.g., you don’t really need to wash yourhands) and extreme (e.g., washing hands for 15-20 times is fine, but 5 minin scalding water is too much) in nature. In young children, compulsions oftenoccur without the patient being able to report their obsessions, while adolescentsare often able to report multiple obsessions and compulsions. Children andadolescents are also more likely to include family members in their rituals andcan be highly demanding of adherence to rituals and rules, leading to disruptiveand oppositional behavior and even episodes of rage [6].
A way the estimate the efficiency of DAT in children with different disabilitiessuch as OCD is to observe changes in the children’ brainwave activity fromElectroencephalogram signals recorded before and during a session of DAT.
The electroencephalography (EEG) recorded from scalp give rise to the studyof human cognitive activity through the measure of neurons’ electrical impulses.At the beginning, the EEG data were often collected with the use of multipleelectrodes and/or wired EEG headset to retain signal accuracy and spatial reso-lution, which greatly diminishes the mobility and actual application pragmatism.To facilitate a mobile driver safety program, [8] demonstrated the effectivenessof wireless single-channel (electrode) EEG headset NeuroSky’s MindWave indistinguish user’s eyes conditions – open or closed.
Research in Computing Science 148(11), 2019 ISSN 1870-4069
2 Related Work
For a System Artificial Intelligence is defined, it must include a model of thephysical environment in which it is to operate [12]. In our case, we develop amodel that measures the brain activity (physical feature) and the meaning ofits behavioural changes. Thus, this proposal can be considered as an ArtificialIntelligence model since it incorporates the knowledge of the domain of theapplication (in this case, in Neuroscience) to be able to measure the efficiencyof the DAT from the study of biosignals.
For the study of these biosignals, it is necessary to use a Brain ComputerInterface (BCI). In this way, BCI research programs have arisen due to moreunderstanding of brain functions and powerful low cost computer equipment.Under BCI, the users can communicate with environments and the externaldevices through their brain activities. In particular, people suffering from dis-abilities like Obsessive Compulsive Disorder (OCD) have growing number ofdemands and needs of such system. The goal of these BCI systems are totranslate the neuro-physiological signals for controlling the external devices.For acquiring the brain dynamics, electroencephalography (EEG) is relativelyconvenient, comfortable, and inexpensive [10].
To get the rid out of economical loss, but still taking in account the im-provement in the reliability, accuracy, latency and false alarm rate, [4] have usedthe TAGM1 sensor as a probe to detect the brain wave pattern of the user anddesigned filter and threshold algorithm to detect driver’s fatigues and drowsinessindex with low cost and high reliability.
The aims of this work is trying to create a brain-computer system basedon EEG. In this paper is developed a system to analyze and measure the bothObsessive Compulsive Disorder and neurotypic children brain activity during aDAT using the TGAM1 EEG signal sensor. Moreover, we measure, in a novelway, the Power Spectrum Density from EEG by means of BCI system, in orderto estimate really changes in the children’ brainwave activity recorded before,during and after a session of DAT. This paper is divided as follows: Section 3introduces the system and architecture of BCI communication system; Section 4describes the way we measure the brain activity before and during DAT; Section5 shows the results and discussion and Section 6 is the conclusion.
3 Theoretical Framework
3.1 Electroencephalography
The brain is made up of hundreds of thousands of cells called neurons, whichinteract with each other in a bioelectrical phenomenon called synapses; By meansof impulses that are transmitted around the membrane, information is sent thathelps the brain to coordinate sensory, motor and cognitive functions. The activityof the present electric field can be manifested by a lapse of tens to hundreds ofmilliseconds, which is sufficient for equipment such as electroencephalographs,
141
Design of a Brain-Computer System to Measure Brain Activity during a Dolphin-Assisted ...
Research in Computing Science 148(11), 2019ISSN 1870-4069
which use non-invasive electrodes on the cranial surface, to detect and recordsuch activity.
Electroencephalography (EEG) studies, compared with other imaging tech-niques or behavioral observations, have advantages because of their excellenttime resolution since several records can be taken in a second through multiplesensors. Other studies, such as MagnetoEncephaloGraphy (MEG), record theelectric field activity generated by the neurons, have excellent resolution in time,but require large, stationary and expensive detectors, in addition to their main-tenance and special training to operate such equipment. Functional MagneticResonance Imaging (fMRI) measures the change in blood flow associated withneuronal activity, since oxygenated blood, in comparison to the rest, causesmagnetic distortions that are generated by the protons present in it, thereforefMRI has an excellent spatial resolution. Since human neuronal activity has ahigh degree of complexity in its nature, neuronal oscillations can be measuredas a mixture of several underlying base frequencies, which reflect certain cogni-tive, attentional and affective states. These oscillations were defined in specificfrequency ranges: delta, theta, alpha, beta and gamma.
– Delta (0.5-4 Hz): This type of wave has been examined during periods ofdeep sleep, locating its point of greater power in the right hemisphere of thebrain. Since sleep is associated with the consolidation of memory, it plays acentral role in learning functions. Its amplitude varies from 20 - 200 µV .
– Theta (4-8 Hz): Some studies report that the activity of this wave is related tocognitive activities such as: selective attention, assimilation of information,processing, learning and working memory. You can have a better record fromthe prefrontal, central, parietal and temporal zones. Its amplitude varies from20 - 100 µV .
– This oscillatory rhythmic activity is involved when there is a response tosensory stimuli, motor and memory functions. High levels of alpha can benoted when there is relaxation with closed eyes, the suppression of alphaimplies a characteristic signature of mental states of interest, for example,when there is sustained attention to any type of stimulus at a particulartime. Its amplitude varies from 20 - 60 µV and the source of activation ofthese signals is in the occipital region of the brain
– Beta (12-25 Hz: This frequency is generated both in the occipital and frontalregions, it is associated with the states of active thinking, motor functions,visual and spatial coordination, anxiety and concentration. Its amplitudevaries from 2 - 20 µV .
– Gamma (more than 25 Hz): They tend to have the highest frequency andthe lowest amplitude. So far there is no strong association of what this typeof waves reflect in the brain, there are some researchers who suggest beingthe reflection of the interconnection of several sensory responses to an objectin a coherent way, therefore, represent a process of attention due to intensebrain activities. On the other hand, others think that it is the effect of neuralprocesses to achieve vision control, and, therefore, it would not represent acognitive process after all.
Research in Computing Science 148(11), 2019 ISSN 1870-4069
There is discussion to date about a cerebral rhythm called mu (µ), its fre-quency band covers practically the same as alpha, however, it is only observedin the sensory-motor cortex.
3.2 Electroencephalography Sensor: TGAM1
MindWave Mobile by NeuroSky (Figure 1 (b)) is Brain Computer Interface (BCI)in a headband that captures the EGG waves (Figure 1 (a)) and the eye blink ofan user[7]. This device is an interesting for developers because they can programpowerfull algorithms with an interface to connect to mobile devices easily andbe able to use it in research applications [11].
Fig. 1. (a) Types of EEG waves and (b) NeuroSky Mindwave Mobile.
From Figure 2, NeuroSky Mindwave Mobile can be divided in four parts:
NeuroSky’s EEG biosensor digitizes and amplifies raw analog brain signalsto deliver concise inputs the most important features of this biosensor are thefollowing:
– Direct connect to dry electrode since it does not need a special solution orgel,
– One EEG channel, Reference, and Ground,– Extremely low-level signal detection,– Advanced filter with high noise immunity, and– RAW EEG at 512Hz.
The code that may appear in the ThinkGear packets are listed in the Table1.
TGAM1 has configuration pads that can be used to change two defaultsettings that are applied at chip power up. The configuration pads are located on
143
Design of a Brain-Computer System to Measure Brain Activity during a Dolphin-Assisted ...
Research in Computing Science 148(11), 2019ISSN 1870-4069
(a) DryElectrode.
(b) Referenceand GroundElectrodes.
(c) EEG biosensor TGAM1 with Communica-tion Module.
Fig. 2. NeuroSky Mindwave Mobile system main parts.
the backside of the TGAM1, as indicated by the red square in Figure 3(a). FromTable 2, the BR0 and BR1 pads configure the output baud rate and data content,after the TGAM1 powers up. The M pad configure the notch filter frequency.Normal Output mode includes the following output: poor quality value, EEGvalue, Attention value and Meditation value.
A magnified picture of the B1 and B0 pads are shown in Figure 3(b). The firstrow of pads are GND and third row of pads are VCC. The TGAM1 output baudrate and data content after power up behavior depends on the pad setting asdescribed in table above. For example, the stuff option in the module in Figure3(a) has both BR1 and BR0 tie to GND pads for a 9600 baud with NormalOutput Mode.
The baud rate can also be configured after the module is powered up bysending commands through the UART interface. The commands are listed inthe Table 3. When the module is reset, the baud rate setting will revert back tothe default set by BR0 and BR1.
TGAM1’s notch filter frequency can be configured with the M configuration
Research in Computing Science 148(11), 2019 ISSN 1870-4069
(a) Main Pads (b) B0 and B1. (c) M.
Fig. 3. Configuration pads in TGAM1 chip.
Table 2. Configuration pads.
BR1 BR0 Function
GND GND 9600 Baud with Normal Output ModeGND VCC 1200 Baud with Normal Output ModeVCC GND 57.6k Baud with Normal + Raw Output ModeVCC VCC N/A
Table 3. Baud rate configuration.
Command Function
0x00 9600 Baud with Normal Output Mode0x01 1200 Baud with Normal Output Mode0x02 57.6k Baud with Normal + Raw Output Mode
pads. It is used to select either 50Hz or 60Hz to reduce the AC noise specific toa targeted market. As indicated in Figure 3(c), the top pad is GND and bottompad is VCC. Tie the M pad to VCC pad to select 60Hz, and to GND pad toselect 50Hz notch filtering frequency.
Unlike the BR0, BR1 configuration, there is no equivalent software con-figuration for the M configuration. The most common stuff option for theseconfiguration pads are illustrated in Figure 3(a), configuring the TGAM1 for9600 Baud, normal output and 60Hz notch filtering frequency.
3.3 Filtering Biosignals using Fast Fourier Transform
The Fast Fourier Transform (FFT) algorithm is based on the method known assuccessive bending. It is defined by Equation 1 as:
Fu =1
2 ·M
[N−1∑x=0
(ax · w (u, x))
], (1)
145
Design of a Brain-Computer System to Measure Brain Activity during a Dolphin-Assisted ...
Research in Computing Science 148(11), 2019ISSN 1870-4069
where w (u, x) can be defined by Equation 2 as following:
w(u, x) = e(−j·2·u·π·x2 ). (2)
The result of the transformation is represented in a vector called F of sub-script u. The value N is the amount of element of the sample, M is half of N .The values of the sample are loaded in the vector called ax and x represents thesubscript. Equations 3 and 4 are obtained from Equation 1:
Fevenu =1
M·
[M−1∑x=0
(a2·x · w1 (u, x))
], (3)
Foddu =1
M·
[M−1∑x=0
(a2·(x+1) · w1 (u, x)
)]. (4)
All the even subscripts of x belonging to ax are grouped in the vector Fevenand the odd ones in the vector Fodd. In this case w1 (u, x) is defined by Equation5 as:
w1 (u, x) = e
(−j·2·u·u·xN
2
). (5)
Frequently, the relevant information of a signal has a characteristic wavethat is known in a general way, for this it is possible to obtain time seriescontaining this information, later study measures of relations between signals inboth the time domain and the frequency (correlation or crossed spectrum) andmore complex transformations for the extraction of characteristics.
In the case of EEG signal analysis, considering the time plotted on the Xaxis and the voltage on the Y axis; The Fast Fourier Transform transforms thesignal from the time domain to the frequency. Basically what is done duringthis transformation is to examine the raw data of the signal how much can beapproximated to sine waves consisting of pure frequencies, that is, free of redun-dancy; the more they adjust, the greater their correlation. Since the frequenciesof the human brain associated with affective and cognitive activities are in therange of 0.5-60 Hz, an analysis by the FFT gives a lot of relevant information,for example, if a person is in a general state of concentration (theta band) orthe response of their neuronal activity describes a dream state (delta band).
To implement the FFT in the microcontroller it is necessary to implementFeven and Fodd. We used MatLab 2018b to implement both the programmingof the embedded devices and the analysis of these signals.
Research in Computing Science 148(11), 2019 ISSN 1870-4069
4 Measuring Brain Activity during a Dolphin-assistedTherapy: DAT-TGAM1 System
4.1 Designing of the Waterproof Case
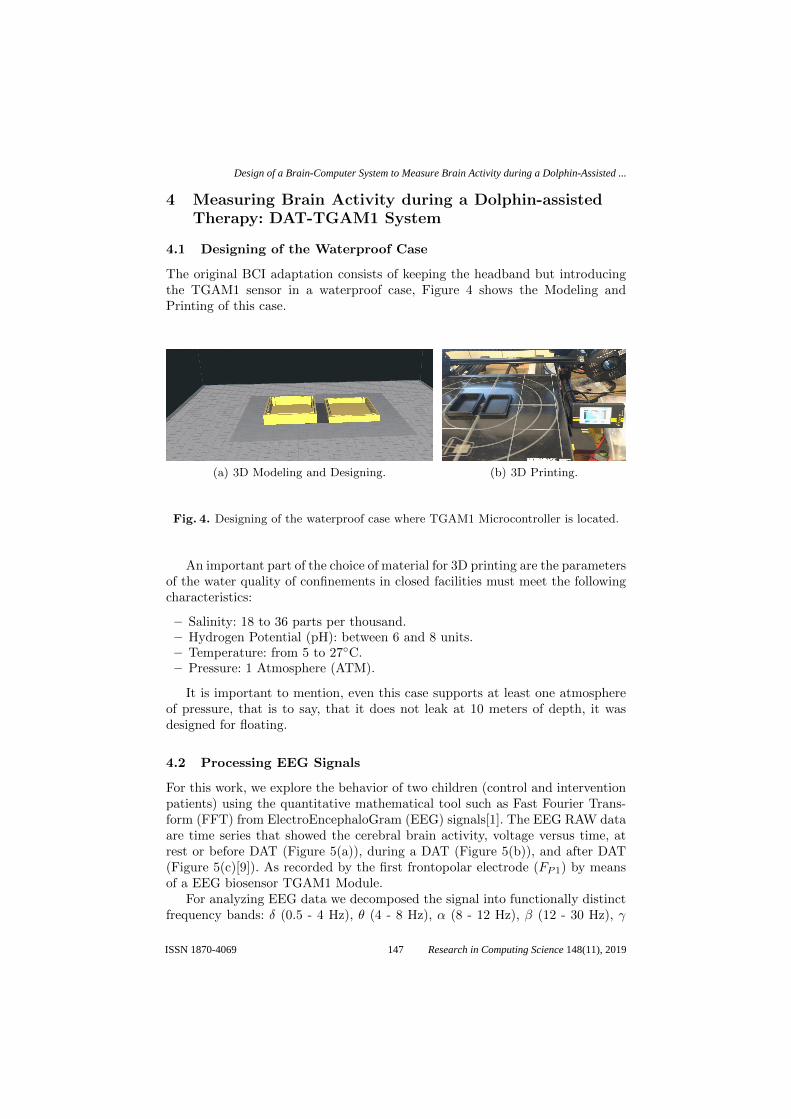
The original BCI adaptation consists of keeping the headband but introducingthe TGAM1 sensor in a waterproof case, Figure 4 shows the Modeling andPrinting of this case.
(a) 3D Modeling and Designing. (b) 3D Printing.
Fig. 4. Designing of the waterproof case where TGAM1 Microcontroller is located.
An important part of the choice of material for 3D printing are the parametersof the water quality of confinements in closed facilities must meet the followingcharacteristics:
– Salinity: 18 to 36 parts per thousand.– Hydrogen Potential (pH): between 6 and 8 units.– Temperature: from 5 to 27◦C.– Pressure: 1 Atmosphere (ATM).
It is important to mention, even this case supports at least one atmosphereof pressure, that is to say, that it does not leak at 10 meters of depth, it wasdesigned for floating.
4.2 Processing EEG Signals
For this work, we explore the behavior of two children (control and interventionpatients) using the quantitative mathematical tool such as Fast Fourier Trans-form (FFT) from ElectroEncephaloGram (EEG) signals[1]. The EEG RAW dataare time series that showed the cerebral brain activity, voltage versus time, atrest or before DAT (Figure 5(a)), during a DAT (Figure 5(b)), and after DAT(Figure 5(c)[9]). As recorded by the first frontopolar electrode (FP1) by meansof a EEG biosensor TGAM1 Module.
For analyzing EEG data we decomposed the signal into functionally distinctfrequency bands: δ (0.5 - 4 Hz), θ (4 - 8 Hz), α (8 - 12 Hz), β (12 - 30 Hz), γ
147
Design of a Brain-Computer System to Measure Brain Activity during a Dolphin-Assisted ...
Research in Computing Science 148(11), 2019ISSN 1870-4069
(a) Before DAT (b) During DAT (c) After DAT.
Fig. 5. Method of obtaining EEG RAW samples.
(30 - 60 Hz), and All Bands (0.5 - 60 Hz) through FFT, in order to obtain anestimate of the Power Spectral Density (PSD), expressed in µV olts/Hz[5].
5 Experimental Results
5.1 Initial Conditions
The main goal of this proposal is to test our BCI when a patient who has a prob-lem in neurodevelopment, we have chosen a patient with Obsessive CompulsiveDisorder (OCD), who is taking a Dolphin Assisted Therapy (DAT). The wholesystem is subdivided into three fundamental parts:
1. Female dolphin of the bottle nose species2. Patient with OCD.3. DAT-TGAM1 system.
All three subsystems interact in order to determine if DAT is effective forOCD patients
5.2 Results
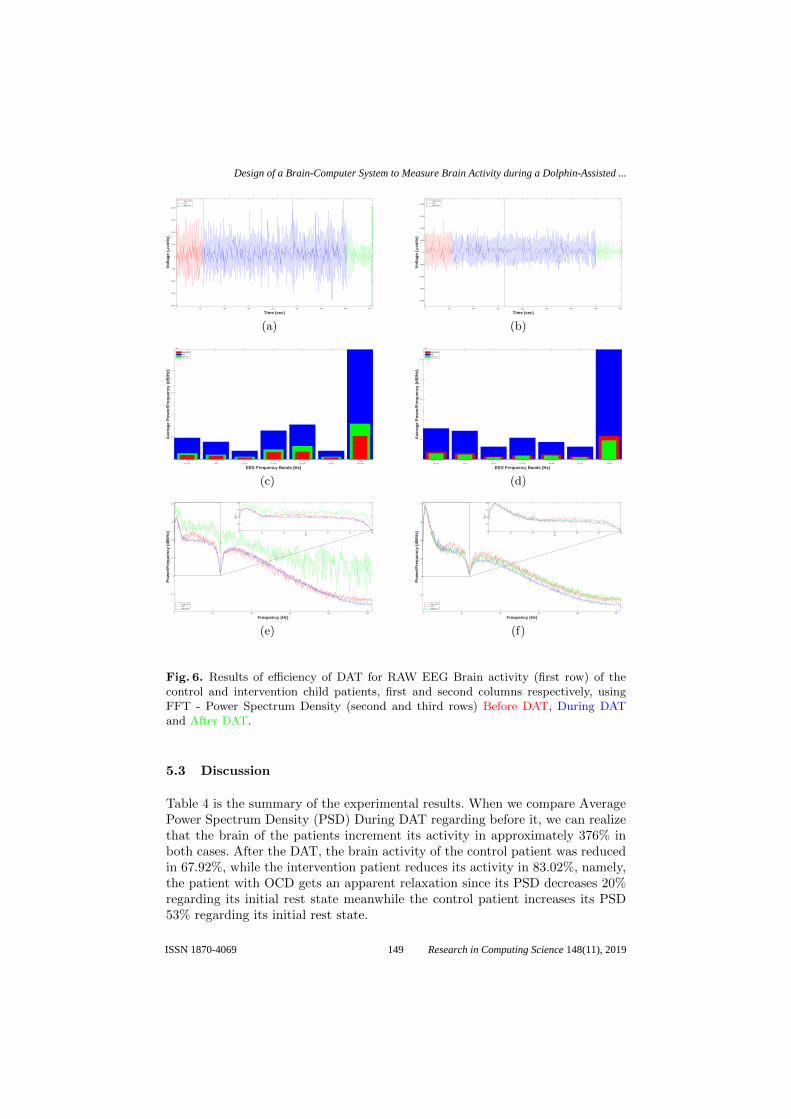
Figure 6 shows the results of our experiments for measuring the efficiency of DATfor RAW EEG Brain activity (first row) of the control and intervention childpatients, first and second columns respectively, using FFT - Power SpectrumDensity (second and third rows) Before DAT, During DAT and After DAT.In this image we can realize that there are meaningful changes in behaviorexperienced by these two-treated children. Figures 6(a) and 6(b) show thatthere is a higher brain activity during DAT than Before or After, namely, FFTanalysis points out an average great increment of 376% in the average powerspectral density of data in both patients during the DAT respect to before it,which yields the increment on every spectral band, Figures 6(c) and 6(d). WhileFigures 6(e) and 6(f) show the entire power spectral density from 0 to 256 Hz(half of δt) and it can be noticed that the overall power is higher in all caseswhen a DAT is developed.
Research in Computing Science 148(11), 2019 ISSN 1870-4069
0 50 100 150 200 250 300 350 400
Time (sec)
-2000
-1500
-1000
-500
0
500
1000
1500
2000
Vo
ltag
e (
volt
s)
Before DATDATAfter DAT
(a)
0 50 100 150 200 250 300 350 400
Time (sec)
-4000
-3000
-2000
-1000
0
1000
2000
3000
4000
Vo
ltag
e (
volt
s)
Before DATDATAfter DAT
(b)
Total
EEG Frequency Bands (Hz)
0
0.5
1
1.5
2
Ave
rag
e P
ow
er/F
req
uen
cy (
dB
/Hz)
108
Before DATDATAfter DAT
(c)
Total
EEG Frequency Bands (Hz)
0
0.5
1
1.5
2
2.5
Ave
rag
e P
ow
er/F
req
uen
cy (
dB
/Hz)
108
Before DATDATAfter DAT
(d)
0 50 100 150 200 250
Frequency (Hz)
-10
0
10
20
30
40
Po
wer
/Fre
qu
ency
(d
B/H
z)
Before DATDATAfter DAT
0 10 20 30 40 50 60Hz
0
10
20
30
40
dB/H
z
(e)
0 50 100 150 200 250
Frequency (Hz)
-10
0
10
20
30
40
Po
wer
/Fre
qu
ency
(d
B/H
z)
Before DATDATAfter DAT
0 10 20 30 40 50 60Hz
0
10
20
30
40
dB/H
z
(f)
Fig. 6. Results of efficiency of DAT for RAW EEG Brain activity (first row) of thecontrol and intervention child patients, first and second columns respectively, usingFFT - Power Spectrum Density (second and third rows) Before DAT, During DATand After DAT.
5.3 Discussion
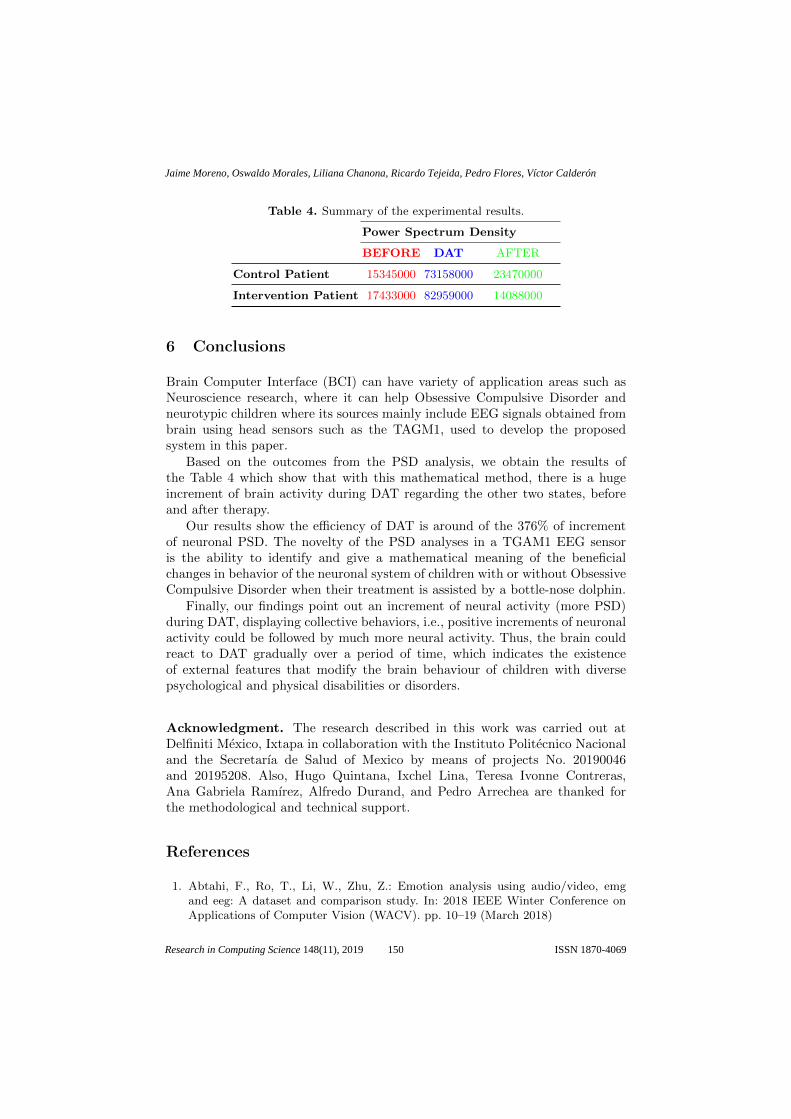
Table 4 is the summary of the experimental results. When we compare AveragePower Spectrum Density (PSD) During DAT regarding before it, we can realizethat the brain of the patients increment its activity in approximately 376% inboth cases. After the DAT, the brain activity of the control patient was reducedin 67.92%, while the intervention patient reduces its activity in 83.02%, namely,the patient with OCD gets an apparent relaxation since its PSD decreases 20%regarding its initial rest state meanwhile the control patient increases its PSD53% regarding its initial rest state.
149
Design of a Brain-Computer System to Measure Brain Activity during a Dolphin-Assisted ...
Research in Computing Science 148(11), 2019ISSN 1870-4069
Table 4. Summary of the experimental results.
Power Spectrum Density
BEFORE DAT AFTER
Control Patient 15345000 73158000 23470000
Intervention Patient 17433000 82959000 14088000
6 Conclusions
Brain Computer Interface (BCI) can have variety of application areas such asNeuroscience research, where it can help Obsessive Compulsive Disorder andneurotypic children where its sources mainly include EEG signals obtained frombrain using head sensors such as the TAGM1, used to develop the proposedsystem in this paper.
Based on the outcomes from the PSD analysis, we obtain the results ofthe Table 4 which show that with this mathematical method, there is a hugeincrement of brain activity during DAT regarding the other two states, beforeand after therapy.
Our results show the efficiency of DAT is around of the 376% of incrementof neuronal PSD. The novelty of the PSD analyses in a TGAM1 EEG sensoris the ability to identify and give a mathematical meaning of the beneficialchanges in behavior of the neuronal system of children with or without ObsessiveCompulsive Disorder when their treatment is assisted by a bottle-nose dolphin.
Finally, our findings point out an increment of neural activity (more PSD)during DAT, displaying collective behaviors, i.e., positive increments of neuronalactivity could be followed by much more neural activity. Thus, the brain couldreact to DAT gradually over a period of time, which indicates the existenceof external features that modify the brain behaviour of children with diversepsychological and physical disabilities or disorders.
Acknowledgment. The research described in this work was carried out atDelfiniti Mexico, Ixtapa in collaboration with the Instituto Politecnico Nacionaland the Secretarıa de Salud of Mexico by means of projects No. 20190046and 20195208. Also, Hugo Quintana, Ixchel Lina, Teresa Ivonne Contreras,Ana Gabriela Ramırez, Alfredo Durand, and Pedro Arrechea are thanked forthe methodological and technical support.
References
1. Abtahi, F., Ro, T., Li, W., Zhu, Z.: Emotion analysis using audio/video, emgand eeg: A dataset and comparison study. In: 2018 IEEE Winter Conference onApplications of Computer Vision (WACV). pp. 10–19 (March 2018)
Research in Computing Science 148(11), 2019 ISSN 1870-4069
2. Birch, S.: Dolphin sonar pulse intervals and human resonance characteristics. In:Proceedings of the 2nd International Conference on Bioelectromagnetism (Cat.No.98TH8269). pp. 141–142 (Feb 1998)
3. Chengwei, L., Xiaoming, H., Limei, Z.: The study on brain paralysis ultrasonictherapy instrument simulating dolphin. In: 2005 IEEE Engineering in Medicineand Biology 27th Annual Conference. pp. 6056–6059 (Jan 2005)
4. Joshi, D.H., Jaliya, U.K., Thakore, D.G.: A.r.g.o.s: Alertness rating gamma brain-wave observation system. In: 2016 International Conference on Data Mining andAdvanced Computing (SAPIENCE). pp. 374–377 (March 2016)
5. Kantelhardt, J.W., Tismer, S., Gans, F., Schumann, A.Y., Penzel, T.: Scalingbehavior of eeg amplitude and frequency time series across sleep stages. EPL(Europhysics Letters) 112(1), 18001 (October 2015)
6. Lack, C.: Obsessive-compulsive disorder: Evidence-based treatments and futuredirections for research. World journal of psychiatry 2, 86–90 (12 2012)
7. Li, K.G., Shapiai, M.I., Adam, A., Ibrahim, Z.: Feature scaling for eeg humanconcentration using particle swarm optimization. In: 2016 8th International Con-ference on Information Technology and Electrical Engineering (ICITEE). pp. 1–6(Oct 2016)
8. Lim, C.K.A., Chia, W.C., Chin, S.W.: A mobile driver safety system: Analysis ofsingle-channel eeg on drowsiness detection. In: 2014 International Conference onComputational Science and Technology (ICCST). pp. 1–5 (Aug 2014)
9. Senevirathna, B., Abshire, P.: Spatio-temporal compressed sensing for real-timewireless eeg monitoring. In: 2018 IEEE International Symposium on Circuits andSystems (ISCAS). pp. 1–5 (May 2018)
10. Singh, A.K., Wang, Y.K., King, J.T., Lin, C.T., Ko, L.W.: A simple communicationsystem based on brain computer interface. In: 2015 Conference on Technologies andApplications of Artificial Intelligence (TAAI). pp. 363–366 (Nov 2015)
11. Sosa-Jimenez, C.O., Mesa, H.G.A., Rebolledo-Mendez, G., de Freitas, S.: Clas-sification of cognitive states of attention and relaxation using supervised learningalgorithms. In: 2011 IEEE International Games Innovation Conference (IGIC). pp.31–34 (Nov 2011)
12. Wichmann, T.: Detail zooming in artificial intelligence world modeling. In: South-eastCon 2015. pp. 1–5 (April 2015)
151
Design of a Brain-Computer System to Measure Brain Activity during a Dolphin-Assisted ...
Research in Computing Science 148(11), 2019ISSN 1870-4069