WM2012 Conference, February 26 – March 1, 2012, Phoenix, Arizona, USA 1 Design of a Particle Shadowgraph Velocimetry and Size (PSVS) System to Determine Particle Size and Density Distributions in Hanford Nuclear Tank Wastes - 12280 M.S. Fountain, J. Blanchard, R.L. Erikson, D.E. Kurath, D.T. Howe, H. Adkins and J. Jenks Pacific Northwest National Laboratory, Richland, Washington ABSTRACT Accurate particle size and density distributions for nuclear tank waste materials are essential information that helps determine the engineering requirements for a host of waste management unit operations (e.g., tank mixing, pipeline transport, and filtration). The most prevalent approach for determining particle size and density distribution is highly laborious and involves identifying individual particles using scanning electron microscope/x-ray diffraction and then acquiring the density of the materials from the technical literature. Other methods simply approximate individual particle densities by assuming chemical composition, rather than obtaining actual measurements of particle density. To overcome these limitations, a Particle Shadowgraph Velocimetry and Size (PSVS) system has been designed to simultaneously obtain particle size and density distributions for a broad range of Hanford tank waste materials existing as both individual particles and agglomerates. The PSVS system uses optical hardware, a temperature-controlled settling column, and particle introduction chamber to accurately and reproducibly obtain images of settling particles. Image analysis software provides a highly accurate determination of both particle terminal velocity and equivalent spherical particle diameter. The particle density is then calculated from Newton’s terminal settling theory. The PSVS system was designed to accurately image particle/agglomerate sizes between 10 and 1000 μm and particle/agglomerate densities ranging from 1.4 to 11.5 g/cm 3 , where the maximum terminal velocity does not exceed 10 cm/s. Preliminary testing was completed with standard materials and results were in good agreement with terminal settling theory. Recent results of this method development are presented, as well as experimental design. Keywords: Particle Size and Density Distribution; PSDD; Sedimentation, Tank Waste; Particle Settling; Particle Density; Shadowgraph; Velocimetry; Agglomerate Density; Equivalent Spherical Diameter; Newton’s Law INTRODUCTION A key point addressed in a workshop on Slurry Retrieval, Pipeline Transport & Plugging and Mixing [1] was that handling solids is far more difficult than handling gases or liquids. This is particularly true if the solids are unrefined, as is the case in the minerals processing industry and with the variety of tank wastes to be handled in the U.S. Department of Energy complex. Difficulties handling slurries could severely reduce expected throughput and yield and increase startup time and cost. The workshop highlighted the importance of good chemical and physical characterization of actual waste slurries, from as-received through all unit operations, to underpin the design basis. It was also noted that process design cannot be based on average slurry properties but must cover a robust range of variable waste properties. One of the identified gaps in characterization methods was the ability to link actual waste particles to their respective particle size distribution and density. While adequate methods are available for separately determining particle size distributions and particle densities, the most prevalent approach for linking these properties involves a laborious technique where individual particles are identified using scanning electron microscope/x-ray diffraction methods and the
Transcript
WM2012 Conference, February 26 – March 1, 2012, Phoenix, Arizona, USA
1
Design of a Particle Shadowgraph Velocimetry and Size (PSVS) System to Determine Particle Size and Density Distributions in Hanford Nuclear Tank Wastes - 12280
M.S. Fountain, J. Blanchard, R.L. Erikson, D.E. Kurath, D.T. Howe, H. Adkins and J. JenksPacific Northwest National Laboratory, Richland, Washington
ABSTRACT
Accurate particle size and density distributions for nuclear tank waste materials are essential information that helps determine the engineering requirements for a host of waste management unit operations (e.g., tank mixing, pipeline transport, and filtration). The most prevalentapproach for determining particle size and density distribution is highly laborious and involvesidentifying individual particles using scanning electron microscope/x-ray diffraction and then acquiring the density of the materials from the technical literature. Other methods simply approximate individual particle densities by assuming chemical composition, rather than obtaining actual measurements of particle density. To overcome these limitations, a Particle Shadowgraph Velocimetry and Size (PSVS) system has been designed to simultaneously obtain particle size and density distributions for a broad range of Hanford tank waste materials existing as both individual particles and agglomerates. The PSVS system uses optical hardware, a temperature-controlled settling column, and particle introduction chamber to accurately and reproducibly obtain images of settling particles. Image analysis software provides a highly accurate determination of both particle terminal velocity and equivalent spherical particle diameter. The particle density is then calculated from Newton’s terminal settling theory. The PSVS system was designed to accurately image particle/agglomerate sizes between 10 and 1000 µm and particle/agglomerate densities ranging from 1.4 to 11.5 g/cm3,where the maximum terminal velocity does not exceed 10 cm/s. Preliminary testing was completed with standard materials and results were in good agreement with terminal settling theory. Recent results of this method development are presented, as well as experimental design.
Keywords: Particle Size and Density Distribution; PSDD; Sedimentation, Tank Waste; Particle Settling; Particle Density; Shadowgraph; Velocimetry; Agglomerate Density; Equivalent Spherical Diameter; Newton’s Law
INTRODUCTION
A key point addressed in a workshop on Slurry Retrieval, Pipeline Transport & Plugging and Mixing [1] was that handling solids is far more difficult than handling gases or liquids. This is particularly true if the solids are unrefined, as is the case in the minerals processing industry and with the variety of tank wastes to be handled in the U.S. Department of Energy complex.Difficulties handling slurries could severely reduce expected throughput and yield and increase startup time and cost. The workshop highlighted the importance of good chemical and physical characterization of actual waste slurries, from as-received through all unit operations, to underpin the design basis. It was also noted that process design cannot be based on average slurry properties but must cover a robust range of variable waste properties.
One of the identified gaps in characterization methods was the ability to link actual waste particles to their respective particle size distribution and density. While adequate methods are available for separately determining particle size distributions and particle densities, the most prevalent approach for linking these properties involves a laborious technique where individual particles are identified using scanning electron microscope/x-ray diffraction methods and the
WM2012 Conference, February 26 – March 1, 2012, Phoenix, Arizona, USA
2
material densities are assumed and/or estimated by assumed chemical compositions and morphologies. Since many tank waste materials are not readily identifiable, this approach offers only a partial solution.
To address this gap, researchers at Pacific Northwest National Laboratory (PNNL) recently completed a literature survey to investigate existing methods and technologies for obtaining particle size and density distributions. Using settling columns fitted with image-capturing equipment for testing and then image analysis software to analyze results was identified as a promising approach [2-5]. Subsequently, an analytical method to generate particle size and density distribution results was conceived and a new measurement apparatus was designed and constructed. The Particle Shadowgraph Velocimetry and Size (PSVS) system was created to develop a relatively broad and industrially applicable analytical method for determining the particle size and density distribution of radiological slurry waste materials. Successful deployment of the PSVS system will provide improved knowledge of the particle size and density distributions for use in tank mixing, pipeline transport, feed delivery, and processing in the Waste Treatment Plant at the Hanford Site in Richland, Washington. Applications at the Hanford Site formed the primary basis for method development goals.
TECHNICAL APPROACH
Generally speaking, particle densities can be calculated from the particle size and terminal settling velocity based on Newton’s law, which states that a particle falling under gravity reaches terminal velocity when the body force balances drag forces. The terminal velocity of an individual spherical particle can be described by
,3
42
L
LS
D
SS C
dgV
(Eq. 1)
where CD is the drag coefficient, dS is the spherical particle diameter, g is gravitational acceleration, VS is the solid settling velocity, ρS is the particle density, and ρL is the suspension fluid density.
The drag coefficient is a function of the particle Reynolds number, defined as the ratio of inertial and viscous forces. The particle Reynolds number is given by
,Re
SSLP
dV (Eq. 2)
where µ is the suspension fluid viscosity.
Subsequently, the drag coefficient is dependent on the fluid flow regime: laminar, transitional or turbulent, corresponding to Rep <0.1, 0.1 < Rep < 1000, and 1000 < Rep < 350,000, respectively. The resulting drag coefficient equation was chosen, based on the three flow regimes, from Perry and Green 1997 [6].
Equation 1 assumes a spherical particle and the shape of the particle directly impacts the settling behavior. For non-spherical particles, an equivalent spherical diameter is often used to represent the diameter of a sphere settling as the same terminal velocity and experimental conditions. A commonly used equivalent spherical diameter is the Corey’s shape factor
WM2012 Conference, February 26 – March 1, 2012, Phoenix, Arizona, USA
3
,ab
cSF (Eq. 3)
where, a, b, and c are the longest, intermediate, and shortest mutually perpendicular axes of the particle, respectively. This approach is most representative when the axes of the non-spherical particle are approximately the same dimensions.
An alternative method to approximate the equivalent spherical diameter is to use an area-equivalent diameter (ISO 13322-1) [7] given by
A
X A
4 (Eq. 4)
and a shape factor
,min
max
X
X (Eq. 5)
where A is the projected area of the particle (expressed in pixels), Xmax is the longest dimensionof each particle, and Xmin is the shortest dimension of each particle. Multiplying Equation 4 and Equation 5 provides the equivalent spherical diameter estimate. These approximations for non-spherical particle diameter provide greater experimental flexibility, but must be used with discretion as the margin of error in particle density measurements increases as the particle becomes less spherical. The above discussion only provides two examples—additionalapproximations exist to account for deviations from theory due to particle-particle interactions, non-spherical shape, and agglomeration.
METHOD AND APPARATUS DESCRIPTION
A test method, developed for the PSVS system, applies Newton’s terminal settling theory(i.e., Equation 1) to estimate the density of particles through the accurate measurement of settling velocity, particle size, and suspension fluid temperature; the latter to determine the viscosity and density of the suspension fluid. The PSVS system utilizes optical hardware, a temperature-controlled settling column, and a particle introduction chamber to accurately and reproducibly record images of individual settling particles/agglomerates. Image analysis software then provides a highly accurate determination of both particle velocity and an equivalent spherical particle size in a two-dimensional plane.
The test method was developed with the intent of meeting the requirements specified in the Hanford Analytical Services Quality Assurance consensus program for new analytical methods [8]. Therefore, a qualification of the test method was conducted using standard materials, with known density and particle size determined from recognized analytical methods performed with National Institute of Standards and Technology-traceable standards.
The PSVS test apparatus, presented in Fig. 1, was designed to image particle/agglomerate sizes between 10 and 1000 µm and particle/agglomerate densities ranging from 1.4 to 11.5 g/cm3, where the maximum terminal velocity does not exceed 10 cm/s.
WM2012 Conference, February 26 – March 1, 2012, Phoenix, Arizona, USA
4
CameraLens
Optics Breadboard
Column Thermocouples
Camera Adjustable
Stage
LED Light Source, Cable, Focusing Lens
Column Thermal Control System
Particle Introduction
StagePrecise-step Linear
Actuator Motor
Open/Closed Column Optics
Windows (4 each side)
Light Source Adjustable
Stage
Column Thermal
Insulation Shroud
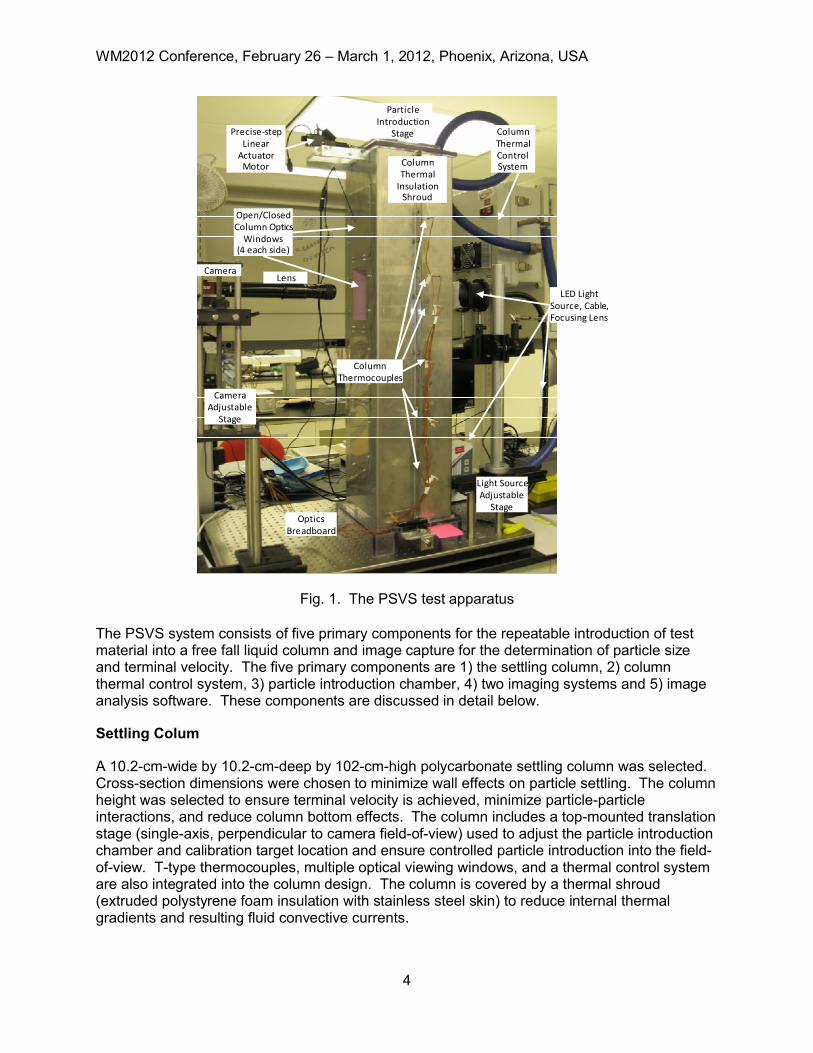
Fig. 1. The PSVS test apparatus
The PSVS system consists of five primary components for the repeatable introduction of test material into a free fall liquid column and image capture for the determination of particle size and terminal velocity. The five primary components are 1) the settling column, 2) column thermal control system, 3) particle introduction chamber, 4) two imaging systems and 5) image analysis software. These components are discussed in detail below.
Settling Colum
A 10.2-cm-wide by 10.2-cm-deep by 102-cm-high polycarbonate settling column was selected.Cross-section dimensions were chosen to minimize wall effects on particle settling. The column height was selected to ensure terminal velocity is achieved, minimize particle-particle interactions, and reduce column bottom effects. The column includes a top-mounted translation stage (single-axis, perpendicular to camera field-of-view) used to adjust the particle introduction chamber and calibration target location and ensure controlled particle introduction into the field-of-view. T-type thermocouples, multiple optical viewing windows, and a thermal control system are also integrated into the column design. The column is covered by a thermal shroud (extruded polystyrene foam insulation with stainless steel skin) to reduce internal thermal gradients and resulting fluid convective currents.
WM2012 Conference, February 26 – March 1, 2012, Phoenix, Arizona, USA
5
Column Thermal Control System
The column thermal control system uses two peltier heat pumps capable of heating or cooling a 26 cfm recirculating air flow through the thermal shroud and is designed to maximize temperature uniformity and maintain a constant column suspension fluid temperature of ~20°C. Fast time response T-type thermocouples inside the settling column (positioned at different elevations) provide information about thermal convection and stratification.
Particle Introduction Chamber
The particle introduction chamber is a mechanical device used to fully mix, suspend, and introduce test material into the top of the settling column without destroying the original nature of the material and while minimizing imparted inertia into the column fluid during the introduction of material. The particle introduction chamber consists of two interlocking polycarbonate cylindrical chambers with a machined slot at the bottom that, when rotated to align, release a small fraction of material into the column. The translation stage moves the particle introduction chamber into a precise position, allowing alignment with the camera field-of-view. An impeller-style agitator mixes and suspends the test material inside the baffled particle introduction chamber mixing chamber.
The primary function of the particle introduction chamber is to introduce representative testmaterial (solids) into the settling column with as little imparted inertia as practicable. The particle introduction chamber has been designed to (1) fully suspend test material above a discharge slot such that the material falling from the particle introduction chamber space through the aligned discharge slot into the column is a representative subset of the test material in the particle introduction chamber and (2) to reduce jetting (imparted inertia) of the sample in the vertical direction. The PSVS test objective requires the test material to settle through the column fluid under the influence of gravity only (free fall) and additional inertia will result in higher measured settling velocities and thus inaccurate densities.
Imaging Systems
The PSVS optical hardware is designed to image particles from 10 to 1,000 µm, falling at velocities ranging from 0.01 to 10 cm/s, depending upon the size and density. In order to resolve the settling velocity of the large particle size range, two separate field-of-view sizes are required and therefore, two imaging systems (i.e., camera, lens and illumination) are mandatory.The smaller field-of-view size is approximately 1.3 mm, which is able to resolve 10 to 100 µm particles with a maximum velocity of 1.9 cm/s. Similarly, the larger field-of-view is approximately 15.4 mm and was sized to image 60 to 1,000 µm particles with a maximum velocity of 10 cm/s. The field-of-view’s were sized using a minimum pixel count of 16 pixels to resolve a particle (i.e., a 4 by 4 pixel array). The minimum frame rate required for each field-of-view was determined to be 139 and 79 Hz, respectively. The frame rate calculation is based on capturing at least ten images of the particle’s trajectory through the field-of-view. This analysis approach allows for an assessment of constant velocity conditions and for viewing particle trajectories and particle-particle interactions.
The small field-of-view is sized using a LaVision High-Speed Star 3 camera capable of 1 kHz frame rate at 1,024 by 1,024 pixels, where each pixel is 17 µm. A Navitar 12x High Mag Zoom lens, equipped with a 2x adapter and 0.5x lens attachment is used to obtain the smaller field-of-view. The large field-of-view is designed using an AVT Prosilica GX1050 camera capable of
WM2012 Conference, February 26 – March 1, 2012, Phoenix, Arizona, USA
6
112 Hz frame rate at 1,024 by 1,024 pixels, with 5.5 µm pixels. The large field-of-view is obtained with a Nikon Micro-Nikkor 60 mm lens.
The aforementioned cameras were each paired with illumination systems, allowing for simultaneous operation. The LaVision High-Speed Star 3 camera was paired with a Ministrobokin nanosecond flash lamp (available from High-Speed Photo-Systeme), which provides high-speed imaging capability up to 20 kHz. The Prosilica GX1050 camera was paired with a continuous high-output SugarCube light-emitting diode light source, capable of providing 4,300 lumens. Fiber optic guides direct the SugarCube light to a collimating system, which focuses the diverging light to approximately a 2.54-cm spot.
Additionally, a MR-1 Micro-Ruler (Geller Microanalytical Laboratory) was employed to accurately calibrate the field-of-view in engineering units, which are necessary to determine the particle size and velocity measurements.
Imaging Software
Capturing and analyzing particle images manually is highly subjective and not economically feasible when processing thousands of particle images. The images acquired from the two camera systems are analyzed using LaVision ParticleMaster software. The ParticleMaster software is a repeatable, accurate, and efficient image analysis tool for determining particle size, velocity, shape and other statistical properties. ParticleMaster uses a threshold technique to search for particles above a background illumination intensity range and then calculates an equivalent spherical particle size, based upon a two-dimensional projection. The software then tracks the particle from frame to frame to determine the particle velocity, as shown in Fig. 2.
Fig. 2. Time series image of a 686 µm settling particle moving at approximately 11.5 cm/s recorded at 140 Hz. The first image (a) does not show the velocity arrow or value because velocity measurements require two frames. An additional particle can be seen at the bottom of (a), (b), and (c), however it did not satisfy the in-focus filter criterion.
WM2012 Conference, February 26 – March 1, 2012, Phoenix, Arizona, USA
7
EXPERIMENTAL RESULTS
Thermal Convective Current Concerns
Preliminary investigations concluded that significant thermal convection was present in the un-insulated column due to the variance of ambient conditions associated with heating, ventilation,and air conditioning operation within the laboratory. Subsequently, the column was insulated and the thermal controller was added to reduce thermal gradients within the fluid column; thereby reducing unwanted convective motion.
Neutrally buoyant (1.0 ± 0.01 g/cc) 10 to 27 µm polyethylene beads, manufactured by CoSpheric Inc., were introduced into the settling column to determine the magnitude of thermal convective currents and their influence on free-settling particles. A 0.065 M solution of sodium hexametaphosphate was used as the suspension fluid in all testing. The PSVS camera system and image analysis software were used to monitor the movement of the buoyant beads. Astable settling column temperature of 23°C was maintained with the thermal control system. The field-of-view was positioned 6.8 cm into the column, parallel to the vertical column walls. Convective motion with velocities as high as 4 mm/s were observed when the thermal control system heated from the bottom air inlet port (i.e., unstable thermal stratification). When the air inlet was switched to the top inlet port, convective currents were reduced to 0.1 mm/s. However, further measurements are required to confirm that convective motion has been reduced throughout the full depth of the column, as well as at various vertical locations. For reference, a 10 µm, 2.8 g/cc particle will fall with a terminal velocity of 0.11 mm/s in 23°C water, so thermal convection on the order of 0.1 mm/s is a concern for small and low-density particles.
Particle Standards
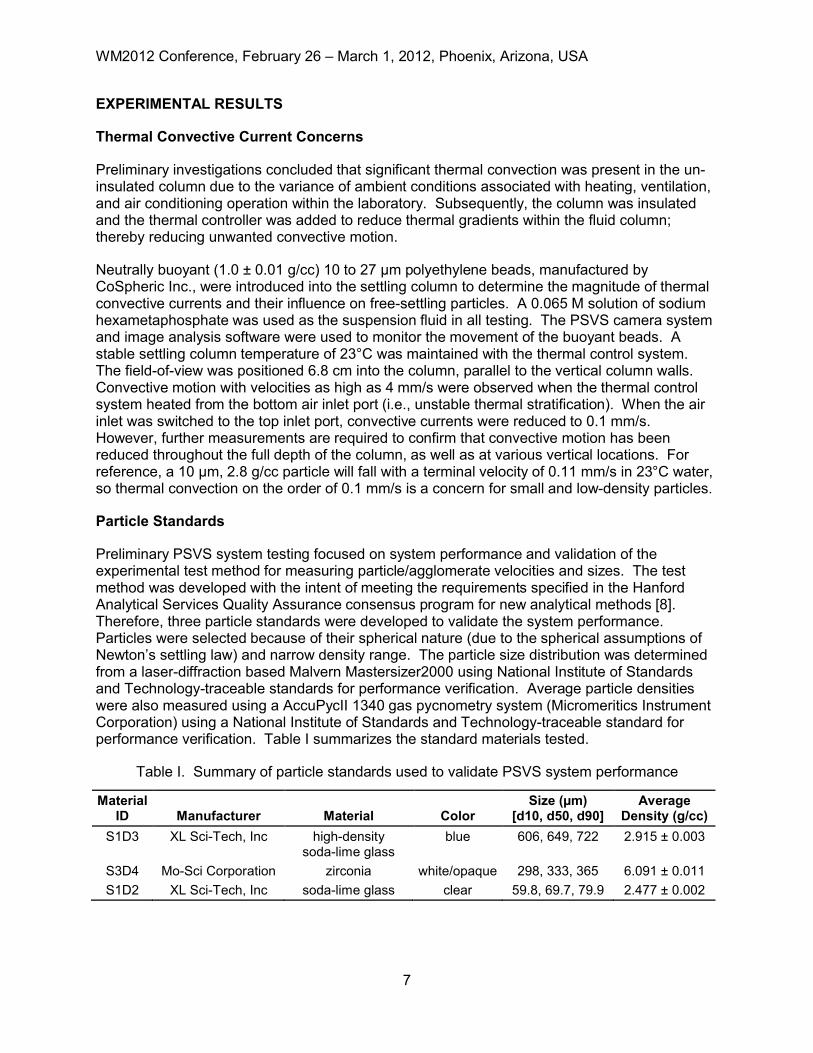
Preliminary PSVS system testing focused on system performance and validation of the experimental test method for measuring particle/agglomerate velocities and sizes. The test method was developed with the intent of meeting the requirements specified in the Hanford Analytical Services Quality Assurance consensus program for new analytical methods [8]. Therefore, three particle standards were developed to validate the system performance. Particles were selected because of their spherical nature (due to the spherical assumptions of Newton’s settling law) and narrow density range. The particle size distribution was determined from a laser-diffraction based Malvern Mastersizer2000 using National Institute of Standards and Technology-traceable standards for performance verification. Average particle densities were also measured using a AccuPycII 1340 gas pycnometry system (Micromeritics Instrument Corporation) using a National Institute of Standards and Technology-traceable standard for performance verification. Table I summarizes the standard materials tested.
Table I. Summary of particle standards used to validate PSVS system performance
WM2012 Conference, February 26 – March 1, 2012, Phoenix, Arizona, USA
8
Test standard materials were loaded into the particle introduction chamber at 0.1 vol% concentrations and repeatedly introduced in the settling column filled with a 0.065 M sodium hexametaphosphate solution and particle images were captured with the PSVS camera system. The column temperature was controlled at 23°C and allowed to reach a thermal equilibrium for 24 hours prior to testing.
The ParticleMaster software’s raw size histogram and velocity results for the 700 µm (ideal) S1D3 beads are shown in Fig. 3, where basic particle recognition is used and out of focus particles are ignored. Unexpectedly, the results show a bimodal size distribution ranging from approximately 550 to 1250 µm. Additionally, the velocity vs. diameter plot shows a wide range of velocities for any given diameter, with erratic data scatter.
Fig. 3. PM image software processing of S1D3 standard
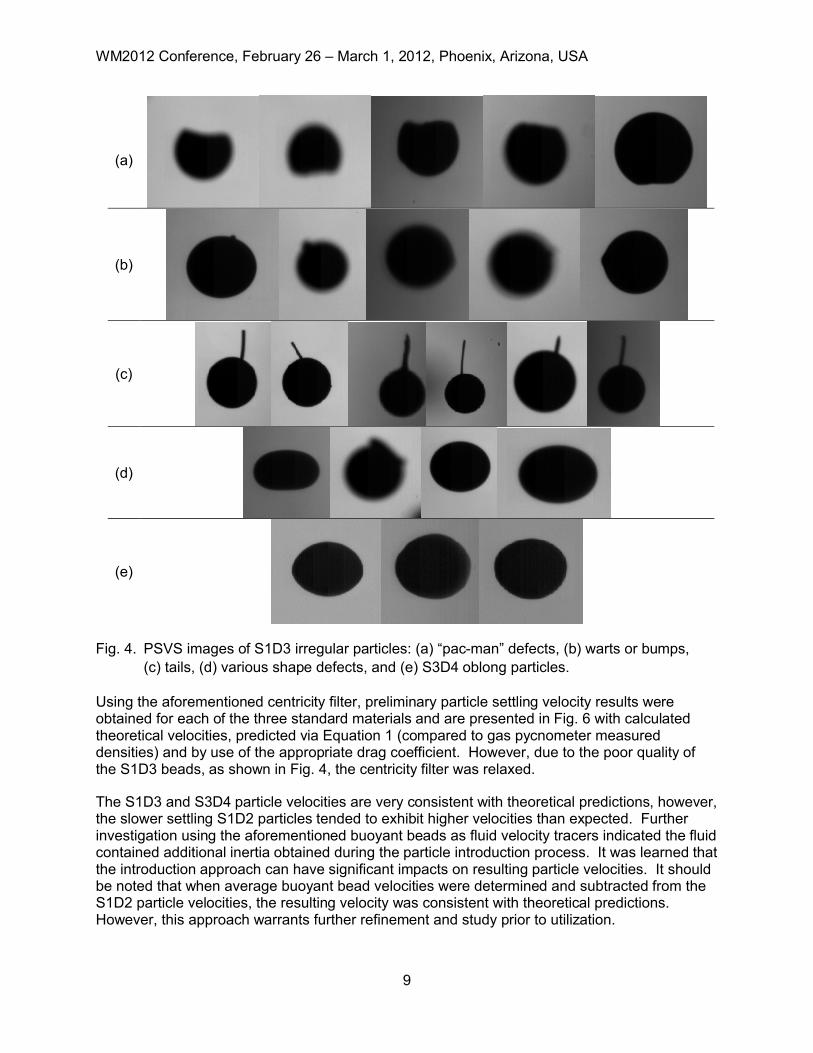
Upon further investigation of individual particle images, many defects were noted. Selectedimages of non-spherical particle shapes and particle defects are presented in Fig. 4. Similarly, the S3D4 zirconia beads were found to be lemon-shaped beads with low centricity, see Fig. 4 (e).
These shapes and defects have significant implications on the settling velocity, but since these defects are easily identifiable, they can be filtered out by applying a centricity filter. The centricity filter ignores any particle below a prescribed threshold, where the centricity is the ratio of the minimum and maximum dimensions. The data shown in Fig. 4 were re-analyzed using the centricity filter and are shown in Fig. 5, where significant improvement is observed.
The centricity-filtered results show a more narrow velocity versus particle diameter trend and the erroneously high particle diameters have been eliminated from the size-distribution histogram, showing a more appropriate monodisperse particle size distribution.
WM2012 Conference, February 26 – March 1, 2012, Phoenix, Arizona, USA
9
(a)
(b)
(c)
(d)
(e)
Fig. 4. PSVS images of S1D3 irregular particles: (a) “pac-man” defects, (b) warts or bumps, (c) tails, (d) various shape defects, and (e) S3D4 oblong particles.
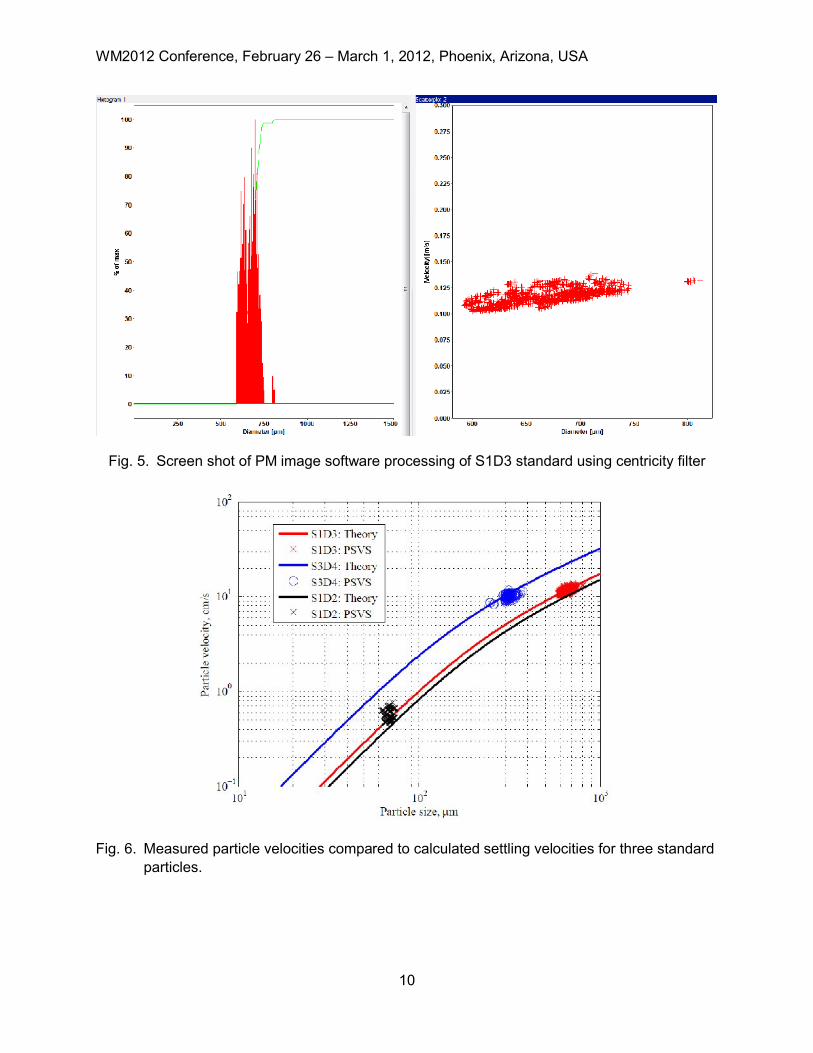
Using the aforementioned centricity filter, preliminary particle settling velocity results were obtained for each of the three standard materials and are presented in Fig. 6 with calculated theoretical velocities, predicted via Equation 1 (compared to gas pycnometer measured densities) and by use of the appropriate drag coefficient. However, due to the poor quality of the S1D3 beads, as shown in Fig. 4, the centricity filter was relaxed.
The S1D3 and S3D4 particle velocities are very consistent with theoretical predictions, however, the slower settling S1D2 particles tended to exhibit higher velocities than expected. Further investigation using the aforementioned buoyant beads as fluid velocity tracers indicated the fluid contained additional inertia obtained during the particle introduction process. It was learned that the introduction approach can have significant impacts on resulting particle velocities. It should be noted that when average buoyant bead velocities were determined and subtracted from the S1D2 particle velocities, the resulting velocity was consistent with theoretical predictions. However, this approach warrants further refinement and study prior to utilization.
WM2012 Conference, February 26 – March 1, 2012, Phoenix, Arizona, USA
10
Fig. 5. Screen shot of PM image software processing of S1D3 standard using centricity filter
Fig. 6. Measured particle velocities compared to calculated settling velocities for three standard particles.
WM2012 Conference, February 26 – March 1, 2012, Phoenix, Arizona, USA
11
Fig. 7 illustrates particle density as a function of particle size after solving Equation 1 for particledensity. Particle velocity and size were experimental measurements from the PSVS system, while the suspension fluid temperature was measured to estimate the suspension fluid density and viscosity using literature values. Similarly, the density results for the S1D3 and S3D4 particles are consistent with theoretical predictions. The tendency for the S3D4 particles to have a lower calculated density is attributed to their oblong shape, which increases the particles form (or shape) drag, thus reducing settling velocity. Unfortunately, the calculated S1D2 particle density is significantly higher than measured particle densities due to imparted fluid inertia.
Fig. 7. PSVS calculated particle densities compared to pycnometer measured average densities for three standard particles
DISCUSSION AND CONCLUSIONS
The primary goal of these PSVS system tests was to obtain accurate and reproducible particle size and velocity measurements to estimate particle densities within 20 percent of direct measured density values. The average percent error observed in particle densities was 4.8, 8.2, and 25.8 percent for S1D3 (high-density soda-lime glass), S3D4 (zirconia), and S1D2 (soda-lime glass) beads, respectively. The maximum measured particle density error observed was 14.5, 21.0, and 58.4, for S1D3, S3D4, and S1D2 beads, respectively. Multiple sources of error can exist that contribute to inaccurate estimates of particle density using the PSVS approach. Two significant influences observed were thermal convective currents in the settling column fluid and non-spherical (irregular) particle shapes in the standard test materials.
Experimental results using buoyant beads suggest thermal convective currents can influence the movement of settling particles as much as 4 mm/s. These thermal convective currents are clearly a significant concern for smaller and less-dense particles/agglomerates which have terminal velocities of the same magnitude. Significant effort went into the design and fabrication of a thermal control system for the PSVS settling column. However, small temperature
WM2012 Conference, February 26 – March 1, 2012, Phoenix, Arizona, USA
12
variations (<0.3°C) are difficult to prevent and measure accurately. Therefore, although designing the thermal control system was necessary, it is not considered the only solution to minimize error due to thermal convective currents. The use of small diameter (10 to 27 µm) polyethylene buoyant beads (in low concentrations) during actual settling experiments may benecessary to provide insight into particle-particle interactions and fluid velocity correction factors to account for potential influences from thermal convective currents. Future testing will incorporate the buoyant beads into the analysis technique when the suspension fluid is chemically compatible.
The use of the Newton’s law to calculate particle/agglomerate densities assumes spherical particle shapes. As the actual particle/agglomerates diverge from spherical, the margin of error increases. The selection of high quality (in density and shape) monodispersed particle standards was a direct attempt to reduce the uncertainties associated with non-spherical or irregular particles and to only observe the PSVS method and analysis error. While investigating the source of data scatter for the S1D3 bead (nominal 700 µm) standard, significant irregular particles where discovered. Yet, a subsequent investigation into the S3D4 bead standard was also conducted and it was determined that 60 percent of the particles had a 0.9 to 0.8 centricity, 32 percent were between 0.8 and 0.7, only 7 percent were between 1.0 and 0.9, and the remaining 1 percent of the particles had centricities between 0.7 and 0.6. Contrast this with the S1D3 bead standard, where 100 percent of particles had centricities between 0.95 and 0.98, upon applying the centricity filter. The influence of the non-spherical shape of the S3D4 bead standard is evident when comparing a 3.9 percent average density error for S1D3 glass bead standard with an 8.3 percent average density error for the S3D4 bead standard. Model corrections for non-spherical shape must be implemented to account for these measurement errors during future method validation and system performance assessments. In addition, further work is needed to resolve the higher than expected velocities for the smaller S1D2 particles. Initial measurements conducted with buoyant beads as fluid velocity tracers indicate that fluid velocities can be subtracted from the increased particle velocities to determine the particle terminal velocity, regardless of the surrounding fluid velocity. However, this approach is in its infancy and will need to be carefully and methodically validated.
The importance of visual identification of individual particles in understanding data variability and data quality cannot be understated. The PSVS system offers the advantage of inspecting suspect data where other particle size measurement methods (e.g., sieving, sedimentation, andlight scattering) do not provide insight into material shape and sphericity.
REFERENCES
1. Smith, G.L., A.W. Etchells, A.P. Poloski, B.E. Lewis Jr. M.W. Rinker, S.L. Marra (SRNL), R.L. Demmer. (2009). Slurry Retrieval, Pipeline Transport & Plugging and Mixing Workshop, PNNL-18751, Pacific Northwest National Laboratory, Richland, WA.
2. Nobbs, D., P. Tang, and J.A. Raper. (2001). The Design, Construction and Commissioning of a Low-Cost Optical Particle Size Analyzer Specifically for Measurement of Settling Velocities and Size of Flocs. Measurement Science and Technology, 13, 297-302.
3. Mantovelli, A. and P.V. Ridd. (2006). Devices to Measure Settling Velocities of Cohesive Sediment Aggregates: A Review of the In Situ Technology. Journal of Sea Research, 56199-226.
WM2012 Conference, February 26 – March 1, 2012, Phoenix, Arizona, USA
13
4. Tang, P., J. Greenwood, and J.A. Raper. (2002). A Model to Describe the Settling Behavior of Fractal Aggregates. Journal of Colloid and Interface Science, 247 210-219.
5. Hubner T, Will S, and A Leipertz. (2001). Settling Sedimentation Image Analysis (SIA) for the Simultaneous Determination of Particle Mass Density and Particle Size. Particle & Particle Systems Characterization, 18, 70-78.
6. Perry, H., Green, DW, and J.O. Maloney. (1997). Perry’s Chemical Engineers’ Handbook,7th Ed., McGraw-Hill.
7. International Organization for Standardization. (2004). Particle Size Analysis – Image Analysis Methods – Part 1: Static Image Analysis Methods. ISO 13322-1: 2004(E).
8. DOE - U.S. Department of Energy. (2002). Hanford Analytical Services Quality Assurance Requirements Document (HASQARD). DOE/RL-96-68 Rev. 3, Vols 1 and 4, Office of River Protection, Richland, Washington.
ACKNOWLEDGEMENTS
The authors would like to acknowledge the following people for their significant contributions: G. Boeringa, W.C. Buchmiller, C.J. Hohimer, J.J. Jenks, M.L. Kimura, R.P. Pires, L.A. Turo, and M.R. Zumhoff. This work is funded through the Office of Technology Innovation and Development (EM-30).