12
| Date post: | 15-Mar-2018 |
| Category: |
Documents |
| Upload: | phungkhuong |
| View: | 216 times |
| Download: | 3 times |
Scientia Iranica E (2017) 24(5), 2515{2526
Sharif University of TechnologyScientia Iranica
Transactions E: Industrial Engineeringwww.scientiairanica.com
Design of an innovative construction model for supplychain management by measuring agility and cost ofquality: An empirical study
Y. Rahimia, R. Tavakkoli-Moghaddama;�, S. Shojaieb and I. Cheraghic
a. School of Industrial Engineering, College of Engineering, University of Tehran, Tehran, Iran.b. School of Industrial Engineering, Iran University of Science and Technology, Tehran, Iran.c. Department of Industrial Engineering, Albourz Campus, University of Tehran, Tehran, Iran.
Received 20 July 2015; received in revised form 23 April 2016; accepted 19 September 2016
KEYWORDSConstruction supplychain management;Agility;Suppliers performanceevaluation;Cost of quality.
Abstract. This paper aims to present a model for an agile supply chain networkin construction enterprises with performance evaluation of suppliers and contractors.Management and selection of suppliers and contractors play an important role in theprocess of constructions since contractors are as corner stones of construction projects.Additionally, contractors are the main factor in converting resources to �nal products.Traditionally, contractor selection in construction projects is on the basis of the lowestproposed price. However, there are various qualitative and quantitative criteria withdi�erent priorities associated in this regard in order to make the best decision. In thispaper, a hybrid method of DEA/AHP/FDEMATEL is used. First, important and e�ectiveevaluation criteria are selected through an FDEMATEL method. Then, the DEA/AHPmethod is implemented in order to evaluate and prioritize the selected indicators as well asto incorporate them in a supply chain. Furthermore, agility is involved in the consideredsupply chain network. Furthermore, in this paper, for the �rst time in Iran, a supply chainmodel is studied and designed for civil companies.
© 2017 Sharif University of Technology. All rights reserved.
1. Introduction
E�ciency and e�ectiveness of each organization isobtained through management performance and itssupply chain structure. The key to success of today'sorganizations is laid in perception and recognition ofcustomers' requirements and providing a quick re-sponse to them. This results from investigations and
*. Corresponding author. Tel.: +98 21 88021067;Fax: +98 21 88013102E-mail address: [email protected] (R.Tavakkoli-Moghaddam)
doi: 10.24200/sci.2017.4388
developments in a Supply Chain (SC). Supply ChainManagement (SCM) is a set of approaches towardscollaboration of suppliers, manufacturers, warehouses,and retailers so that products are delivered to cus-tomers in a right amount, time, and location, in whichthe total cost of the system is minimized throughsatisfaction of a determined service level [1]. In fact,SCM is managing a set of interrelated issues that are inline with customers' satisfaction [2]. The total aim ofSCM is to integrate organizational units and coordinatematerial ow, information, and money in a way thatcompetency of an SC can be improved [3-5].
Supply chain management in constructionprojects is de�ned as follows: management of informa-tion ow, actions, activities, and processes including
2516 Y. Rahimi et al./Scientia Iranica, Transactions E: Industrial Engineering 24 (2017) 2515{2526
various networks of independent organizationsand their communication paths (upstream anddownstream) that create value in the form of aproject for the owner [6]. Upstream activitiesin an SC of construction projects from the maincontractor's point of view include the project ownerand engineering/design group that prepare the processof construction. Downstream activities, includingmaterial suppliers and secondary contractors thatstay in touch with the primary contractors, requirehigh levels of cooperation among bene�ciaries ofthe project. In today's competitive environment,construction organizations have to be connectedwith the best suppliers and secondary contractorsin order to keep their competency advantageous.Often, construction organizations are not expert indetermining their suppliers' capabilities and commonlymake decisions based on their perceptions. Thisintegrated concern, i.e. process of supplier selection,should melt in supply chain environment in a way thatensures material availability [6]. In Appendix A, twomodels, i.e. horizontal and vertical, are presented forSCM of construction projects. In this paper, we applythe �rst pattern for the SC design [6].
Supplier and contractor selection is basically aMulti-Criteria Decision Making (MCDM) problem.However, most organizations deal with this issue froma strategic point of view. The essence of this kind ofdecisions is highly complex without having a certainstructure. Therefore, by applying management tools,e.g. MCDM methods, we can solve them. Regardingthe proposed problem and the related literature, anew model is presented in this paper for SCM of con-struction projects along with supplier and contractorevaluations.
Various models are available in the literature,which are concerned with the supplier selection prob-lem. Wind and Robinson [7] proposed a linearweighting method for rating di�erent vendors in anexperimental environment. Also, some studies con-sidered their goals under budget constraints for eval-uation of di�erent vendors. For example, goal pro-gramming formulation was used for obtaining thegoals related to price and quality under di�erentconstraints [8,9]. There have been several methodsused for a supplier selection problem during the pastyears [10-19]; however, Data Envelopment Analysis(DEA), Analytical Hierarchy Process (AHP), andthe Technique for Order Performance by Similarityto Ideal Solution (TOPSIS) are the most popularmethods for the vendor (or supplier) selection prob-lem.
Liu et al. [20] presented a DEA method fora vendor selection problem with multiple objectives.Weber et al. [21] combined DEA and mathematicalprogramming models for supplier selection. Kahra-
man et al. [22] used a fuzzy AHP to select thebest supplier for a manufacturer �rm established inTurkey. Guneri et al. [23] introduced an integratedfuzzy-LP approach for a supplier selection problem.Reza [24] proposed an AR-IDEA model for selectingthe best suppliers in the presence of both weightrestrictions and imprecise data. Sevkli et al. [25] statedthat a DEA Hierarchy Process (DEAHP) methodhad better performance than an AHP method forsupplier selection. Kuo et al. [26] used a hybridof the AHP and DEA for developing performanceevaluation to make the supplier selection decision.Zeydan et al. [27] used fuzzy AHP and fuzzy TOPSISfor a supplier selection problem. Zhang et al. [28]used the combined DEAHP model and Activity-BasedCosting (ABC) for supplier evaluation. Li et al. [29]combined TOPSIS and 0-1 programming for supplierselection. Lin et al. [30] achieved a novel hybrid MCDMapproach for outsourcing vendor selection. Ou Yanget al. [31] introduced a novel hybrid MCDM modelcombined with DEMATEL and Analytical NetworkProcess (ANP). Xu and Yan [32] discussed the VSP ina bi-fuzzy environment and its application to materialsupply. Amindoust et al. [33] introduced a newranking method based on fuzzy inference system fora supplier selection problem to handle subjectivityof decision makers' assessments. Arabzad et al. [34]proposed the model for choosing a supplier based onthe Kraljic and DEA models. Lee [35] proposed afuzzy supplier selection model with the considerationof bene�ts, opportunities, costs, and risks. Carreraand Mayorga [36] proposed a Fuzzy Inference System(FIS) approach in supplier selection for new productdevelopment. C�elebi and Bayraktar [37] proposed anew method for integration of Neural Networks (NN)and DEA for evaluating of suppliers under incom-plete information about evaluation criteria. Wu [38]assessed supplier performance by a combination ofthe DEA, Decision Trees (DT), and NNs models.Sanayei et al. [39] used a VIKOR method under afuzzy environment to solve multiple-criteria problemsof supplier selection. Shi et al. [40] proposed a modelbased on arti�cial intelligence (BP neural network)and C2R-DEA for selecting appropriate logistics sup-pliers.
In this paper, superiorities of the AHP/DEA hy-brid method presented by Stern et al. [41] in AHP andDEA methods are studied in case of decision makingunits' performance evaluation. Also, AHP/DEA isemployed for evaluation of decision making units [42].Many quantitative methods have been presented forperformance evaluation and prioritizing of decision-making units so far. These methods are Delphi, AHP,ANP, MCDM, DEA, etc. Due to comprehensivenessand e�ciency of the AHP/DEA, this method is em-ployed in this study.

Y. Rahimi et al./Scientia Iranica, Transactions E: Industrial Engineering 24 (2017) 2515{2526 2517
2. AHP/DEA/FDEMATEL hybrid approachframework
Supply chains in manufacturing systems are multi-echelon networks consisting of suppliers, manufactur-ers, wholesalers, retailers, and warehouses. In thesesupply chains, manufacturers or warehouses are �xed,whereas they are not �xed in construction projects. Tobe more explicit, whenever a project is completed, theworkshop, i.e. virtual warehouse, is removed. Hence,warehouses in construction projects can be de�ned asvirtual workshops. The supply chain network proposedin this paper is considered to be agile and virtualonce a project, in which this network is applicable,is completed. In this network, a hybrid multi-criteriamodel is applied. First, this model selects the mostfavorable in uential criteria for supplier and contractorevaluation. Afterwards, it prioritizes them throughthe hybrid AHP/DEA method. Then, with regardto Figure 1 and inserting the chosen suppliers andcontractors in the network, construction supply chainnetworks are constituted. In this paper, a real case isimplemented in the P.G. Company.
P.G. Corporation has remarkable experienceswhen it comes to dam building, implementation ofirrigation and drainage networks, road construction,tunnel drilling, hydraulic heavy concrete and steelconstruction, marine structures, massive constructions,and design and construction of manufacturing �rms.This corporation is licensed grade one under the super-
Figure 1. Model framework.
vision of president's Strategic Planning and MonitoringDeputy and under the supervision of Iranian Ministryof Housing and Urban Development. The grades of thiscorporation are as follows:
- Grade one in the �elds of water, industry, andmining; roads and transportation; buildings andmonuments; facilities and equipment; and massiveconstruction management;
- Grade two in oil and gas industry, and design andconstruction of buildings and monuments;
- Grade three in the �eld of power.
P.G. Construction and Industrial Corporationhas managed to receive the following licenses since2003: Integrated Management System (IMS) certi�edby DQS of Germany, IQNet, Environmental Manage-ment System (ISO 14001; 2004), Quality ManagementSystem (ISO 9001; 2008), Occupational Health &Safety Advisory Services (OHSAS 18001; 2007), RiskManagement System (ISO 31000; 2009), Customer Sat-isfaction, and Complaints Handling (DIN ISO 10002;2005). Furthermore, this corporation is awarded a5star acknowledgement of EFQM.
3. Determining performance evaluationcriteria by an FDEMATEL method
In order to evaluate performance of decision-makingunits, �rst, it is necessary to determine and study theirindicators. In this paper, the FDEMATEL method isemployed for supplier/contractor performance evalua-tion. Finally, regarding speci�c features of constructioncompanies, important criteria are obtained for bothsuppliers and contractors.
Fontela and Gabus [43] presented DEMATEL,which was based on paired comparisons. To bene-�t from experts' judgments in extracting a system'sindicators and putting them in a structure througha graph theory, a hierarchical structure with logicalrelations is acquired [44,45]. The severity of theserelations is stated as numerical rates. The DEMATELmethod is used for determining and studying mutualrelations among criteria and for mapping them ontothe network. Since directed graphs can better presentthe relations among components of a system, theDEMATEL method is on the basis of some diagramsthat de�ne the involved components into cause ande�ects. Also, it draws their relations in an intelligiblestructural model. It is often used for global complexproblems and, similarly, for structuring a sequenceof given information. Subsequently, the severity ofrelations is studied as numerical scores; the feedbacksare searched along with their importance, and theinalienable relations are accepted. The main steps ofthe DEMATEL method are as:

2518 Y. Rahimi et al./Scientia Iranica, Transactions E: Industrial Engineering 24 (2017) 2515{2526
� Considering interrelations: This method has anedge over ANP; it has clarity and transparency inmirroring the interrelations among the large sum ofcomponents so that experts can express their pointsof view dominantly towards the e�ects (directionand e�ect intensity) among criteria. It is remarkablethat, in fact, the occasioned matrix in DEMATELmethod (interrelated matrix) constitutes a part ofa super-matrix. In other words, DEMATEL actsindirectly and as a subsystem of a larger system suchas ANP;
� Structuring complex criteria in the form ofcause and e�ect groups: This issue is one of themost frequently used functions and one of the mostimportant factors in the process of problem solving.In this case, a wide range of complex criteria isdivided into smaller subsets in the form of cause ande�ect groups so that decision maker can perceive therelations more appropriately. This matter leads tobetter understanding of the position of criteria andtheir role in mutual e�ects.
3.1. Steps of the DEMATEL method� Establishing direct relation matrix: The paired
comparisons are recognized by experts. Thus, thedirect relation matrix A, with n � n dimensions (nis the number of criteria), is established and aijis a number which shows e�ect of criterion i oncriterion j.
� Normalizing direct relation matrix: The pri-mary normal matrix can be calculated throughEqs. (1) and (2) as follows:
X = k �A; (1)
k = 1=maxnXj=1
aij 1 � i � n: (2)
� Obtaining the general relations matrix: Thegeneral relations matrix (T ) is represented throughEq. (3). I is an identity matrix:
T = X � (1�X)�1: (3)
� Cause and e�ect diagram establishment:Summation of the rows (D) and summation of thecolumns (R) in matrix T are obtained by Eqs. (4)-(6):
T = [tij ]n�n i; j = 1; 2; :::; n; (4)
R =
"nXi=1
tij
#1�n
= [tj ]1�n i; j = 1; 2; :::; n; (5)
D =
"nXi=1
tij
#n�1
= [tj ]n�1 i; j = 1; 2; :::; n: (6)
Table 1. Linguistic scales for the importance weight ofcriteria.
Linguistic terms Triangular fuzzy numbers
No in uence (0, 0.1, 0.3)Very low in uence (0.1, 0.3, 0.5)
Low in uence (0.3, 0.5, 0.7)High in uence (0.5, 0.7, 0.9)
Very high in uence (0.7, 0.9, 1)
The horizontal vector of cause and e�ect di-agram (D + R) is called superiority vector, whichshows the relative importance of each criterion. Thevertical axis (D�R) is named relative vector. If thevalue of this vector is positive, the correspondingcriteria belong to causes and otherwise the corre-sponding criteria belong to e�ects.
� Obtaining internal dependency matrix: In thisstep, summation of the elements of each columnin general matrix equals 1 through normalizingmethod and the internal dependency matrix can beobtained.
Chang et al. [46] and Wu and Lee [47] investigatedimplementing of a fuzzy DEMATEL. The consideredgroup consisted of 50 experts and specialists (projectmanagers), experienced enough in the �eld of supplierevaluation in a wide range of projects. They were askedto �ll out the questionnaires. The group of expertsincluded 20 experts (project managers), specialists insupplier evaluation. They were asked to express theiropinion through �lling out the questionnaires. Table 1shows the linguistic scales for the importance weight ofcriteria used by specialists.
Regarding the outcome of the DEMATEL methodin Tables 2 and 3, the most important and in uentialindicators are chosen for suppliers and contractors ofthe corresponding company. The selected indicatorsare CR 9, CR 20, CR 14, CR 13, and CR 19 forsuppliers and CR 20, CR 14, CR 13, CR 19, CR 16,CR 17, and CR 2 for contractors. The names of theseindicator are shown in Appendix B. To measure thereliability of the questionnaire, the Cronbach's alphais used in SPSS 21 software. The product of thismethod for our questionnaire is 0.85, which means thequestionnaire is reliable enough. Appendix B shows thenormalized input and output indicators related to eachsupplier and contractor. Due to importance of qualityas one of the main evaluation criteria for performanceof suppliers in civil projects, we decide on the cost ofquality recognition and analysis.
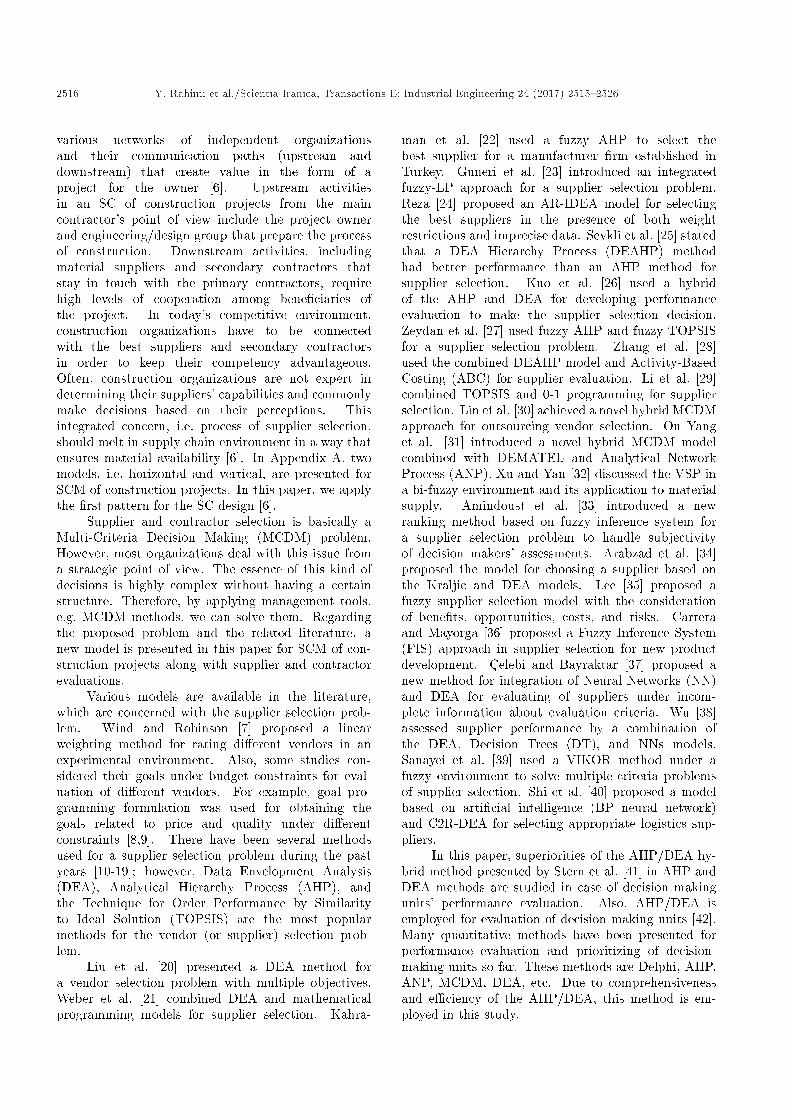
3.2. Analysis of cost of quality indicators inconstruction projects
The concept of quality cost in construction projectswas introduced in early 1980s, when organizations had

Y. Rahimi et al./Scientia Iranica, Transactions E: Industrial Engineering 24 (2017) 2515{2526 2519
Table 2. Prominence and relation axes for the cause ande�ect group for suppliers.
Criteria R+D R�D D R
CR 20 50.3325 {0.66 25.49625 24.83625
CR 14 43.9965 11.913 16.04175 27.95475
CR 13 41.1695 {2.487 21.82825 19.34125
CR 19 40.96125 {2.00725 21.48425 19.477
CR 16 41.4425 1.903 19.76975 21.67275
CR 17 42.36075 2.05475 20.153 22.20775
CR 2 42.234 5.853 18.1905 24.0435
CR 10 39.0045 7.5885 15.708 23.2965
CR 18 37.23375 {0.23025 18.732 18.50175
CR 1 36.98025 {3.59925 20.28975 16.6905
CR 3 36.46425 {0.96075 18.7125 17.75175
CR 4 35.8395 {5.382 20.61075 15.22875
CR 12 35.697 {2.3595 19.02825 16.66875
CR 15 33.579 7.9635 12.80775 20.77125
CR 9 32.817 {11.0085 21.91275 10.90425
CR 8 30.74175 6.04575 12.348 18.39375
CR 6 27.66375 0.86775 13.398 14.26575
CR 7 27.294 {1.515 14.4045 12.8895
CR 11 22.89 0.6555 11.11725 11.77275
CR 5 22.02675 3.86025 9.08325 12.9435
focused on boosting quality of construction projects.Quality costs are assumed to be total cost of compli-ances and non-compliances. The cost of compliancesor reaching a certain level of quality is that spent toprevent a low level of quality and non-compliancesor quality failure; low quality is imposed by defec-tive product or service. A classi�cation model ofprevention, inspection, failure is commonly used tode�ne and classify the cost of quality. Regarding theresearch conducted in construction projects, a non-compliance cost can be reduced from 2 to 10% throughspending more 1% in a prevention phase. Minimizingthe cost of quality to the lowest possible amount isone of the goals of a quality cost system. The basicassumption of P.A.F is that focusing on preventionand inspection will reduce failure cost. In fact, inthis paper, we also design a systematic framework forthe cost of quality, in which the optimum interval isobtained for the mentioned costs. Quality costs arestructured based on the P.A.F model. This approachis achieved by recent studies [48-51] and the experiencesof experts as shown in Figure 2. Since the qualitycost of suppliers is crucial in construction projects andin the P.G. Company, the suppliers and contractorswith the least possible amount of quality costs areselected.
Table 3. Prominence and relation axes for the cause ande�ect group for contractors.
Criteria R+D R�D D R
CR 9 42.35687 {5.81787 24.08737 18.2695
CR 20 30.1555 2.9595 13.598 16.5575
CR 14 33.26155 4.01145 14.62505 18.6365
CR 13 28.52445 {0.06945 14.29695 14.2275
CR 19 28.3096 {3.6736 15.9916 12.318
CR 16 23.9257 4.9713 9.4772 14.4485
CR 10 23.14058 7.921416 7.609584 15.531
CR 17 23.0201 {2.7431 12.8816 10.1385
CR 12 22.52945 {0.30445 11.41695 11.1125
CR 18 22.3249 2.3441 9.9904 12.3345
CR 2 22.1052 9.9528 6.0762 16.029
CR 15 21.53215 6.16285 7.68465 13.8475
CR 3 19.3195 4.3495 7.485 11.8345
CR 1 19.2429 3.0111 8.1159 11.127
CR 4 18.3968 1.9082 8.2443 10.1525
CR 8 17.2017 7.3233 4.9392 12.2625
CR 6 14.8697 4.1513 5.3592 9.5105
CR 11 14.51885 1.17815 6.67035 7.8485
CR 7 14.3548 2.8312 5.7618 8.593
CR 5 12.2623 4.9957 3.6333 8.629
4. AHP/DEA method
The DEA method divides the considered units into twoe�cient and ine�cient groups. The units which score 1in e�ciency are de�ned as e�cient and the others, withe�ciency less than 1, are named ine�cient ones. Themain problem is to rank and prioritize the e�cientwhile the ine�cient units are ranked spontaneously.The presented hybrid DEA/AHP method is to rankdecision making units [41]. In this method, a DEAmodel is initially implemented for each pair of units re-gardless of other units. Afterwards, using the outcomesof solving DEA models, a paired comparison matrix isformed. Then, the AHP method is implemented inlevel 1 to fully rank the units.
The proposed method has some major advan-tages. The inconsistency resulted from mental judg-ments in a paired comparison matrix of the AHP isremoved. The constraints of enterprises are relaxedtowards inputs and outputs. Since in the DEA method,the number of enterprises in comparison with the num-ber of inputs and outputs is relatively high, it leads toa situation that most enterprises score one in e�ciency.As a consequence, prioritizing them can be di�cult. Inthis method, each enterprise is compared with othersand its e�ciency score is calculated. Therefore, the

2520 Y. Rahimi et al./Scientia Iranica, Transactions E: Industrial Engineering 24 (2017) 2515{2526
Figure 2. Recognition framework cost of quality in construction projects.
much e�cient enterprise obtains higher weight than theothers do. In this paper, to evaluate suppliers with theDEA method, wastes, quality costs, and delivery aredeemed to be inputs and the others are considered asoutputs. Moreover, in order to evaluate contractors,reworking costs are assumed as inputs and the othersare considered as outputs.
5. Supply chain design in construction projects
In this study, an innovative dynamic supply chain for areal case study in a construction project is presented.The case study is considered in a civil enterprise,namely, P.G. Company. In this hybrid method,suppliers and contractors are �rst selected throughthe hybrid AHP/DEA/FDEMATEL method. Whileimplementing the project, the project managemento�ce and quality assurance unit are in touch with acontractor and continuously assess the project; also, incase of disruption and failure, the main contractor willbe summoned. In the next step, some new indicatorsare de�ned and combined with the �rst introducedones to evaluate suppliers and contractors when theproject is �nished by project managers. This processis again based on the hybrid DEA/AHP method andthe best ones are selected to establish a rich data basefor the upcoming projects. In fact, the continuousevaluation of projects before initialization, during theexecution, and after completion is an agile approach (itis noteworthy that agility is matched with EFQM 2013and PMBOK, Fifth Edition) to supplier and contractorevaluation in construction projects' SCM. This modelis shown in Figure 4.
5.1. Measuring agility in Construction SupplyChain Model (CSCM)
In this paper, due to importance and novelty of agilityin civil projects, we decided to measure the agility incivil projects through Yield Process method:
Agility=Yield Processoveral =f�
Yield Processcircle1
+ Yield Processcircle2 + Yield Processcircle3
+ Yield Processcircle3
�; (7)
Yield Processcircle n = A� xn; (8)
where A shows the importance rate of each circle intotal Yield Process and xn de�nes each Yield Processin its circle. Therefore, regarding Eqs. (7) and (8), themain equation is as follows:Y Poveral =Axcircle1+Bxcircle2+Cxcircle3+Dxcircle3:
(9)
With respect to Figures 3 and 4, each circle is cal-culated; for instance, circle3 and circle4 show CSI1(Customer Satisfaction Index) and CSI2. To boostthe agility in the supply chain of civil projects, itis necessary to obtain large values for Yield Process.Hence, the total quality cost, mentioned in Section 3.2,will be optimized.
5.2. Ranking suppliers/contractors using ahybrid method
Tables 4 and 5 show the rankings for suppliers and con-tractors according to the hybrid DEA/AHP method.

Y. Rahimi et al./Scientia Iranica, Transactions E: Industrial Engineering 24 (2017) 2515{2526 2521
Figure 3. Measuring yield process.
Table 4. Ranking of suppliers by the DEA/AHP method.
Rank Supplier Weight Rank Supplier Weight1 DMU5 0.04619 21 DMU23 0.022742 DMU6 0.04532 22 DMU31 0.022153 DMU19 0.04499 23 DMU39 0.021854 DMU21 0.04442 24 DMU13 0.021485 DMU24 0.04342 25 DMU1 0.021426 DMU29 0.04294 26 DMU4 0.020877 DMU33 0.04206 27 DMU10 0.019358 DMU2 0.04114 28 DMU22 0.019179 DMU15 0.03910 29 DMU32 0.0178310 DMU26 0.03557 30 DMU38 0.0175511 DMU37 0.03436 31 DMU20 0.0136712 DMU27 0.03198 32 DMU25 0.0126413 DMU30 0.03178 33 DMU18 0.0123814 DMU36 0.03052 34 DMU28 0.0113315 DMU3 0.02963 35 DMU7 0.0103716 DMU9 0.02943 36 DMU8 0.0098617 DMU11 0.02537 37 DMU16 0.0070318 DMU12 0.02474 38 DMU34 0.0053519 DMU14 0.02351 39 DMU35 0.0035320 DMU17 0.02297
Due to some con�dential issues, instead of unit names,we use the DMU to show suppliers and contractors.It is worth mentioning that supplier and contractorevaluation in the P.G. Company is conducted justfor a speci�c project. The AHP method is done viaExcel VBA and the resulted rankings are executedthrough the DEA method in GAMS 24.1.2 softwareon a Pentium 4 system with 2.3 GHz and 4GB RAM.
6. Conclusions and future studies
In this paper, for the �rst time in Iran, we have studiedand designed a supply chain for civil companies. Ahybrid AHP/DEA/FDEA method has been proposedand used to evaluate and prioritize the suppliers and
Table 5. Ranking of contractors by the DEA/AHPmethod.
Rank Supplier Weight Rank Supplier Weight1 DMU3 0.049696 27 DMU1 0.0174242 DMU10 0.048589 28 DMU2 0.0166823 DMU6 0.048181 29 DMU5 0.0165654 DMU7 0.047718 30 DMU15 0.0165465 DMU12 0.046327 31 DMU16 0.0154936 DMU32 0.044829 32 DMU17 0.0143897 DMU48 0.040911 33 DMU23 0.0138438 DMU20 0.030139 34 DMU30 0.0135339 DMU21 0.02941 35 DMU31 0.01315310 DMU27 0.028504 36 DMU37 0.01015111 DMU29 0.028491 37 DMU41 0.0099412 DMU35 0.027769 38 DMU43 0.00943913 DMU36 0.024992 39 DMU47 0.00925714 DMU39 0.024818 40 DMU14 0.00838915 DMU42 0.023091 41 DMU22 0.008316 DMU50 0.021914 42 DMU26 0.00815117 DMU18 0.021627 43 DMU28 0.00809618 DMU19 0.020757 44 DMU8 0.00694519 DMU25 0.019996 45 DMU33 0.00616720 DMU34 0.019083 46 DMU9 0.0053121 DMU38 0.01906 47 DMU11 0.00446622 DMU40 0.018868 48 DMU24 0.00437223 DMU44 0.018637 49 DMU13 0.00326524 DMU45 0.018566 50 DMU4 0.00213925 DMU46 0.01846226 DMU49 0.017549
contractors in the network. First, the most in uentialindicators have been chosen by a fuzzy DEMATELmethod. Afterwards, suppliers and contractors havebeen evaluated according to the DEA method and theselected indicators. However, regarding ine�ciencyof most units, we have applied a hybrid DEA/AHPmethod. Furthermore, in this study, we have focusedon agility of a supply chain. In addition to agility,

2522 Y. Rahimi et al./Scientia Iranica, Transactions E: Industrial Engineering 24 (2017) 2515{2526

Y. Rahimi et al./Scientia Iranica, Transactions E: Industrial Engineering 24 (2017) 2515{2526 2523
it is dynamic and virtual; thus, it is applicable fordi�erent projects. Quality costs have been optimizedthrough applying a yield process approach to agility ofthe supply chain. For future research, it is worthwhileto contribute portfolio management into the proposedmodel.
References
1. Simchi-Levi, D., Kaminsky, P. and Simchi-Levi, E.,Designing and Managing the Supply Chain: Con-cepts, Strategies and Case Studies, 3rd Ed., McGraw-Hill/Irwin (2007).
2. Thomas, D.J. and Gri�n, P.M. \Coordinated supplychain management", European Journal of OperationResearch, 94, pp. 1-15 (1996).
3. Stadtler, H. and Kilger, C., Supply Chain Managementand Advanced Planning: Concepts, Models, Softwareand Case Studies, Springer Verlag (2005).
4. Tabrizi, B.H. and Razmi, J. \A stochastic program-ming based approach for supply chain network designunder uncertain processing costs", In: Proceedingsof the 11th Asia Paci�c Industrial Engineering andManagement Systems Conference (2010).
5. Chopra, S. and Meindle, P., Supply Chain Manage-ment: Strategy, Planning, and Operations, 2nd Ed.,Upper Sadle River: Pearson (2004).
6. Benton, W.C. and McHenry, L.F., Construction Pur-chasing & Supply Chain Management, Mc-Graw Hill,New York (2010).
7. Wind, Y. and Robinson, P.J. \The determinants ofvendor selection: The evaluation function approach",Journal of Purchasing and Materials Management,4(3), pp. 29-41 (1965).
8. Stevens, G.C. \Integrating the supply chain", Interna-tional Journal of Physical Distribution and MaterialsManagement, 19, pp. 3-8 (1989).
9. Sharma, D., Benton, W.C. and Srivastava, R. \Com-petitive strategy and purchasing decisions", In: Pro-ceedings of the 1989 Annual Conference of the DecisionSciences Institute, pp. 1088-1090 (1989).
10. Morlacchi, P. \Vendor evaluation and selection: thedesign process and a fuzzy-hierarchical model", In:Proceedings of the 8th IPSERA Conference, Dublin(1999).
11. Simpson, P.M., Siguaw, J.A. and White, S.C. \Mea-suring the performance of suppliers: An analysis ofevaluation processes", Journal of Supply Chain Man-agement, 38, pp. 29-41 (2003).
12. Al-Faraj, T.N., Alidi, A.S. and Al-Zayer, J.A. \Vendorselection via a spreadsheet analytical hierarchy pro-cess", Computers and Industrial Engineering, 25(1-4),pp. 65-68 (1993).
13. Bhutta, K.S. and Huq, F. \Supplier selection problem:A comparison of totalcost of ownership and analyticalhierarchy process approach", Supply Chain Manage-ment: An International Journal, 7, pp. 126-135 (2002).
14. Wang, G., Huang, S.H. and Dismukes, J.P. \Product-driven supply chain selection using integrated multi-criteria decision-making methodology", InternationalJournal of Production Economics, 91, pp. 1-15 (2004).
15. Bello, M.J.S. \A case study approach to the supplierselection process", Master Thesis, University of PuertoRico (2003).
16. Ding, H., Benyoucef, L. and Xie, X. \A simulation-optimization approach using genetic search for supplierselection", In: Proceedings of the 2003 Winter Simula-tion Conference (2003).
17. Das, S.K. and Shahin, H. \Models for supply chainvendor selection in E-Markets", Journal of the ChineseInstitute of Industrial Engineers, 20, pp. 231-239(2003).
18. Razmi, J., Ra�ei, H. and Hashemi, M. \Designing adecision support system to evaluate and select suppli-ers using fuzzy analytic network process", Computers& Industrial Engineering, 57, pp. 1282-1290 (2009).
19. Azadeh, A. and Alem, S.M. \A exible determinis-tic, stochastic and fuzzy data envelopment analysisapproach for supply chain risk and vendor selectionproblem: Simulation analysis", Expert Systems withApplications, 37, pp. 7438-7448 (2010).
20. Liu, J., Ding, F.Y. and Lall, V. \Using data envel-opment analysis to compare suppliers for supplier se-lection and performance improvement", Supply ChainManagement: An International Journal, 5, pp. 143-150 (2000).
21. Weber, C.A., Current, J.R. and Desai, A. \Non-cooperative negotiation strategies for vendor selec-tion", European Journal of Operational Research, 108,pp. 208-223 (1998).
22. Kahraman, C., Cebeci, U. and Ulukan, Z. \Multi-criteria supplier selection using fuzzy AHP", Logistics,Information Management, 16, pp. 382-394 (2003).
23. Guneri, A.F., Yucel, A. and Ayyildiz, G. \An in-tegrated fuzzy-LP approach for a supplier selectionproblem in supply chain management", Expert Systemswith Applications, 36, pp. 9223-9228 (2009).
24. Reza, S. \Supplier selection by the new AR-IDEAmodel", International Journal of Advanced Manufac-turing Technology, 39, pp. 1061-1070 (2009).
25. Sevkli, M., Lenny Koh, S.C., Zaim, S., Demirbag, M.and Tatoglu, E. \An application of data envelopmentanalytic hierarchy process for supplier selection: A casestudy of BEKO in Turkey", International Journal ofProduction Research, 45, pp. 1973-2003 (2007).
26. Kuo, R.J., Lee, L.Y. and Hu, T.L. \Developing asupplier selection system through integrating fuzzyAHP and fuzzy DEA: A case study on an auto lightingsystem company in Taiwan", Production Planning &Control: The Management of Operations, 21, pp. 468-484 (2010).
27. Zeydan, M., C�olpan, C. and C�obano�glu, C. \A com-bined methodology for supplier selection and perfor-mance evaluation", Expert Systems with Applications,38, pp. 2741-2751 (2011).

2524 Y. Rahimi et al./Scientia Iranica, Transactions E: Industrial Engineering 24 (2017) 2515{2526
28. Zhang, X., Lee, C.K. and Chen, S. \Supplier evalua-tion and selection: A hybrid model based on DEAHPand ABC", International Journal of Production Re-search, 50, pp. 1877-1889 (2012).
29. Li, W., Chen, Y. and Fu, Y. \Combination of TOP-SIS and 0-1 programming for supplier selection", In:Proceedings of the IEEE International Conference onSupply Chain Management, Networking, Sensing andControl (ICNSC), pp. 1531-1535 (2008).
30. Lin, Y.T, Lin, L., Yu, H.C. and Tzeng, G.H. \Anovel hybrid MCDM approach for outsourcing vendorselection: A case study for a semiconductor companyin Taiwan", Expert Systems with Applications, 37, pp.4796-804 (2010).
31. Ou Yang, Y.P., Shieh, H.M., Leu, J.D. and Tzeng,G.H. \A novel hybrid MCDM model combined withDEMATEL and ANP with applications", Interna-tional Journal of Operations Research, 5, pp. 160-168(2008).
32. Xu, J. and Yan, F. \A multi-objective decision makingmodel for the vendor selection problem in a bi-fuzzyenvironment", Expert Systems with Applications, 38,pp. 9684-9695 (2011).
33. Amindoust, A., Ahmed, S.H. and Sagha�nia, A.\Location decision of supply chain management inthe auto motive industry", International Journal ofEngineering and Applied Sciences, 1, pp. 64-67 (2012).
34. Arabzad, S.M., Bahrami, M. and Ghorbaniz, M. \Inte-grating Kano-DEA models for distribution evaluationproblem", Procedia-Social and Behavioral Sciences,41, pp. 506-512 (2012).
35. Lee, A.H.I. \A fuzzy supplier selection model withthe consideration of bene�ts, opportunities, costs andrisks", Expert Systems with Applications, 36(2), pp.2879-2893 (2009).
36. Carrera, D.A and Mayorga, R.V. \Supply chain man-agement: A modular fuzzy inference system approachin supplier selection for new product development",Journal of Intelligent Manufacturing, 19, pp. 1-12(2008).
37. C�elebi, D. and Bayraktar, D. \An integrated neuralnetwork and data envelopment analysis for supplierevaluation under incomplete information", Expert Sys-tems with Applications, 35, pp. 1698-1710 (2008).
38. Wu, D. \Supplier selection: A hybrid model usingDEA, decision tree and neural network", Expert Sys-tems with Applications, 36, pp. 9105-9112 (2009).
39. Sanayei, A., Mousavi, S.F. and Yazdankhah, A.\Group decision making process for supplier selectionwith VIKOR under fuzzy environment", Expert Sys-tems with Applications, 37, pp. 24-30 (2010).
40. Shi, C.D., Bian, D.X. and Li, S.L. \Application ofBP neural network and DEA in the logistics supplierselection", In: Proceedings of the 2nd InternationalConference on Computer Engineering and Technology(ICCET), pp. 361-364 (2010).
41. Sinuany-Stern, Z., Mehrez, A. and Hadad, H. \AnAHP/DEA methodology for ranking decision makingunits", International Transactions in Operational Re-search, 7, pp. 109-124 (2000).
42. Cai, Y. and Wu, W. \Synthetic �nancial evaluation bya method of combining DEA with AHP", InternationalTransactions in Operational Research, 8, pp. 603-609(2001).
43. Fontela, E. and Gabus, A. \The DEMATEL observer",DEMATEL 1976 Report Switzerland Geneva: BattelleGeneva Research Centre (1976).
44. Azadeh, A., Rezaei-Malek, M., Evazabadian, F. andSheikhalishahi, M. \Improved design of CMS by con-sidering operators decision-making styles", Interna-tional Journal of Production Research, 53, pp. 3276-3287 (2015).
45. Zahiri, B., Tavakkoli-Moghaddam, R. and Rezaei-Malek, M. \An MCDA-DEA approach for mixed-model assembly line balancing problem under uncer-tainty", Journal of Intelligent & Fuzzy Systems, 30,pp. 2737-2748 (2016).
46. Chang, B., Chang, C.W. and Wu, C.H. \Fuzzy DEMA-TEL method for developing supplier selection criteria",Expert Systems with Applications, 38, pp. 1850-1858(2011).
47. Wu, W.W. and Lee, Y.T. \Developing global man-ager's competencies using the fuzzy DEMATELmethod", Expert Systems with Applications, 32, pp.499-507 (2007).
48. Kazaz, A., Birgonul, M. and Ulubeyli, S. \Cost-basedanalysis of quality in developing countries: a case studyof building projects", Building and Environment, 40,pp. 1365-1356 (2005).
49. Abdelsalam, H. and Gad, M. \Cost of quality in Dubai:An analytical case study of residential constructionprojects", International Journal of Project Manage-ment, 27, pp. 501-511 (2009).
50. Hall, M. and Tomkins, C. \A cost of quality analysisof a building project: towards a complete methodologyfor design and build", Construction Management andEconomics, 19, pp. 727-740 (2001).
51. Forouzanfar, F., Tavakkoli-Moghaddam, R., Bashiri,M. and Baboli, A. \A new bi-objective model for aclosed-loop supply chain problem with inventory andtransportation times", Scientia Iranica, TransactionE, 23, pp. 1441-1458 (2016).
Appendix A
Figures A.1 and A.2. show the representation of thevertical and horizontal supply chains in constructionprojects, respectively.
Appendix B
Tables B.1 and B.2 show the supplier and contractor'scriteria scores, respectively.

Y. Rahimi et al./Scientia Iranica, Transactions E: Industrial Engineering 24 (2017) 2515{2526 2525
Figure A.1. Representation of supply chain in vertical construction projects in private and public sections.
Figure A.2. Representation of horizontal supply chain and large-scale construction projects in public sections.
Table B.1. Criteria scores of suppliers.
Cost ofquality
Guarantee andwarranty
Waste anddamages
Equipment Delivery Supplier
0.0282 0.0296 0.0308 0.0221 0.0276 1
0.0282 0.0296 0.0308 0.0294 0.0276 2
0.0282 0.0222 0.0308 0.0294 0.0276 3
0.0282 0.0222 0.0308 0.0221 0.0276 4
| | | | | |
| | | | | |
| | | | | |
0.0282 0.0222 0.0154 0.0294 0.0276 37
0.0282 0.0222 0.0308 0.0221 0.0276 38
0.0282 0.0296 0.0154 0.0221 0.0276 39

2526 Y. Rahimi et al./Scientia Iranica, Transactions E: Industrial Engineering 24 (2017) 2515{2526
Table B.2. Criteria scores of contractors.
Abilitytechnical
and planningNative Rework costs Financial Reliability History Experience Contractors
0.0182 0.0127 0.0217 0.0234 0.0196 0.0245 0.0185 10.0182 0.0253 0.0217 0.0156 0.0196 0.0184 0.0185 20.0242 0.0253 0.0109 0.0234 0.0261 0.0245 0.0247 30.0121 0.0127 0.0217 0.0156 0.0196 0.0184 0.0185 4
| | | | | | | || | | | | | | || | | | | | | |
0.0242 0.0190 0.0109 0.0234 0.0196 0.0184 0.0185 480.0242 0.0253 0.0217 0.0156 0.0196 0.0184 0.0185 490.0182 0.0253 0.0109 0.0156 0.0196 0.0184 0.0247 50
Biographies
Yaser Rahimi is a PhD student of Industrial Engi-neering in the Collage of Engineering at University ofTehran, Iran. He received his MSc degree in IndustrialEngineering from University of Tehran, Iran, in 2014and his BSc degree in Industrial Engineering fromUniversity of Kurdistan, Iran, in 2011. His research in-terests include hub location, transportation, operationsresearch, meta-heuristic methods, exact optimizationmethods, and supply chain management. Yaser Rahimipublished 12 papers related to hub location problemsand supply chain in journals.
Reza Tavakkoli-Moghaddam is Professor of In-dustrial Engineering in the College of Engineering atUniversity of Tehran, Iran. He obtained his BSc, MSc,and PhD degrees from Iran University of Science andTechnology, Tehran, in 1989; University of Melbourne,Melbourne, in 1994; and Swinburne University of Tech-nology, Melbourne, in 1998, respectively. He serves asthe Editor-in-Chief of two journals and the EditorialBoard Member of �ve journals. He was the recipientof the 2009 and 2011 Distinguished Researcher Awardsas well as the 2010 and 2014 Distinguished AppliedResearch Awards by University of Tehran in Iran. He
was also selected as National Iranian DistinguishedResearcher in 2008 and 2010 by the Ministry of Science,Research and Technology (MSRT) in Iran. He obtainedthe outstanding rank of being among the top 1%scientists and researchers in the world elite group,reported by Thomson Reuters in 2014. ProfessorTavakkoli-Moghaddam has published 4 books, 17 bookchapters, and more than 700 papers in reputableacademic journals and conferences.
Sirous Shojaie received his MSc degree in Indus-trial Engineering at Iran University of Science andTechnology in Iran (2014). He obtained his BSc de-gree in Industrial Engineering from the Imam HosseinComprehensive University in Tehran, Iran, in 2001.His research interests include location, transportation,quality management system, six-sigma, and total qual-ity management.
Esmail Cheraghi received his MSc degree in Indus-trial Engineering from Collage of Engineering at Uni-versity of Tehran, Iran, in 2015. He obtained his BScdegree in Theory Economics from Allameh Tabataba'iUniversity, Iran, in 1985. His research interests includelocation, transportation, quality management system,hub location, and �nance management.


