Page 1
Design of Energy Efficient Clustering Protocol
for Wireless Body Area Networks
Sailesh Kumar Upadhyaya
(111CS0160)
Ragini Patel
(111CS0148)
Department of Computer Science and Engineering
National Institute of Technology Rourkela
Orissa, India, 769008
Page 2
Design of Energy Efficient Clustering Protocol for
Wireless Body Area Networks
Thesis submitted
to the Department of
Computer Science and Engineering
of
National Institute of Technology Rourkela
in partial fulfillment of the requirements
for the Degree of
Bachelor of Technology in
Computer Science and Engineering by
Sailesh Kumar Upadhyaya (111CS0160)
&
Ragini Patel (111CS0148)
under the guidance of
Dr. Suchismita Chinara
Department of Computer Science and Engineering
National Institute of Technology Rourkela
Orissa, India, 769008
Page 3
ii
Department of Computer Science and Engineering
National Institute of Technology Rourkela
Orissa, India, 769008
Dr. Suchismita Chinara
Assistant Professor
May 10, 2015
Certificate
This is to certify that the thesis entitled Design of Energy Efficient Clustering Protocol for
Wireless Body Area Networks by Sailesh Kumar Upadhyaya & Ragini Patel is a record of an
original research work carried out under my guidance and supervision in partial fulfillment of the
requirements for the award of the degree of Bachelor of Technology in Computer Science and
Engineering.
Dr. Suchismita Chinara
Assistant Professor
Department of CSE, NIT Rourkela
Page 4
iii
Acknowledgment
All the efforts we have put forward in carrying out this project would have been incomplete, if
not for the kind and valuable support of many individuals as well as the institute. We would
like to express our gratitude to all of them.
Foremost, we would like thank our supervisor of this project, Dr. Suchismita Chinara,
Dept. of Computer Science and Engineering, NIT, Rourkela, for her incalculable and valuable
contribution in the project. She stimulated us to work on the topic and provided valuable
information which helped in completing the project through various stages. We would also like
to acknowledge her exemplary guidance, monitoring and constant encouragement throughout
the course of this thesis.
We are thankful to all the professors of the Dept. of Computer Science and Engineering,
NIT Rourkela for instilling in us the basic knowledge about the subjects that greatly benefitted
us while carrying out the project and achieving the goal.
Sailesh Kumar Upadhyaya
Ragini Patel
Page 5
iv
Abstract
The research in Wireless Body area Networks (WBAN) has taken an exponential growth in last
decade. The advances in wireless communication among the invasive / non-invasive micro
sensors along with the Micro Electro Mechanical systems (MEMS) technology have enabled the
deployment of wireless body area networks (WBANs) in and around the human body for e-health
monitoring. The main aim of WBANs is to improve the speed, accuracy and reliability of
communication of sensors inside in the close proximity of the human body. Wearable WBAN in
medical applications can be used either for disability assistance or human performance
management. In case of wearable BANs, the sensor nodes may be deployed in a wearable device
like a brain cap, chest jacket or even a bracelet etc. The sensors sense the body parameters and
send it to the base station for further processing. The resource constrained, miniature sized sensors
meet several challenges while communicating to the base station. A routing protocol basically
decides the energy consumption in the network. So, designing a routing protocol that will extend
the life of sensors and hence the life of WBAN is the main goal. This thesis proposes a
distributed clustering algorithm that aims to provide a longer network life time by the fair
distribution of energy consumption among the sensor nodes.
Keywords: WBAN, Micro-sensor, MEMS, routing protocol, clustering.
Page 6
v
Contents
Certificate ii
Acknowledgement iii
Abstract iv
Contents v
List of Figures vii
1. Introduction………………………………………………………………… 1
1.1 Wireless Body Area Networks………………………………………… 1
1.2 WSN vs WBAN………………………………………………………... 2
1.3 First Order Radio Model………………………………………………... 3
1.4 Clustering……………………………………………………………….. 4
1.5 Problem Statement……………………………………………………… 5
2. Literature Survey…………………………………………………………….. 7
3. Proposed Algorithm………………………………………………………….. 13
3.1 Distributed Cluster Head Protocol………………………………………. 13
3.2 How DCH Protocol is Advantageous? ..................................................... 18
4. Simulation Results and Analysis……………………………………………... 19
4.1 Case Study Analysis of different locations of Base Station……………… 20
4.2 Simulation of DCH Protocol…………………………………………….. 24
5. Conclusion…………………………………………………………………… 30
Dissemination………………………………………………………………… 31
Bibliography…………………………………………………………………. 32
Page 7
vi
List of Figures
1.1 Wireless Body Area Networks
1.2 First Order Radio Model
1.3 Clustering
2.1 WBAN Architecture
2.2 LEACH
4.1 LEACH vs LEACH-C
4.2 Four Regions
4.3 Location of BS is nearer to one of the four regions (Case 1)
4.4 Location of BS is at the center (Case 2)
4.5 Percentage of clusters for different transmission ranges
4.6 Distribution of sensors per cluster
4.7 Comparison for average energy consumption
4.8 Comparison of algorithms for number of alive nodes in different rounds of simulation
Page 8
1
Chapter 1
Introduction
1.1 Wireless Body Area Networks
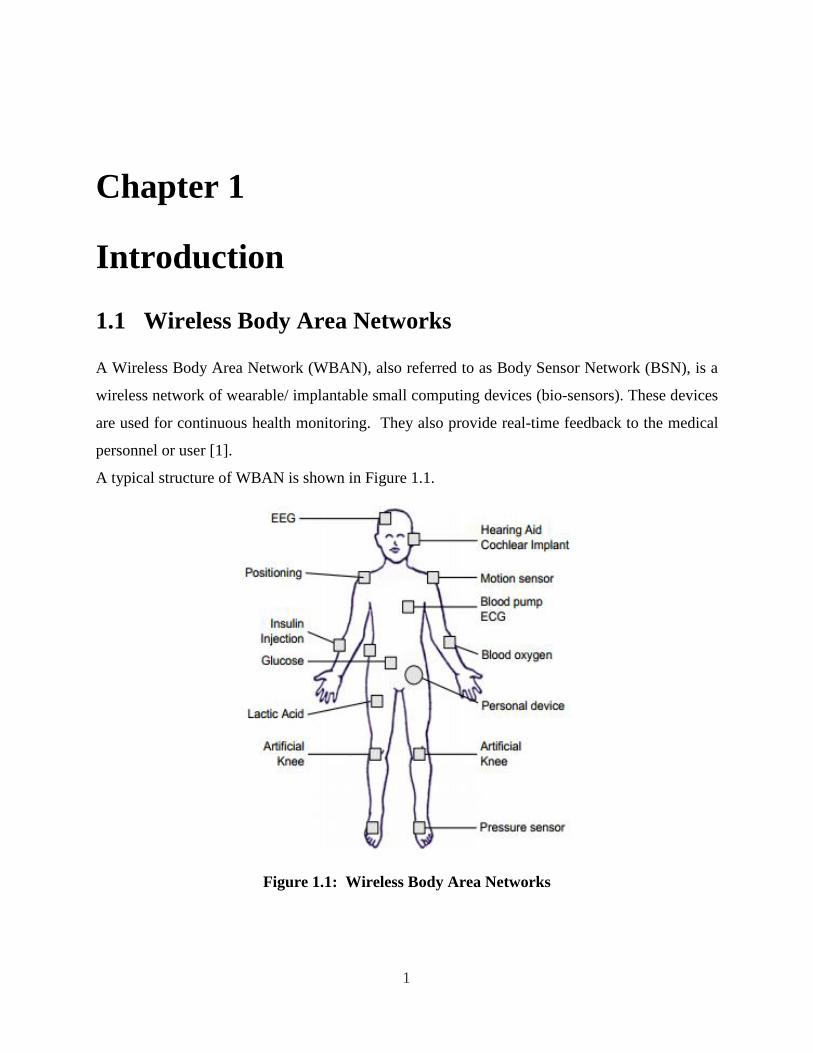
A Wireless Body Area Network (WBAN), also referred to as Body Sensor Network (BSN), is a
wireless network of wearable/ implantable small computing devices (bio-sensors). These devices
are used for continuous health monitoring. They also provide real-time feedback to the medical
personnel or user [1].
A typical structure of WBAN is shown in Figure 1.1.
Figure 1.1: Wireless Body Area Networks
Page 9
2
1.2 WSN vs WBAN Introduction
1.2 WSN vs WBAN
WSN (Wireless Sensor Network) is a network of spatially distributed autonomous sensor nodes
which cooperatively monitor physical or environmental area and pass their data to main location
i.e. Base Station (BS). Various techniques from ad hoc networks and Wireless Sensor Networks
(WSNs) can be used for facilitating communication between WBAN devices. Differences
between a WBAN and a WSN are as follows [7]:
The devices/sensors have a very small form factor (often less than 1 cubic centimeter), so
they have limited energy available. It is very difficult to change or recharge the batteries
once implanted. So, devices which can last for decades are required. Hence, the available
energy, computational power and available memory of the devices are limited for
WBAN.
The devices are added only when they are required for some application as all the devices
have equal importance. So, no redundant devices are available in case of WBAN.
Redundant devices can be available in WSNs.
A very low transmission power per node is required to minimize interference. This can
also cope with required health concerns.
The waves must be attenuated before they reach the receiver because propagation takes
place in lossy (human body) medium.
The devices in WSN are static whereas in WBAN, devices can be in motion as they are
located in the human body. Therefore robustness in WBANs is required in order to cope
with frequent changes in network topology.
Page 10
3
1.3 First Order Radio Model Introduction
High reliability and low delay is required as the data contains mostly medical
information.
High security mechanisms are required for ensuring the security of confidential
information and private medical data.
The devices are generally heterogeneous because they may have different demands and
requirements. They may require different resources of the network in terms of power
consumption, reliability and data rates.
1.3 First Order Radio Model
A simple radio model is shown in Figure 1.2[5].
Figure 1.2: First Order Radio Model
Page 11
4
1.4 Clustering Introduction
So, energy used for transmitting k-bit message for d distance is given by:
𝐸𝑇𝑥(𝑘, 𝑑) = 𝐸𝑇𝑥−𝑒𝑙𝑒𝑐 (𝑘) + 𝐸𝑇𝑥−𝑎𝑚𝑝(𝑘, 𝑑)
𝐸𝑇𝑥(𝑘, 𝑑) = 𝐸𝑒𝑙𝑒𝑐 ∗ 𝑘 +∈𝑎𝑚𝑝∗ 𝑘 ∗ 𝑑2
And for receiving k-bit message, energy used is:
𝐸𝑅𝑥(𝑘) = 𝐸𝑅𝑥−𝑒𝑙𝑒𝑐 (𝑘)
𝐸𝑅𝑥(𝑘) = 𝐸𝑒𝑙𝑒𝑐 ∗ 𝑘
1.4 Clustering
In this protocol, nodes are organized into groups called clusters. Each cluster has a local base
station known as cluster head. The cluster forming mechanism is deployed to form virtual
clusters and a cluster head for its cluster. These cluster heads broadcast a message to its cluster
members denoting its id and a time slot. Cluster members send their data to cluster head on their
respective time slots. Cluster head aggregates all the data collected from its cluster members
removes the redundant data, and then transmit it to the base station. It minimizes the energy
consumption in the network and number of messages communicated to the base station. It also
reduces the number of active nodes in communication. Final result of clustering the sensor nodes
is enhancing lifespan of the network. Fig. 1.3 shows a basic clustering sensor network.
Advantages of Clustering:
(i) Transmit aggregated data to the data sink
(ii) Reducing number of nodes taking part in transmission
(iii) Useful Energy consumption and efficient use of resources in WSNs
(iv) Scalability for large number of nodes
(v) Reduces communication overhead
(vi) Removes redundant data.
(1)
(2)
Page 12
5
1.5 Problem Statement Introduction
Figure 1.3: Clustering
1.5 Problem Statement
The main aim of this project is to find the more energy efficient protocol. Wireless body area
networks are battery operated. Sensor nodes collect the data and pass them on to the network for
further use. This passing and receiving of data utilizes most of the energy of the network. So for
better operation and increase the lifetime of the network, energy consumption must be the major
factor of concern. In this project, a new protocol has been proposed for the uniform distribution
of cluster heads.
The objectives of proposed algorithm are as follows:
1. Minimize the energy dissipation of the network.
2. Increase the life time of the network.
4. Uniform distribution of cluster heads in the network.
Page 13
6
The rest of the thesis is organized as follows. Chapter 2 provides a literature survey on the
existing work in the area of wireless body area networks and the clustering protocols for micro
sensors. Chapter 3 proposes the new protocol, Distributed Cluster Head Protocol, followed by its
simulation results and analysis in Chapter 4. Finally, Chapter 5 concludes the thesis.
Page 14
7
Chapter 2
Literature Survey
Biosensors in WBANs are a network of multiple battery operated devices having limited
energy and computational capability, lacking robustness and scalability with a demand of
continuous operation. Though the technology used for communication in biosensors do not
match exactly with the conventional sensor network, but a brief review of the existing work in
the related area would help in establishing the ground work of our proposal.
The sensors in wearable WBANs for
medical applications are capable of
monitoring the sleep disorders of patients,
sleepiness at work and drowsy drivers,
monitoring allergic agents in air for
asthma patients, assessing soldier fatigue
and battle readiness in battle field, and
glucose diagnoses of diabetic patients.
The sensed data is collected into an
intelligent node or a PDA that works as an
interface between the patient and a remote
server that stores the patient data. The
current status of the patient is analyzed
and diagnosed by the expert at the server
side and appropriate medication is advised
Figure 2.1: WBAN Architecture
Page 15
8
Chapter 2 Literature Survey
for the patient. The three layer architecture of such a wearable WBAN is provided Fig 2.1. [2].
Some of the issues involved in designing energy efficient protocols for WBANs are similar to
that of between the biosensors on the wearable device and the PDA. Achieving a longer network
life time for a sustainable communication between the sensors and the remote server has been a
constant research issue during last few years.
Body Area Network (BAN) is a network of wearable or implanted wireless sensor nodes.
Human body is composed mainly of water, which is the primary medium of transmission of
information from sensor nodes to Base Station [4]. Ultrasonic waves are preferred as information
carriers because of its low absorption, less heating effects in human tissue and less interference
than any other electromagnetic waves. Ultra sonic waves are characterized by physical
parameters such as Amplitude (A), Propagation speed(c), Pressure (p), Particle velocity(u),and
Intensity(I). Attenuation of these waves in human body mainly occurs due to absorption and
scattering. So, the pressure of the wave decreases with increasing distance.
Pressure at a distance d is governed by the following equation
𝑃(𝑑) = 𝑃0 𝑒−𝛼𝑑
Where, 𝛼 = 𝑎 𝑓𝑏
a and b are constants and f is the operating frequency.
The ultrasonic waves used for carrying information to Base Station are propagated by an
electrical transducer [3]. This transducer comprises of an active element, wear plate and a
backing. The active element (a piezoelectric substance) is used to convert electrical signals to
mechanical waves and vice versa. The backing absorbs the radiations generated from back
surface of active element and the wear plate is used for protection of active element from
corrosion. The energy consumption comes from mostly from the transducer. The transducer is
composed of a parallel plate capacitor, and the power consumption occurs because of charging
and discharging this capacitor. The power consumption is given by
𝑃𝑐 = 𝑓 𝐶0
Page 16
9
Chapter 2 Literature Survey
Where, f is repetition frequency and Co is the capacitance.
It can also be expressed in terms of maximum pressure of ultrasonic waves Pmax, Co and
thickness of transducer which is expressed as
𝑃𝑐 = 𝐶0 (𝑔33 𝑃𝑚𝑎𝑥 𝑡ℎ)2 [𝑊]
Where, g33 is a constant that relates mechanical pressure and electrical displacement.
LEACH (Low Energy Adaptive Clustering Hierarchy) is the first energy efficient cluster
based hierarchical routing protocol proposed by W. R. Heinzelman et al. in 2000 [5]. LEACH
gives the guarantee about the allocation of energy in sensor node homogeneously. TL-LEACH is
a protocol based on LEACH proposed by V. Loscri et al. in 2005 [11]. TL-LEACH uses two
level hierarchies for the formation of clusters. Based on the ideology of LEACH, Taewook Kang
et al. proposed a centralized LEACH (LEACH-C) in 2007 [12]. LEACH-C uses high energy
base station for selecting cluster heads in each round. In this section, we will review two main
clustering algorithms: LEACH and LEACH-C.
LEACH is one of the cluster based protocol in which one of the sensor node in each cluster acts
as a cluster head. Nodes in the clusters transmit their data to cluster-head that aggregates the data
(DATA FUSION) and send the data to the base station. It gives the guarantee about the
allocation of energy in the sensor node homogeneously. The selection of cluster head in LEACH
is dynamic in nature. There is a randomized rotation of the cluster-head position such that it
rotates among different sensors and hence does not drain the battery of a single sensor. Figure
2.2 shows a simple structure of LEACH. The operation of LEACH is divided into rounds, where
each round begins with a set-up phase and a steady state phase.
In Set Up phase, every node in a cluster decides whether they want to become a cluster head
based on a randomized formula. The nodes select a value from 0 to 1.If the number is less than
the threshold value, then it becomes the cluster head for a particular round.
Page 17
10
Chapter 2 Literature Survey
𝑇(𝑛) =𝑃
1 − P x (r mod P−1) ∀𝑛 ∈ 𝐺
𝑇(𝑛) = 0 ∀𝑛 ∉ 𝐺
Where,
n – Random number between 0 and 1
P – Cluster head probability
G - Set of nodes that weren’t cluster heads the previous rounds
Each cluster head broadcasts an advertisement message and a TDMA slot to its cluster members.
Figure 2.2: LEACH
Cluster members send their data to their cluster head on their respective time slots in the Steady
State Phase. After receiving all its cluster members’ data, it aggregates all the data received and
transmit to the Base Station. This aggregation of data is called fusion which removes all the
redundant and unnecessary data which saves a lot of energy required for transmission thus
fostering the efficiency of wireless sensor network.
Page 18
11
Chapter 2 Literature Survey
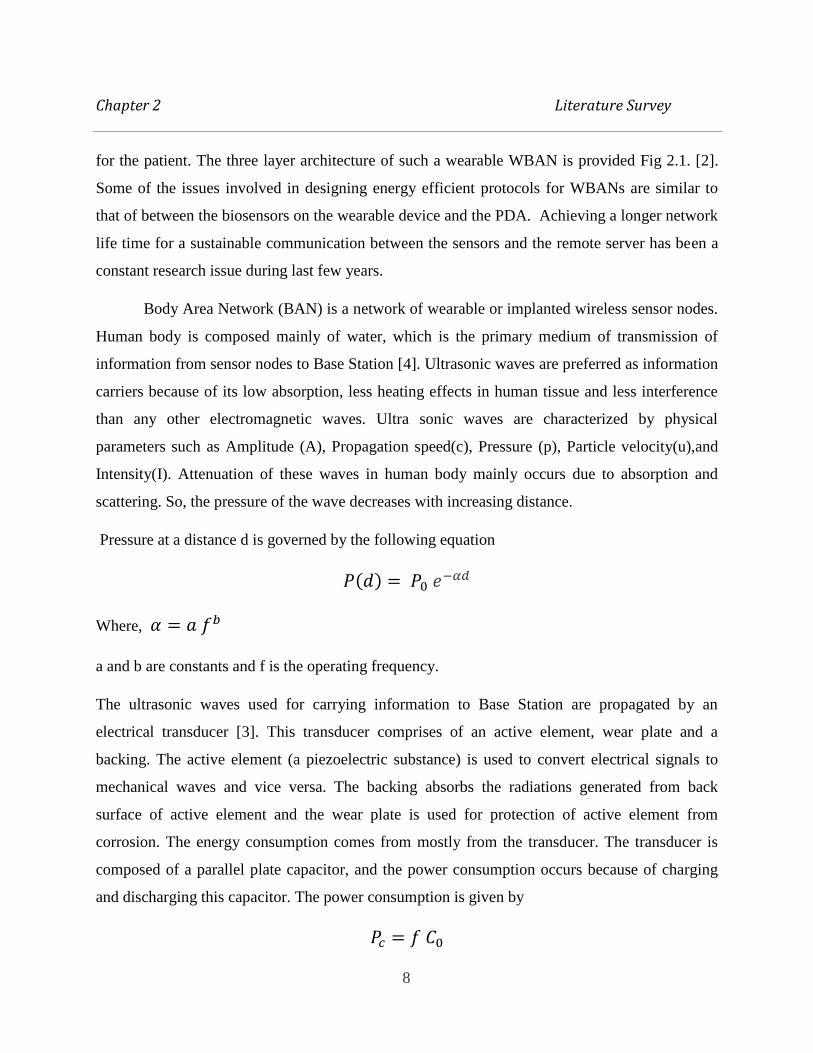
LEACH protocol is analyzed to have the following drawbacks:
It stands on a peculiar assumption that all nodes are within the transmission range of each
other and the base station, which is not feasible for most of the scenarios.
Selection of random number of cluster heads and their random placements in the
network. That is Cluster heads are not uniformly distributed.
For cluster head sparse regions, sensor nodes have to transmit their data to long distance
resulting high energy consumption.
LEACH doesn’t consider energy consumption for cluster head selection. This may
generate nodes with low residual energy as cluster heads which will lead to shorten the
lifetime of network.
Even if less number of nodes is available, then also these protocols select some definite
% of members as cluster heads. So, this high frequency of selection of cluster heads even
if less nodes are available wastes a lot of energy consumption.
This poor cluster set up was resolved by a central control algorithm LEACH-C that
aimed to disperse the cluster heads throughout the network. This protocol differs from the
LEACH only in the cluster setup phase. During this phase, the base station selects the cluster
heads depending on their available battery power. But in LEACH-C, cluster heads are not
uniformly distributed. Some cluster heads may be scattered in one particular region while
some regions may not contain any cluster heads. So, for those cluster head sparse regions,
sensor nodes have to transmit their data to long distance resulting high energy consumption
which can be reduced if some of the cluster heads from cluster head dense regions were
present.
Page 19
12
Chapter 2 Literature Survey
After the cluster heads are selected it follows a similar procedure as LEACH to send data to Base
Station. But in cluster head selection, each sensor has to transmit data to Base Station causing
high energy consumption. Energy Transmission is given by
𝐸𝑡𝑟𝑎𝑛𝑠(𝑘, 𝑑) = 𝐸𝑒𝑙𝑒𝑐 ∗ 𝑘 +∈𝑓𝑠∗ 𝑘 ∗ 𝑑2 if d < d0
𝐸𝑡𝑟𝑎𝑛𝑠(𝑘, 𝑑) = 𝐸𝑒𝑙𝑒𝑐 ∗ 𝑘 +∈𝑚𝑝∗ 𝑘 ∗ 𝑑4 if d ≥ d0
Here threshold,
𝑑𝑜 = √∈𝑓𝑠
∈𝑚𝑝
The transmission energy of transmitting a k-bit message for the distance d will cost 𝐸𝑡𝑟𝑎𝑛𝑠;
∈𝑓𝑠 and ∈𝑚𝑝 are the power consumption of transferring 1 bit of data in different condition. In
LEACH-C, Base Station always selects sensor nodes with high residual energy as cluster heads,
so the sensor nodes live for longer period as compared to LEACH.
Page 20
13
Chapter 3
Proposed Algorithm
As once sensors are implanted in body, it becomes difficult to replace them. So, we are
focusing mainly on increasing the life span of network. Thus we propose a protocol, Distributed
Cluster Head Protocol that achieves the required goal by reducing average energy consumed in
the network through uniform distribution of cluster heads.
3.1 Distributed Cluster Head Protocol (DCH)
As discussed by the authors of [1], wearable WBANs are somehow similar to MANET with
respect to group based movement rather than the node based movement. There exist several
routing protocols for MANET [1] and WSN [1]. However, those are not suitable for the WBANs
as the network is more energy constrained in comparison to the others. The proposed algorithm
aims to achieve a longer network life time in order to avoid frequent recharge or replacement of
the nodes in the wearable WBAN device.
Basics of the algorithm
The proposed algorithm has three stages in a round. The cluster head selection phase, in
which virtual cluster heads are selected evenly distributed throughout the network, the cluster
formation phase, in which the cluster members affiliate to the cluster heads and the steady state
phase, in which the data transmission takes place. Each of these stages has been described in
detail.
Page 21
14
3.1 Distributed Cluster Head Protocol Proposed Algorithm
Assumptions for the proposed algorithm:
Every node has a distinct ID.
Base Station has infinite amount of energy.
All the sensor nodes are capable of sending and receiving data by adjusting their transmission
power.
All the sensor nodes have the ability to put themselves in sleep state when no data is
available to transmit.
All the sensor nodes may or may not be in the communication range of the base station.
All the sensor nodes are static.
All the sensors are time synchronized by the base station and start the cluster head process at
the same time.
Cluster Head Selection: The entire WBAN is divided into number of logical clusters. Every
cluster has a cluster head that works as the local coordinator for that cluster. The base station
selects the cluster heads depending on its degree of connectivity and its available battery power.
The weights of each node are calculated as:
𝑤𝑖 = 𝑤1 ∗ |𝑛𝑖| + 𝑤2 ∗ 𝑒𝑛𝑒𝑟𝑔𝑦𝑎𝑣𝑎𝑖𝑙
The degree of connectivity |𝑛𝑖| decides how many members can be served by a cluster head A
higher degree of connectivity is preferred to reduce the number of cluster heads in the network
and for uniform distribution of cluster heads in the network. |𝑛𝑖| ensures the cluster heads are
formed where density of nodes is high. Reducing the number of cluster heads will reduce the
aggregation cost of the same data sensed by the nearby sensors. However, too less or too many
numbers of members result in poor performance of the network. So this number needs to be
optimized in future work.
(1)
Page 22
15
3.1 Distributed Cluster Head Protocol Proposed Algorithm
𝑒𝑛𝑒𝑟𝑔𝑦𝑎𝑣𝑎𝑖𝑙 is the currently available energy of the node. This decides the life time of a node.
A node having higher available energy is preferred to become the cluster head so that it does not
die out while forwarding the data from its members.
𝑤1and 𝑤2 are weighing factors for degree of connectivity and residual energy respectively, such
that, 𝑤1 + 𝑤2 =1
Higher value of w2 is preferred in order to give more weightage to energy factor as compared to
connectivity factor because life span of network is very much significant in case of WBAN.
Once the nodes compute their corresponding weight, they transmit to the IPDA along
with their IDs. Being an intelligent device the IPDA has the knowledge of the sensor locations.
After receiving the weight information from the sensors, the IPDA finds the node having the
highest weight. During the initial cluster head selection phase, the node having the highest
weight is selected as the first cluster head. In case of tie, any node could be chosen randomly as
the cluster head. This is understood that, during initial cluster setup phase a node having the
higher connectivity is selected as the cluster head as all the nodes have equal battery power
initially. This stage is followed by the cluster formation phase.
Cluster Formation: As the initial cluster head is selected, the base station broadcasts the ID of
the cluster head. The node having the same ID makes its status as a cluster head and its
immediate neighbors affiliate to the cluster head as members and set their status accordingly.
Thus the cluster head selection and formation takes place for rest of the nodes in the network till
all the nodes abstain the status as either a cluster head or a member node.
The subsequent cluster member affiliation stage works as follow:
If neighbor of 1 CH then affiliate
Else if neighbor of > 1 CH then affiliate to the one with highest available energy.
Page 23
16
3.1 Distributed Cluster Head Protocol Proposed Algorithm
Steady State: This stage is the last stage of the round. The members of the cluster forward the
sensed data to the cluster head during their TDMA time slot. The TDMA mechanism allows the
idle nodes to enter into sleep state during their slot by further saving the energy. Finally the
cluster head aggregates the data and removes the redundant data from the nodes of the same
cluster before sending to the base station or the PDA. The elimination of the redundant data
reduces the data size to be transmitted to the base station. This reduces the amount of energy
consumed by the cluster head. Factors that results to energy consumption by the cluster head is
defined by the equation is as:
Energy Consumption by non-cluster heads:
𝐸𝑛𝑜𝑛−𝐶𝐻 = 𝑏𝐸𝑒𝑙𝑒𝑐 + 𝑏 ∈𝑓𝑠 (𝑑𝑡𝑜_𝐶𝐻)2
Where, 𝑑𝑡𝑜_𝐶𝐻 is the distance from the node to the cluster head. 𝐸𝑒𝑙𝑒𝑐 is transmission
electronics energy per bit. ∈𝑓𝑠 and ∈𝑚𝑝 are transmission amplification energy per bit per area.
Energy Consumption by non-cluster heads:
𝐸𝐶𝐻 = 𝑏 𝐸𝑒𝑙𝑒𝑐 (𝑁
𝑘− 1) + 𝑏𝐸𝐷𝐴
𝑁
𝑘+ 𝑏𝐸𝑒𝑙𝑒𝑐 + 𝑏 ∈𝑚𝑝 (𝑑𝑡𝑜_𝐵𝑆)4
Where, b is the number of bits in each data message, 𝑑𝑡𝑜_𝐵𝑆 is the distance between
the cluster head and the BS. 𝐸𝐷𝐴 is aggregation energy per bit, N is the total number of nodes
and k is the number of clusters.
So,
Total Energy Consumed by a Cluster:
𝐸 = 𝐸𝐶𝐻 + (𝑁
𝑘− 1)𝐸𝑛𝑜𝑛−𝐶𝐻
(2)
(3)
(4)
Page 24
17
3.1 Distributed Cluster Head Protocol Proposed Algorithm
Total Energy Consumed by Network:
TE = E * k
= 𝑏(𝐸𝑒𝑙𝑒𝑐 𝑁 + 𝐸𝐷𝐴 𝑁 + 𝑘 ∈𝑚𝑝 (𝑑𝑡𝑜_𝐵𝑆)4 + 𝐸𝑒𝑙𝑒𝑐 𝑁 + ∈𝑓𝑠 (𝑑𝑡𝑜_𝐶𝐻)2 𝑁)
Optimal number of clusters, 𝑘𝑜𝑝𝑡 , can be found by setting 𝑑(𝑇𝐸)
𝑑(𝑘)= 0
Hence, 𝑘𝑜𝑝𝑡 = √𝑁
√2𝜋 √
∈𝑓𝑠
∈𝑚𝑝
𝑀
(𝑑𝑡𝑜_𝐵𝑆)2
Where, M x M is total area of the network
At the end of every round the available energy is recomputed as follows:
𝐸𝑛𝑒𝑟𝑔𝑦𝑎𝑣𝑎𝑖𝑙 = 𝑒𝑛𝑒𝑟𝑔𝑦𝑎𝑣𝑎𝑖𝑙 − 𝑒𝑛𝑒𝑟𝑔𝑦𝑐𝑜𝑛𝑠𝑢𝑚𝑒𝑑
(7)
(5)
(6)
Page 25
18
3.2 How DCH Protocol is Advantageous? Proposed Algorithm
3.2 How DCH Protocol is Advantageous?
The fixed transmission range distributes the cluster heads uniformly on the whole area which
minimizes energy consumption. It means the whole area is divided into various overlapping
transmission ranges. So there is a cluster head at every distance of transmission range. So the
maximum energy spent by any sensor node will be the energy required to transmit data for a
distance of transmission range saving a lot of energy consumption.
Every node transmits their data to the cluster head which falls in its transmission range
only so no transmission is lost. Their data reaches to its respective cluster head error free.
If little number of nodes is available, only required number of cluster heads are formed
which reduces the frequency of clustering thus reducing energy consumption. If fewer nodes are
available and closer to each other, then also the previous protocols would have made the fixed %
of cluster heads which is not required. In our protocol, this doesn’t happen as the closer nodes
will fall under one transmission range creating only one cluster head for those nodes. This
reduces the frequency of clustering saving a lot of energy.
Our protocol is also better than LEACH protocols in terms of cluster head selection
process as in our protocol, Base station selects the cluster head based on the residual energy of
sensor nodes not on the randomized function as in case of LEACH. This ensures that higher
energy nodes always become the cluster heads enhancing the longevity of sensor nodes.
Page 26
19
Chapter 4
Simulation Results and Analysis
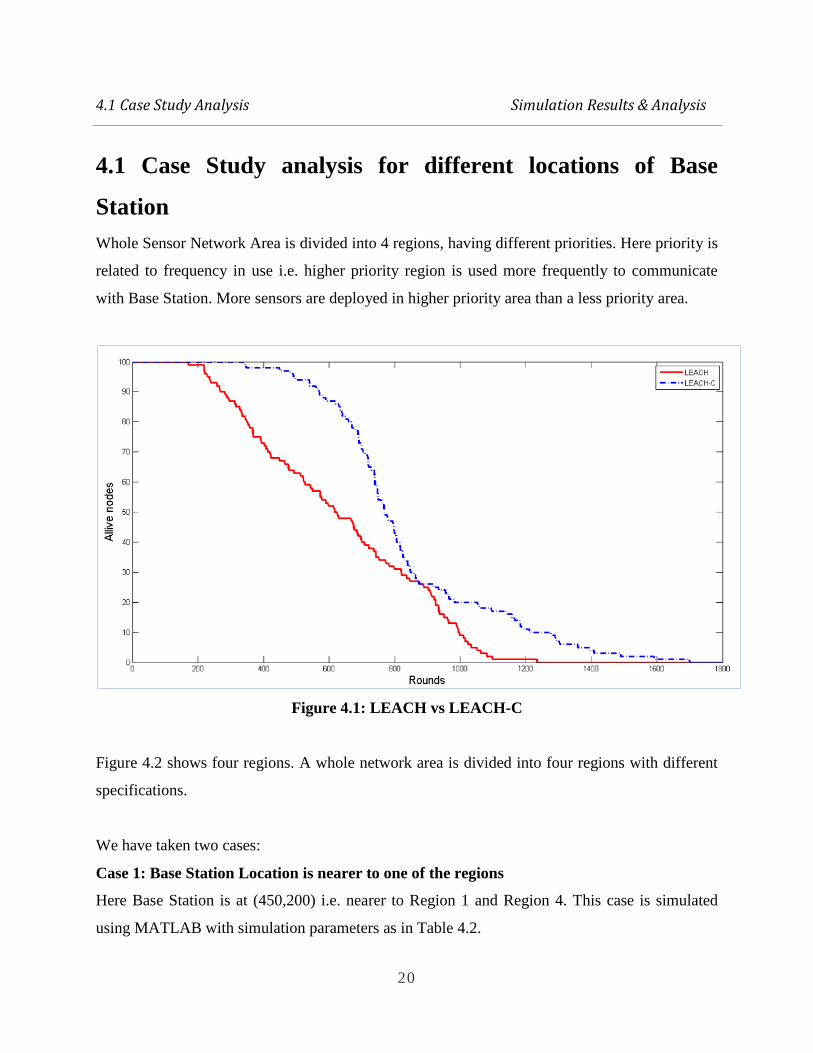
Comparison between LEACH protocol and LEACH-C protocol has been simulated using
MATLAB. Table 4.1 shows the simulation parameters. The nodes are randomly distributed
between (0, 0) and (400, 400).
Number of Nodes 100
Network Size 400m x400m
Base Station Location (200,200)
Initial Node Energy 0.5J
Number of Cluster Heads 10
Maximum no. of Rounds 2500
Table 4.1
Figure 4.1 shows the comparison between LEACH and LEACH-C. X axis represents number of
rounds of simulation and Y axis represents number of sensor nodes alive.
Page 27
20
4.1 Case Study Analysis Simulation Results & Analysis
4.1 Case Study analysis for different locations of Base
Station
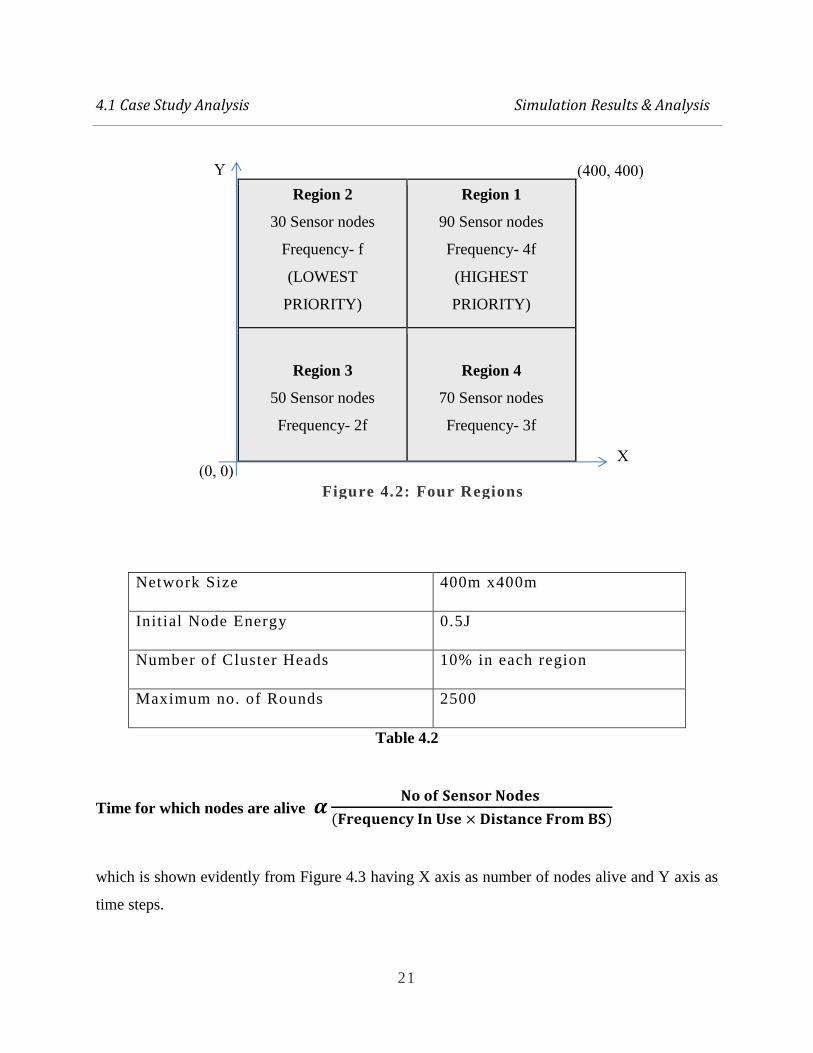
Whole Sensor Network Area is divided into 4 regions, having different priorities. Here priority is
related to frequency in use i.e. higher priority region is used more frequently to communicate
with Base Station. More sensors are deployed in higher priority area than a less priority area.
Figure 4.1: LEACH vs LEACH-C
Figure 4.2 shows four regions. A whole network area is divided into four regions with different
specifications.
We have taken two cases:
Case 1: Base Station Location is nearer to one of the regions
Here Base Station is at (450,200) i.e. nearer to Region 1 and Region 4. This case is simulated
using MATLAB with simulation parameters as in Table 4.2.
Page 28
21
4.1 Case Study Analysis Simulation Results & Analysis
Region 2
30 Sensor nodes
Frequency- f
(LOWEST
PRIORITY)
Region 1
90 Sensor nodes
Frequency- 4f
(HIGHEST
PRIORITY)
Region 3
50 Sensor nodes
Frequency- 2f
Region 4
70 Sensor nodes
Frequency- 3f
Network Size 400m x400m
Initial Node Energy 0.5J
Number of Cluster Heads 10% in each region
Maximum no. of Rounds 2500
Table 4.2
Time for which nodes are alive 𝜶𝐍𝐨 𝐨𝐟 𝐒𝐞𝐧𝐬𝐨𝐫 𝐍𝐨𝐝𝐞𝐬
(𝐅𝐫𝐞𝐪𝐮𝐞𝐧𝐜𝐲 𝐈𝐧 𝐔𝐬𝐞 × 𝐃𝐢𝐬𝐭𝐚𝐧𝐜𝐞 𝐅𝐫𝐨𝐦 𝐁𝐒)
which is shown evidently from Figure 4.3 having X axis as number of nodes alive and Y axis as
time steps.
(400, 400)
X
(0, 0)
Y
Figure 4.2: Four Regions
Page 29
22
4.1 Case Study Analysis of LEACH-C Simulation Results & Analysis
Figure 4.3: Location of BS is nearer to one of the four regions (Case 1)
Case 2: Base Station Located in center
Here the regions are divided same as according to Fig 4.2, with only difference that Base Station
is located at center (200,200) i.e. equidistant to all the regions.
So,
Time for which nodes are alive 𝜶 𝐍𝐨 𝐨𝐟 𝐒𝐞𝐧𝐬𝐨𝐫 𝐍𝐨𝐝𝐞𝐬
𝐅𝐫𝐞𝐪𝐮𝐞𝐧𝐜𝐲 𝐈𝐧 𝐔𝐬𝐞
It is simulated in MATLAB having the simulation parameters as Table 4.2. As we can see that
Figure 4.4 follows the above equation.
Page 30
23
4.1 Case Study Analysis Simulation Results & Analysis
Figure 4.4: Location of BS is at the center (Case 2)
Page 31
24
4.2 Simulation of DCH protocol Simulation Results & Analysis
4.2 Simulation of DCH Protocol
Simulation for the proposed protocol is done in MATLAB with the parameters given in Table
4.3. The nodes are randomly deployed in a simulation area of 400 X 400. Considering the nodes
to communicate to a PDA, it is located at a distance 500 X 500 for the simulation.
Number of Nodes 100
Network Size 400m x400m
Base Station Location (200,200)
Initial Node Energy 0.5J
W1 0.4
W2 0.6
Table 4.3
The reason for considering a higher value for w2 than that of w1 is to give a higher weightage
to the available battery power than the number of nodes to be served by a node if selected as a
cluster head. Fig. 4.5 indicates the % of nodes being selected as cluster head when the
transmission range of the nodes is varied for different values. It is seen that as the transmission
range of the nodes are increased, the number of clusters takes a gradual decay as the degree of
connectivity of the nodes increases. This is in contrast to the existing LEACH, and C-LEACH
protocols, where a fixed % of nodes are selected as the cluster heads. Typically 5% as indicated
for 100 nodes. And 5% corresponds to 95m transmission radius as from Fig. 4.5. 95m is taken
for further simulations.
Page 32
25
4.2 Simulation of DCH protocol Simulation Results & Analysis
Figure 4.5: Percentage of clusters for different transmission ranges
Fig. 4.6 indicates the distribution pattern of the sensors in the clusters. In LEACH, the cluster
heads are selected randomly irrespective of their position of deployment in the network. The
result shows that the average number of members affiliated to a cluster per round is less in case
of our proposed algorithm. This is due to the uniform distribution of the members in all the
clusters.
Page 33
26
4.2 Simulation of DCH protocol Simulation Results & Analysis
Figure 4.6: Distribution of sensors per cluster
It is understood that the sensor nodes consume energy while transmitting or receiving or
aggregating the data. The member nodes consume energy only when transmitting the sensed data
to the local cluster head. Thus their energy consumption could be calculated as below:
𝐸𝑛𝑜𝑛−𝐶𝐻 = 𝑏𝐸𝑒𝑙𝑒𝑐 + 𝑏 ∈𝑓𝑠 (𝑑𝑡𝑜_𝐶𝐻)2
Where 𝑑𝑡𝑜_𝐶𝐻 is the distance between a node and the cluster head. 𝐸𝑒𝑙𝑒𝑐 is transmission
electronics energy per bit which is set as 50 nJ/bit. ∈𝑓𝑠 and ∈𝑚𝑝 are transmission amplification
energy per bit per area.
(1)
Page 34
27
4.2 Simulation of DCH protocol Simulation Results & Analysis
∈𝑓𝑠 = 10pJ/bit/m2 when d < do
∈𝑚𝑝 = 0.0013pJ/bit/m4 when d >= do
Where do is threshold distance,
𝑑𝑜 = √∈𝑓𝑠
∈𝑚𝑝
The scenario is different for a cluster head. It receives the data from the local members,
aggregates the data to eliminate the redundancy and forwards the data to the base station. So the
equation for the energy consumption equation by the cluster head has three components as
receiving energy, aggregation energy and transmitting energy as below:
𝐸𝐶𝐻 = 𝑏 𝐸𝑒𝑙𝑒𝑐 (𝑁
𝑘− 1) + 𝑏𝐸𝐷𝐴
𝑁
𝑘+ 𝑏𝐸𝑒𝑙𝑒𝑐 + 𝑏 ∈𝑚𝑝 (𝑑𝑡𝑜_𝐵𝑆)4
Where b is the number of bits in each data message, 𝑑𝑡𝑜_𝐵𝑆 is the distance between the cluster
head node and the BS. 𝐸𝐷𝐴 is aggregation energy per bit which is set as 5nJ/bit.
Fig. 4.7 indicates the comparison of average energy consumption per cluster in the protocols. It
is seen that the proposed algorithm consumes the least energy per cluster. The reason for such
result is the uniform distribution of the clusters throughout the network and load balance among
the cluster heads while serving the members.
(2)
Page 35
28
4.2 Simulation of DCH protocol Simulation Results & Analysis
Figure 4.7: Comparison for average energy consumption
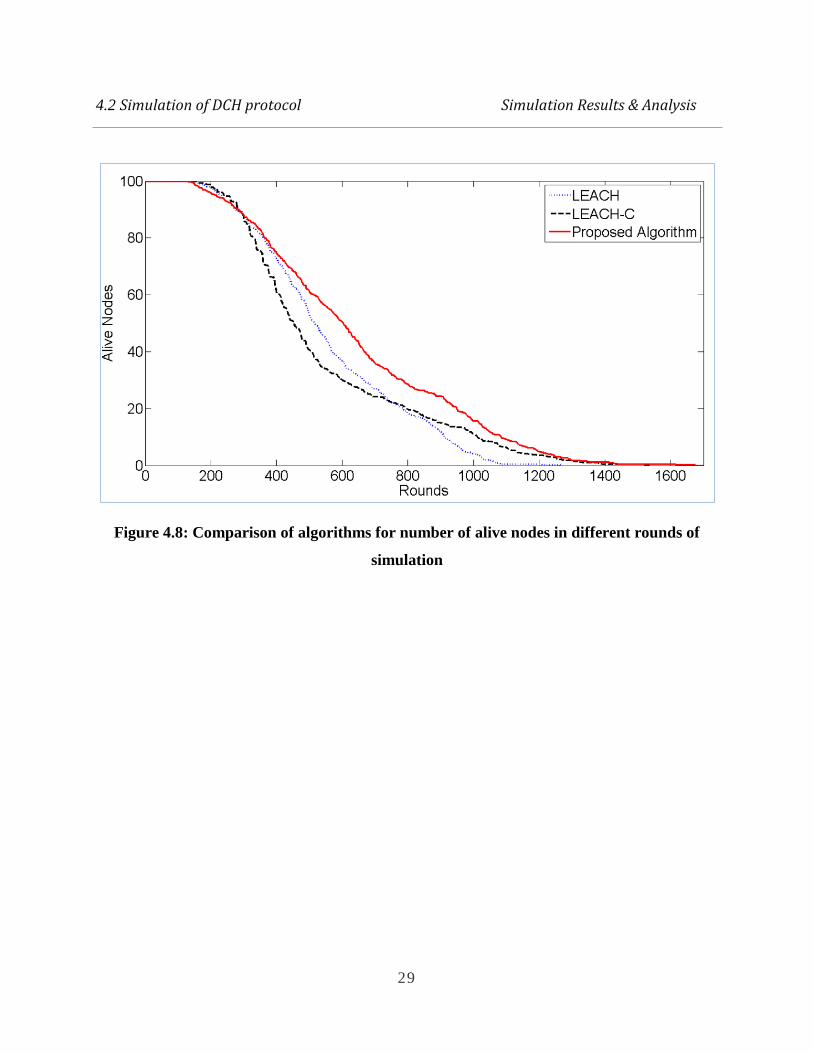
We take different radius of transmission range and simulated the protocol and compared the
results with LEACH-C. The Fig. 4.8 shows total number of nodes that remain alive for the
simulation time of 2500 rounds.
Page 36
29
4.2 Simulation of DCH protocol Simulation Results & Analysis
Figure 4.8: Comparison of algorithms for number of alive nodes in different rounds of
simulation
Page 37
30
Chapter 5
Conclusion
From the above simulation, it can be seen that the proposed algorithm shows better results than
LEACH and LEACH-C. As the number of nodes per cluster in proposed algorithm is very less as
compared to other protocols for same percentage of cluster heads, the average energy
consumption per cluster is less which increases the lifetime of whole sensor network. Same as
LEACH, it also distributes the load over network uniformly by rotation of cluster heads in each
round. But the transmission radius factor in cluster head formation process in the proposed
algorithm ensures the distribution of cluster heads remains uniform in the whole network thereby
escalating the efficiency of network which may not be the case in other protocols. It also ensures
that every sensor node falls inside the transmission radius of some cluster head, so there is no
possibility of transmission loss thus saving energy consumption as compared to other protocols.
Also this scheme allows more number of nodes to be alive till the end of network lifetime.
Simulation is done MATLAB. From the results and analysis, it can be concluded that DCH
routing protocol provides better performance in energy efficiency and hence increases the
lifetime of wireless sensor networks.
Page 38
31
Dissemination
S. Upadhyaya, R. Patel, S. Chinara, and M. Sarkar, “Design of Energy Efficient Protocol for
Wearable WBAN”, IEEE Global Communication Conference (GLOBECOM 2015), San Diego,
USA (Communicated 15th
April, 2015).
Page 39
32
Bibliography
[1] S. Movassaghi, M. Abolhasan, D. Smith, and A. Jamalipour, “Wireless body area networks:
a survey”, IEEE Communications Surveys & Tutorials, vol. 16, no. 3, third quarter 2014.
[2] Sana Ullah, Henry Higgin, M. Arif Siddiqui, and Kyung Sup Kwak, “A study of wearable
and implantable body sensor networks”, in Proc. 2nd
KES Int. Conf. on Agent and multi-
agent systems: technologies and applications, (Berlin, Heidelerg), pp. 464-473, Springer-
Verlag, 2008.
[3] Laura Galluccio, Tommaso Melodiay, Sergio Palazzo, G Enrico Santagati, “Challenges and
Implications of Using Ultrasonic Communications in Intrabody Area Networks”, 9th Annual
Conference on Wireless On-Demand Network Systems and Services (WONS), 2012
[4] G. Enrico Santagati and Tommaso Melodia, “Ultasonic networking for e-health
applications”, IEEE Wireless Communications, August 2013.
[5] W. Heinzelman, A. Chandrakasan, and H. Balakrishnan, “Energy-efficient routing protocols
for wireless micro sensor networks,” in Proc. 33rd Hawaii Int. Conf. System Sciences
(HICSS), Maui, HI, Jan. 2000.
[6] W. Heinzelman, A. Chandrakasan, and H. Balakrishnan, “An application specific protocol
architecture for wireless micro sensor networks,” IEEE Transactions on Wireless
Communications, vol. 1, no. 4, pp. 660-670, 2002.
[7] Benoit Latre, Bart Braem, Ingrid Moerman, Chris Blondia and Piet Demeester, “A survey on
wireless body area networks”, Journal of Wireless Networks , Volume 17 Issue 1, Jan 2011.
[8] Fuzhe Zhao, You Xu, and Ru Li, “Improved LEACH routing communication protocol for a
wireless sensor network”, International Journal of Distributed Sensor Networks, Volume
2012, Article ID 649609, 2012.
[9] K. BenkiK, M. Malajner, A. PeuliK, and, MuKej, Academic Education Wireless Sensor
Network: AeWSN 50th International Symposium ELMAR-2008 Zadar, Croatia, 10-12
September 2008.
Page 40
33
[10] A. A. Abbasi, and M. Younis, A Survey on Clustering Algorithms for wireless sensor
network Computer Communications 30, 28262841, 21 June 2007.
[11] V. Loscri, G. Morabito, and S. Marano. A two-levels hierarchy for lowenergy adaptive
clustering hierarchy (tl-leach). In Vehicular Technology Conference. 2005 IEEE 62nd,
volume 3, pages 1809–1813, 2005.
[12] Fuzhe Zhao, You Xu, and Ru Li, “Improved LEACH Routing Communication Protocol
for a Wireless Sensor Network”, International Journal of Distributed Sensor Networks,
Volume 2012, Article ID 649609, 2012.
[13] Vivek Katiyar, Narottam Chand, Surender Soni, Clustering Algorithms for
Heterogeneous Wireless Sensor Network: A Survey International Journal of Applied
Engineering Research, DINDIGUL Volume 1, No 2, 2010.