Design of Lightweight Web Core Sandwich Panels and Application to Residential Roofs A DISSERTATION SUBMITTED TO THE FACULTY OF THE GRADUATE SCHOOL OF THE UNIVERSITY OF MINNESOTA BY Casey R. Briscoe IN PARTIAL FULFILLMENT OF THE REQUIREMENTS FOR THE DEGREE OF DOCTOR OF PHILOSOPHY Susan C. Mantell and Jane H. Davidson, Co-Advisers May 2010
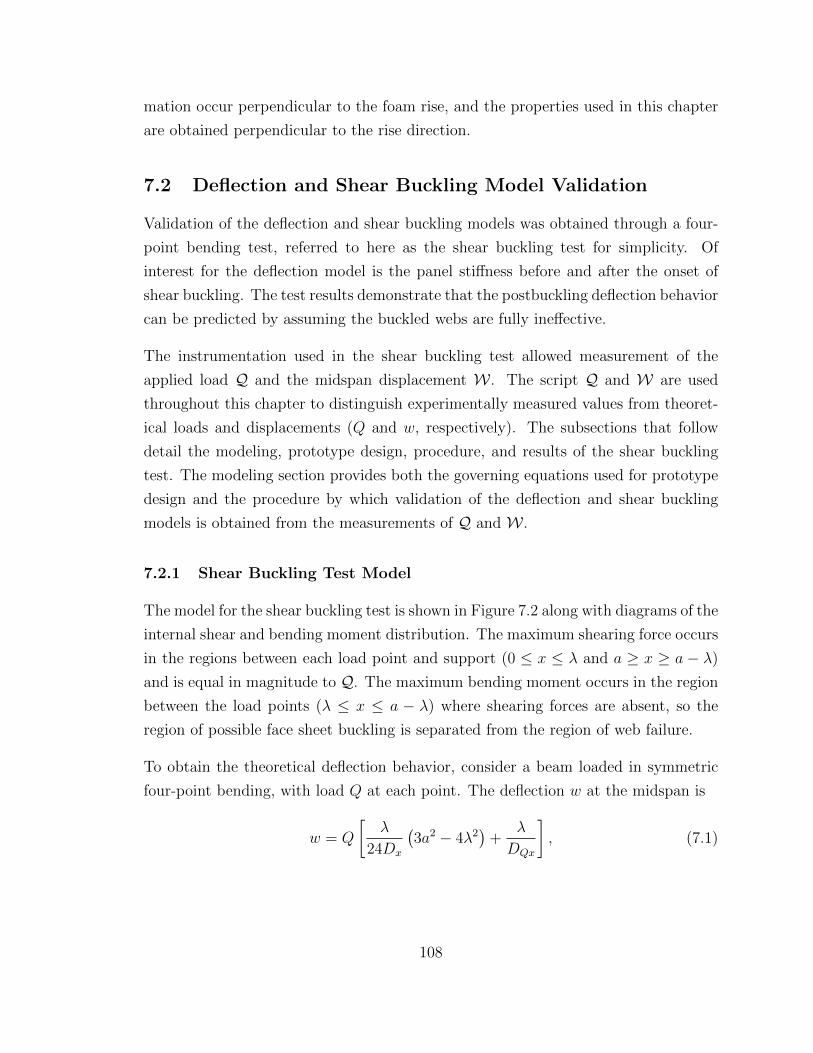
Transcript
Design of Lightweight Web Core Sandwich Panels and
Application to Residential Roofs
A DISSERTATION
SUBMITTED TO THE FACULTY OF THE GRADUATE SCHOOL
OF THE UNIVERSITY OF MINNESOTA
BY
Casey R. Briscoe
IN PARTIAL FULFILLMENT OF THE REQUIREMENTS
FOR THE DEGREE OF
DOCTOR OF PHILOSOPHY
Susan C. Mantell and Jane H. Davidson, Co-Advisers
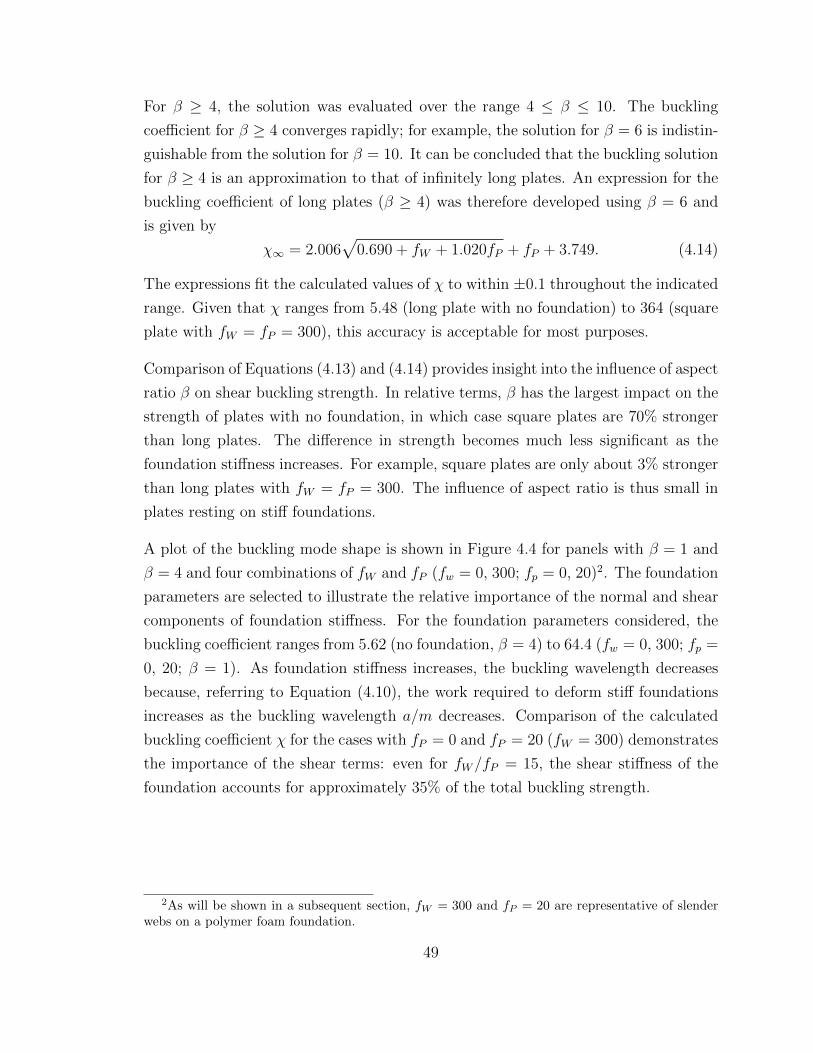
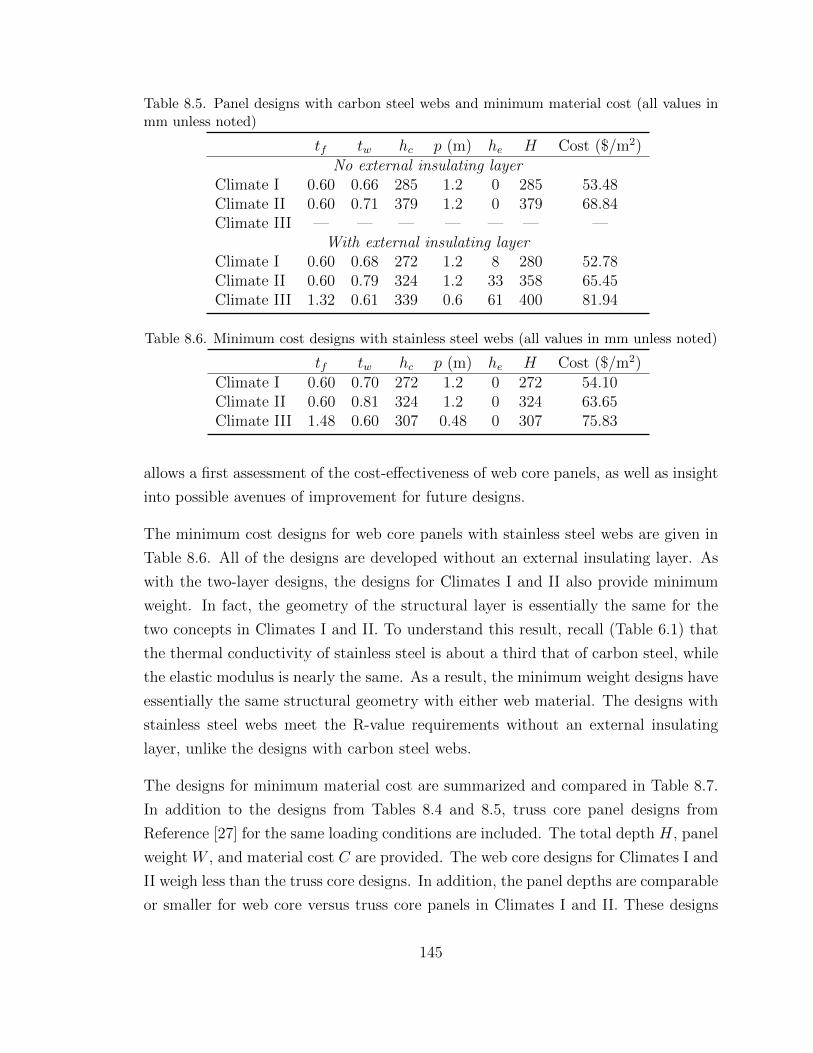
8.7 Summary of minimum cost designs for each panel type; truss coredesigns are included for comparison . . . . . . . . . . . . . . . . . . . 146
A.1 Loads and R-value requirements for panels with a 6:12 roof pitch . . . 167
x
List of Figures
1.1 Roof structure concepts: (a) conventional (trussed) construction, and(b) panelized construction with (c) closeup of a (truss core) panel con-cept proposed in the literature . . . . . . . . . . . . . . . . . . . . . . 2
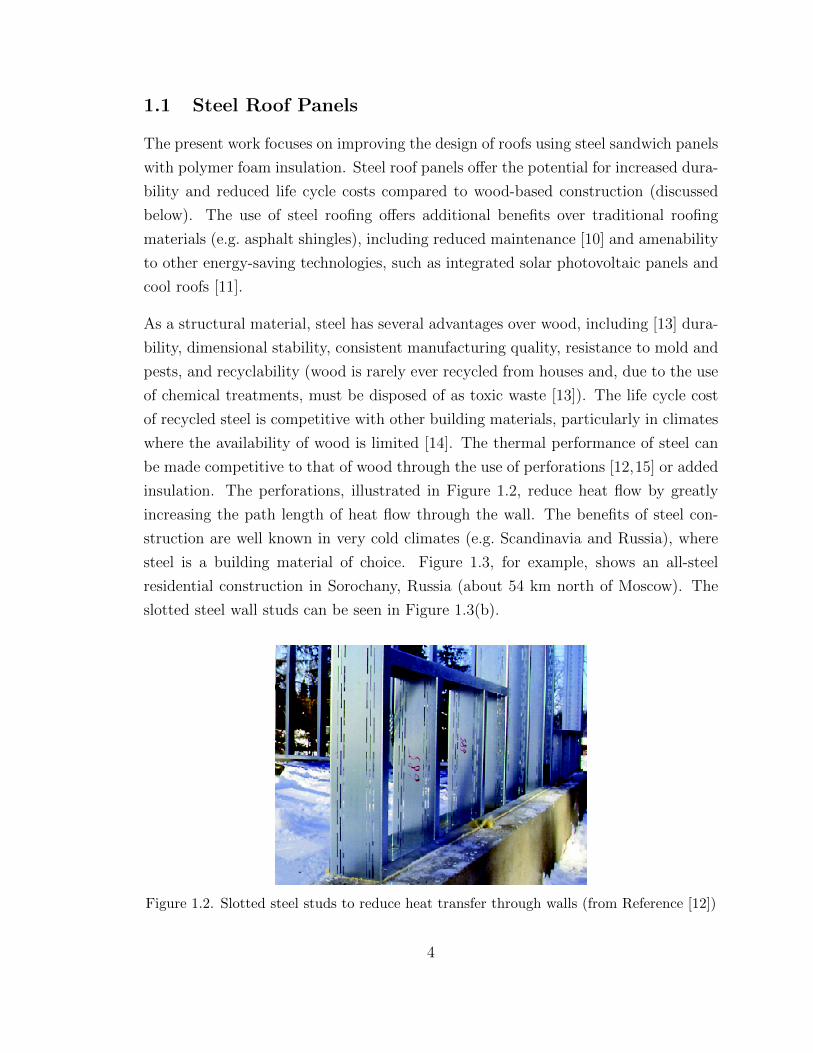
1.2 Slotted steel studs to reduce heat transfer through walls . . . . . . . 4
1.3 All-steel residential construction in Sorochany, Russia: (a) house underconstruction, and (b) close-up of the attic/roof structure . . . . . . . 5
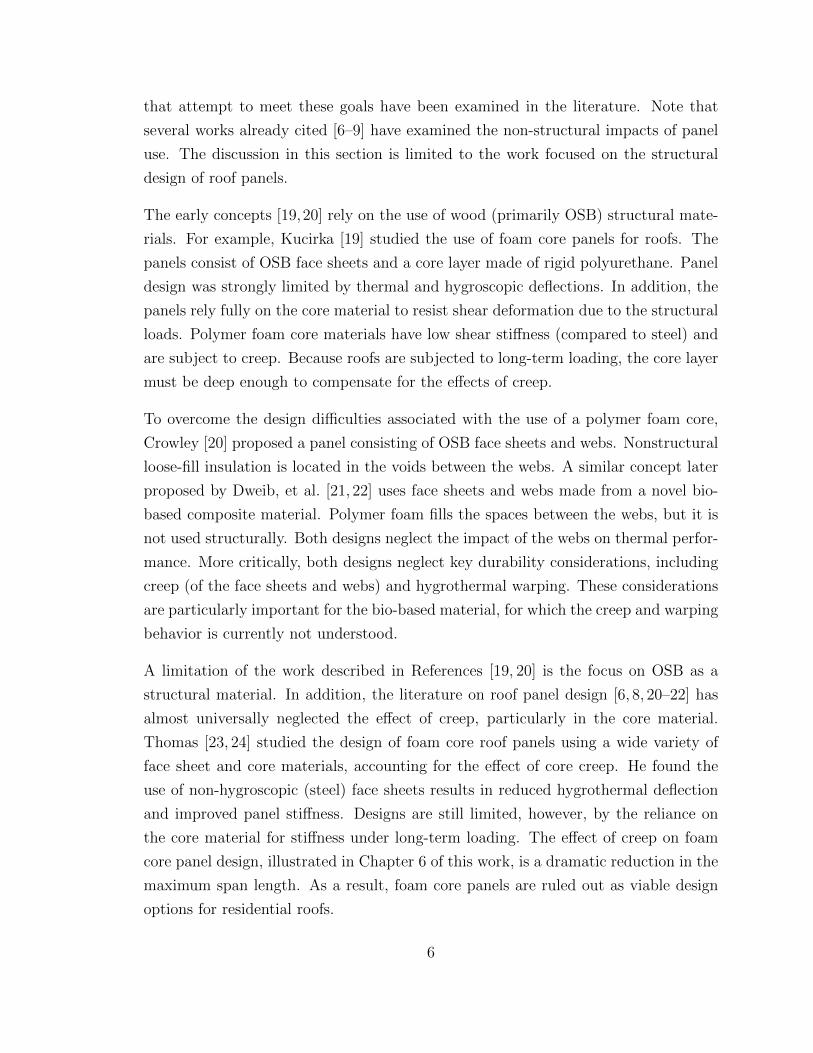
1.4 Spectrum of panel designs based on the function of the insulating ma-terial: structural foam meets the thermal requirements incidentally (noneed for specific thermal design); insulating foam does not contributeto panel structural performance . . . . . . . . . . . . . . . . . . . . . 7
1.5 Web core panel concept: (a) panels with no external foam layer, and(b) two-layer panels with external foam layer . . . . . . . . . . . . . . 8
2.1 Simplified model for open-celled foam microstructure; cells are elon-gated in the rise direction . . . . . . . . . . . . . . . . . . . . . . . . 13
3.1 Climate zones used to establish panel load requirements . . . . . . . . 26
3.2 Panel coordinate system and the associated distribution of internalshearing forces and bending moments . . . . . . . . . . . . . . . . . . 27
3.3 Locations of the local failure modes in the face sheets and webs . . . 27
3.4 Isothermal planes (lumped thermal resistance) approximation for pan-els (a) without and (b) with an external foam layer . . . . . . . . . . 29
3.5 Load and deflection conventions for determining deflection limit . . . 30
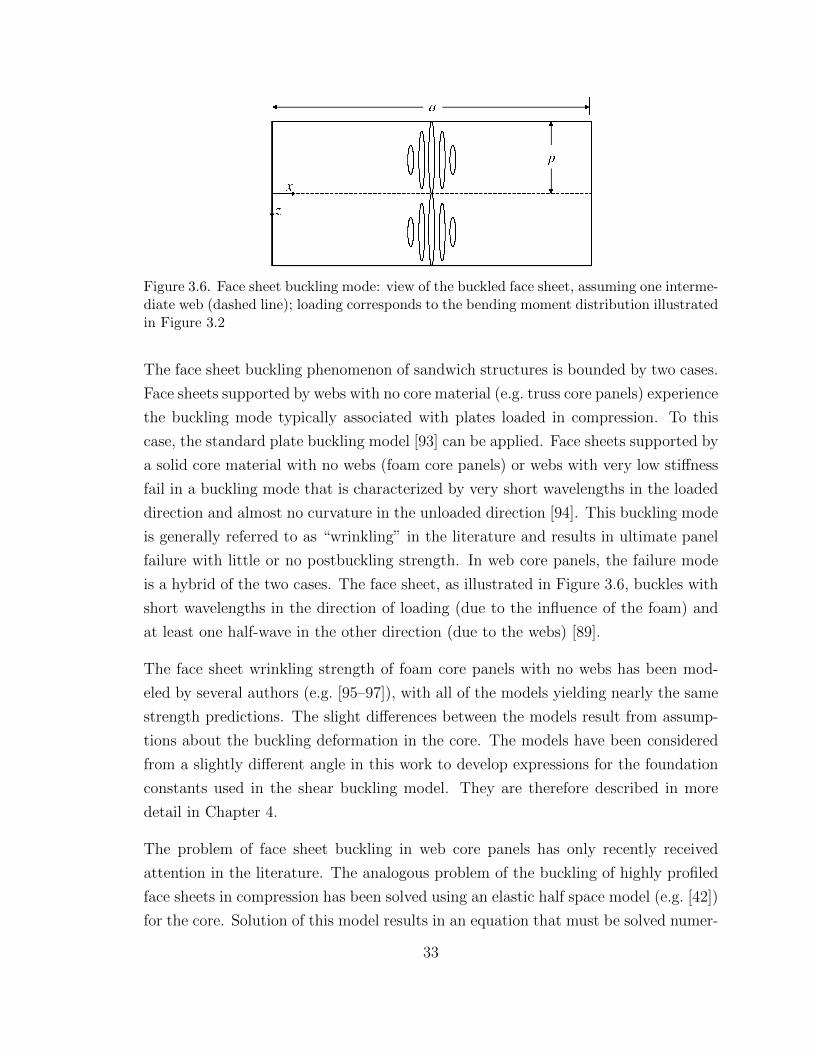
3.6 Face sheet buckling mode: view of the buckled face sheet, assumingone intermediate web (dashed line); loading corresponds to the bendingmoment distribution illustrated in Figure 3.2 . . . . . . . . . . . . . . 33
xi
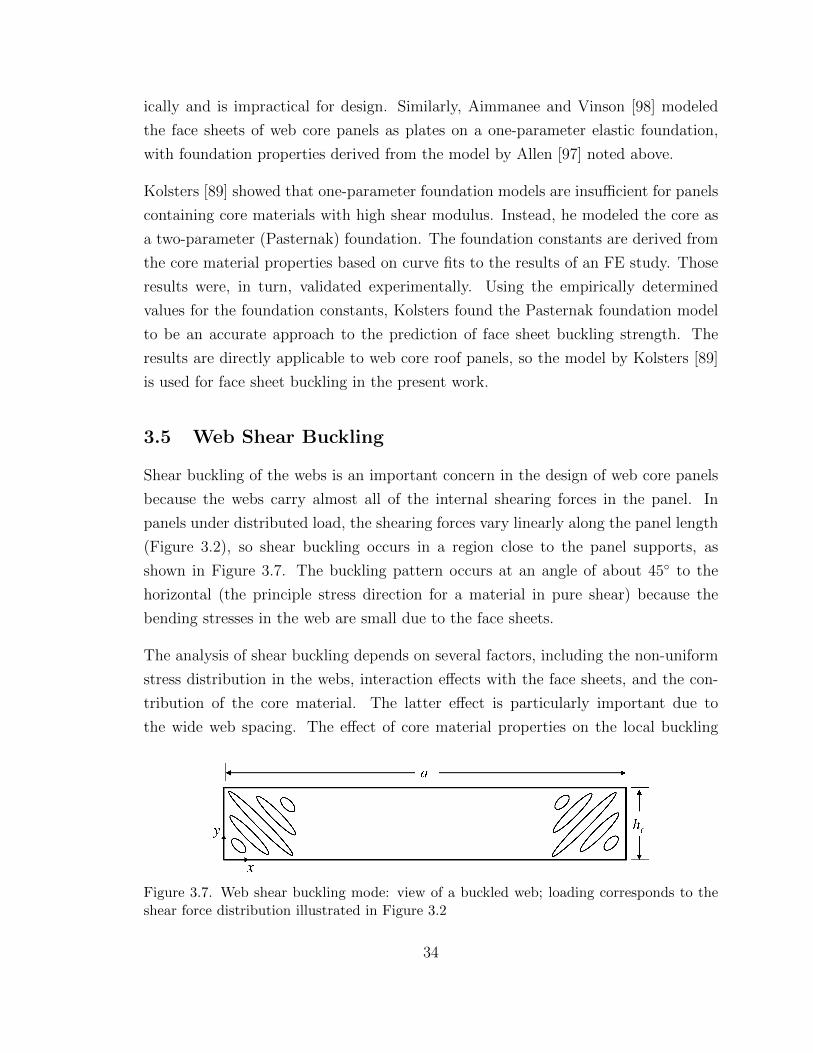
3.7 Web shear buckling mode: view of a buckled web; loading correspondsto the shear force distribution illustrated in Figure 3.2 . . . . . . . . 34
3.10 Flexural web buckling mode: view of a buckled web; loading corre-sponds to the bending moment distribution illustrated in Figure 3.2 . 38
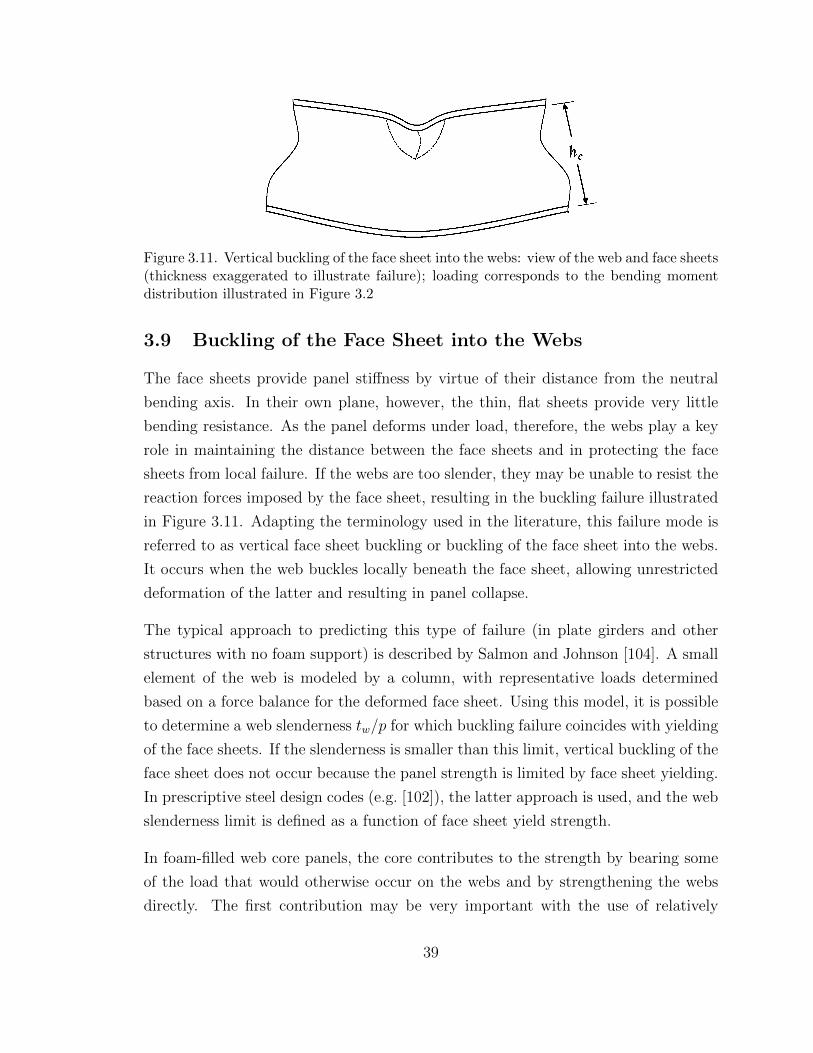
3.11 Vertical buckling of the face sheet into the webs: view of the web andface sheets; loading corresponds to the bending moment distributionillustrated in Figure 3.2 . . . . . . . . . . . . . . . . . . . . . . . . . . 39
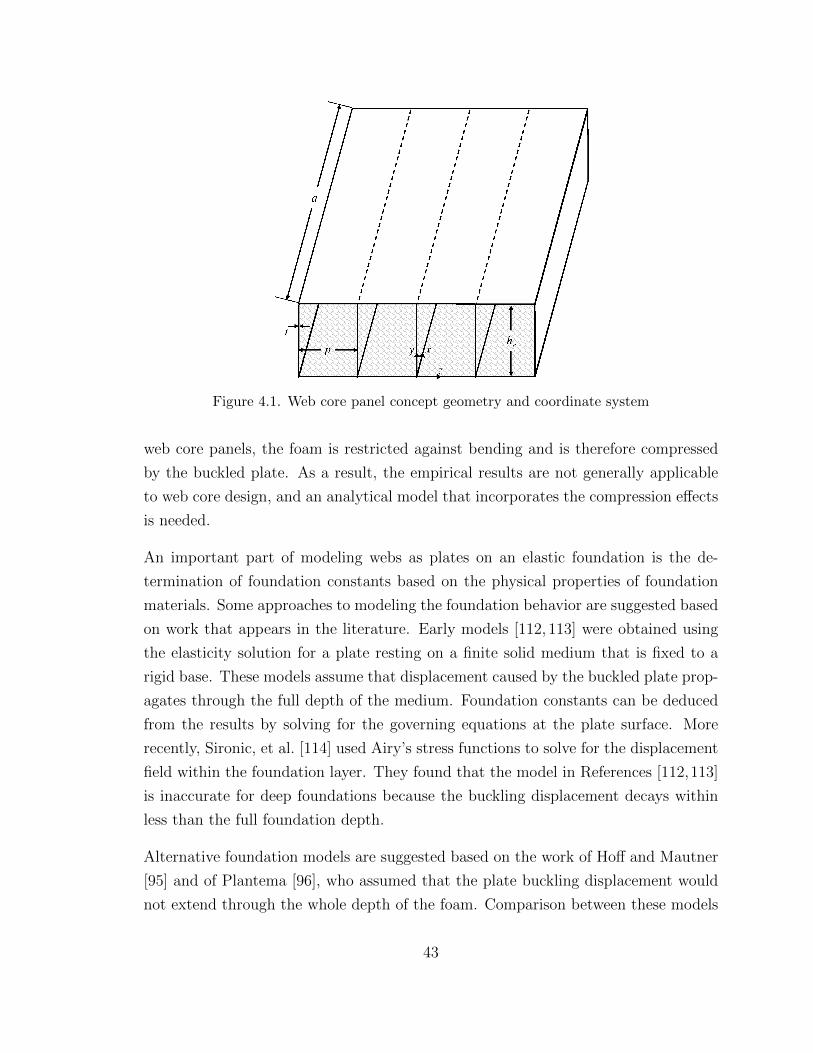
4.1 Web core panel concept geometry and coordinate system . . . . . . . 43
4.5 Model used for the determination of foundation stiffness constants . . 51
4.6 Plate model used for FE validation of the expressions for determiningfoundation constants . . . . . . . . . . . . . . . . . . . . . . . . . . . 54
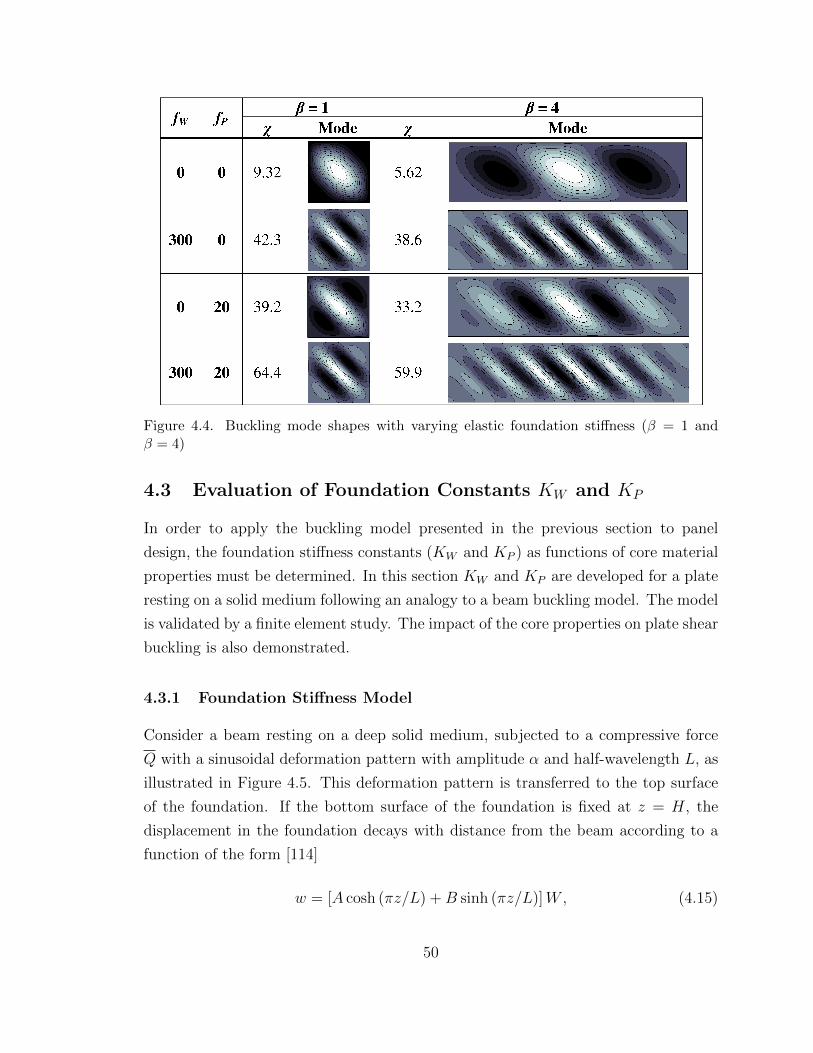
4.7 Plot of the normalized deflection w/W in the foundation vs. normalizeddistance z/H from the plate surface; FE results are compared to thepresent model for Hk = 0.85 and 4.5 . . . . . . . . . . . . . . . . . . 55
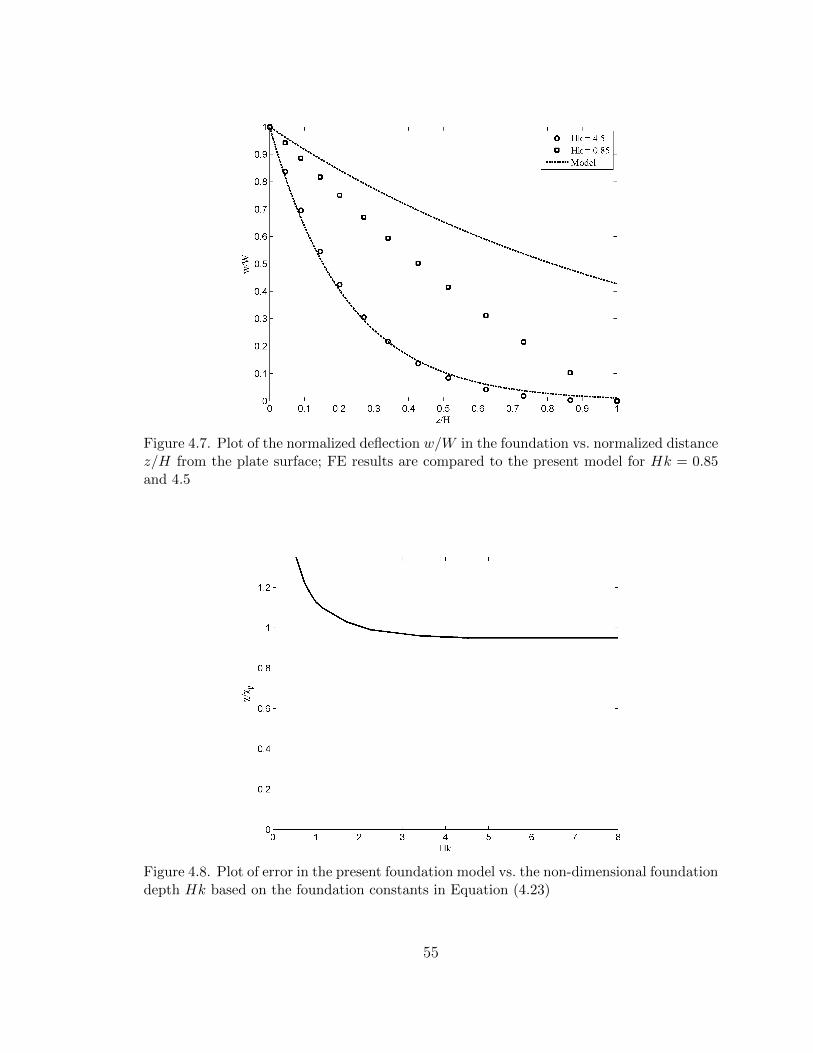
4.8 Plot of error in the present foundation model vs. the non-dimensionalfoundation depth Hk based on the foundation constants in Equation(4.23) . . . . . . . . . . . . . . . . . . . . . . . . . . . . . . . . . . . 55
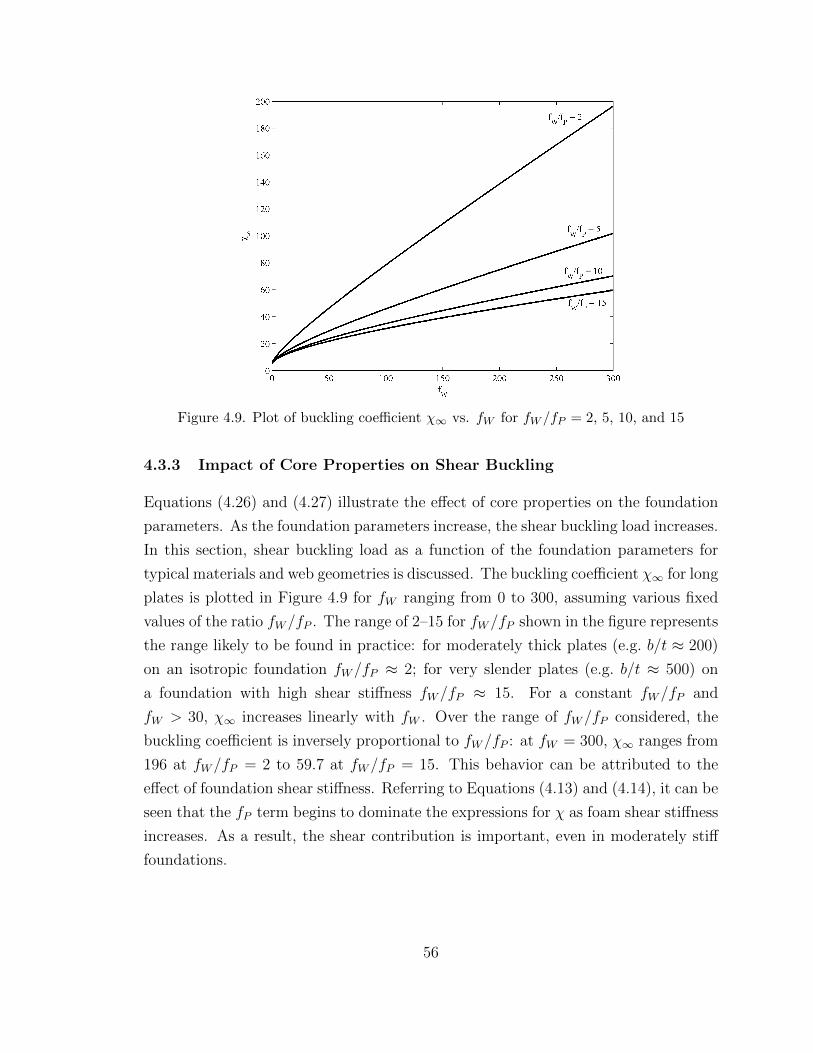
4.9 Plot of buckling coefficient χ∞ vs. fW for fW/fP = 2, 5, 10, and 15 . 56
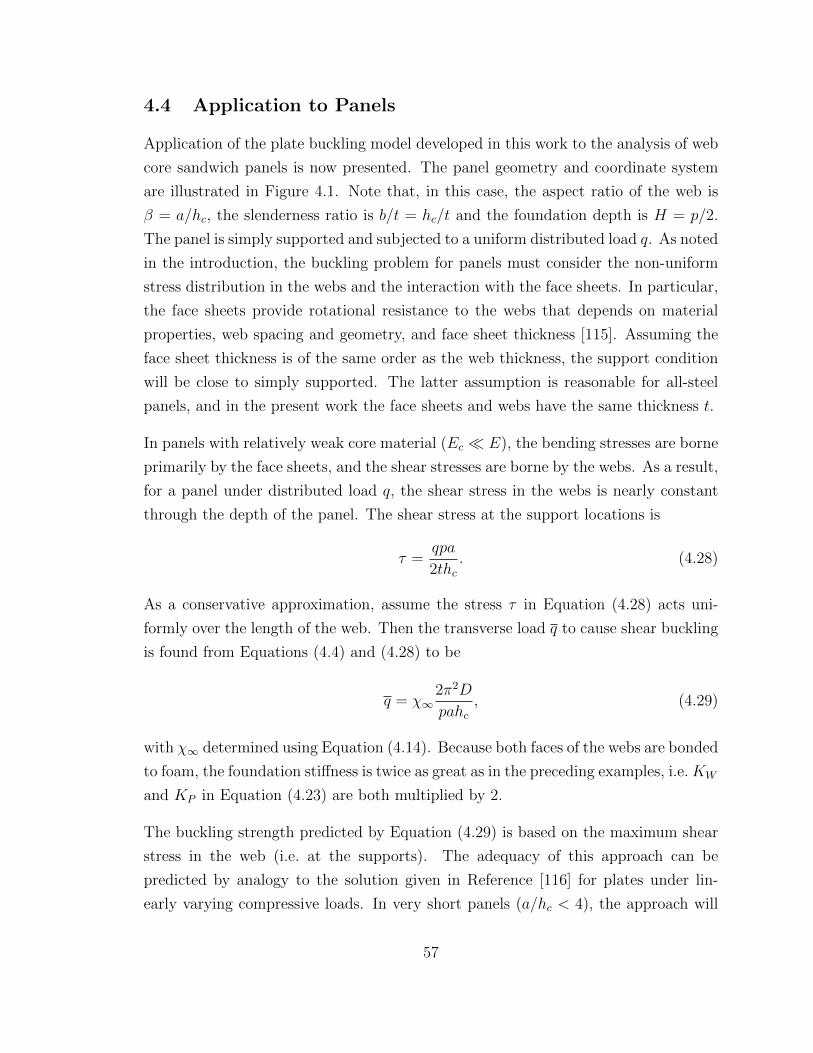
4.10 Finite element model used for the analysis of panels under distributedload (core elements not displayed for clarity) . . . . . . . . . . . . . . 58
4.11 Buckling mode shape in the webs of a panel under distributed load(Ec = Gc = 500 kPa); due to symmetry, only half the panel length isshown . . . . . . . . . . . . . . . . . . . . . . . . . . . . . . . . . . . 59
xii
4.12 Variation in analytical and numerical buckling coefficient vs. web slen-derness hc/t for two different web spacing ratios . . . . . . . . . . . . 60
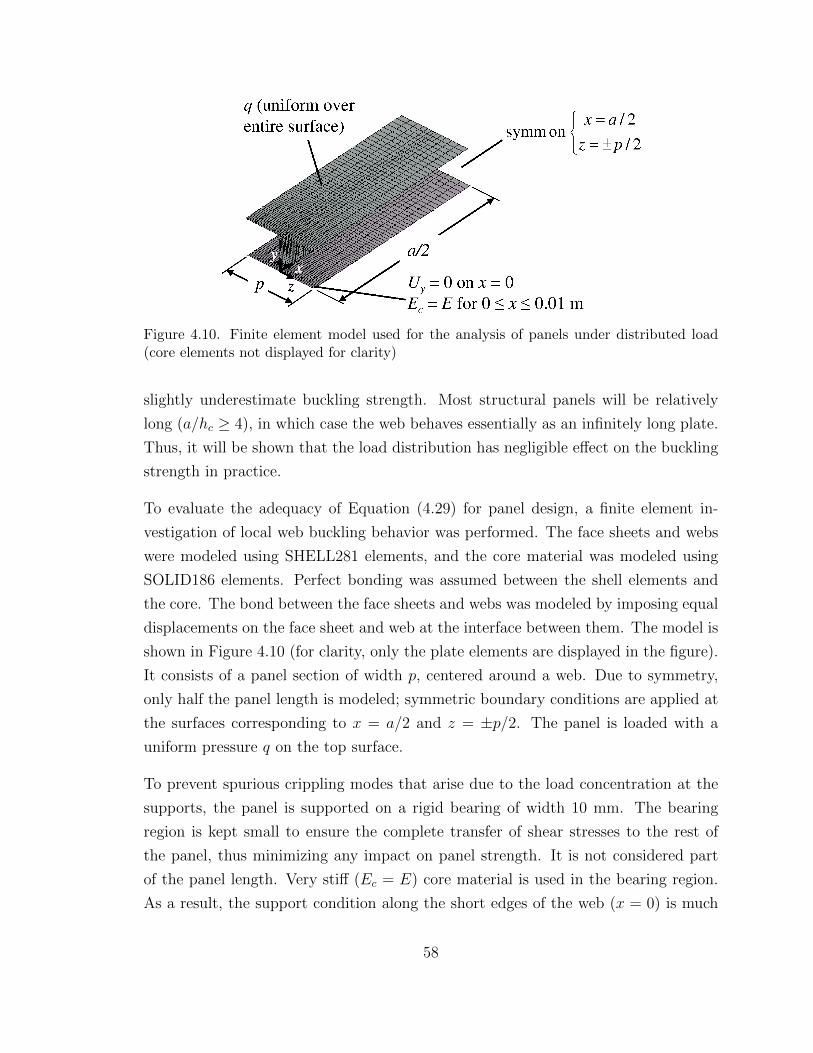
4.13 Comparison of χ∞ and χFE vs. web aspect ratio a/hc (hc/t = 400,p/a = 0.200, Ec = Gc = 500 kPa) . . . . . . . . . . . . . . . . . . . . 62
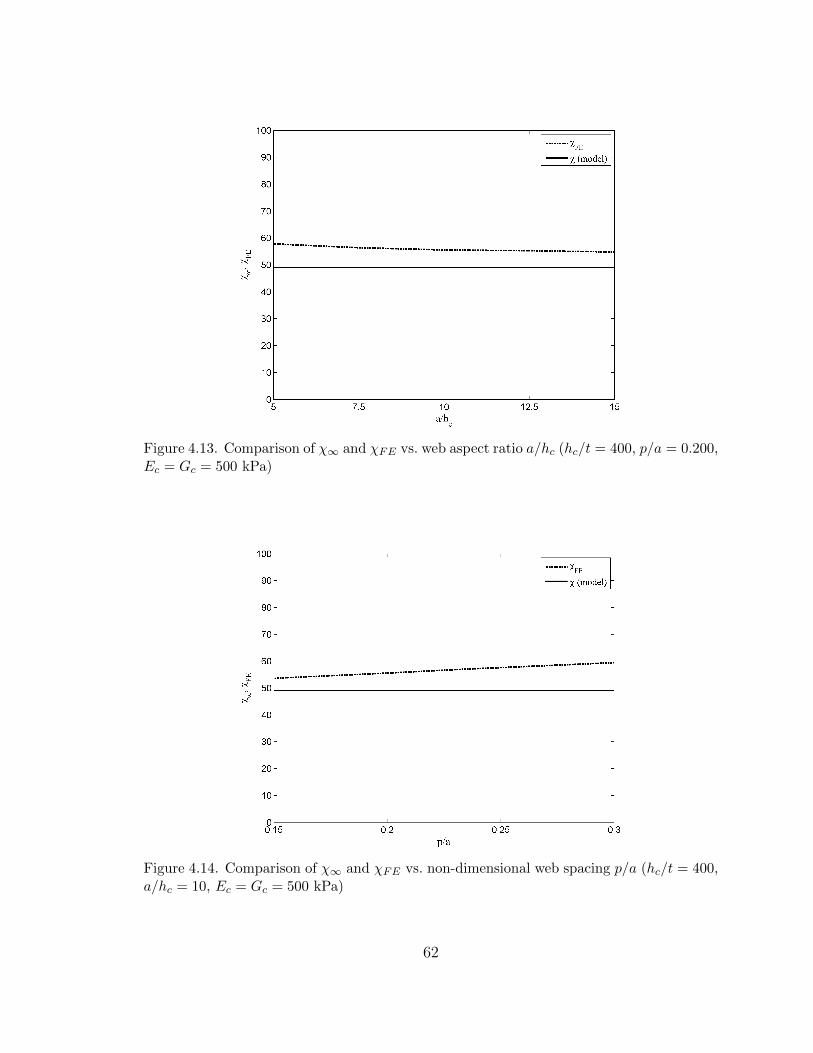
4.14 Comparison of χ∞ and χFE vs. non-dimensional web spacing ratio p/a(hc/t = 400, a/hc = 10, Ec = Gc = 500 kPa) . . . . . . . . . . . . . . 62
5.1 Early elastic buckling models for bearing failure: (a) opposing concen-trated loads, (b) opposing patch loads, (c) patch load and supports . 65
5.2 End bearing failure mechanism in the webs . . . . . . . . . . . . . . . 66
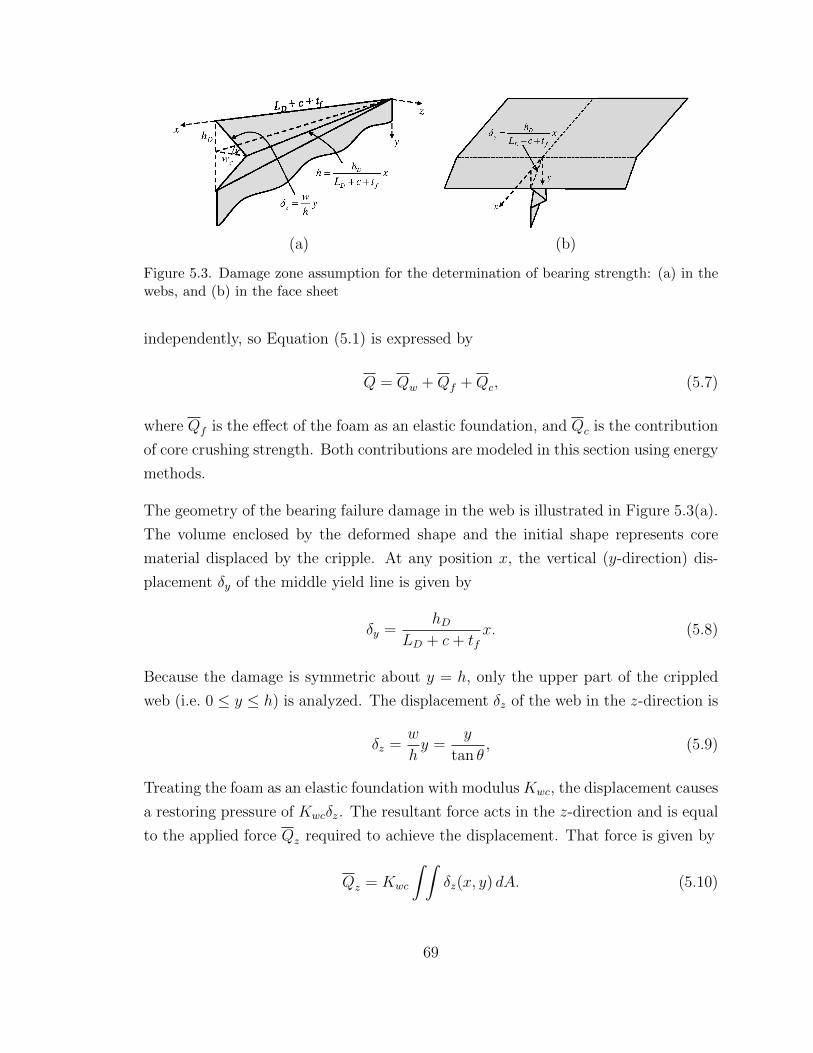
5.3 Damage zone assumption for the determination of bearing strength:(a) in the webs, and (b) in the face sheet . . . . . . . . . . . . . . . . 69
5.4 Comparison of hinge and modified AISI bearing failure models: plotof Q/QA vs. web slenderness hc/tw . . . . . . . . . . . . . . . . . . . 74
5.5 Contribution of core crushing to total bearing strength: plot of Qc/Qvs. hc/tw assuming carbon steel webs and 36 kg/m3 PUR core withtf/tw = σyf/σyw = 1, c/tw = 150, p/tw = 1200, and R/tw = 0 . . . . . 74
6.2 Plot of minimum panel depth vs. length for foam core panels with 2.0mm steel face sheets and PUR core. Designs that neglect the influenceof core creep are shown with dashed lines, and designs that include theeffect of creep are shown with solid lines. . . . . . . . . . . . . . . . . 80
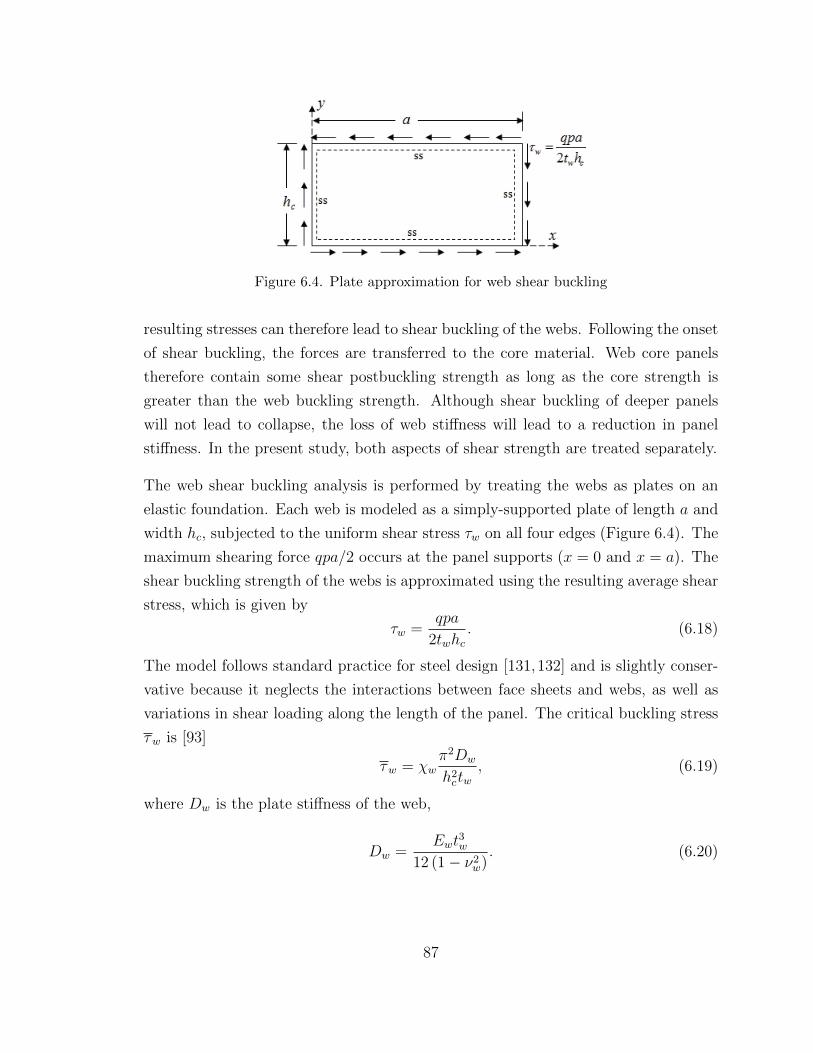
6.3 Plate approximation for face sheet buckling analysis . . . . . . . . . . 85
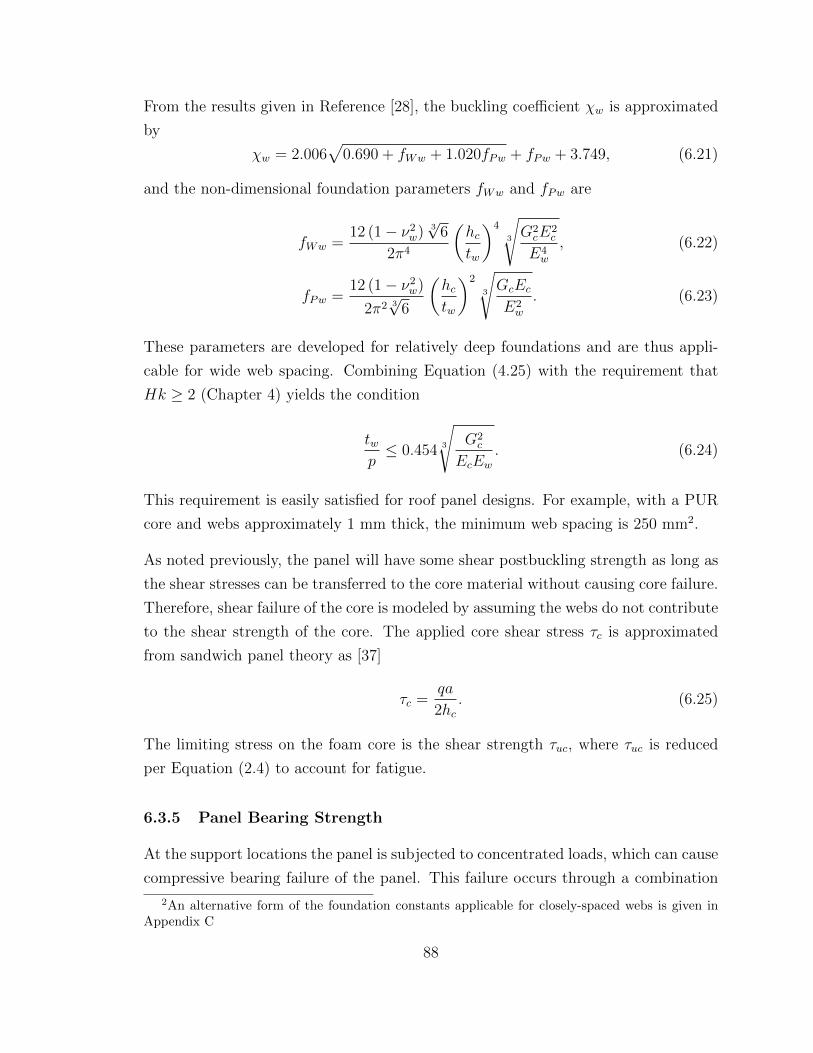
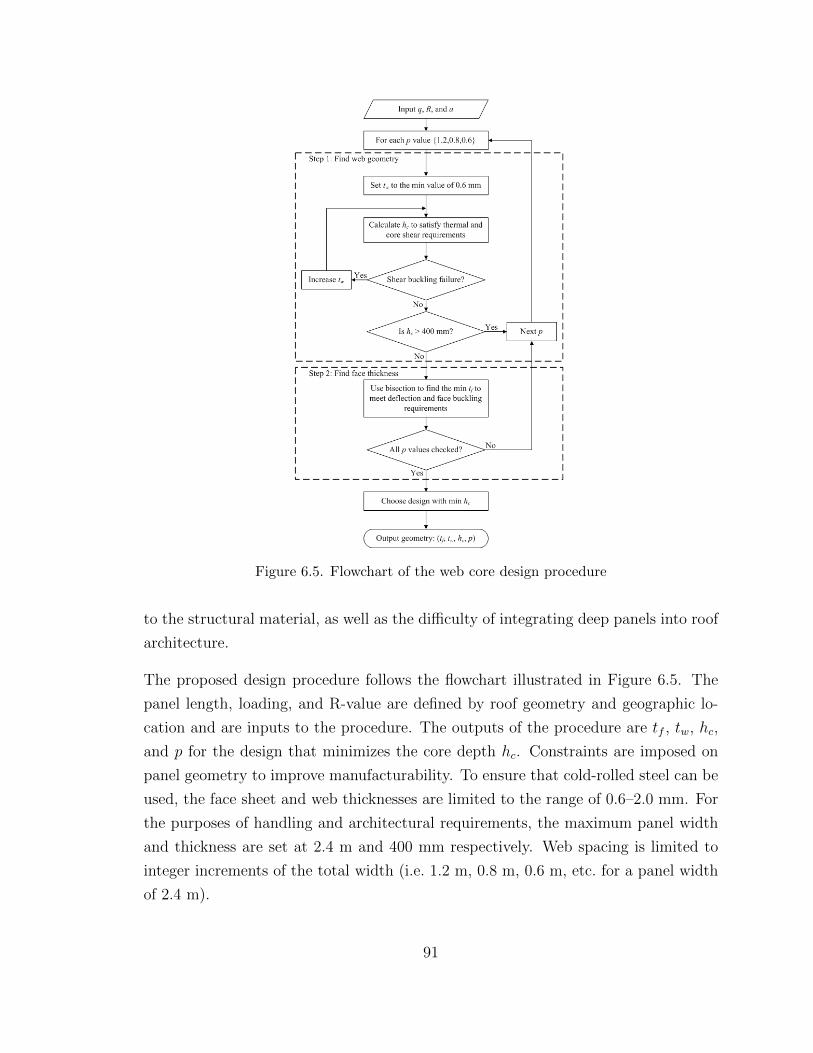
6.5 Flowchart of the web core design procedure . . . . . . . . . . . . . . . 91
6.6 Failure mode map for panels with carbon or stainless steel webs spacedat 1.2 m and a 36 kg/m3 core, subjected to a transverse load of 1500N/m2 and an R-value requirement of 5.3 m2-K/W (tf = 2.0 mm) . . 93
6.7 Failure mode map for panels with (a) carbon or (b) stainless steel websspaced at 1.2 m and a 36 kg/m3 core, panel length of 7 m, subjectedto a transverse load of 1500 N/m2. R-value requirements of 3.5, 5.3,and 6.7 m2-K/W are compared for each web material. . . . . . . . . . 95
xiii
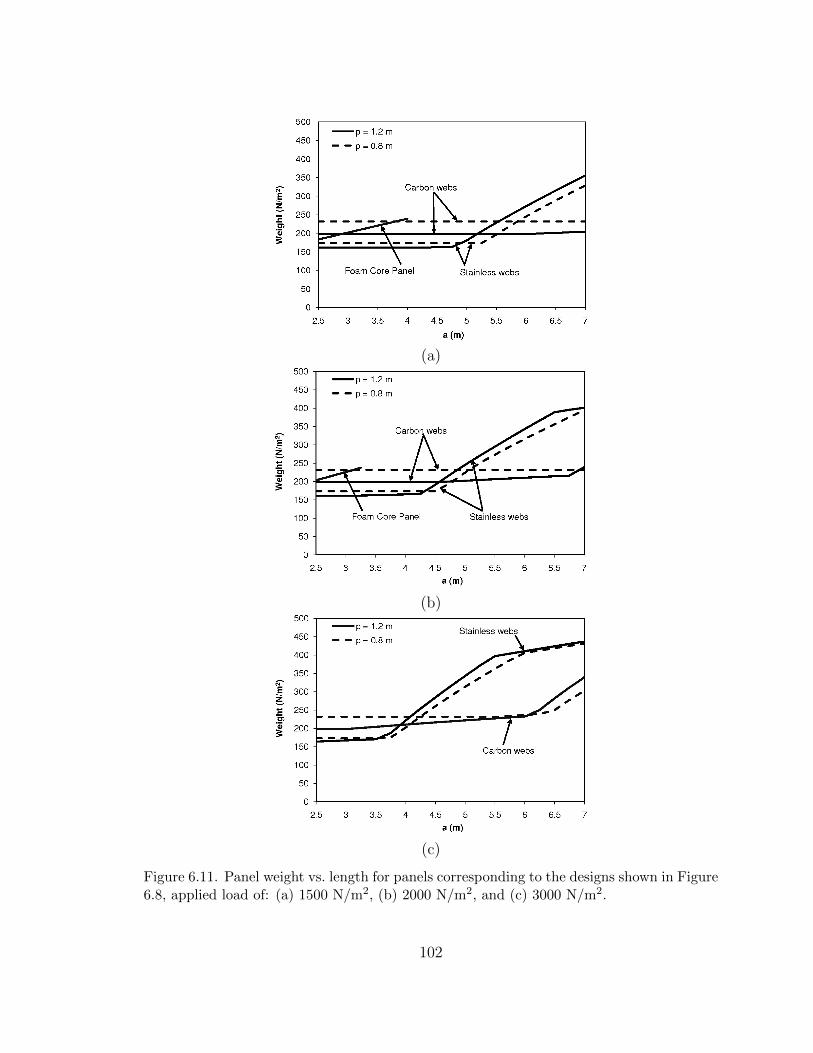
6.8 Core depth vs. panel length for foam core panels and web core panelswith carbon and stainless steel webs with an R-value requirement of5.3 m2-K/W and an applied load of: (a) 1500 N/m2, (b) 2000 N/m2,and (c) 3000 N/m2. Web spacing of 0.8 and 1.2 m are compared forthe web core panels. . . . . . . . . . . . . . . . . . . . . . . . . . . . 97
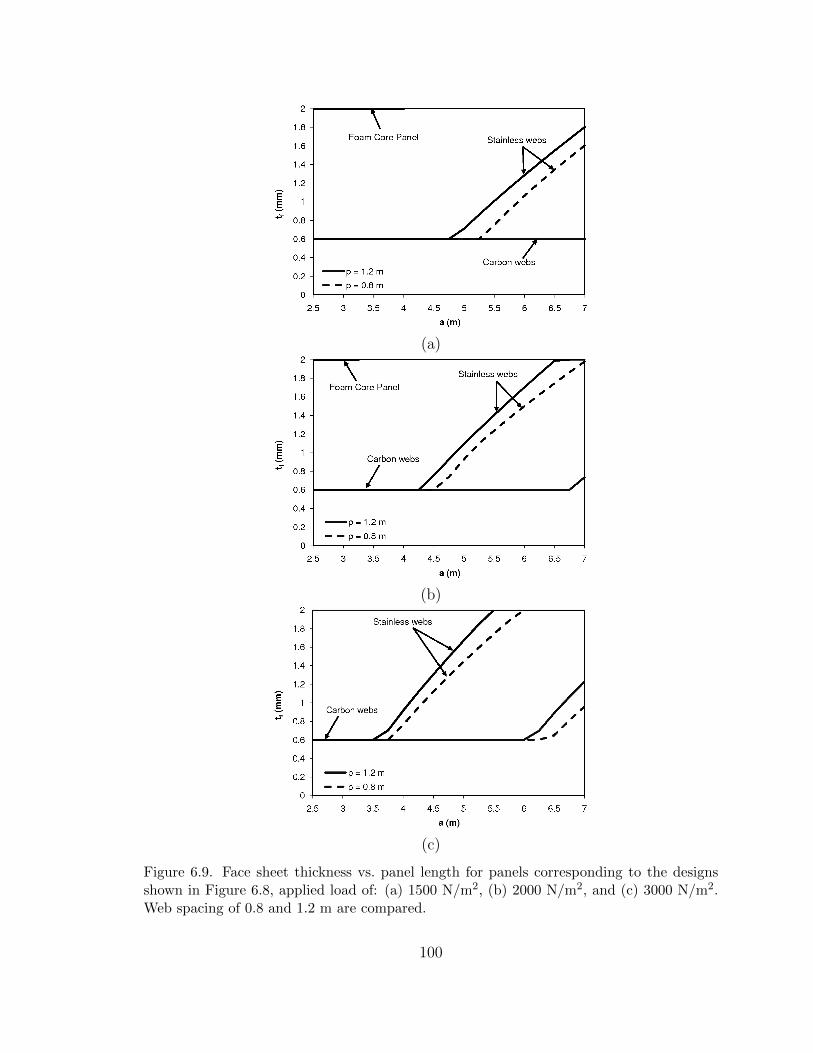
6.9 Face sheet thickness vs. panel length for panels corresponding to thedesigns shown in Figure 6.8 . . . . . . . . . . . . . . . . . . . . . . . 100
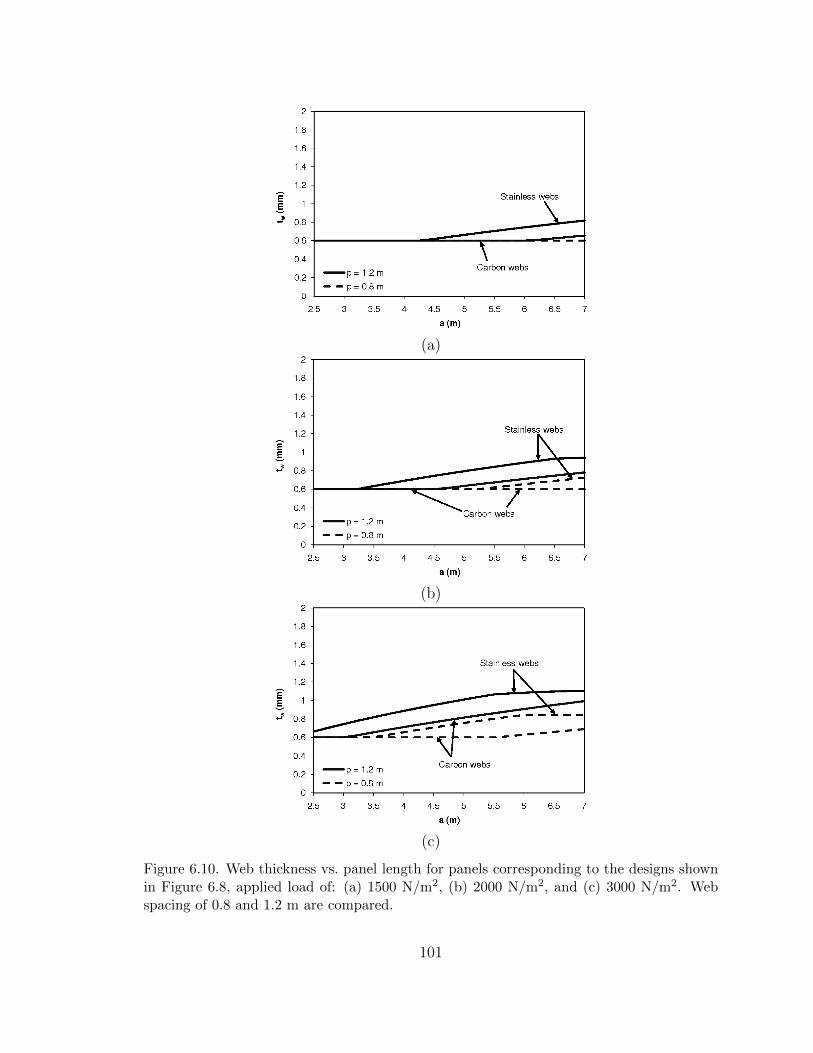
6.10 Web thickness vs. panel length for panels corresponding to the designsshown in Figure 6.8 . . . . . . . . . . . . . . . . . . . . . . . . . . . . 101
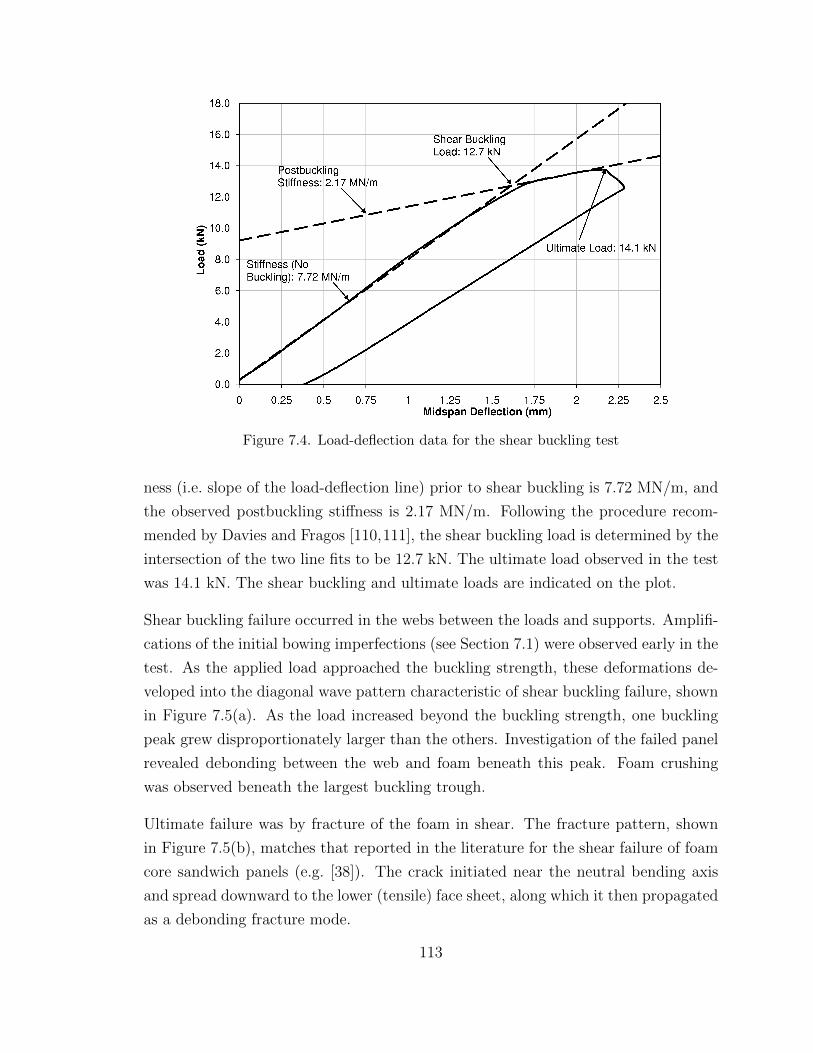
7.9 Load vs. displacement for the tests on Panel A . . . . . . . . . . . . . 122
7.10 Load vs. displacement for the tests on Panel B . . . . . . . . . . . . . 123
7.11 Predicted vs. observed bearing strength; the predicted strengths indi-cate the relative contribution from the webs (dark shading) and thecore (hatched) . . . . . . . . . . . . . . . . . . . . . . . . . . . . . . . 126
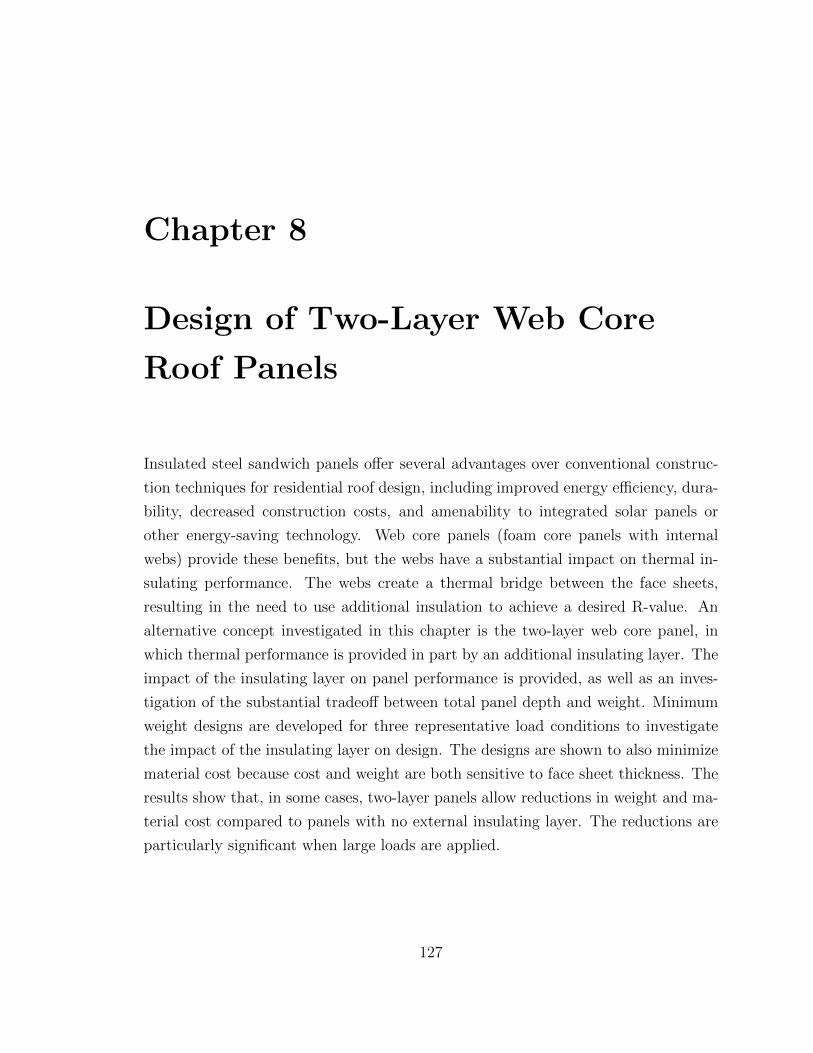
8.1 Sandwich panel concepts for roofs: (a) web core, (b) two-layer webcore, and (c) two-layer metal core . . . . . . . . . . . . . . . . . . . . 128
8.2 Two-layer web core panel geometry and coordinate system; the insu-lating layer is placed on the exterior or interior face of the structurallayer depending on climate . . . . . . . . . . . . . . . . . . . . . . . . 129
xiv
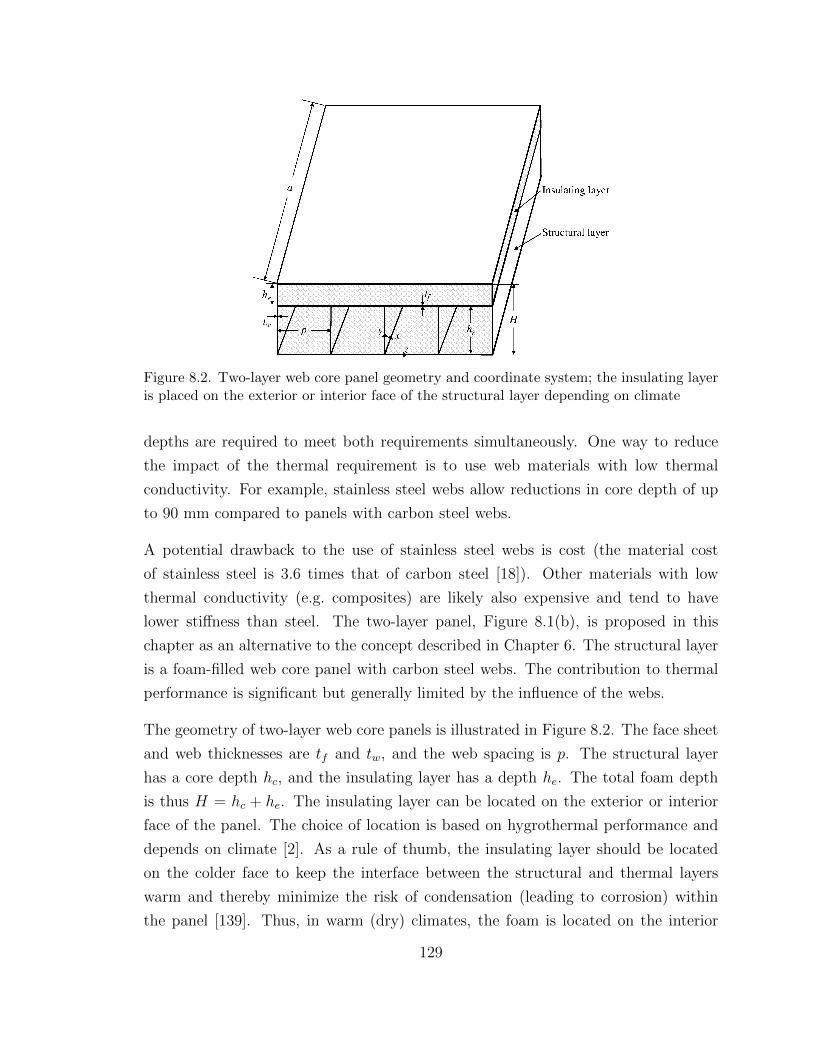
8.3 Isothermal planes approximation for two-layer web core panels; eachcomponent has a thermal conductivity ki corresponding to a resistanceRi in the circuit diagram . . . . . . . . . . . . . . . . . . . . . . . . . 131
8.4 Finite element model and boundary conditions for the analysis of ther-mal performance in two-layer panels: (a) schematic illustration withmetal thicknesses exaggerated for clarity, and (b) typical mesh . . . . 133
8.5 Plot of R-value ratio R/Ri vs. Re/Ri for panels with carbon and stain-less steel webs . . . . . . . . . . . . . . . . . . . . . . . . . . . . . . . 135
8.6 Relative temperature gradient ∆Ti/∆T across the structural layer vs.Ri/R for panels with carbon and stainless steel webs . . . . . . . . . 135
8.7 Failure mode map for web core panels with a = 7 m, q = 1500 N/m2,and R = 5.3 m2-K/W (p = 1.2 m, tf = 2.0 mm); minimum depthdesigns for panels with and without an external insulating layer areindicated . . . . . . . . . . . . . . . . . . . . . . . . . . . . . . . . . . 136
8.8 Pareto optimal curve (weight W vs. panel depth H) for panels witha = 7 m, q = 1500 N/m2, and R = 5.3 m2-K/W (p = 1.2 m) . . . . . 139
8.10 Material cost for each panel concept; the three columns correspond toClimates I, II, and III respectively . . . . . . . . . . . . . . . . . . . . 147
B.4 Buckling of the face sheet into the webs: (a) curvature of the web dueto panel bending, and (b) distribution of compressive stress (denotedfc in the figure) on a web element . . . . . . . . . . . . . . . . . . . . 174
C.1 Model for the determination of shallow foundation stiffness constants 176
C.2 Comparison of the shallow and deep foundation models vs. depth Hk 178
xv
Nomenclature
a = Panel length, plate length, mb = Panel width, plate width, mc = Bearing width, mce = Bearing width at panel supports, mci = Bearing width at actuator load point, mC = Material cost per unit area, $/m2
d = Distance between the face sheet centroids (d = hc + tf ), mD = Panel deflection, plate deflection, mDQx = Panel shear stiffness, N/mDx = Panel bending stiffness, N-mE = Elastic modulus, PaEt = Creep-reduced core modulus, PafP = Non-dimensional (Pasternak) foundation parameterfW = Non-dimensional (Winkler) foundation parameterFC = Reduction factor for panel bearing strengthFR = Reduction factor for web crippling strengthG = Shear modulus, Pahc = Depth of the structural core layer, mhD = Core depth damaged by bearing failure, mhe = Depth of the insulating foam layer, mH = Foundation depth, total panel depth, mk = Foundation characteristic length parameter, m−1
kc = Core material thermal conductivity, W/m-Kke = Insulating layer thermal conductivity, W/m-Kkw = Web thermal conductivity, W/m-KK = Panel stiffness in four-point bending, N/mKP = Pasternak elastic foundation constant, N/mKW = Winkler elastic foundation constant, N/m3
LD = Length of panel region damaged by bearing failure, mN0 = Maximum in-plane bending force, N/mp = Web spacing, mq = Applied roof load, N/m2
q = Elastic foundation restoring force, N/m2
Q = Concentrated load, NQ = Line load for prototype testing, NR = R-value, m2-K/Wt = Sheet thickness, m
∆T = Temperature gradient across the panel, K∆Ti = Temperature gradient across the structural layer, Kw = Panel deflection, plate deflection, mw = Local plate deflection, mW = Panel weight per unit area, N/m2
xvi
W = Mid-span deflection observed in prototype testing, mα = Parameter to determine neutral bending axis locationαf = Face sheet coefficient of thermal expansion, m−1
β = Plate aspect ratioγ = Specific weight, N/m3
εf = Face sheet strain due to bendingζn = Fatigue reduction factorκ = Material cost per unit weight, $/Nλ = Distance from actuator load to supports, mν = Poisson’s ratioξ = Shear lag reduction factorρc = Core density, kg/m3
w = Refers to websf = Refers to face sheetsc = Refers to core material
(·) = Refers to limit state (load or stress at failure)FE = Refers to values obtained by finite element analysis(·),x = Refers to differentiation with respect to the subscripted variables
xvii
Chapter 1
Introduction
Energy efficiency and conservation are growing concerns globally and in the United
States. One area with high potential for improvements in efficiency is residential con-
struction. According to recent energy statistics [1], residential buildings account for
21% of US energy consumption, of which more than 39% goes into space conditioning
(heating and cooling). In a typical house, thermal losses through the roof make up
14% of the building component energy load, and infiltration through the building
envelope (including the roof) accounts for 28% of the heating load. Improvements
to the roof system thus represent an important opportunity for decreasing residential
energy consumption.
Advanced roof designs also have the potential to reduce construction waste. The
construction of a typical 2000 square foot house produces some 3600 kg (8000 lb) of
waste, of which 38% comes from lumber and engineered wood products, and another
25% comes from drywall [1]. Much of this waste comes from the on site production
and assembly of structural features and finishing layers. The waste generation is
up to four times higher if demolition of an existing structure is required. Overall,
construction and demolition account for 24% of the US annual municipal solid waste
stream. Alternative construction systems (e.g. factory-built wall and roof panels)
that minimize waste and encourage recycling can significantly impact material use.
Conventional home construction involves the use of wall studs (typically assembled
on site) and roof trusses, illustrated in Figure 1.1(a). The trusses are typically spaced
at no more than 610 mm (24 in.) on center to provide adequate support for the
1
(a) (b)
(c)
Figure 1.1. Roof structure concepts: (a) conventional (trussed) construction, and (b) panel-ized construction with (c) closeup of a (truss core) panel concept proposed in the literature(all figures from Reference [2]; annotations added for clarity)
roof against snow and wind loads. Roofing typically consists of plywood or oriented
strandboard (OSB) sheets onto which asphalt shingles or other finishing materials are
attached. The close spacing of the trusses results in an unusable attic space, which
is typically vented to the outside. Insulation (usually fiberglass batts or other loose
fill material) is placed in the ceiling layer. Penetrations through the ceiling layer are
difficult to seal and, combined with the loose insulation material, allow substantial
infiltration of unconditioned outside air into the conditioned space. The placement of
HVAC systems in the unconditioned attic (common in warmer climates) and leakage
from ventilation ducts in the ceiling layer contribute additional thermal losses. The
system also requires significant construction time, both for the installation of the
trusses and for the on-site attachment of the exterior roofing layers.
An alternative to the conventional roof structure is the panelized roof, illustrated in
Figure 1.1(b). The panels are supported at the soffit and the ridge (using a ridge
2
beam). An example of a truss core roof panel (developed in Reference [2]; also
described in Section 1.2) is illustrated in Figure 1.1(c). As illustrated, a major benefit
of roof panels is the ability to integrate structural, thermal, and exterior finishing
layers into a single unit, manufactured off site. As a result, roof panels offer the
ability to insulate at the roof plane, creating conditioned attic space. Simulations have
predicted annual energy savings of up to 40% for conditioned versus unconditioned
attic space [2–5]. Additional savings of 20% or more are possible if the walls are
also panelized and filled with polymer foam insulation [6–8]. The improvements are
largely attributed to reduced infiltration (through the use of polymer foam instead of
loose fill insulation) and the confinement of HVAC systems and duct leakage within
conditioned space.
The constructibility benefits of panelized houses were studied by Mullens and Arif [9].
They supervised the side-by-side construction of two similar houses, one using struc-
tural insulated panels (SIPs) and one using conventional construction, and monitored
several performance metrics. They found overall reductions for the panelized house,
in terms of labor and construction time, of 65%. The labor reduction for the panel-
ized roof was 70%. The authors also suggest that a smaller proportion of skilled labor
is necessary with panelized construction, though they do not quantify the amount.
Recognition of the reductions in construction time and costs is growing and is a
key component of SIP marketing and, coupled with the known energy benefits, may
contribute to builder acceptance in spite of the increased material cost.
An additional benefit of roof panels is the ability to create usable attic space (with
steep roofs) or cathedralized ceilings (with shallower roof slopes) [2]. These benefits
add architectural value to a house1. Open attics also allow for increased living space
within a fixed footprint. As single family homes continue to grow (average square
footage increased by 44% from 1980 to 2006 [1]), the use of attic space is a particu-
larly cost-effective means to meet customer demands. Additional benefits include the
ability to partially or fully attach finishing layers in the factory (reducing construction
time even further) and improved quality control compared to on-site construction.
1From conversations with Professor John Carmody of the University of Minnesota
3
1.1 Steel Roof Panels
The present work focuses on improving the design of roofs using steel sandwich panels
with polymer foam insulation. Steel roof panels offer the potential for increased dura-
bility and reduced life cycle costs compared to wood-based construction (discussed
below). The use of steel roofing offers additional benefits over traditional roofing
materials (e.g. asphalt shingles), including reduced maintenance [10] and amenability
to other energy-saving technologies, such as integrated solar photovoltaic panels and
cool roofs [11].
As a structural material, steel has several advantages over wood, including [13] dura-
bility, dimensional stability, consistent manufacturing quality, resistance to mold and
pests, and recyclability (wood is rarely ever recycled from houses and, due to the use
of chemical treatments, must be disposed of as toxic waste [13]). The life cycle cost
of recycled steel is competitive with other building materials, particularly in climates
where the availability of wood is limited [14]. The thermal performance of steel can
be made competitive to that of wood through the use of perforations [12,15] or added
insulation. The perforations, illustrated in Figure 1.2, reduce heat flow by greatly
increasing the path length of heat flow through the wall. The benefits of steel con-
struction are well known in very cold climates (e.g. Scandinavia and Russia), where
steel is a building material of choice. Figure 1.3, for example, shows an all-steel
residential construction in Sorochany, Russia (about 54 km north of Moscow). The
slotted steel wall studs can be seen in Figure 1.3(b).
Figure 1.2. Slotted steel studs to reduce heat transfer through walls (from Reference [12])
4
(a) (b)
Figure 1.3. All-steel residential construction in Sorochany, Russia: (a) house under con-struction, and (b) close-up of the attic/roof structure (http://profilesolutions.lindab.com)
Acceptance of steel construction is occurring more slowly in the US, where wood is
readily available and economically feasible. However, building envelope studies have
suggested steel may become an increasingly viable building material, particularly as
considerations of quality, material waste, and life cycle cost become more important
[10,11,13]. The same considerations are expected to increase the prevalence of metal
roofing in the US.
Two recent studies [16, 17] have investigated the viability of stainless steel as a con-
struction material for buildings. Although both works focused on larger projects
(e.g. commercial buildings), the main principles apply to residential construction as
well. The thermal conductivity of stainless steel is about a third of that of carbon
steel, while the stiffness is comparable. A drawback to stainless steel is the cost,
which is about 3.5 times that of carbon steel [18]. Gedge [16] points out that much
of the increased cost of stainless steel structures is due to overspecification of surface
finish and can therefore be mitigated by using lower standards for non-architectural
(i.e. non-visible) structural members. It is also worth pointing out that the increased
strength (and reduced thermal conductivity) may lead to designs which are ultimately
cost-competitive with carbon steel.
1.2 Roof Panel Concepts
Energy efficient roofs must provide adequate structural performance while simulta-
neously fulfilling thermal insulation requirements. A handful of roof panel concepts
5
that attempt to meet these goals have been examined in the literature. Note that
several works already cited [6–9] have examined the non-structural impacts of panel
use. The discussion in this section is limited to the work focused on the structural
design of roof panels.
The early concepts [19,20] rely on the use of wood (primarily OSB) structural mate-
rials. For example, Kucirka [19] studied the use of foam core panels for roofs. The
panels consist of OSB face sheets and a core layer made of rigid polyurethane. Panel
design was strongly limited by thermal and hygroscopic deflections. In addition, the
panels rely fully on the core material to resist shear deformation due to the structural
loads. Polymer foam core materials have low shear stiffness (compared to steel) and
are subject to creep. Because roofs are subjected to long-term loading, the core layer
must be deep enough to compensate for the effects of creep.
To overcome the design difficulties associated with the use of a polymer foam core,
Crowley [20] proposed a panel consisting of OSB face sheets and webs. Nonstructural
loose-fill insulation is located in the voids between the webs. A similar concept later
proposed by Dweib, et al. [21, 22] uses face sheets and webs made from a novel bio-
based composite material. Polymer foam fills the spaces between the webs, but it is
not used structurally. Both designs neglect the impact of the webs on thermal perfor-
mance. More critically, both designs neglect key durability considerations, including
creep (of the face sheets and webs) and hygrothermal warping. These considerations
are particularly important for the bio-based material, for which the creep and warping
behavior is currently not understood.
A limitation of the work described in References [19, 20] is the focus on OSB as a
structural material. In addition, the literature on roof panel design [6, 8, 20–22] has
almost universally neglected the effect of creep, particularly in the core material.
Thomas [23, 24] studied the design of foam core roof panels using a wide variety of
face sheet and core materials, accounting for the effect of core creep. He found the
use of non-hygroscopic (steel) face sheets results in reduced hygrothermal deflection
and improved panel stiffness. Designs are still limited, however, by the reliance on
the core material for stiffness under long-term loading. The effect of creep on foam
core panel design, illustrated in Chapter 6 of this work, is a dramatic reduction in the
maximum span length. As a result, foam core panels are ruled out as viable design
options for residential roofs.
6
Figure 1.4. Spectrum of panel designs based on the function of the insulating material:structural foam meets the thermal requirements incidentally (no need for specific thermaldesign); insulating foam does not contribute to panel structural performance
As an alternative to the foam core concept, the truss core panel [25–27] was developed
at the University of Minnesota. Truss core panels (see Figure 1.1(c)) consist of two
layers. The structural layer is a sandwich panel with steel face sheets and cold-formed
V-channel webs. The thermal layer is rigid polyurethane foam and is attached to the
structural layer on either the interior or exterior surface, depending on climate (see
Chapter 8). Exterior finishing consists of either metal roofing or OSB with asphalt
shingles attached. Truss core panel designs have been specified for climate scenarios
throughout the US and for roof spans up to 6.1 m (20 ft) [27].
Foam core and truss core panels represent limits on a spectrum of panel designs. This
spectrum is illustrated in Figure 1.4. In foam core panels, the foam acts directly as a
structural material: the amount of foam necessary to meet the structural requirements
is more than sufficient to meet the thermal insulating requirement [23]. In truss core
panels, the foam acts only as an insulating material and provides no contribution to
structural performance. In addition to these concepts, hybrid designs are possible
in which the thermal and structural design cannot be separated2. Examples of the
latter category are web core and two-layer web core panels, both of which are described
below.
A potential drawback to designs on either end of the spectrum in Figure 1.4 is the
suboptimal use of material. Foam core panels require considerable foam and thick
face sheets to achieve the required structural performance (Chapter 6). Truss core
panels allow minimum foam use but require relatively thick face sheets and webs to
meet the structural requirements without contribution from the foam. However, by
2Note “separated” in this context refers to the ability to design for thermal and structural re-quirements independently. All of the panels considered in this work are designed to meet bothrequirements in one integrated unit.
7
(a) (b)
Figure 1.5. Web core panel concept: (a) panels with no external foam layer, and (b) two-layer panels with external foam layer
exploiting the structural properties of the foam, it is possible to design panels that
meet the structural requirements using thinner wall sections (face sheets and webs).
Web core panels, illustrated in Figure 1.5, achieve this gain by using steel webs to
achieve the necessary stiffness, while the foam core strengthens the structure against
local buckling. The tradeoff is a reduction in thermal insulating performance because
the webs provide thermal shorts between the face sheets. Assuming the impact of
the webs on thermal performance can be limited, however, the thinner wall sections
enable lighter-weight design.
Two methods are available to compensate for the effect of webs on thermal perfor-
mance. Web core panels with no external foam layer, Figure 1.5(a), resemble foam
core panels in that the structural and thermal functions are achieved in a single panel
layer—compensation for the webs is achieved by increasing the core depth. Two-layer
panels, Figure 1.5(b), use an external insulating layer, analogous to truss core panels.
The exterior roof finishing is achieved either by attachment to the insulating layer or
through the use of lightly profiled exterior face sheets. In addition to stiffening the
panel structure, the webs act as joints between adjacent panels. This function sug-
gests an alternate interpretation of the web core panel concept: the same functions
are achieved using foam core panels with webs acting as the panel-to-panel joints3.
3This interpretation is strengthened by the result that panel designs typically require wide (1.2m) web spacing, see Chapter 8.
8
1.3 Research Objectives
To meet the structural and thermal requirements of roofs using web core panels, it
is necessary to exploit the strengthening effect of the core material on the various
local structural failure modes. Although the interaction between face sheets and core
material has been studied extensively (mainly in foam core panels), the interaction
with the webs is not well understood. Roof panels require the use of thin webs, so
an understanding of the effect of core material on web strength is essential. For that
reason, a key objective of the present work is the development of models by which the
core material can be incorporated into the design of panels with thin webs. Emphasis
is placed on the failure modes (shear buckling and bearing failure) most likely to limit
the design of roof panels, but application to the other failure modes is also presented.
Another objective of the present work is the development of an approach to the
design of web core panels for residential roofs. To provide perspective, designs are
developed for a representative house under different load scenarios and compared to
the corresponding truss core designs reported in Reference [2]. From these results,
recommendations are made regarding the design and applicability of web core panels
to residential roofs.
The work described in this thesis is broadly applicable to the design of lightweight
panels, with or without thermal insulating requirements. In aerospace structures,
for example, specific strength requirements are becoming increasingly rigorous, and
the use of composite or super alloy structural materials is increasingly expensive.
This work demonstrates the significant effect that core material can have on local
buckling strength. Polymer foams provide a particularly effective means of achieving
minimum weight panel design. It can thus be expected that understanding the inter-
action between structural and core materials will become increasingly important to
structural design, and the models provided here are a significant contribution toward
that understanding.
1.4 Outline of the Thesis
This work details the structural and thermal design considerations for the use of web
core sandwich panels in lightweight residential roofs. The choice of core material is
a particularly important concern for roof panels. Therefore, an overview of poly-
9
mer foams is presented in Chapter 2 along with recommendations for core material
selection. Chapter 3 describes the failure modes relative to web core panels under
distributed load and provides an overview of the relevant literature on modeling those
modes. In practice, only a few of the relevant failure modes affect panel design.
Models for the failure modes relevant to panel design are presented in Chapters 4–6.
A particularly important failure mode, for which no relevant models are currently
available in the literature, is shear buckling of the webs. For that reason, a model for
shear buckling strength that accounts for the effect of the foam core is developed in
Chapter 4. Another important failure mode for which existing models are inadequate
is bearing failure at the panel supports. A different technique must be employed to
model the effect of the core material. Bearing failure is modeled in Chapter 5. The
other failure mode models are provided along with a procedure for minimum depth
design of web core panels with no external insulating layer in Chapter 6. Chapters 4
and 6 are in press as References [28] and [29] respectively.
Validation of the structural failure mode models developed in this work was performed
in part through prototype testing as described in Chapter 7. Chapter 8 presents the
design considerations for two-layer web core panels. Designs for minimum weight and
material cost are developed and compared to designs for panels with stainless steel
webs and no external insulating layer. The designs are also compared to truss core
panel designs developed in Reference [27]. Conclusions regarding the use of web core
roof panels are given in Chapter 9.
10
Chapter 2
Polymer Foam Considerations
Polymer foams are well suited to building insulation applications. Their hygrothermal
properties are superior to those of traditional insulating materials like fiberglass [30],
and their mechanical properties allow them to be used where they will be subject to
external loads. As with any insulating material, however, several considerations must
guide foam selection. These considerations include structural and thermal require-
ments, building code compliance, safety, and manufacturability issues.
This chapter describes the foam considerations that are specific to web core roof
panels. A brief overview of the properties and the mechanics of foam relevant to roof
panel design is provided, followed by a summary of the loading and residential code
requirements pertaining to the use of foams in roof panels. A summary of the foams
commonly used in building applications, as well as some potentially viable emerging
technologies, is also presented, along with typical properties for the commonly-used
foams. Based on the roof requirements and the property data, recommendations are
made regarding foam material selection for roof panels.
2.1 Physical Properties of Foams
Roof panels are designed subject to a variety of requirements, including strict deflec-
tion limits under a combination of short- and long-term loads, long service life, and
large temperature variations. As a result, polymer foams used in roofs must have
several characteristics, including
11
• High specific stiffness and strength
• Low thermal conductivity
• Stable under long-term loading
• Stable under high service temperatures
• Safe performance under fire conditions
All of these characteristics can be obtained through careful foam selection, as outlined
in this work. The first three properties depend on density as well as composition of
the foam and can therefore be adjusted, in general, for a particular foam. The last
two properties are functions of the material and are used in Section 2.2 to narrow the
set of available foams for use in roofs.
Foams are highly structured materials. At the micro scale, a foam can be approxi-
mated by a lattice of struts arranged in various space filling geometries. The simplest
such model is the face centered cubic cell, illustrated in Figure 2.1. The cell walls of
closed-cell foams may also contribute to structural behavior; however, for many foams
(including polyurethanes) this contribution is small and can be ignored without loss
of accuracy. The lattice-type microstructure of foams has important consequences
on the constitutive behavior. For example, tensile, compressive, and shear stresses
translate into different loads on the cell structures1. As a result, foams typically have
different properties in tension, compression, and shear.
Many foams (like the one in the figure) have elongated cells due to pressures from
the foaming process. The elongation, known as “rise,” also affect foam behavior.
Stresses oriented in the rise direction act mainly on the smaller struts, so foams are
typically stiffer and stronger in the rise direction. The elongation occurs when foams
are prevented from expanding freely in all directions. For example, in web core panels,
polyurethane cores can be foamed in-situ (see Section 2.2.2). In that case, the foam
is essentially free to expand in the direction of panel length. The face sheets and webs
limit expansion perpendicular to panel length. Thus, foam rise is in the longitudinal
panel direction.
The mechanics of foams have been studied extensively, and several reference books
(e.g. [31–33]) are now available that summarize the results. The most important result
is the observation, discussed in detail by Gibson and Ashby [33], that the properties
1E.g. compressive stress causes buckling of some struts; shear stress causes bending of struts thatare stretched (with no bending) under tensile stress
12
Figure 2.1. Simplified model for open-celled foam microstructure; cells are elongated in therise direction
of a foam scale with density in a straightforward manner. Consider a foam of density
ρ, for example, made out of a material with elastic modulus Es and density ρs. The
compressive modulus Ec of the foam follows the power law model
EcEs
= C
(ρ
ρs
)n. (2.1)
The other mechanical properties of foams follow the same model, though with different
values for the constants C and n. In the absence of experimental data on the values
of C and n, Gibson and Ashby [33] derived models for a variety of physical properties
assuming the cubic cell structure illustrated in Figure 2.1. Most foams have cell
geometry more complex than cubic (tetrakaidecahedral, for example) and models have
been developed that account for other geometries. These models typically require
experimental calibration of more than two constants, however. As a result, most
design is performed using the model given in Equation (2.1), with C and n determined
experimentally.
The thermal conductivity k of foams is a function of foam density and of the gas
that is trapped within the cells of the foam [33]. Heat conduction through a foam
occurs via three modes: conduction through the solid material, conduction through
the gas, and radiation across cell voids. Due to the balance between conduction
and radiation, foams have an optimum density at which the thermal conductivity
is minimized. In polyurethane foams, for example, the optimum density is around
48 kg/m3 (assuming the cells are filled with air) [33]. The thermal conductivity
of most foams increases slightly as the foam ages. The aging mechanism has been
reported in the literature and is summarized by Gibson [33], among others. Foams
13
are typically processed using blowing agents with low thermal conductivity, such as
HFC’s, hydrocarbons, or carbon dioxide. Over time, the blowing agents diffuse out
of the foam and are replaced by air, which has a higher thermal conductivity. Under
normal service conditions, the aging process takes several years, particularly if the
foam is faced with an impermeable material such as steel.
An important consideration for foams used in roof panels is long-term performance.
Roof panels are subjected to sustained loading, as well as to cyclic loading. Creep
and fatigue are thus important aspects of foam behavior. Assuming that the applied
stresses on the foam are not great enough to cause rupture, creep effectively reduces
the stiffness of the material, and fatigue reduces the strength. These phenomena are
particularly problematic in foam core sandwich panels, where the foam is an integral
part of the panel structure. They can have an important impact on the long-term
livability of the affected house and thus should not be ignored in roof panel design.
The approach to dealing with the creep of polymer foams is to reduce the stiffness
according to a creep reduction factor φt. For an initially undeformed foam under
constant load with initial elastic modulus E0, the modulus E after a loading time t
is given by
E =E0
1 + φt. (2.2)
The reduced shear modulus G is found from the initial modulus G0 in the same
manner. For polymer foams, φt is best described by the power law model [34]
φt = Atn. (2.3)
Long-term creep testing on polystyrene [35] and other foams [36] has demonstrated
that good estimates of the creep parameters can be determined through relatively
short-term testing. Test data for polystyrene over a period of 1000 hours, for example,
have been shown to be sufficient for the accurate prediction of creep behavior for at
least 100,000 hours [35,36].
The influence of fatigue on foam strength is accounted in this work through a fatigue
reduction factor ζn. Fatigue results for foams are typically presented using the stan-
dard Basquin (stress-life) model for high cycle fatigue [37]. The shear strength τu of
a foam after n loading cycles is found by reducing the monotonic shear strength τu0
14
according to
τu = ζnτu0, (2.4)
and likewise for the compressive strength. Equation (2.4) is particularly convenient
for foams because ζn is independent of density [38]. Fatigue test results for a wide
variety of foams are reported (using standard stress-life plots) by Zenkert [37].
Several failure theories have been proposed and applied to foams, as described in a
review by Abrate [39]. The most generally applicable failure criteria are of the form(σσ
)n+(ττ
)n≤ 1, (2.5)
where the overlined variables refer to the maximum stress at failure. Equation (2.5)
has been shown to fit well with data for PVC foams with n = 2 [40]. By extension,
the model is often applied to other foams as well. It is worth pointing out that, in
practice, the stress state in the core of sandwich panels is not mixed: as described in
Chapter 6, the bending stresses in the panel are taken by the face sheets, so the core
material is essentially in pure shear. As a result, Equation (2.5) simplifies to τ ≤ τ
as used in Chapter 6.
Depending on several factors—e.g. R-value, roof orientation and slope, roofing color,
and the presence of solar panels—the outer surface of the roof can reach temperatures
of 80◦C or higher [41, 42]. These temperatures are approaching the glass transition
temperature for many polymer materials and therefore can have important impli-
cations for foam material selection. The maximum service temperature is typically
specified by foam manufacturers to be slightly below the glass transition temperature.
In foams that are loaded while exposed to higher temperatures, substantial creep
or compression setting can occur. The increased creep can cause substantial (and
possibly irreversible) panel deformation. Compression setting can lead to localized
densification, resulting in reduced thermal insulating performance over time. Thus,
foams should not be used in applications where the maximum service temperature is
routinely exceeded.
One other requirement for roof panels is the fire performance of the foam. US res-
idential codes [43] specify that foams should be separated from the interior living
space by a minimum 1/2 in. (13 mm) gypsum board. They also specify the minimum
performance of the foams per ASTM E-84 [44], which deals with the amount of flame
15
spread and smoke generation under exposure to flames. However, a growing body of
evidence (e.g. [42, 45–48]) suggests that the current standards are not adequate for
evaluating the safety of the materials under realistic fire conditions. As described in
Section 2.2.1, for example, fire tests have revealed very troubling performance when
roof panels are used with thermoplastic core materials. Rakic [47] notes a growing
trend among insurers of commercial buildings in Australia and the EU to impose re-
quirements much stricter than the current building codes on fire performance. Thus,
recommendations are made in the present work based on test results reported in the
literature rather than on the current building code requirements.
2.2 Types of Foam
The most commonly used foams in building applications are polystyrenes and rigid
urethanes. Polystyrene foams are thermoplastic foams available in boardstock form,
though expanded polystyrene can be pre-molded into a desired shape. Urethane-
based foams are thermoset foams available either in boardstock or as resins that can
be mixed and foamed into the panel in-situ. Polystyrenes and urethanes are broadly
representative of the full range of rigid polymer foams, thermoplastic and thermoset
respectively. The panel design considerations regarding these foams are discussed in
Sections 2.2.1 and 2.2.2 respectively. A brief review of some emerging technologies
for sustainable foams is given in Section 2.2.3.
2.2.1 Polystyrenes
Polystyrene foams come in two varieties. Expanded polystyrene (EPS) is produced
from solid polystyrene beads in a two-step process: first, the beads are pre-expanded
through exposure to heat, then the pre-expanded beads are fused and molded into
their final shape [49]. Extruded polystyrene (XPS) is formed by mixing the molten
polymer with a blowing agent under high pressure and then extruding it onto a
conveyor under atmospheric conditions, where it expands as a foam. Both materials
are commonly used in a variety of applications, including as thermal insulation.
Polystyrenes are thermoplastic foams, so they lose their shape and melt when heated.
Because thermoplastic foams tend to have lower glass transition temperatures than
thermoset foams, the maximum service temperatures are relatively low as well. Po-
lystyrene foams typically have a maximum service temperature in the range of 75–
16
90◦C [50]. When EPS and XPS foams are used in roofs, where temperatures can
readily reach the upper end of that range, substantial softening has been observed [41].
Softening leads to compaction of the foam, which in turn leads to reduced R-values
and can potentially be aesthetically unpleasing. Care should be taken, therefore, not
to use polystyrenes in environments where the roof temperatures exceed 70◦C.
The fact that polystyrenes are thermoplastic foams has important consequences for
the performance under fire conditions. Several authors (e.g. [41, 42, 45–47]) have
reported on the behavior of polystyrene foam sandwich cores under medium- and
large-scale fire tests. When exposed to high temperatures, the foam melts and draws
away from the heated panel surface, creating voids within the panel. Substantial
bowing of the affected panels is accompanied by failure of the panel-to-panel joints.
The failed joints allow flaming foam droplets to flow from the panel and draw hot air
into the void left by the melted foam. This hot air contributes to the rapid spread of
the fire within the panel. The spread is so rapid that, even under highly-controlled
test conditions, it allows the fire to burn out of control [45].
The flaming droplets and contribution to fire spread have led researchers to recom-
mend against the use of roof panels with polystyrene cores [41, 42, 45–47]. It should
be noted that the poor fire performance is not unique to polystyrene cores. The real
issue, particularly with regard to fire spread, is the use of thermoplastic foams. Any
other thermoplastic foam is expected to behave in the same manner (with the possible
exception of the flaming droplets). It can therefore be concluded that thermoplastic
foams are inappropriate for use in residential roof panels.
2.2.2 Polyurethanes
The category of rigid polyurethanes consists of two types of foam formed by the
reaction of isocyanates with polyols [51]. The difference between rigid polyurethane
(PUR) and polyisocyanurate (PIR) is in the ratio of isocyanate to polyol used in the
formulation. PUR contains the two components in roughly equal proportion, while
PIR typically contains 2–3 parts isocyanate for each part polyol [52]. The excess
isocyanate reacts with itself to form trimer ring structures that are thermally stable
up to high temperatures, thus affording improved thermal resistance.
Rigid urethane foams are formulated with a high degree of cross linking. As a re-
sult, PUR and PIR are both thermoset foams. This cross linking is beneficial from
17
the standpoint of thermal conductivity and resistance to fire and high temperatures.
Excessive cross linking can make the foams friable (brittle to the touch), however,
particularly for PIR foams. Friability is an undesirable characteristic because it re-
duces the adhesive quality of the foam [52], the fatigue strength of the foam [41], and
the ability of the foam to withstand impact or localized loads.
Because of their useful structural characteristics and their ability to be readily foamed
in-situ, urethane foams are available in a wide range of densities. PUR, for example,
is readily available at densities of 400 kg/m3 or higher [53]. While the mechanical
properties improve with density, the thermal conductivity also increases [33], to the
detriment of thermal performance. As a result, PUR is rarely used at densities higher
than 48 kg/m3 for building insulation applications.
The fact that rigid urethanes are thermoset foams causes them to behave under fire
conditions in a manner quite different from polystyrenes and other thermoplastic
foams. Urethane foams do not melt at high temperatures; instead, they form a stable
char that prevents flame spread and provides a small amount of thermal protection to
the surrounding foam [41,42,47]. Because the foam does not melt, voids are not cre-
ated, and fire cannot spread within the panel. Urethane foams, and PIR in particular,
also tend to have slightly higher ignition temperatures than thermoplastic foams; con-
sequently, they have slightly longer fire resistance times. As with polystyrene foams,
the behavior of PUR in fire tests is representative of thermoset foams in general.
One other thermoset, phenolic foam (PF), has been used in limited commercial in-
sulation applications [30, 42, 50] and is therefore worth noting here. PF has insulat-
ing characteristics similar to XPS and structural characteristics slightly better than
PUR [50]. Because it is very highly cross linked, it has better fire performance than
PUR and PIR [41], but at the cost of particularly high friability [42]. PF has the
additional drawback in that it must be absolutely protected against moisture and
condensation due to the use of water soluble sulfonic acid as a foaming catalyst [54].
Water that comes in contact with the foam becomes highly acidic and poses a strong
corrosion risk to the underlying panel structure. Due to the high friability and the
increased corrosion risk, PF is not recommended for use in residential roofs.
18
2.2.3 Sustainable Foam Technology
Sustainable polymer foam technology is an area of active research. The work is
primarily focused on flexible foams, which have applications (e.g. packaging and seat
cushions) that demand much higher production volumes than structural foams. How-
ever, some advances in sustainable rigid foam technology are worth noting here. Sus-
tainable rigid foam is achieved primarily through three avenues: bio-based foams,
bio-based (rather than petroleum-based) constituents to traditional foams, and recy-
clability.
Research in bio-based structural foams is actively occurring. Wool [55], for example,
reports on a thermoset foam made from acrylated epoxidized soybean oil (AESO)
blown with carbon dioxide. The work on AESO foam suggests bio-based foams may
be a viable option for structural core materials in the future. The results are currently
too preliminary to be useful for design, however, especially with regard to durability
considerations. As with any material derived from food crops, further study is also
needed to determine whether soybean production would be sufficient to keep up with
the demand for foam products. The work does, however, illustrate the potential for
novel bio-based foam products as a potential replacement for petroleum-based foams.
Another line of research regarding bio-based foams is in sustainable sourcing of raw
materials for traditional foams. The polyol component of PUR, for example, can
be derived from various vegetable oils [56]. The foams can be made at lower cost
and with mechanical properties comparable to petroleum-based PUR; however, the
isocyanate component currently comes only from petroleum sources. Thus, coupled
with the energy required to create the polyols, the bio-based foams provide limited
benefit over petroleum-based foams [55]. Foams can also be made from recycled
content. Azim et al. [57], for example, report the synthesis of PUR foams from
recycled beverage bottles. Although this technology is in the very early stages of
development, it too may be a promising avenue for sustainable foams.
A third line of research in sustainable foam technology is in the processing, par-
ticularly the development of sustainable foaming agents. Polyurethanes were tradi-
tionally blown using CFC or HCFC blowing agents [58], which have ozone depleting
potential. A variety of physical blowing agents are used currently, but HFC’s and
C5-hydrocarbons (e.g. pentane) are the most common, and these have global warming
potential [58]. A variety of chemical blowing agents have also been developed [58–60].
19
Chemical blowing agents react in the mixing process, producing a gaseous byproduct
(usually carbon dioxide or water vapor). A drawback to these foams is increased heat
generation, which can damage the newly-formed cells [58]. A potential solution to
this problem is to use froth-in-place foam [58]. Froth-in-place foams are formed by
allowing the foam components to react while mixing (rather than after mixing as in
foam-in-place processes). Slightly greater thermal control is possible during the mix-
ing process (e.g. through cooling of the mixing head), so the impact of the reaction
heat can be reduced. In addition, froth-in-place foams expand and gel very quickly
when exposed to air, so the foam properties tend to be more uniform compared to
other foaming techniques.
A major drawback to the use of sustainable foam technologies is the preliminary
state of the research. Methods of mass production, particularly methods that do not
require the use of fossil fuels, do not yet exist. Even when methods are developed,
it will be necessary to assess the viability of the foams in terms of the impact on
existing seed crop production. It will also be necessary to perform substantially more
testing of the mechanical and hygrothermal properties and on how those properties
change over time. Creep and fatigue testing, and testing on the resistance of the foams
to chemical breakdown will be necessary, particularly for the novel foam materials,
before they can be considered suitable for roof applications.
2.3 Typical Foam Properties
To provide a basis for comparison of the different foam types, some typical property
values for styrene and urethane foams are provided in this section. Each of these
foam types is associated with ASTM materials standards [61–63], from which the
data presented in this section are drawn.
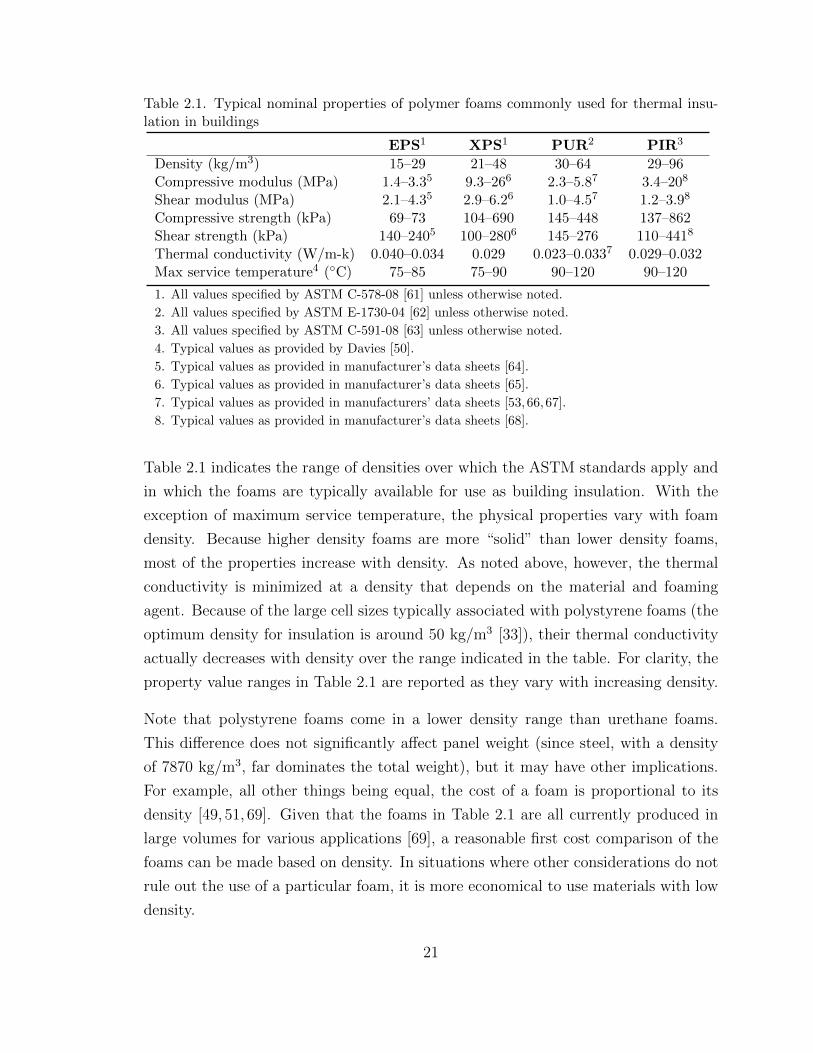
Typical values of the material properties relevant to roof design are provided in Table
2.1 for comparison. Note that, due to the unavailability of exhaustive lists of property
values, the table relies on several sources. The property values that have been specified
in the appropriate ASTM standards are used. The one exception is the thermal
conductivity range for PUR. The ASTM standard [62] specifies a range of 0.036–
0.037 W/m-K, which is substantially higher than the values reported in vendors’
data sheets. The other mechanical properties not specified by ASTM standards are
taken from vendors’ data sheets.
20
Table 2.1. Typical nominal properties of polymer foams commonly used for thermal insu-lation in buildings
1. Specimen debonded from substrate at the given load prior to failure
23
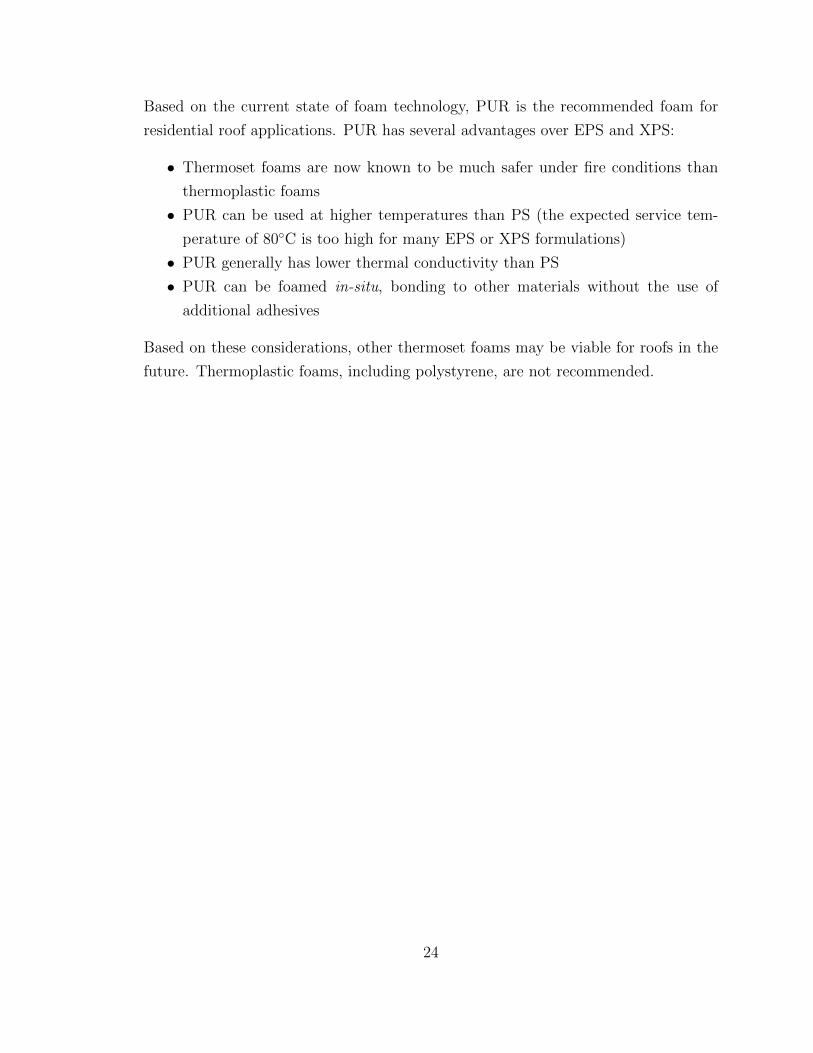
Based on the current state of foam technology, PUR is the recommended foam for
residential roof applications. PUR has several advantages over EPS and XPS:
• Thermoset foams are now known to be much safer under fire conditions than
thermoplastic foams
• PUR can be used at higher temperatures than PS (the expected service tem-
perature of 80◦C is too high for many EPS or XPS formulations)
• PUR generally has lower thermal conductivity than PS
• PUR can be foamed in-situ, bonding to other materials without the use of
additional adhesives
Based on these considerations, other thermoset foams may be viable for roofs in the
future. Thermoplastic foams, including polystyrene, are not recommended.
24
Chapter 3
Thermal and Structural Design
Considerations
Several limit states applicable to the design of web core roof panels have been iden-
tified in the present work. Specifically, these are:
• Thermal insulating performance
• Panel deflection
• Buckling of the face sheet
• Shear buckling of the webs
• Bearing stress failure at the support locations
• Shear stress failure of the core material
• Flexural buckling of the webs
• Buckling of the face sheet into the webs
A subset of these modes play a key role in the determination of feasible panel designs.
Descriptions of each failure mode and the relevant modeling techniques described in
the literature are presented in this chapter.
3.1 Panel Loads
The applied loading and thermal requirements for roofs in the United States are
specified by building codes [43,71]. The requirements are climate dependent. Colder
climates are subject to larger loads (due to snow loading) as well as higher insulating
25
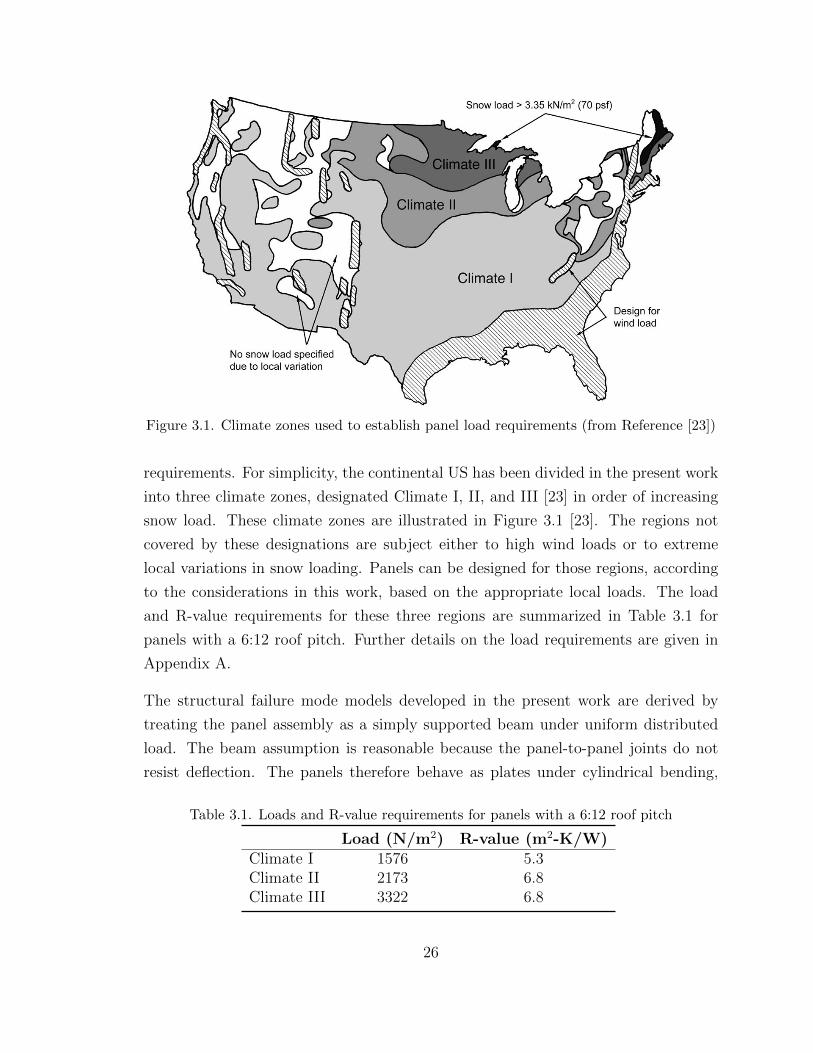
Figure 3.1. Climate zones used to establish panel load requirements (from Reference [23])
requirements. For simplicity, the continental US has been divided in the present work
into three climate zones, designated Climate I, II, and III [23] in order of increasing
snow load. These climate zones are illustrated in Figure 3.1 [23]. The regions not
covered by these designations are subject either to high wind loads or to extreme
local variations in snow loading. Panels can be designed for those regions, according
to the considerations in this work, based on the appropriate local loads. The load
and R-value requirements for these three regions are summarized in Table 3.1 for
panels with a 6:12 roof pitch. Further details on the load requirements are given in
Appendix A.
The structural failure mode models developed in the present work are derived by
treating the panel assembly as a simply supported beam under uniform distributed
load. The beam assumption is reasonable because the panel-to-panel joints do not
resist deflection. The panels therefore behave as plates under cylindrical bending,
Table 3.1. Loads and R-value requirements for panels with a 6:12 roof pitch
Load (N/m2) R-value (m2-K/W)Climate I 1576 5.3Climate II 2173 6.8Climate III 3322 6.8
26
Figure 3.2. Panel coordinate system and the associated distribution of internal shearingforces and bending moments
Figure 3.3. Locations of the local failure modes in the face sheets and webs
for which the behavior can be approximated using beam theory assumptions [72].
Modification to the basic theory is necessary to account for the relatively wide web
spacing and is discussed in Section 3.3.
From first principles, the internal shearing forces and bending moments in a panel of
length a under a distributed load q follow the distributions plotted in Figure 3.2. For
reference, the coordinate system used throughout this work is included in the figure.
The stresses in the face sheets and webs are not uniform along the panel length (the
shearing force varies linearly, and the bending moment varies parabolically). Thus,
failure modes (e.g. face sheet buckling) that are caused by bending stresses will be
localized at the panel midspan, while modes (e.g. web shear buckling) caused by shear
stress will occur near the supports. This localization of the failure modes is illustrated
in Figure 3.3 and has a minor effect on panel strength, as described in Chapter 4.
27
More importantly, it means that interaction effects between failure modes will be
minimized. Such interactions have therefore not been considered in the present work.
3.2 Thermal Insulating Performance
The thermal performance of roof panels is measured by the R-value of the assembly.
The R-value is a measure of the resistance of the panels to conductive heat transfer.
Following the concept of the “clear wall” R-value [73], the influence of the webs is
taken into account, but localized details of the overall roof structure (e.g. insertions
for ventilation, skylights, etc.) are ignored. Higher R-values translate to improved
energy performance by reducing the energy required to maintain a set temperature
in the interior space.
For the panels described in this work, the R-value is determined using the isothermal
planes method [30]. In this method, illustrated in Figure 3.4, the panel assembly is
broken down into a set of layers, defined by (assumed) isothermal interfaces. Follow-
ing the well-known electrical circuit analogy, the thermal performance of the panel
assembly is determined by treating the layers as thermal resistances in series. The
structural layer of the panel is similarly broken down: assuming no lateral heat trans-
fer between the webs and core material, these components act as parallel resistances.
The R-value of the panel assembly is determined from the equivalent thermal resis-
tance of the components.
For the web core panels illustrated in Figure 3.4(a), the isothermal planes assumption
is reasonable. However, in two-layer panels, Figure 3.4(b), the interface is not isother-
mal in general. The webs provide a thermal short to the interior surface temperature,
so the temperature Tm varies with distance from the webs. Schoenbauer [74] inves-
tigated to a limited extent the thermal performance of panels with non-isothermal
interface between the layers. He found the isothermal planes approach is conservative
in the sense that it underpredicts the R-value of the assembly. In the panels he inves-
tigated, the structural layer of the panel provided less than 20% of the total R-value,
and the error caused by using the isothermal planes method was less than 5%. As the
contribution of the structural layer to the total R-value decreases, the error decreases
as well.
28
(a)
(b)
Figure 3.4. Isothermal planes (lumped thermal resistance) approximation for panels (a)without and (b) with an external foam layer
Schoenbauer’s [74] results make sense because, referring to the circuit diagram in
Figure 3.4(b), the temperature drop across the structural panel layer decreases along
with the R-value contribution. As the temperature drop decreases, the interface
between the two layers becomes more nearly isothermal. Thus, in web core panels,
where much of the thermal performance comes from the exterior foam layer, the
accuracy of the isothermal planes method is reasonable. Based on these results, the
method is used in the present work for the thermal analysis of panels with and without
an exterior foam layer.
3.3 Panel Deflection
As with the thermal insulating requirement, the limit on allowable roof deflection is
specified by building codes. For example, the International Residential Code (IRC)
[43] establishes a deflection limit of span/240, where span refers to the projected
distance spanned by the panel. For clarity, the conventions by which load, deflection,
and span are defined (in this work and in the residential code) are illustrated in
Figure 3.5. Both the load q and the deflection w refer to the components of load
and deflection acting normal to the panel surface. The specified deflection limit
29
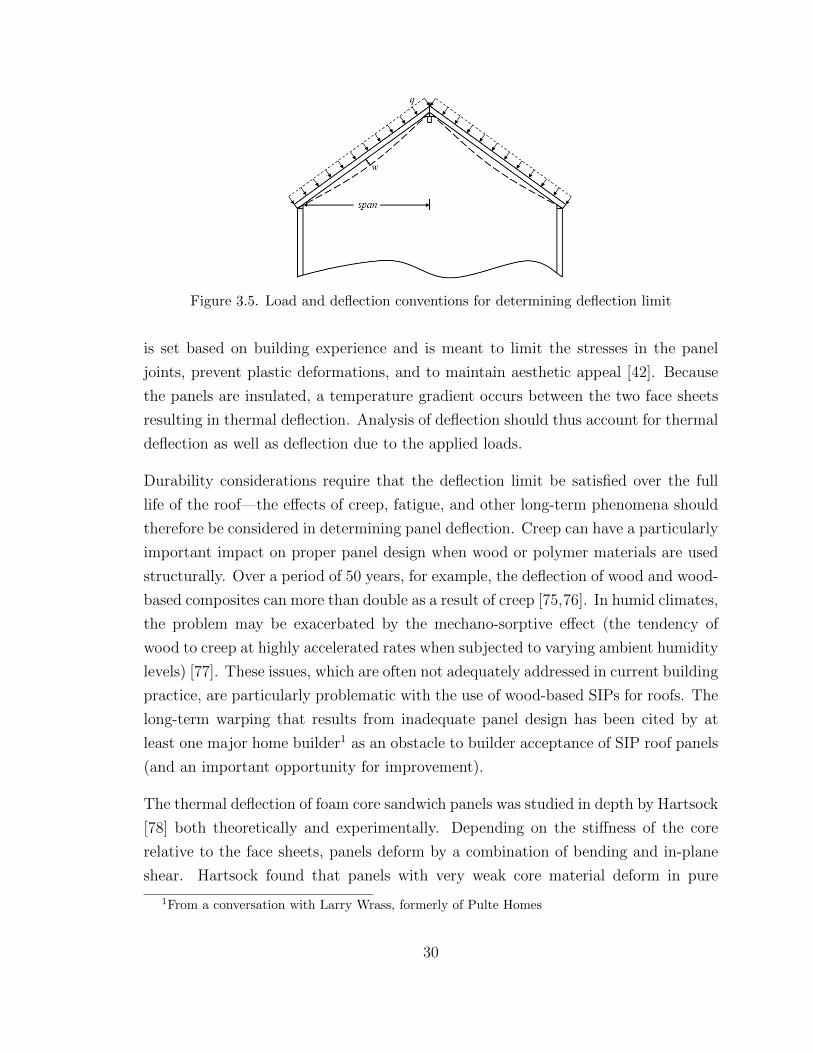
Figure 3.5. Load and deflection conventions for determining deflection limit
is set based on building experience and is meant to limit the stresses in the panel
joints, prevent plastic deformations, and to maintain aesthetic appeal [42]. Because
the panels are insulated, a temperature gradient occurs between the two face sheets
resulting in thermal deflection. Analysis of deflection should thus account for thermal
deflection as well as deflection due to the applied loads.
Durability considerations require that the deflection limit be satisfied over the full
life of the roof—the effects of creep, fatigue, and other long-term phenomena should
therefore be considered in determining panel deflection. Creep can have a particularly
important impact on proper panel design when wood or polymer materials are used
structurally. Over a period of 50 years, for example, the deflection of wood and wood-
based composites can more than double as a result of creep [75,76]. In humid climates,
the problem may be exacerbated by the mechano-sorptive effect (the tendency of
wood to creep at highly accelerated rates when subjected to varying ambient humidity
levels) [77]. These issues, which are often not adequately addressed in current building
practice, are particularly problematic with the use of wood-based SIPs for roofs. The
long-term warping that results from inadequate panel design has been cited by at
least one major home builder1 as an obstacle to builder acceptance of SIP roof panels
(and an important opportunity for improvement).
The thermal deflection of foam core sandwich panels was studied in depth by Hartsock
[78] both theoretically and experimentally. Depending on the stiffness of the core
relative to the face sheets, panels deform by a combination of bending and in-plane
shear. Hartsock found that panels with very weak core material deform in pure
1From a conversation with Larry Wrass, formerly of Pulte Homes
30
shear, panels with strong core material (including most polymer foams) and thin
face sheets deform in bending, and panels with strong core and profiled face sheets
deform by a combination of shear and bending. Shear deformation is not noticeable
to the occupants of the house; excessive thermal bending, however, can increase panel
deflection beyond the allowable limits. The addition of stiffeners (webs) effectively
strengthens the core, so the thermal warp of web core panels is thus most effectively
modeled by pure bending.
A considerable body of literature exists on the deflection models for sandwich pan-
els with various core configurations. In general, depending on the application and
boundary conditions, sandwich panels are modeled as shear-deformable beams or
plates [37], with stiffness coefficients derived from the cross section geometry. Libove
and Batdorf [79] developed the governing equations for shear-deformable orthotropic
plates. The bending and buckling solutions were determined for foam core panels by
Hoff [80] and for generic orthotropic panels by Robinson [81]. For orthotropic pan-
els, the theory requires the determination of five stiffness coefficients: two each for
bending and transverse shear deformations, and one for in-plane twisting. The pan-
els can be modeled as beams if the length is much greater than the width and if the
long edges are not supported. In that case, deflection is modeled using Timoshenko
(shear-deformable) beam theory, which is characterized by two stiffness constants:
one each for bending and shear deformation in the longitudinal direction.
The stiffness coefficients for a variety of panel constructions have been developed,
particularly for panels with prismatic structural cores. Models have been developed
for three types of web core geometry: I-cores [82–84], C- [85, 86], and Z-channels
[87, 88]. The I-core consists of generally thicker straight webs that can be welded
directly to the face sheets. The channel (C- and Z-) sections are used when thin
webs are required; the use of channel sections provides a surface that can be used for
welding or fastening to the face sheets.
Two key results arise from the prior work. First, an accurate model of panel stiffness is
obtained by superimposing the independent face sheet and web stiffnesses. This result
also holds for foam-filled web core panels [89], i.e. the foam acts as a third independent
stiffness contribution. Second, the choice of web section is inconsequential. The only
stiffness component affected by local web geometry is the shear stiffness perpendicular
to the webs. In this direction, the webs interact with the face sheet, causing slightly
31
different stiffness for I-, C-, and Z-sections. This difference is unimportant for panel
design because shear deformation perpendicular to the webs is negligible, especially
in foam-filled panels. The web cross section also has negligible impact on thermal
performance of thin webs [74].
Stiffness modeling of web core panels is most accurate when the web spacing is small
relative to the panel width. When the spacing is relatively large, the stress distri-
bution in the panel changes somewhat due to local deflection in regions of the face
sheets far from the webs. This phenomenon, known as shear lag, results in a stress
concentration in the face sheets near the webs and a decrease in panel stiffness. Win-
ter [90] accounted for the shear lag effect by introducing an effective face sheet width,
the value of which depends on factors such as cross-sectional geometry, length, and
material properties. Following that approach, subsequent research has focused on the
determination of effective width for specific cases.
The most comprehensive investigation of effective width for geometry relevant to
web core panels was performed by Hildebrand and Reissner [91], who used energy
methods to analyze the shear lag in box beams under various loading and boundary
conditions. More recently, Lertsima, et al. [92] used FE analysis to investigate the
effective width of box beams under uniform load. They found effective widths smaller
than those predicted by Hildebrand and Reissner; however, in their analysis the load
is concentrated on the webs rather than distributed over the entire face sheet. This
has the effect of artificially increasing shear lag [91] and is therefore less accurate
than the approach in Reference [91] for panels under uniformly distributed load. The
latter case is the most realistic approximation for the loads on roof panels, so the
analysis from Reference [91] is used in the present work.
3.4 Face Sheet Buckling
The possibility of face sheet buckling is an important consideration to the design of
web core panels because the face sheets bear almost all of the bending stresses. The
face sheet buckling mode for web core panels under distributed load is illustrated in
Figure 3.6. The localization of buckling damage to a region near the midspan is a
result of the quadratic bending moment distribution (see Figure 3.2). The buckling
waves are largest at the midspan, where bending stresses are highest; the buckling
amplitudes decay quickly with distance from the middle.
32
Figure 3.6. Face sheet buckling mode: view of the buckled face sheet, assuming one interme-diate web (dashed line); loading corresponds to the bending moment distribution illustratedin Figure 3.2
The face sheet buckling phenomenon of sandwich structures is bounded by two cases.
Face sheets supported by webs with no core material (e.g. truss core panels) experience
the buckling mode typically associated with plates loaded in compression. To this
case, the standard plate buckling model [93] can be applied. Face sheets supported by
a solid core material with no webs (foam core panels) or webs with very low stiffness
fail in a buckling mode that is characterized by very short wavelengths in the loaded
direction and almost no curvature in the unloaded direction [94]. This buckling mode
is generally referred to as “wrinkling” in the literature and results in ultimate panel
failure with little or no postbuckling strength. In web core panels, the failure mode
is a hybrid of the two cases. The face sheet, as illustrated in Figure 3.6, buckles with
short wavelengths in the direction of loading (due to the influence of the foam) and
at least one half-wave in the other direction (due to the webs) [89].
The face sheet wrinkling strength of foam core panels with no webs has been mod-
eled by several authors (e.g. [95–97]), with all of the models yielding nearly the same
strength predictions. The slight differences between the models result from assump-
tions about the buckling deformation in the core. The models have been considered
from a slightly different angle in this work to develop expressions for the foundation
constants used in the shear buckling model. They are therefore described in more
detail in Chapter 4.
The problem of face sheet buckling in web core panels has only recently received
attention in the literature. The analogous problem of the buckling of highly profiled
face sheets in compression has been solved using an elastic half space model (e.g. [42])
for the core. Solution of this model results in an equation that must be solved numer-
33
ically and is impractical for design. Similarly, Aimmanee and Vinson [98] modeled
the face sheets of web core panels as plates on a one-parameter elastic foundation,
with foundation properties derived from the model by Allen [97] noted above.
Kolsters [89] showed that one-parameter foundation models are insufficient for panels
containing core materials with high shear modulus. Instead, he modeled the core as
a two-parameter (Pasternak) foundation. The foundation constants are derived from
the core material properties based on curve fits to the results of an FE study. Those
results were, in turn, validated experimentally. Using the empirically determined
values for the foundation constants, Kolsters found the Pasternak foundation model
to be an accurate approach to the prediction of face sheet buckling strength. The
results are directly applicable to web core roof panels, so the model by Kolsters [89]
is used for face sheet buckling in the present work.
3.5 Web Shear Buckling
Shear buckling of the webs is an important concern in the design of web core panels
because the webs carry almost all of the internal shearing forces in the panel. In
panels under distributed load, the shearing forces vary linearly along the panel length
(Figure 3.2), so shear buckling occurs in a region close to the panel supports, as
shown in Figure 3.7. The buckling pattern occurs at an angle of about 45◦ to the
horizontal (the principle stress direction for a material in pure shear) because the
bending stresses in the web are small due to the face sheets.
The analysis of shear buckling depends on several factors, including the non-uniform
stress distribution in the webs, interaction effects with the face sheets, and the con-
tribution of the core material. The latter effect is particularly important due to
the wide web spacing. The effect of core material properties on the local buckling
Figure 3.7. Web shear buckling mode: view of a buckled web; loading corresponds to theshear force distribution illustrated in Figure 3.2
strength of sandwich panels has received little attention in the literature, especially
for deep foundations (as in the case of shear buckling in widely spaced webs) with
high shear stiffness. Kolsters [89] demonstrated that the shear stiffness of the core
contributes substantially to face sheet buckling strength in such cases and provided
empirical foundation constants for moderately deep foundations. He also showed that
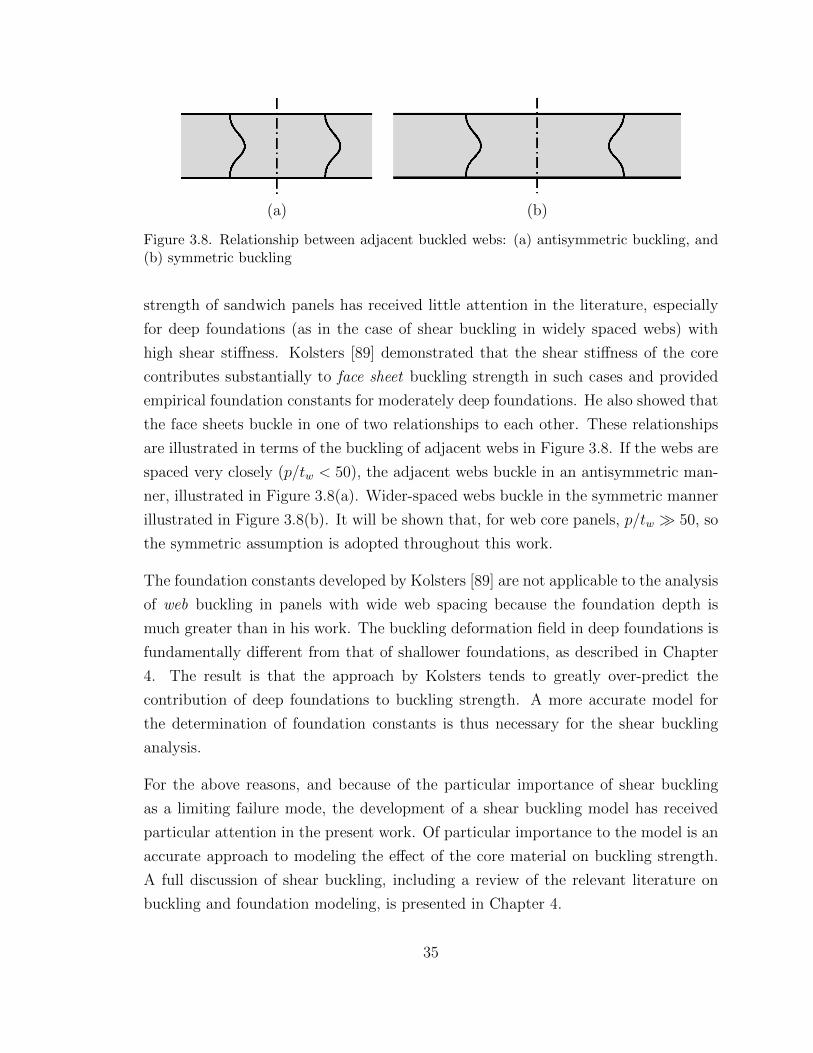
the face sheets buckle in one of two relationships to each other. These relationships
are illustrated in terms of the buckling of adjacent webs in Figure 3.8. If the webs are
spaced very closely (p/tw < 50), the adjacent webs buckle in an antisymmetric man-
ner, illustrated in Figure 3.8(a). Wider-spaced webs buckle in the symmetric manner
illustrated in Figure 3.8(b). It will be shown that, for web core panels, p/tw � 50, so
the symmetric assumption is adopted throughout this work.
The foundation constants developed by Kolsters [89] are not applicable to the analysis
of web buckling in panels with wide web spacing because the foundation depth is
much greater than in his work. The buckling deformation field in deep foundations is
fundamentally different from that of shallower foundations, as described in Chapter
4. The result is that the approach by Kolsters tends to greatly over-predict the
contribution of deep foundations to buckling strength. A more accurate model for
the determination of foundation constants is thus necessary for the shear buckling
analysis.
For the above reasons, and because of the particular importance of shear buckling
as a limiting failure mode, the development of a shear buckling model has received
particular attention in the present work. Of particular importance to the model is an
accurate approach to modeling the effect of the core material on buckling strength.
A full discussion of shear buckling, including a review of the relevant literature on
buckling and foundation modeling, is presented in Chapter 4.
35
3.6 Bearing Stress Failure
Local failure of the webs and core can occur at the support locations, where the panel
is subjected to concentrated loads. In foam-filled panels, the failure mode consists of
a combination of local foam crushing and inelastic web failure (web crippling). The
web crippling mechanism, illustrated in Figure 3.9, is the formation of yield lines
meeting at a plastic hinge in the face sheet at a distance from the support location.
The webs lose load bearing capacity following failure.
Bearing failure can be prevented by two methods:
• Choose core material and web geometry to withstand bearing forces everywhere
• Stiffen the bearing region of the panel, e.g. through the use of wood or dense
foam blocking
The second approach is useful when the thermal requirement or other considerations
make it impractical to design panels with webs thick enough to resist bearing failure.
An obvious drawback of that approach is the need for additional materials and manu-
facturing steps to attach the blocking. It may be justified, however, if the blocking is
also used to meet other non-structural needs (e.g. aesthetics, moisture sealing, etc.).
A model for choosing web geometry to resist bearing failure is presented in this work.
Web crippling strength depends on several factors, including sensitivity to material
and load imperfections, residual stresses, support location (i.e. distance from the edge
of the panel), and stress concentrations at the support [99]. A few models developed
in the literature have attempted to account for these factors. The most successful,
applicable to webs with no foam support, was developed by Roberts and Newark [100]
based on the assumed failure mechanism illustrated in Figure 3.9. Slightly different
models are used for bearings located near the end of the panel or in the interior.
Romanoff [101] adapted the model in Reference [100] to predict the bearing strength
of foam-filled panels loaded in the interior region by a circular indenter.
The models in References [100, 101] are adapted in the present work to predict the
bearing strength of foam-filled web core panels supported at the ends by rectangular
bearings. The resulting model is presented in Chapter 5. Analytical bearing strength
models have some drawbacks in practice. They are based on assumed failure mecha-
nisms and typically work for a limited range of web designs (e.g. slender webs). They
also tend to overpredict bearing strength due to the influence of factors mentioned
36
Figure 3.9. Bearing failure mode (adapted from Reference [100]): view of the failure mech-anism in the web; the maximum shearing force (see Figure 3.2) is distributed over the panelsupport width c
above. As a result, they are not widely used in current design practice. Instead,
prescriptive design codes for thin-walled structures [102] use empirical equations cal-
ibrated to match the test data for specific web geometry and loading conditions.
The empirical equations are typically calibrated over a wide range of web geometry
and therefore not as limited in applicability as the mechanism solutions. Due to
the prevalence of the empirical equations, new web crippling test data (e.g. [103]) are
typically curve fit to the same form. Thus, in this work a semi-empirical model is also
developed based in part on the prescriptive code equations. That model is presented
in Chapter 5 and compared to the analytical model for panels with thin webs.
3.7 Core Shear Stress Failure
An important failure mode for foam core panels is stress failure of the core material.
In web core panels, the webs take up the shear stresses, so core failure is normally not
a concern. If the web fails (e.g. due to shear buckling), however, the shear stresses
transfer to the core. In this case, the strength of the core material can be used to
predict the existence of residual load-carrying capacity following web failure. The
shear stress distribution in foam core panels with no webs is determined by first
principles and is available in Reference [37], for example. In the present work, no
contribution from the webs is assumed, so the analysis for foam core panels is used.
Panels are designed to have adequate core shear strength independent of the webs.
37
Figure 3.10. Flexural web buckling mode: view of a buckled web; loading corresponds tothe bending moment distribution illustrated in Figure 3.2
3.8 Web Flexural Buckling
The in-plane bending stresses on the web can cause the buckling mode illustrated in
Figure 3.10 [93]. Buckling occurs in the compressed portion of the web and, as with
face sheet buckling, is localized near the midspan, where bending stresses are highest.
The analysis of flexural buckling must consider the effects of the core material, non-
uniform stress distribution in the longitudinal panel direction, and variable location of
the neutral bending axis2. The webs may be widely spaced, so the elastic foundation
considerations used in the shear buckling analysis are applicable to flexural buckling.
Timoshenko [93] provided a solution for the buckling strength of plates under pure
in-plane bending with arbitrary neutral axis location. Curve fits to the solutions
were later developed as a function of neutral axis location. These curve fits have been
codified into prescriptive design codes (e.g. [102]) applicable to beams with no foam
support. The curve fits are a slight simplification in that they assume the plate is
infinitely long, but they do account for the neutral axis location.
In web core panels with unbuckled face sheets, the contribution of the webs to the
panel bending stiffness is small (less than 10% of the total). As a result, the bending
stresses on the webs are also small, and flexural buckling is unlikely to limit any web
core designs. To confirm this, a flexural buckling model was developed in this work,
treating the webs as plates on a Pasternak foundation. The details of the analysis
are given in Appendix B. Interaction between shear and flexural buckling modes of
the web has not been considered in the present work because the stresses that cause
the two modes are localized to very different parts of the web.
2For symmetric panels with unbuckled face sheets, the neutral axis is at the midplane of the web;in general, however, the location can vary.
38
Figure 3.11. Vertical buckling of the face sheet into the webs: view of the web and face sheets(thickness exaggerated to illustrate failure); loading corresponds to the bending momentdistribution illustrated in Figure 3.2
3.9 Buckling of the Face Sheet into the Webs
The face sheets provide panel stiffness by virtue of their distance from the neutral
bending axis. In their own plane, however, the thin, flat sheets provide very little
bending resistance. As the panel deforms under load, therefore, the webs play a key
role in maintaining the distance between the face sheets and in protecting the face
sheets from local failure. If the webs are too slender, they may be unable to resist the
reaction forces imposed by the face sheet, resulting in the buckling failure illustrated
in Figure 3.11. Adapting the terminology used in the literature, this failure mode is
referred to as vertical face sheet buckling or buckling of the face sheet into the webs.
It occurs when the web buckles locally beneath the face sheet, allowing unrestricted
deformation of the latter and resulting in panel collapse.
The typical approach to predicting this type of failure (in plate girders and other
structures with no foam support) is described by Salmon and Johnson [104]. A small
element of the web is modeled by a column, with representative loads determined
based on a force balance for the deformed face sheet. Using this model, it is possible
to determine a web slenderness tw/p for which buckling failure coincides with yielding
of the face sheets. If the slenderness is smaller than this limit, vertical buckling of the
face sheet does not occur because the panel strength is limited by face sheet yielding.
In prescriptive steel design codes (e.g. [102]), the latter approach is used, and the web
slenderness limit is defined as a function of face sheet yield strength.
In foam-filled web core panels, the core contributes to the strength by bearing some
of the load that would otherwise occur on the webs and by strengthening the webs
directly. The first contribution may be very important with the use of relatively
39
stiff core materials; to be conservative, however, it is neglected in the present work.
The latter contribution is treated through a modification of the approach given in
Reference [104]. The details of the model, including a description of how the applied
forces translate into in-plane compression on the webs, are provided in Appendix
B. Analogous to the approach used in prescriptive design codes, a slenderness limit
applicable to foam-filled panels is developed. Using this approach, it was determined
that the face sheet yielding requirement is easily satisfied for practical panel designs.
Vertical buckling of the face sheets is not a limiting factor in design.
3.10 Summary
The failure modes relevant to the design of web core roof panels were reviewed in
this chapter. It is worth pointing out that almost all of the structural failure modes
result from the use of thin face sheets and webs. In particular, the need for thin
webs to meet the thermal insulating requirement is unique to roof panels. Web core
applications without thermal requirements (e.g. ship structures [89]) use thick (≈3–4
mm) webs for which local failure modes are generally not a concern. In this work it
will be shown that the contribution of the foam to local buckling strength is a critical
aspect of roof panel design with thin webs.
Models for thermal performance, face sheet buckling strength, and core shear strength
are available in the literature and are directly applicable to web core panel design.
In addition, the deflection model used in this work is developed as a combination of
first principles and existing models in the literature (for thermal deflection, stiffness,
and shear lag effects). Models for the other failure modes of foam-filled panels are
not available in the literature and are developed in this work. From these models is is
shown that two failure modes—flexural web buckling and buckling of the face sheet
into the webs—do not influence the design of web core panels because other failure
modes are more limiting.
40
Chapter 4
Shear Buckling in Foam-Filled
Web Core Panels
Web core panels, foam filled sandwich panels with interior webs, are a structurally
efficient option for transverse load bearing applications1. In web core panels, the
interaction between the webs and core material can have a substantial impact on
web shear buckling strength and is a key element of lightweight structural design.
The present work is an investigation of web buckling behavior in web core panels
under a distributed load. To solve this problem, web shear buckling was analyzed
for the case of pure shear loading with foam support, and this analytic model was
extended to the case of panels with a transverse distributed load. The webs are
modeled as simply supported plates resting on a Pasternak elastic foundation. To
that end, a buckling model for plates on a Pasternak foundation is presented, along
with closed-form approximations of the solution for square and infinitely long plates.
An accurate model for the foundation constants is developed using energy methods.
Applicability of the plate buckling model to web core panels with transverse loads
is presented via a finite element study. In panels, the slenderness and spacing of
the webs have a slight effect on the boundary conditions between the webs and face
sheets. The effect is relatively small, however, and the model presented in this work
underpredicts buckling strength by less than 25%. The model in this work is thus a
reasonable approach to the practical design of web core panels.
1This chapter is reprinted from Reference [28], with permission from Elsevier.
41
4.1 Introduction
Sandwich construction is known to be an effective approach to the design of light-
weight structures. Foam core sandwich panels, comprised of two face sheets separated
by a polymer foam core, are extensively used in the building industry [8, 24, 42] to
satisfy both structural and insulation requirements. However, these designs are not
well suited for long term transverse loads due to creep of the foam core material.
Sandwich panels (such as truss core panels [26]) that include interior webs for shear
support are well suited for transverse loads, but the webs create a thermal short
between the face sheets. The web core panel described in the present study is a
sandwich panel that combines the shear stiffness of webs with the thermal performance
of polymer foam.
In this concept, the core consists of stiffening metal webs, with foam filling the gaps
between them (Figure 4.1). Web core panels have been investigated for shipbuilding
applications [89,98] and, more recently, for use in energy efficient residential roofs [29].
The requirements for the latter application include thermal insulating performance,
which leads to the use of thin, widely-spaced webs to avoid large conductive thermal
losses across the panel. The thin metal webs are susceptible to shear buckling; thus,
an understanding of the effect of the core material on shear buckling strength is
critical for developing designs that meet all of the requirements efficiently. In the
present work, the shear buckling behavior of foam-filled web core panels is modeled
by treating the webs as plates on a Pasternak elastic foundation. The relevant material
properties of the core are incorporated into the foundation constants.
The shear buckling behavior of isotropic plates with no elastic foundation is well
understood. Southwell and Skan [105] obtained direct solutions for the strength of
infinitely long plates loaded in pure shear. Stein and Neff [106] used energy methods
to develop solutions for simply supported plates of finite length. Solutions have also
been developed for plates with clamped [107] or mixed [108] boundary conditions, as
well as for orthotropic plates [109]. The only studies to date that have considered the
effect of an elastic foundation are by Davies and Fragos [110, 111], who investigated
the buckling of open C-channel sections (“cassettes”) filled with foam and loaded in
pure shear. They used a combination of physical testing and finite element modeling
to develop an empirical design equation for clamped plate sections attached to foam.
The open sections allow the foam to deflect under the action of plate buckling. In
42
Figure 4.1. Web core panel concept geometry and coordinate system
web core panels, the foam is restricted against bending and is therefore compressed
by the buckled plate. As a result, the empirical results are not generally applicable
to web core design, and an analytical model that incorporates the compression effects
is needed.
An important part of modeling webs as plates on an elastic foundation is the de-
termination of foundation constants based on the physical properties of foundation
materials. Some approaches to modeling the foundation behavior are suggested based
on work that appears in the literature. Early models [112, 113] were obtained using
the elasticity solution for a plate resting on a finite solid medium that is fixed to a
rigid base. These models assume that displacement caused by the buckled plate prop-
agates through the full depth of the medium. Foundation constants can be deduced
from the results by solving for the governing equations at the plate surface. More
recently, Sironic, et al. [114] used Airy’s stress functions to solve for the displacement
field within the foundation layer. They found that the model in References [112,113]
is inaccurate for deep foundations because the buckling displacement decays within
less than the full foundation depth.
Alternative foundation models are suggested based on the work of Hoff and Mautner
[95] and of Plantema [96], who assumed that the plate buckling displacement would
not extend through the whole depth of the foam. Comparison between these models
43
(a) (b) (c)
Figure 4.2. Buckling displacement models based on (a) elasticity solution (References [112,113]), (b) linear decay (Reference [95]), and (c) exponential decay (Reference [96])
and the earlier models is illustrated in Figure 4.2. The decay of buckling displacement
as predicted by the model in References [112,113] is shown in Figure 4.2(a). The decay
assumed by References [95] and [96] are shown in Figures 4.2(b) and (c) respectively.
Hoff and Mautner [95] assumed the displacement would decay linearly to zero at
a finite depth, determined along with the critical buckling load using the principle
of minimum potential energy. Plantema [96] assumed an exponential decay model.
As shown in Figure 4.2(c), the characteristic length of the displacement decay is
assumed to be much less than the depth of the foundation. Both of these models were
used to predict the wrinkling strength of foam core sandwich panels in compression
directly, i.e. without recourse to an elastic foundation model. It is demonstrated
in the present work that a model similar to the one by Plantema [96] can be used
to determine foundation constants for other local buckling modes by analogy to the
buckling solution for beams on elastic foundation.
Application of plate buckling models to the design of web core panels requires con-
sideration of the effects of panel geometry and load distribution on buckling strength.
Geometry affects the boundary conditions on the web, particularly due to the con-
nection with the face sheets. Wiernicki [115] investigated this effect for panels with
a core consisting of corrugated light-gage metal. He found that the face sheets add
rotational resistance to the webs depending on the ratio of web thickness to face sheet
thickness, as well as the ratio of panel depth to web spacing. From the results of his
study, it can be inferred that the boundary conditions on the web will be somewhat
stronger than simply supported, but weaker than clamped.
In panels subjected to uniformly distributed loading, the in-plane shearing forces
vary along the length of the panel. As a result, the stress distribution is not uniform
throughout the web. Several studies [116–121] have focused on the effects of non-
uniform stress distributions on plate buckling strength. Libove, et al. [116] and Zaras,
44
et al. [117] used the Rayleigh-Ritz method to determine the buckling strength of a
plate under uniaxial compression that varies linearly along the length. Both studies
found that the variation in load causes an increase in buckling strength if calculated
based on the edge loads. The increase in strength depends on aspect ratio and
is greatest for square plates. The load distribution has no effect on the strength
of infinitely long plates. Similar results have been found for plates under linearly
varying compression balanced by body forces [118] and under parabolic variation
of axial loads [119]. Two recent studies [120, 121] confirmed the phenomenon with
regard to the local and distortional buckling strength of cold-formed channel sections.
The studies focused on short beams, but in both cases the effect of load distribution
diminished with increasing length.
The present paper investigates the shear buckling behavior of web core panels under
distributed transverse loading. The analysis is performed in two parts. First, a model
is developed for the buckling strength of simply supported plates on an elastic foun-
dation, loaded in pure shear. The model includes an approach to the determination
of the necessary foundation constants based on the core material properties. Second,
application of the plate buckling model to the design of web core panels subjected to
transverse load is presented. The impact of aspect ratio and panel geometry on the
accuracy of the model is examined. The former effect is shown to be negligible, and
the latter effect is quantified over a range of panel geometries.
4.2 Plate Buckling Model
Consider a thin, isotropic plate of length a and width b, as shown in Figure 4.3, and
thickness t. Assume the plate has elastic modulus E and Poisson’s ratio ν. The
plate is simply supported on all four sides and resting on a Pasternak foundation. In
the Pasternak foundation model, the restoring force q acting on the plate due to the
out-of-plane deflection w is given by [122]
q = KWw −KP∇2w, (4.1)
where KW and KP are foundation stiffness constants. The first term is the resistance
of the foundation material to normal deformations, and the second term is the resis-
tance to shear deformations. If the plate is loaded by a uniform shear stress τ , then
45
Figure 4.3. Simply supported plate and elastic foundation model
the buckling behavior is modeled using the von Karman equation
D∇4w = −(KWw −KP∇2w
)+ 2τtw,xy, (4.2)
with the plate stiffness D given by
D =Et3
12 (1− ν2). (4.3)
The subscripted comma in Equation (4.2) represents partial differentiation with re-
spect to the subscripted variables.
The critical buckling stress τ for plates is given by [93]
τ = χπ2D
b2t, (4.4)
with buckling coefficient χ determined by the loads and boundary conditions acting
on the plate. The approach used in the present work to determine χ is a Ritz solution
based on the principle of minimum potential energy. According to this principle, the
variation in strain energy δU of the deformed plate must be balanced by the variation
in work δV caused by external loading, i.e.
δU − δV = 0. (4.5)
To solve Equation (4.5), it is necessary to assume a kinematically admissible function
for the displacement field w. For simply supported rectangular plates, a suitable
46
function is the double sine series
w =∞∑m=1
∞∑n=1
Amn sinmπx
asin
nπy
b. (4.6)
The strain energy U of the buckled plate is given by
U =1
2
∫ b
0
∫ a
0
D{
(w,xx + w,yy)2 − 2(1− ν)
[w,xxw,yy − w2
,xy
]}dxdy. (4.7)
The terms in square brackets cancel, leaving
U =1
2
∫ b
0
∫ a
0
D (w,xx + w,yy)2 dxdy
=Dabπ4
8
∞∑m=1
∞∑n=1
A2mn
(m2
a2+n2
b2
)2
. (4.8)
The work done on the plate is
V =1
2
∫ b
0
∫ a
0
[τtw,xw,y −KWw
2 −KP
(w2,x + w2
,y
)]dxdy. (4.9)
The three terms in the integrand of Equation (4.9) are contributions to work from the
applied stress τ and the restoring forces (normal and shear) from the foundation. The
work from the foundation is negative because it opposes plate deflection. Evaluation
of the integral in Equation (4.9) yields
V = 4τt∞∑m
∞∑n
∞∑p
∞∑q
AmnApqmnpq
(m2 − p2) (n2 − q2)
−KWab
8
∞∑m=1
∞∑n=1
A2mn
−KPπ2ab
8
(∞∑m=1
∞∑n=1
(ma
)2A2mn +
∞∑m=1
∞∑n=1
(nb
)2A2mn
). (4.10)
In the first series on the right hand side of Equation (4.10), summation is taken only
over those values of the subscripts such that m± p and n± q are both odd numbers.
47
The variations δU and δV are found by taking the derivative with respect to each Amn
coefficient. Substitution of Equations (4.4), (4.8) and (4.10) into the minimum po-
tential energy expression (4.5) yields a set of equations (one for each Amn coefficient)
of the form[ (m2 + n2β2
)2+ fWβ
4 + fPβ2(m2 + n2β2
) ]Amn
+32χβ3
π2
∞∑p
∞∑q
AmnApqmnpq
(m2 − p2) (n2 − q2)= 0, (4.11)
where β = a/b is the aspect ratio of the plate, and fW and fP are non-dimensional
foundation parameters given by
fW =b4KW
π4D, fP =
b2KP
π2D. (4.12)
These parameters represent the ratio of the foundation stiffness (normal and shear,
respectively) to the bending stiffness of the plate. The linear system of equations
(4.11) is positive definite in stable equilibrium. The critical buckling load is found by
solving for the minimum value of χ to make the system indefinite. The corresponding
eigenvector can be substituted into Equation (4.6) to obtain the buckling mode shape.
An approximation to the buckling coefficient is made by solving a subset of the
Equations (4.11) as described above. The number of terms required to achieve a
given accuracy in the result depends on the values of β, fW , and fP . For β ≤ 3
and fW = fP = 0, χ is determined to within ±0.01 using only the terms up to
m = n = 5 [106]; as β, fW , or fP increases, however, more terms are required to
obtain the same level of accuracy. In the present work, buckling coefficients have been
calculated (for fW and fP ranging from 0–300) using the terms up to m = n = 40.
Upper and lower bounds of the buckling coefficient were obtained by investigating
two cases: β = 1 (square plates), and β ≥ 4. The results have been curve fit to a
function of the same form as the solution for plates in uniaxial compression [123]. For
square plates (β = 1), the resulting expression is
χ1 = 2.028√
0.618 + fW + 1.565fP + fP + 7.673. (4.13)
48
For β ≥ 4, the solution was evaluated over the range 4 ≤ β ≤ 10. The buckling
coefficient for β ≥ 4 converges rapidly; for example, the solution for β = 6 is indistin-
guishable from the solution for β = 10. It can be concluded that the buckling solution
for β ≥ 4 is an approximation to that of infinitely long plates. An expression for the
buckling coefficient of long plates (β ≥ 4) was therefore developed using β = 6 and
is given by
χ∞ = 2.006√
0.690 + fW + 1.020fP + fP + 3.749. (4.14)
The expressions fit the calculated values of χ to within ±0.1 throughout the indicated
range. Given that χ ranges from 5.48 (long plate with no foundation) to 364 (square
plate with fW = fP = 300), this accuracy is acceptable for most purposes.
Comparison of Equations (4.13) and (4.14) provides insight into the influence of aspect
ratio β on shear buckling strength. In relative terms, β has the largest impact on the
strength of plates with no foundation, in which case square plates are 70% stronger
than long plates. The difference in strength becomes much less significant as the
foundation stiffness increases. For example, square plates are only about 3% stronger
than long plates with fW = fP = 300. The influence of aspect ratio is thus small in
plates resting on stiff foundations.
A plot of the buckling mode shape is shown in Figure 4.4 for panels with β = 1 and
β = 4 and four combinations of fW and fP (fw = 0, 300; fp = 0, 20)2. The foundation
parameters are selected to illustrate the relative importance of the normal and shear
components of foundation stiffness. For the foundation parameters considered, the
buckling coefficient ranges from 5.62 (no foundation, β = 4) to 64.4 (fw = 0, 300; fp =
0, 20; β = 1). As foundation stiffness increases, the buckling wavelength decreases
because, referring to Equation (4.10), the work required to deform stiff foundations
increases as the buckling wavelength a/m decreases. Comparison of the calculated
buckling coefficient χ for the cases with fP = 0 and fP = 20 (fW = 300) demonstrates
the importance of the shear terms: even for fW/fP = 15, the shear stiffness of the
foundation accounts for approximately 35% of the total buckling strength.
2As will be shown in a subsequent section, fW = 300 and fP = 20 are representative of slenderwebs on a polymer foam foundation.
49
Figure 4.4. Buckling mode shapes with varying elastic foundation stiffness (β = 1 andβ = 4)
4.3 Evaluation of Foundation Constants KW and KP
In order to apply the buckling model presented in the previous section to panel
design, the foundation stiffness constants (KW and KP ) as functions of core material
properties must be determined. In this section KW and KP are developed for a plate
resting on a solid medium following an analogy to a beam buckling model. The model
is validated by a finite element study. The impact of the core properties on plate shear
buckling is also demonstrated.
4.3.1 Foundation Stiffness Model
Consider a beam resting on a deep solid medium, subjected to a compressive force
Q with a sinusoidal deformation pattern with amplitude α and half-wavelength L, as
illustrated in Figure 4.5. This deformation pattern is transferred to the top surface
of the foundation. If the bottom surface of the foundation is fixed at z = H, the
displacement in the foundation decays with distance from the beam according to a
function of the form [114]
w = [A cosh (πz/L) +B sinh (πz/L)]W, (4.15)
50
Figure 4.5. Model used for the determination of foundation stiffness constants
where W = sin(πx/L) is the deflection of the beam. The constants A and B are
functions of the foundation depth H. If πH/L is much less than 5, the decay is
essentially linear. If πH/L ≥ 5, the decay is nearly exponential, and the deformation
field in the foundation can be modeled as
w = αe−kz sinπx
L. (4.16)
The model in this work assumes πH/L ≥ 5 (equivalently Hk � 1, to assure that
w|z=H ≈ 0), with the corresponding deflection field given by Equation (4.16). The
range of validity for this assumption is addressed in the next section.
Following the technique of Reference [96], the foundation constants are determined
by applying the principle of minimum potential energy. Assume no deformation
in the plane of the beam, and consider the displacement in the region beneath a
buckled half-wave. Three contributions to strain energy are present: energy Uε due
to normal strain in the foundation, energy Uγ due to shear strain, and energy Uf due
to deformation of the beam. Assuming the foundation depth H is much greater than
the characteristic length 1/k as noted above, the calculations are simplified without
loss of accuracy by integrating to infinity in the energy expressions that follow. Noting
that ε = w,z and γ = w,x, the three strain energy components are given by
Uε =Ec2
∫ L
0
∫ ∞0
w2,z dzdx =
α2
8kLEc, (4.17)
Uγ =Gc
2
∫ L
0
∫ ∞0
w2,x dzdx =
α2
8
π2
kLGc, (4.18)
51
Uf =E
2
t3w12
∫ L
0
w2,xx
∣∣∣z=0
dx =α2
8
π4
6L3Etw. (4.19)
In the preceding equations, Ec and Gc are the elastic and shear moduli of the core
material. The work W done by the applied force Q is
W =Q
2
∫ L
0
w2,x
∣∣∣z=0
dx =α2
4
π2
LQ. (4.20)
Setting W = Uε + Uγ + Uf and solving for Q yields
Q =π2Et3
12L2+ Ec
k
2
L2
π2+Gc
2k. (4.21)
The general buckling solution for a beam on a Pasternak foundation (i.e. restoring
force q = KWw−KPw,xx [122]) can be determined using minimum potential energy,
analogous to the approach used in Section 4.2. If the beam buckles with one half-
wavelength, the critical load Q is
Q =π2Et3
12L2+KW
L2
π2+KP . (4.22)
Through comparison of Equations (4.21) and (4.22), the foundation constants are
defined as
KW = Eck
2, KP =
Gc
2k. (4.23)
The value of k is determined from the minimum potential energy solution by solving
Q,k = 0, Q,L = 0, (4.24)
yielding
kt = 3
√6G2
c
EcE. (4.25)
Equation (4.25) implies that, as the shear stiffness of the foundation increases relative
to the plate stiffness, the depth affected by buckling decreases. The foundation pa-
rameters can be expressed in terms of the web and core material properties and web
52
slenderness ratio by substituting Equations (4.23) and (4.25) into Equation (4.12):
fW =12 (1− ν2) 3
√6
2π4
(b
t
)43
√G2cE
2c
E4, (4.26)
fP =12 (1− ν2)
2π2 3√
6
(b
t
)23
√GcEcE2
. (4.27)
These equations show that the foundation parameters increase with core modulus and
web slenderness ratio, i.e. with increasing stiffness of the core relative to the plate.
4.3.2 Model Validation
To validate the foundation model described in this section, a finite element study
of a plate resting on a solid foundation and loaded in pure shear is presented. The
finite element model, illustrated in Figure 4.6, consists of a rectangular plate with
aspect ratio β and thickness t, resting on a foundation of solid material with depth
H. The plate and foundation displacement are evaluated with a commercial finite
element code (ANSYS). The plate is modeled using SHELL281 elements, and the
foundation is modeled using SOLID186 elements. Both element types use quadratic
shape functions, which achieve better convergence than linear elements for the type of
loading considered. The plate is simply supported on all four edges and loaded with
a shear stress τ , distributed uniformly along the edges using SURF153 elements. The
foundation is fixed at z = H such that ux = uy = uz = 0. To prevent ill conditioning
of the global stiffness matrix, a very small compressive stress (of magnitude τ/10, 000)
is applied to the edges at x = 0 and x = a. The results described in this section
were obtained using β = 1.5; the results are independent of β, however, and can be
generalized to other aspect ratios.
A plot of the displacement field in the foundation is shown in Figure 4.7 for two
cases: Hk = 4.5 and Hk = 0.85. The normalized displacement w/W (where W =
α sin(πx/L) as shown in Figure 4.5) is plotted as a function of the normalized depth
z/H. The displacements predicted by Equation (4.16) are provided for comparison.
For the case where Hk = 4.5, the displacement matches the prediction very closely.
At the fixed surface z/H = 1.0, for example, both the model prediction and the
finite element results show that w/W decays exponentially to zero. For the case
where Hk = 0.85, the finite element results show that w/W decays linearly to zero
53
at z/H = 1.0 while the model predict an exponential decay with w/W = 0.42 at
z/H = 1.0. This result is as expected given that the model is formulated under the
assumption that Hk � 1, and it leads to erroneous predictions of buckling strength
as described below.
To further demonstrate the limitations of the exponential decay approximation, finite
element evaluation of the buckling coefficient χ was obtained for Hk ranging from
0.5 to 8 and compared to the predicted buckling coefficient χβ (Equations (4.11) and
(4.12) for β = 1.5) using the foundation constants in Equation (4.23). Figure 4.8
shows χ/χβ as a function of Hk. The results shown in Figure 4.8 are independent
of geometry and material properties. For 0 ≤ Hk ≤ 2, the exponential decay ap-
proximation for core displacement significantly overestimates the displacement in the
core. Thus the model under predicts the buckling load (χ/χβ > 1). For Hk > 2,
the model slightly over predicts the buckling load (χ/χβ ≈ 0.95): the assumed ex-
ponential displacement is comparable to the finite element results. The difference
(when Hk > 2) can be accommodated by including a safety factor, as is customary
in buckling calculations, when evaluating χβ.
In summary, the present shear buckling model is recommended for use in foundations
for which Hk ≥ 2. It can be noted that Hk < 2 corresponds to very shallow foun-
dations for most materials. The efficient use of material in web core panels dictates
web spacing much wider than that required to meet the Hk ≥ 2 requirement, so the
present model is suitable for panel design.
Figure 4.6. Plate model used for FE validation of the expressions for determining foundationconstants
54
Figure 4.7. Plot of the normalized deflection w/W in the foundation vs. normalized distancez/H from the plate surface; FE results are compared to the present model for Hk = 0.85and 4.5
Figure 4.8. Plot of error in the present foundation model vs. the non-dimensional foundationdepth Hk based on the foundation constants in Equation (4.23)
55
Figure 4.9. Plot of buckling coefficient χ∞ vs. fW for fW /fP = 2, 5, 10, and 15
4.3.3 Impact of Core Properties on Shear Buckling
Equations (4.26) and (4.27) illustrate the effect of core properties on the foundation
parameters. As the foundation parameters increase, the shear buckling load increases.
In this section, shear buckling load as a function of the foundation parameters for
typical materials and web geometries is discussed. The buckling coefficient χ∞ for long
plates is plotted in Figure 4.9 for fW ranging from 0 to 300, assuming various fixed
values of the ratio fW/fP . The range of 2–15 for fW/fP shown in the figure represents
the range likely to be found in practice: for moderately thick plates (e.g. b/t ≈ 200)
on an isotropic foundation fW/fP ≈ 2; for very slender plates (e.g. b/t ≈ 500) on
a foundation with high shear stiffness fW/fP ≈ 15. For a constant fW/fP and
fW > 30, χ∞ increases linearly with fW . Over the range of fW/fP considered, the
buckling coefficient is inversely proportional to fW/fP : at fW = 300, χ∞ ranges from
196 at fW/fP = 2 to 59.7 at fW/fP = 15. This behavior can be attributed to the
effect of foundation shear stiffness. Referring to Equations (4.13) and (4.14), it can be
seen that the fP term begins to dominate the expressions for χ as foam shear stiffness
increases. As a result, the shear contribution is important, even in moderately stiff
foundations.
56
4.4 Application to Panels
Application of the plate buckling model developed in this work to the analysis of web
core sandwich panels is now presented. The panel geometry and coordinate system
are illustrated in Figure 4.1. Note that, in this case, the aspect ratio of the web is
β = a/hc, the slenderness ratio is b/t = hc/t and the foundation depth is H = p/2.
The panel is simply supported and subjected to a uniform distributed load q. As noted
in the introduction, the buckling problem for panels must consider the non-uniform
stress distribution in the webs and the interaction with the face sheets. In particular,
the face sheets provide rotational resistance to the webs that depends on material
properties, web spacing and geometry, and face sheet thickness [115]. Assuming the
face sheet thickness is of the same order as the web thickness, the support condition
will be close to simply supported. The latter assumption is reasonable for all-steel
panels, and in the present work the face sheets and webs have the same thickness t.
In panels with relatively weak core material (Ec � E), the bending stresses are borne
primarily by the face sheets, and the shear stresses are borne by the webs. As a result,
for a panel under distributed load q, the shear stress in the webs is nearly constant
through the depth of the panel. The shear stress at the support locations is
τ =qpa
2thc. (4.28)
As a conservative approximation, assume the stress τ in Equation (4.28) acts uni-
formly over the length of the web. Then the transverse load q to cause shear buckling
is found from Equations (4.4) and (4.28) to be
q = χ∞2π2D
pahc, (4.29)
with χ∞ determined using Equation (4.14). Because both faces of the webs are bonded
to foam, the foundation stiffness is twice as great as in the preceding examples, i.e. KW
and KP in Equation (4.23) are both multiplied by 2.
The buckling strength predicted by Equation (4.29) is based on the maximum shear
stress in the web (i.e. at the supports). The adequacy of this approach can be
predicted by analogy to the solution given in Reference [116] for plates under lin-
early varying compressive loads. In very short panels (a/hc < 4), the approach will
57
Figure 4.10. Finite element model used for the analysis of panels under distributed load(core elements not displayed for clarity)
slightly underestimate buckling strength. Most structural panels will be relatively
long (a/hc ≥ 4), in which case the web behaves essentially as an infinitely long plate.
Thus, it will be shown that the load distribution has negligible effect on the buckling
strength in practice.
To evaluate the adequacy of Equation (4.29) for panel design, a finite element in-
vestigation of local web buckling behavior was performed. The face sheets and webs
were modeled using SHELL281 elements, and the core material was modeled using
SOLID186 elements. Perfect bonding was assumed between the shell elements and
the core. The bond between the face sheets and webs was modeled by imposing equal
displacements on the face sheet and web at the interface between them. The model is
shown in Figure 4.10 (for clarity, only the plate elements are displayed in the figure).
It consists of a panel section of width p, centered around a web. Due to symmetry,
only half the panel length is modeled; symmetric boundary conditions are applied at
the surfaces corresponding to x = a/2 and z = ±p/2. The panel is loaded with a
uniform pressure q on the top surface.
To prevent spurious crippling modes that arise due to the load concentration at the
supports, the panel is supported on a rigid bearing of width 10 mm. The bearing
region is kept small to ensure the complete transfer of shear stresses to the rest of
the panel, thus minimizing any impact on panel strength. It is not considered part
of the panel length. Very stiff (Ec = E) core material is used in the bearing region.
As a result, the support condition along the short edges of the web (x = 0) is much
58
hc/t, fW , Modea/hc fP
200,20
10.7,4.41
400,10
171,17.7
Figure 4.11. Buckling mode shape in the webs of a panel under distributed load (Ec =Gc = 500 kPa); due to symmetry, only half the panel length is shown
closer to clamped than to simply supported. This condition is not problematic for the
present study because, for long panels, the boundary conditions on the short edges
do not affect shear buckling strength [108].
The critical buckling load qFE and mode shape were determined using an eigenvalue
buckling analysis. The buckling mechanism for webs under the action of distributed
loads is illustrated for two sample cases in Figure 4.11. The two cases correspond to
webs of relatively low and high slenderness (hc/t = 200 and 400, respectively). The
buckling wavelengths are similar to those for panels under uniform load, though the
amplitudes of the buckles diminish with distance from the support. As a result, the
displacement in the core due to buckling is limited to a region of the webs near the
panel supports, where the shear stresses are greatest.
To provide a basis of comparison between FE results and the present model, consider
an effective buckling coefficient χFE given by
χFE =pahc2π2D
qFE. (4.30)
The suitability of Equation (4.29) to model the strength of panels under distributed
load is assessed through comparison of χ∞ and χFE. In panels with a/hc ≥ 4, χ∞
depends only on material properties and on the web slenderness ratio hc/t, both of
which determine the influence of the core material (see Equation 4.27). However, χFE
also depends on the web spacing ratio p/a.
59
Figure 4.12. Variation in analytical and numerical buckling coefficient vs. web slendernesshc/t for two different web spacing ratios (Ec = Gc = 500 kPa)
The relationship between buckling coefficient and web slenderness hc/t is plotted in
Figure 4.12 for panels with Ec = Gc = 500 kPa and two values of p/a (0.267 and
0.200). In all cases the dimensions were chosen so that a/hc ≥ 8. The foundation
constants fW and fP range from 10.7–418 and 4.41–27.6 respectively. Over this
range of hc/t, Equation (4.29) underestimates the buckling coefficient χFE by 11–
21%. The relative error is greater for small hc/t values by virtue of the smaller value
for χFE. The error increases slightly with an increase in p/a. This behavior can be
understood by considering the boundary conditions on the long edges of the web.
By analogy to the analysis in Reference [115], the rotational resistance from the face
sheets depends on their stiffness relative to that of the webs. In foam-filled panels, the
relative stiffness of the face sheets increases with p/a. Although this added resistance
is small, it results in webs with slightly higher buckling strength than predicted by
Equation (4.29).
Figures 4.13 and 4.14 illustrate the effects of aspect ratio and web spacing on shear
buckling strength. Figure 4.13 shows the variation in χFE with aspect ratio a/hc of
the web. The data correspond to hc/t = 400 and p/a = 0.200. The variation in
χFE is about 5% and occurs almost entirely in the range a/hc < 7. This difference
is small enough to confirm the validity of the assumption of infinite length for panels
60
with a/hc ≥ 4. Figure 4.14 shows the variation in χFE with the web spacing ratio
p/a (hc/t = 400, a/hc = 10). As noted above, the rotational restraint on the webs
increases with p/a, resulting in an increase in χFE. The variation in χFE is about
10% and is approximately linear.
The results shown in Figures 4.12–4.14 demonstrate that panel geometry has a slight
effect on the boundary conditions of the web. The insensitivity of buckling strength
to aspect ratio a/hc suggests that the load distribution in the web has little impact on
buckling behavior in panel designs. The effect of the web spacing ratio p/a is greater,
particularly if p/a and hc/t are both large. Even so, however, Equation (4.29) under-
predicts the buckling strength by less than 25%, particularly with slender webs at
relatively close spacing. This result suggests that the use of Equation (4.29) is a
reasonable and conservative approach to the analysis of shear buckling in web core
panels under distributed load.
4.5 Conclusions
Web core panels have potential for use in a variety of applications, including in the
building construction industry, where thin webs are necessary for thermal insulating
performance [29]. The design of such panels to withstand transverse loads without
shear buckling of the webs requires an understanding of the impact of the core material
on buckling strength, as well as how to apply that strength in the presence of the
non-uniform stresses that result from distributed panel loads.
The present work has examined the shear buckling behavior of web core panels under
a distributed load. A new model has been presented for the buckling of plates on
a Pasternak foundation under uniform in-plane shear. The buckling coefficients for
square and long plates have been calculated and fit to analytical expressions, given
by Equations (4.13) and (4.14) respectively. The solutions for square and long plates
provide upper and lower bounds to the value of the buckling coefficient. Equation
(4.14) is particularly useful for web core designs because the desired span is typically
large enough to allow treatment of the web as infinitely long.
A key element of the plate buckling model in this work is the determination of suit-
able foundation constants. A foundation model was developed using the principle of
minimum potential energy, based on the assumption that the displacement in the core
61
Figure 4.13. Comparison of χ∞ and χFE vs. web aspect ratio a/hc (hc/t = 400, p/a = 0.200,Ec = Gc = 500 kPa)
Figure 4.14. Comparison of χ∞ and χFE vs. non-dimensional web spacing p/a (hc/t = 400,a/hc = 10, Ec = Gc = 500 kPa)
62
due to buckling decays exponentially with distance from the plate. The foundation
constants are expressed by combining Equations (4.23) and (4.25) and are applicable
for deep cores or cores with relatively large shear stiffness (i.e. Hk ≥ 2).
Applicability of the plate buckling model to web core panels under distributed load
has been demonstrated. Assuming the panel is long enough to be modeled using the
basic assumptions of beam theory (a/hc ≥ 4), the buckling strength is determined
on the basis of the maximum shearing forces in the panel (i.e. the effect of the load
distribution is negligible). The accuracy of the model is affected somewhat by panel
geometry. As the web spacing p/a or web slenderness hc/t is increased, the face sheets
provide increased rotational restraint. As a result, the webs are slightly stronger than
predicted by the present theory. The difference in strength is small, however, (less
than 25%), so for panel design purposes, it is reasonable and conservative to neglect
it.
63
Chapter 5
Bearing Failure of Foam-Filled
Web Core Panels
An important limitation to the design of panels with thin webs is the susceptibility to
failure at locations of concentrated load. In roof panels, load concentrations occur at
the supports. The mechanism of bearing failure in the webs is a localized buckling that
develops into a set of yield lines which converge at a plastic hinge in the face sheet.
This failure mode is referred to in the literature as web crippling. The associated
deformations are large enough to cause crushing of the core material at the load
locations. Thus, bearing failure in foam-filled panels is initiated by the combination
of web crippling and core crushing.
Two approaches to predicting the bearing strength of foam-filled panels are presented
in this chapter. A mechanism solution is developed using an existing plastic hinge
model for web crippling [100]. This model accounts for the influence of the core
material using energy methods and is applicable to panels supported along the edges
by rectangular bearings. Because empirical models are more commonly used for web
crippling in practice, a simplified model for the core material is also presented. This
model is proposed as a modification to current AISI design codes [102] for thin steel
design.
Note that, throughout this work, the term “strength” in connection with bearing
failure refers to the ultimate load or resultant force at the bearings to cause failure.
This usage is consistent with other work in the literature (e.g. [100,124])
64
5.1 Previous Work
The bearing strength Q of foam filled panels is expressed as
Q = Qw +Qcore, (5.1)
where Qw is the web crippling strength and Qcore is the contribution of the core
material. Both contributions can be modeled using energy methods corresponding to
the observed failure mechanism. In practice, Qw is generally modeled by an empirical
approach as well. Both approaches are described in this work.
A handful of researchers have modeled web crippling in plates or webs with no foam
support. The early work focused on the elastic stability of plates under concentrated
or patch loads. Timoshenko [93], for example, found the elastic buckling coefficient for
simply supported plates under opposing concentrated loads (Figure 5.1a), and Khan
and Walker [125] replaced the concentrated loads with patch loads (Figure 5.1b).
Rockey and Bagchi [126] used finite element analysis to find the buckling coefficient for
plates with a patch load on one edge and patch supports on the opposite edge (Figure
5.1c). All of these models fail to accurately predict web crippling strength (especially
with slender webs) because the plates have significant postbuckling capacity.
These models fail to account for possible end effects. The failure mechanism is dif-
ferent for loads applied near the ends (e.g. due to panel supports) compared to loads
in the interior. Bearing failure under end loading involves the development of fewer
plastic hinges and a smaller region of damage in the web compared to interior load-
ing. A few researchers have modeled crippling behavior by mimicking the (plastic
hinge) failure mechanism observed in testing. A review of this work was made by
(a) (b) (c)
Figure 5.1. Early elastic buckling models for bearing failure: (a) opposing concentratedloads [93], (b) opposing patch loads [125], and (c) patch load and supports [126]
65
Figure 5.2. End bearing failure mechanism in the webs (adapted from Reference [100])
Elgaaly [127]. The mechanism model for which web crippling strength has been most
successfully predicted is by Roberts and coworkers. The most recent version of that
model, by Roberts and Newark [100], is described here.
The model by Roberts and Newark [100] is based on the assumed failure mechanism
illustrated in Figure 5.2, as reported in the literature for numerous tests on slender
plate girders. The web folds along yield lines that meet at a plastic hinge at the face
sheet interface. The plastic hinge is located at a distance LD from the support. The
damaged region has a depth 2hD at the edge of the panel. The width of the support
is c. Roberts and Newark assume the load spreads through the face sheet at a 45◦
angle, so the support width is effectively c+ tf , and the total length of the damaged
region is LD+c+tf . The web crippling strength with no foam support is predicted by
equating the work done by the applied load to the energy dissipated in the formation
of plastic hinges.
For loads applied near the panel ends, the web crippling strength Qw predicted by
the model in Reference [100] is
Qw = FR
[3.3
8t2w√Ewσyw
(tftw
)1/4(1 +
8(c+ tf )tw3hctf
)]. (5.2)
The constant FR is a calibrating coefficient used to account for the observed variability
in test data. The variability is due to factors such as load and geometric imperfec-
tions, material variations, and residual stresses [99]. Based on the results of 237 web
crippling tests, Equation (5.2) overestimates web strength by about 25% on average.
The data had a spread of about ±45%. From these two observations, Roberts and
66
Newark recommended the use of FR = (1.25 ·1.45)−1 = 0.55 for predicting end failure.
They do not provide limits of applicability for Equation (5.2); however, based on the
test data on which their value for FR is based, the following limits can be suggested:
the bearing stress distributes evenly throughout the bearing region, i.e.
QAc = cpσuc. (5.20)
This term will be equal to the core crushing contribution predicted by Equation
(5.15) if LD ≈ c. In practice, LD is on the same order of magnitude as c (predicted
by Equation (5.18) as well as by the models in Reference [42]), so the difference
between the two approximations is small.
5.4 Model Comparison
In this section, comparison of the two bearing failure models is presented based on
the use of steel webs and a 36 kg/m3 PUR core. The relevant material properties (all
obtained through testing described in Chapter 7) are listed in Table 5.1. To simplify
the comparison, note that Equations (5.16) and (5.19) can be non-dimensionalized
into equations of the form
Q
σywt2w= f1
(hctw,c
tw,p
tw,σucσyw
,σyfσyw
,Ewσyw
,Ecσyw
,tftw
), (5.21)
QA
σywt2w= f2
(hctw,c
tw,p
tw,σucσyw
,R
tw
). (5.22)
The two models have identical similarity variables with respect to the web and bearing
geometry. The hinge model includes additional variables that account for the influence
of the face sheets, and the modified AISI equation accounts for the bending radius
of the web. To preserve similarity, the results in this section are given in terms of
Q/QA.
Direct comparison of the models is possible by assuming the face sheet is the same
material as the web (i.e. tf/tw = 1, σyf/σyw = 1) and by setting R/tw = 0. Based on
72
typical web core designs (Chapter 6), a web spacing ratio of p/tw = 1200 is used. The
bearing strength predictions for the hinge and modified AISI models are compared
in Figure 5.4 for web slenderness hc/tw ranging from 150–500. The ratio Q/QA is
plotted for c/tw ranging from 100–200. The hinge model predicts bearing strength
within about 15% of the modified AISI model. The main source of this difference is the
core crushing contribution predicted by each model. The calculated damage length
LD varies from the bearing length c by about ±30% over the range of c/tw considered.
Thus, while the hinge model predicts a larger web crippling contribution (by about
5–20%) than the modified AISI model, it may predict a smaller total strength with
wide bearings.
The importance of the core crushing contribution to the overall bearing strength is
illustrated in Figure 5.5. Using the same materials and geometry from the previous
figure, with c/tw = 150, the core crushing contribution Qc/Q (and QAc/QA) is plotted
as a function of web slenderness. According to the hinge model, the core crushing term
Qc contributes 78–86% of the bearing strength. In contrast, the elastic foundation
effect Qf (not shown) supplies only about 5% of the total strength. The ratio Qc/Q
increases with hc/tw because slender webs have low crippling strength. Similarly,
according to the modified AISI equation, QAc contributes 88–90% of the bearing
strength in panels with slender webs. For both models, the results plotted in Figure
5.5 are insensitive to c/tw.
The large contribution of the core material relative to the webs has implications for
roof panel design. For example, the variability in bearing strength is significantly
less for foam-filled versus empty panels. Neglecting the variability in foam crushing
strength, a variation of ±50% in Qw affects Q by less than ± 10%. In other words,
the uncertainty in bearing strength is shifted from the webs to the core material.
The core crushing strength is not affected by factors such as initial imperfections and
bending radii, so the variability in the strength of foam-filled panels is lower than
that of the webs alone.
The large contribution of core crushing to the bearing strength of foam-filled panels
suggests a reasonable prediction of bearing strength is made by neglecting the web
contribution altogether, i.e.
Q ≈ cpσuc. (5.23)
73
Figure 5.4. Comparison of hinge and modified AISI bearing failure models: plot of Q/QAvs. web slenderness hc/tw assuming carbon steel webs and 36 kg/m3 PUR core with tf/tw =σyf/σyw = 1, p/tw = 1200, and R/tw = 0
Figure 5.5. Contribution of core crushing to total bearing strength: plot of Qc/Q vs. hc/twassuming carbon steel webs and 36 kg/m3 PUR core with tf/tw = σyf/σyw = 1, c/tw = 150,p/tw = 1200, and R/tw = 0
74
In the present example, the error from using Equation (5.23) is around 20%. This dif-
ference is reasonable for most designs. In panels with slender webs (hc/tw ≥ 200), the
results in Figure 5.5 suggest bearing strength is fairly insensitive to web slenderness.
The important geometric parameter for bearing strength is thus the support width c.
Consideration of the web crippling contribution becomes important when the strength
predicted by Equation (5.23) is slightly less than needed (e.g. when relatively weak
core material is used).
Bearing failure is not a concern for typical roof panel designs. For example, consider
the design of a roof panel using the foam properties in Table 5.1. Based on Equation
(5.23), the maximum distributed load q the panel can support without bearing failure
is approximately
q ≈ 2cσuca
. (5.24)
Typical residential wall panels have a depth of 165 mm (6.5 in.)1. The bearing width
with a 6:12 roof pitch is thus 184 mm (7.25 in.). Assuming a fatigue reduction factor
ζn = 0.6 (Chapter 2), and a panel length of 6.8 m, q is 4481 N/m2. Applying a
safety factor of 2 (see Chapter 6), this strength is sufficient for roofs in most of the
US (specifically, Climates I and II, see Table A.1). Other provisions must be made
in northern climates (i.e. Climate III). For example, the wall panel depth can be
increased to about 200 mm. The increase in wall thickness has the added benefit of
increased R-value, which is typically recommended for colder climates [71].
5.5 Summary
A hinge model for the bearing strength of foam-filled web core panels was presented.
The model is based on a mechanism solution that was developed and validated in
the literature for web crippling strength in cold-formed steel beams. It accounts for
the interactions between the face sheets, webs, and core material and can be used
to gain insight into the role of each material in the prevention of bearing failure. Of
particular importance is the determination that the core crushing strength contributes
approximately 80–90% of the total bearing capacity in typical roof panels. The elastic
foundation effect of the core is effectively negligible because the core material does
not prevent plastic hinge formation. The hinge model was compared to a proposed
1Based on standard SIP wall panel designs obtained from the Structural Insulated Panel Associ-ation website (http://www.sips.org)
75
modification to the current AISI prescriptive design code for thin steel beams. Bearing
strength predictions by the two approaches agree to within about 35% for typical roof
panels with slender, widely-spaced webs.
The dominance of the foam crushing contribution to bearing strength suggests a
reasonable first approximation can be made by neglecting the webs altogether. The
resulting design equation (5.23) makes it possible to prevent bearing failure a priori
by specifying the bearing width c. For roof panels with 36 kg/m3 PUR core material,
typical wall assemblies provide enough support width to prevent failure in US Climate
zones I and II. Slightly wider bearings (≈200 mm) are required for Climate III.
76
Chapter 6
Design of Web Core Roof Panels
Panelized construction of residential buildings is gaining popularity due to the archi-
tectural and energy efficiency benefits that can be achieved1. An important challenge
to the design of panel structures for buildings is the balance between long-term struc-
tural performance and the thermal insulating requirement. This chapter focuses on
the design considerations for web core panels for residential roofs. A design procedure
is developed that considers R-value, panel deflection, core shear failure, and buckling
of the face sheets and webs. The buckling models include the effect of the core mate-
rial as discussed in Chapter 4. Panel designs are presented that provide an R-value of
5.3 m2-K/W for roof loads of 1500, 2000 and 3000 N/m2. It is demonstrated that the
web core panel can be designed for these structural and thermal requirements with
unsupported span lengths as long as 7 m, while span lengths for foam core panels
are limited to 4 m. Web shear buckling and R-value are the two performance criteria
that limit panel span length and depth.
6.1 Introduction
Panelized construction has found use in a variety of structural applications where
weight and constructibility are constraints. In the building construction industry,
wall and roof panels have the additional benefit of energy savings through improved
thermal insulation and reduced air infiltration, particularly when polymer foam cores
are used. Roof panels have the potential for even greater benefit but pose unique
1Portions of this chapter are reprinted from Reference [29], with permission from the publisher.
77
Table 6.1. Properties of steels used in the analysis
Figure 6.2. Plot of minimum panel depth vs. length for foam core panels with 2.0 mm steelface sheets and PUR core. Designs that neglect the influence of core creep are shown withdashed lines, and designs that include the effect of creep are shown with solid lines.
designs based on the nominal foam properties and the solid lines correspond to designs
based on the properties adjusted for dead loads. The maximum span lengths without
considering creep are 7, 5.9 and 4.4 m corresponding to increasing loads of 1500, 2000
and 3000 N/m2. When creep of the foam is considered, the maximum span lengths
are 3.8 and 3.2 m corresponding to loads of 1500 and 2000 N/m2. The length is
less than 2.5 m for a 3000 N/m2 load. Because of the dependence on the foam for
shear stiffness, foam core panel lengths are reduced significantly when creep effects
are included. This example illustrates the potential impact of increasing the shear
stiffness of the panel by adding webs.
80
6.3 Design Approach
The analysis and design of a web core roof panel requires the simultaneous consider-
ation of thermal and structural performance. In this section, expressions describing
the performance as a function of the panel geometry and loads are developed and dis-
cussed. Several limit states must be considered for the web core panel. These include
the overall measures of panel performance—thermal performance and deflection—as
well as local buckling and stress failure modes. Local buckling is possible for both
the face sheet and the webs. The core can fail due to shear stress failure or due to
crushing at the panel supports.
Models for the limit states follow. Each of the models is based on the use of thin
face sheets and webs (i.e. hc/tf ≥ 50 and p/tw ≥ 50) and a relatively flexible core
(Ec � Ef ). Full adhesion of the foam and the structural materials is assumed.
Resulting from the use of thin webs, the strength of the core is high relative to the
buckling strength of the unsupported webs.
The foam is treated as isotropic, using the compressive or shear properties measured
perpendicular to the rise direction. This simplification is representative of the load
conditions on the foam in the models described below. Because foams tend to be
stronger in tension (and in the direction of rise), the approach is also slightly conser-
vative.
6.3.1 Thermal Performance
The thermal performance of the web core panel is determined using the isothermal
planes method [30] for one-dimensional heat conduction. Lateral heat flow between
the webs and the insulation is negligible, so the panel is modeled as a network of
thermal path resistances in series and parallel. The R-value of the overall assembly
is found from the equivalent resistance of the network. The contribution of the thin
metal face sheets to the R-value of the panel assembly is negligible. The R-value is
thus given by
R =hc
kwtwp
+ kc
(1− tw
p
) , (6.1)
where kw and kc are the thermal conductivity of the web and insulating materials,
respectively. Equation (6.1) can be rearranged to find the core depth required for a
81
desired R-value, i.e.
hc = R
[kc + (kw − kc)
twp
], (6.2)
from which it can be seen that the depth to achieve the target R-value without webs
is Rkc. The second term on the right hand side of Equation (6.2) is the penalty, in
terms of increased core depth, that results from the use of stiffening webs. For metal
webs, kw � kc (see Tables 6.1 and 6.2), so the webs have a strong impact on the
thermal performance of the panel. To minimize the detrimental effects of conducting
materials like steel, it is necessary to use thin, widely-spaced webs.
United States building codes [71] prescribe an R-value requirement for roofs that
is heavily dependent on the number of heating degree days (HDD) at the building
location. The heating degree days vary substantially throughout the country (from
near zero to ≈10,500), so it is convenient for the present discussion to define thermal
climate zones. Locations within the southern half of the continental US (excluding
the Rocky Mountain range) have less than 4500 HDD. The R-value requirement for
4500 HDD is 5.3 m2-K/W [71]. In the mountains and in the northern half of the US,
the R-value requirement ranges up to a maximum of 6.8 m2-K/W [71].
6.3.2 Panel Deflection
The temperature gradient and the roof loading cause the panel to deflect. The tem-
perature gradient across the panel thickness causes differential thermal expansion of
the face sheets, leading to a thermal deflection component wth, and the applied load on
the roof causes a mechanical component wload. The two components are independent,
so the total panel deflection w is found by superposition:
w = wth + wload. (6.3)
The webs add significant shear stiffness to the panel. As a result, the differential
expansion of the face sheets results solely in panel bending [78], and the thermal
component of deflection (evaluated at the panel mid-span, x = a/2) is
wth =a2αf∆T
8d, (6.4)
82
where αf is the coefficient of thermal expansion of the face sheets, ∆T is the temper-
ature gradient across the panel, and d = hc + tf is the distance between the centroids
of the face sheets.
The flexural stiffness of the panel is comprised of two components: the bending
stiffness Dx and the shear stiffness DQx. The stiffness coefficients are found by adding
the stiffness of the webs to the stiffness expression for foam core panels [89], i.e.
Dx =Efd
2tf2
+Ewh
3c
12
(twp
)+Ech
3c
12
(1− tw
p
), (6.5)
DQx = 2Gwtw
[d2tfphctw
+1
6
(hcp
)2] [
tf
tw+
h2c3pd
]−1+Gc
d2
hc
(1− tw
p
). (6.6)
The last term in each of Equations (6.5) and (6.6) represents the effect of the core
material on panel stiffness. In steel panel designs, Ef � Ec and Ew � Ec; therefore,
the effect of the foam on the stiffness coefficients and panel deflection is negligible.
Comparison of the first two terms of Dx shows the influence of the webs on bending
stiffness is also small. Thus, the bending stiffness of the panel is provided by the face
sheets, while the shear stiffness is provided by the webs.
For a simply supported panel under a uniformly distributed load q, the maximum
deflection occurs at the panel mid-span (x = a/2) and is given by
wload =5qa4
384ξDx
+qa2
8DQx
. (6.7)
The first term in the right hand side of Equation (6.7) is the deflection due to bending,
and the second term is the shear deflection. The parameter ξ is a reduction factor
to account for the effects of shear lag, as described below. The maximum allowable
panel deflection w is specified for residential roofs as w = a/240 [43]. The global
deflection constraint can thus be expressed as
wth + wload ≤ w. (6.8)
The thermal component of panel deflection can be substantial in the presence of large
temperature gradients. With steel face sheets and ∆T = 55◦C, for example, the
thermal deflection is comparable or larger in magnitude than the deflection due to
83
the load for many roof applications. Over the full range of panel lengths and loads
considered in this study, the thermal component of deflection consistently accounts
for more than 50% of the total deflection.
For designs that use thin, widely-spaced webs, the panel bending stiffness is effectively
reduced due to shear lag effects. These effects are accounted for in the present analysis
by reducing the bending stiffness Dx by a shear lag factor ξ as shown in Equation
(6.7). Neglecting the influence of the foam and assuming that the face sheets do not
buckle as a result of panel bending (see the next section), the analysis of Hildebrand
and Reissner [91] can be used to determine ξ. For a simply supported beam under
uniformly distributed transverse load, ξ is given by
ξ =1− m−1
3f
1 +(1− m
3
)f, (6.9)
where f is a shear lag function that depends on loading and boundary conditions,
and is defined in [91]. For web core panels with thin face sheets (i.e. hc/tf ≥ 50), the
non-dimensional stiffness parameter m is approximated by
m ≈ 2
1 + 6tftw
phc
+ 1. (6.10)
For short panels, the reduction factor ξ is as low as 0.7 (indicating a 30% reduction
in bending stiffness). However, the bending component of deflection is small for short
panels, so the effect of shear lag is negligible. For longer panels, where the bending
component is a larger percentage of the total deflection, ξ > 0.95. To meet the
deflection requirement for these designs, the core depth must be increased by less
than 0.5% compared to the value obtained when shear lag is neglected.
6.3.3 Face Sheet Buckling
Because the bending stiffness of the panel is provided almost entirely by the face
sheets, the face sheets bear the bending stress of the panel. The top face sheet is
in compression and therefore subject to buckling. The top face sheet is modeled as
a set of plates, each of width p and length a, simply supported along the webs and
transverse edges. The model for the individual plates is illustrated in Figure 6.3.
Each plate is loaded in uniform, uniaxial compression along the edges at x = 0 and
84
Figure 6.3. Plate approximation for face sheet buckling analysis
x = a by a stress σf equal to the maximum bending stress imposed by the panel
loading.
As the buckled face sheet deforms, it forces a corresponding deformation in the core.
Relatively stiff core materials resist this deformation both in compression and in shear,
thus increasing the buckling strength. Kolsters [89] studied this effect in web core
panels loaded in pure compression and in bending. He found that the core material
can be modeled as a Pasternak foundation, for which the restoring pressure q due to
a local deflection w is given by [122]
q = KWf w −KPf∇2w. (6.11)
The Winkler and Pasternak foundation constants KWf and KPf represent the re-
sistance of the foundation to compression and shear deformation. The foundation
constants for a panel loaded in bending were determined in Reference [89] using finite
element analysis and found to be
KWf =Ec6hc
, KPf =1
6Gchc. (6.12)
A parabolic moment distribution exists under distributed loads with maximum mo-
ment qa2/8 occurring at the panel mid-span (x = a/2). The resulting stress σf is
σf =qa2
8dtf. (6.13)
85
The critical buckling stress σf follows the standard form for plate buckling [93],
σf = χfπ2Df
p2tf, (6.14)
where χf is a factor that accounts for the loads and boundary conditions imposed on
the plate, and Df is the plate stiffness of the face sheet,
Df =Ef t
3f
12(1− ν2f
) . (6.15)
For a simply supported plate on a Pasternak foundation, χf is given by [123]
χf = 2√
1 + fWf + fPf + fPf + 2, (6.16)
where the non-dimensional Winkler and Pasternak foundation parameters fWf and
fPf are
fWf =p4KWf
π4Df
, fPf =p2KPf
π2Df
(6.17)
These parameters represent the ratio of the normal and shear stiffnesses of the foun-
dation to the bending stiffness of the plate. High values for the parameters signify a
core material that strongly resists local deformation of the face sheet.
From the preceding analysis, face sheet buckling is avoided when σf < σf . In de-
termining the values of the foundation constants, the foam stiffness is reduced per
Equation (2.2) to account for the effects of live load creep. Building design codes [102]
allow designs within the postbuckling range. These guidelines for postbuckling be-
havior can be applied to the face sheets of web core panels. It will be shown, however,
that face sheet buckling is not a limiting failure mode for practical panel designs due
to the large core depths and thin webs required to meet the thermal requirement.
Therefore, postbuckling capacity is not considered in the present study.
6.3.4 Panel Shear Strength
Shear failure of the panel is possible at the panel supports (x = 0 and x = a),
where the transverse shearing forces are greatest. The shear strength of the panel
has contributions from both the webs and the foam. Based on the stiffness model
presented earlier, the shearing forces are supported almost entirely by the webs. The
86
Figure 6.4. Plate approximation for web shear buckling
resulting stresses can therefore lead to shear buckling of the webs. Following the onset
of shear buckling, the forces are transferred to the core material. Web core panels
therefore contain some shear postbuckling strength as long as the core strength is
greater than the web buckling strength. Although shear buckling of deeper panels
will not lead to collapse, the loss of web stiffness will lead to a reduction in panel
stiffness. In the present study, both aspects of shear strength are treated separately.
The web shear buckling analysis is performed by treating the webs as plates on an
elastic foundation. Each web is modeled as a simply-supported plate of length a and
width hc, subjected to the uniform shear stress τw on all four edges (Figure 6.4). The
maximum shearing force qpa/2 occurs at the panel supports (x = 0 and x = a). The
shear buckling strength of the webs is approximated using the resulting average shear
stress, which is given by
τw =qpa
2twhc. (6.18)
The model follows standard practice for steel design [131,132] and is slightly conser-
vative because it neglects the interactions between face sheets and webs, as well as
variations in shear loading along the length of the panel. The critical buckling stress
τw is [93]
τw = χwπ2Dw
h2ctw, (6.19)
where Dw is the plate stiffness of the web,
Dw =Ewt
3w
12 (1− ν2w). (6.20)
87
From the results given in Reference [28], the buckling coefficient χw is approximated
by
χw = 2.006√
0.690 + fWw + 1.020fPw + fPw + 3.749, (6.21)
and the non-dimensional foundation parameters fWw and fPw are
fWw =12 (1− ν2w) 3
√6
2π4
(hctw
)43
√G2cE
2c
E4w
, (6.22)
fPw =12 (1− ν2w)
2π2 3√
6
(hctw
)23
√GcEcE2w
. (6.23)
These parameters are developed for relatively deep foundations and are thus appli-
cable for wide web spacing. Combining Equation (4.25) with the requirement that
Hk ≥ 2 (Chapter 4) yields the condition
twp≤ 0.454 3
√G2c
EcEw. (6.24)
This requirement is easily satisfied for roof panel designs. For example, with a PUR
core and webs approximately 1 mm thick, the minimum web spacing is 250 mm2.
As noted previously, the panel will have some shear postbuckling strength as long as
the shear stresses can be transferred to the core material without causing core failure.
Therefore, shear failure of the core is modeled by assuming the webs do not contribute
to the shear strength of the core. The applied core shear stress τc is approximated
from sandwich panel theory as [37]
τc =qa
2hc. (6.25)
The limiting stress on the foam core is the shear strength τuc, where τuc is reduced
per Equation (2.4) to account for fatigue.
6.3.5 Panel Bearing Strength
At the support locations the panel is subjected to concentrated loads, which can cause
compressive bearing failure of the panel. This failure occurs through a combination
2An alternative form of the foundation constants applicable for closely-spaced webs is given inAppendix C
88
of local foam crushing and web crippling. Romanoff [124] identified three factors
that contribute to the bearing strength of web core panels: the crippling strength
of the webs, the interaction between the webs and foam as they cripple, and the
crushing strength of the foam. The first contribution has been modeled by Roberts
and Newark [100]. The other contributions are determined based on the assumed
failure mechanism of the webs using energy methods.
Romanoff [124] found the bearing strength of panels loaded far from the edges; his
method has been extended in the present study for panels supported over a rectan-
gular area on the panel edges (x = 0 and x = a). Assuming slender webs are used
(hc ≥ 40tw), the concentrated load on a web Q at which bearing failure occurs is
Q = FR
[3.3
8t2w√Ewσyw
(tftw
)1/4(1 +
8(c+ tf )tw3hctf
)]
+h2DKwc
3(c+ tf + LD) + σuc
p
2(c+ tf + LD) . (6.26)
The three terms on the right hand side are the contributions from the crippling
strength of the webs, the interaction between the crippled webs and the foam, and the
crushing strength of the foam. The parameters Kwc and LD are an elastic foundation
modulus and the length of the damaged region of the web [124].
The thermal requirement necessitates the use of very slender (large hc/tw ratios),
widely-spaced webs. For such designs, the foam crushing term typically contributes
80% or more of the total bearing strength, with most of the remaining strength coming
from the web crippling term. Thus, for panels with slender widely spaced webs, it is
reasonable to neglect the contribution of the webs in calculating the bearing strength.
The foam must support a load qpa/2 along each bearing edge and the foam load
capacity is σucpc. Thus, the load q that the panel can sustain without bearing failure
is approximated by
q =2c
aσuc. (6.27)
6.3.6 Design Criteria
The failure modes for web core panels can be classified either as ultimate or service-
ability limit states. The serviceability limit states—deflection, thermal performance,
and initial face sheet buckling—do not cause structural failure of the panel if limits are
89
Table 6.3. Safety factors used in the present analysis [34,35,102]
exceeded. For deflection and thermal performance, the limits are set by prescriptive
codes. For initial face sheet buckling, the panel has residual postbuckling capacity
that allows loading beyond the buckling load. All other failure modes (web buckling,
core shear failure and core crushing) are treated as ultimate limit states, that is, panel
failure is expected if any of the states are violated.
The analysis and designs that follow are developed based on the Allowable Strength
Design (ASD) criterion [102]. Following the ASD criteria, each limit state is expressed
generically in terms of an applied load Fi (such as deflection or applied normal stress)
and a nominal limit load F i. The following condition must be met for each limit
state:
Fi ≤ ψiF i, (6.28)
where ψi is a safety factor for the limit state. The safety factors are specified based on
the severity of the limit states. For the serviceability limit states (thermal, deflection,
and initial face buckling), the safety factors are set to 1.0. The safety factor for web
shear buckling is set to 1.6 per US building codes [102]. Prescriptive codes do not
address stress failure of the core; the safety factors for core failure are set to 2.0
in order to minimize the effects on core creep rates [34, 35]. The safety factors and
equations corresponding to the limit states are listed in Table 6.3.
6.4 Design Procedure
The design of roof panels is driven by the interaction between structural and thermal
requirements. From a structural standpoint, thicker webs (high tw/p ratios) are desir-
able, but from a thermal standpoint, thinner webs are required. A design procedure
has been developed that balances the two requirements to minimize the core depth
hc. This objective was chosen based on the relatively high cost of the foam compared
90
Figure 6.5. Flowchart of the web core design procedure
to the structural material, as well as the difficulty of integrating deep panels into roof
architecture.
The proposed design procedure follows the flowchart illustrated in Figure 6.5. The
panel length, loading, and R-value are defined by roof geometry and geographic lo-
cation and are inputs to the procedure. The outputs of the procedure are tf , tw, hc,
and p for the design that minimizes the core depth hc. Constraints are imposed on
panel geometry to improve manufacturability. To ensure that cold-rolled steel can be
used, the face sheet and web thicknesses are limited to the range of 0.6–2.0 mm. For
the purposes of handling and architectural requirements, the maximum panel width
and thickness are set at 2.4 m and 400 mm respectively. Web spacing is limited to
integer increments of the total width (i.e. 1.2 m, 0.8 m, 0.6 m, etc. for a panel width
of 2.4 m).
91
For the requirements of most residential roofs and the materials considered in this
study, it will be demonstrated that the thermal and shear buckling requirements
impose the primary restrictions on the design space for the web geometry tw and hc.
The proposed design procedure is therefore performed in two steps. First, the web
thickness and height, tw and hc, are determined for the maximum p based on the
thermal, shear buckling, and core shear failure requirements. The web thickness is
incremented in steps of 0.01 mm, starting from the minimum allowable value (0.6
mm). For each value of tw, the hc to satisfy the thermal and core shear failure
requirements is found from Equations (6.2) and (6.25); the resulting tw and hc are
then checked for shear buckling. If shear buckling is predicted, tw is increased until
shear buckling is avoided. If the shear buckling requirement cannot be met without
violating the geometric constraints described above, then no feasible designs exist for
the current web spacing and the search is repeated with a smaller value for p.
Once tw and hc are determined in step 1, tf is found in step 2 based on the deflection
and face sheet buckling requirements. The minimum value to satisfy both require-
ments is found using bisection, i.e. iterate, reducing the search space for tf (starting
with the original range 0.6–2.0 mm). The entire process is repeated for each value
of p until the minimum core depth is found. In practice, the problem is convex in
p; therefore, not all possible values need to be checked. It is possible to start with
the largest allowable value of p, then reduce p until further reductions fail to result
in smaller core depths.
6.5 Failure Mode Examination
To gain insight into the design considerations for web core panels, it is useful to
examine the influence of the failure modes on panel design. This influence can be
investigated by mapping the effect of each failure mode on the feasible (tw, hc) design
space. Examples of failure mode maps are shown in Figures 6.6(a) and (b) for panel
lengths of 5 and 7 m. The applied load in both cases is 1500 N/m2, and the minimum
R-value is 5.3 m2-K/W. These requirements are representative of houses in the south-
ern half of the United States. The curves corresponding to minimum tw required to
avoid shear buckling and minimum hc to avoid the other failure modes are plotted
for panels with carbon steel and stainless steel webs with a 1.2 m web spacing. To
demonstrate the minimum allowable core depth for failure modes that depend on tf ,
92
(a)
(b)
Figure 6.6. Failure mode map for panels with carbon or stainless steel webs spaced at1.2 m and a 36 kg/m3 core, subjected to a transverse load of 1500 N/m2 and an R-valuerequirement of 5.3 m2-K/W (tf = 2.0 mm): (a) panel length of 5 m, and (b) panel lengthof 7 m. The regions of (tw, hc) combinations for which no failure modes occur for the twoweb materials are shaded, and the minimum depth designs are circled.
93
the maximum value of 2.0 mm is used. The space of permissible designs is shaded
(dark shading for designs with carbon steel webs and light shading for stainless steel
webs), and the design point that minimizes hc for each material is circled. In each
case, the permissible (tw, hc) space is determined by the thermal and shear buckling
failure modes.
Core shear failure and face sheet buckling are independent of tw. The curve for core
shear failure is generated by solving Equation (6.25) for hc. The curve for face sheet
buckling is generated by setting σf = σf and tf = 2.0 mm. The deflection curve
does not change with tw for tw greater than about 0.3 mm. This independence occurs
because the webs effectively eliminate the shear component of panel deflection. Very
thin webs contribute less to the panel shear stiffness, so greater core depth is necessary
to meet the deflection requirement. In the limit as tw approaches zero (i.e. no webs),
the core depth increases sharply to the value for foam core panels with no webs (505
and 600 mm for panel lengths of 5 and 7 m respectively).
The curve corresponding to shear buckling is the locus of points where τw = τw, as
given by Equations (6.18) and (6.19). The intersection of the shear buckling curve
with the core shear curve is the minimum core depth for which the panel is expected
to have postbuckling strength in shear. If sufficiently thick webs are used, then the
shear buckling constraint will be satisfied regardless of core depth. In Figure 6.6(a),
for example, shear buckling is avoided for all hc when tw ≥ 0.73 mm, and in Figure
6.6(b) it is avoided when tw ≥ 0.87 mm. This comparison also indicates that the
required web thickness increases with increasing panel length.
The thermal requirement is indicated by a line with a slope R(kw − kc)/p (see Equa-
tion (6.2)). Because kw � kc, the slope is proportional to the thermal conductivity
of the web material. Figures 6.6(a) and (b) include dashed lines representing the
thermal requirements for carbon steel and stainless steel webs. Because the thermal
conductivity of stainless steel is approximately one third that of carbon steel, pan-
els with stainless steel webs are less deep than panels with carbon steel webs. For
example, for a 5 m long span, a 254 mm deep panel with carbon steel webs satisfies
all requirements compared to a 179 mm deep panel with stainless steel webs. For
a 7 m span, panel depths are 282 mm and 190 mm for carbon and stainless steel
webs, respectively. For the same R-value and web material, panel depth increases
with increasing panel length.
94
(a)
(b)
Figure 6.7. Failure mode map for panels with (a) carbon or (b) stainless steel webs spacedat 1.2 m and a 36 kg/m3 core, panel length of 7 m, subjected to a transverse load of1500 N/m2. R-value requirements of 3.5, 5.3, and 6.7 m2-K/W are compared for each webmaterial.
95
To illustrate the effect of the thermal requirement on the design space, the failure
mode map of Figure 6.6(b) is repeated with several different R-value requirements
in Figure 6.7. Lines corresponding to R-value requirements of 3.5, 5.3, and 6.7 m2-
K/W, are shown for carbon steel webs in Figure 6.7(a) and for stainless steel webs in
Figure 6.7(b). The curves from Figure 6.6(b) corresponding to structural limit states
are included for reference. Designs are generally limited by the interaction between
thermal performance and the shear buckling requirement. If the thermal requirement
is sufficiently reduced, then other failure modes can influence the design. In Figure
6.7(b), for example, stainless steel web designs with an R-value requirement of 3.5 m2-
K/W or less are not limited by thermal performance. In this case, the deflection and
face sheet buckling requirements are more restrictive than the thermal requirement.
For example, with stainless steel webs 0.82 mm thick, the panel that satisfies all limit
states is 181 mm deep. The corresponding R-value is 5.0 m2-K/W.
The latter situation, in which the design is not limited by thermal performance, occurs
for designs with low R-value requirements and high transverse loads. It also occurs
only with the use of stainless steel (or other low thermal conductivity material) webs.
The situation is unlikely in practice because high loading occurs primarily in colder
climates, where the R-value requirement is higher (6.8 m2-K/W). If the situation does
occur, it is necessary to increase the depth hc to meet the deflection and face sheet
buckling requirements. In that case, step 1 of the design process (see Figure 6.5)
should be repeated to ensure that shear buckling is still prevented.
6.6 Roof Panel Designs
The procedure has been applied to the design of panels for lengths from 2.5 to 7 m
and the loads expected in residential applications: 1500, 2000, and 3000 N/m2. Each
of these loads includes an assumed dead load of 700 N/m2: 500 N/m2 for panel weight
and 200 N/m2 for additional roofing layers. An R-value of 5.3 m2-K/W is specified.
Designs are presented for web spacing of 1.2 and 0.8 m.
The minimum panel depth is plotted as a function of panel length in Figures 6.8(a)–
(c) for 1500, 2000 and 3000 N/m2. Foam core panels are compared with web core
panels with carbon and stainless steel webs. In foam core panels, the foam provides
minimal shear stiffness: the panel depth increases significantly with length and load
to satisfy the deflection requirement. The webs provide shear stiffness, enabling web
96
(a)
(b)
(c)
Figure 6.8. Core depth vs. panel length for foam core panels and web core panels withcarbon and stainless steel webs with an R-value requirement of 5.3 m2-K/W and an appliedload of: (a) 1500 N/m2, (b) 2000 N/m2, and (c) 3000 N/m2. Web spacing of 0.8 and 1.2 mare compared for the web core panels.
97
core designs for much longer spans. The required core depth increases with length in
all cases, but the use of webs reduces the depth by as much as 57%. For example, for
a load of 1500 N/m2, webs are required for panels longer than 3.9 m, and the use of
webs reduces panel depth for lengths greater than 2.6 m. The increase in allowable
panel length and the reduction in panel depth attributed to the use of webs become
more dramatic as the load is increased. For a load of 3000 N/m2, webs are required
for any length.
Two factors cause the increase in panel depth with span length. For longer span
lengths under 1500 and 2000 N/m2 loads, the increase in depth reflects an increase in
the required web thickness to prevent shear buckling. Panel depth is correspondingly
increased to meet the thermal requirement. (Some segments of the curves in Figure
6.8 are flat; these represent designs where the required web thickness is less than the
minimum of 0.6 mm, hence no need to increase tw.) If stainless steel webs are used
under high loads (3000 N/m2) with longer spans, the depth increases more rapidly
with span length. It will be demonstrated that these cases are designs for which
the maximum face sheet thickness (2.0 mm) must be used. It becomes necessary to
increase the depth to meet the structural requirements.
Two factors cause the increase in panel depth with span length. In most cases,
the depth reflects an increase in the required web thickness to prevent shear buckling.
Panel depth is correspondingly increased to meet the thermal requirement. If stainless
steel webs are used at higher loads (2000 and 3000 N/m2) and longer spans, the depth
increases more rapidly. In this case, the maximum face sheet thickness (2.0 mm) is
required to meet the structural requirements, and it is necessary to further increase
the depth to meet the structural requirements. These are the designs, described in
the previous section, that are not limited by thermal performance. These trends, in
terms of face sheet and web thickness, are illustrated in the figures that follow.
Figure 6.8 also shows the effect of web spacing. Closer web spacing is generally
beneficial from a structural standpoint: it results in stiffer panels with less stress on
the webs. On the other hand, closer webs are detrimental to the thermal performance,
and, as noted above, thermal requirements control most of the designs. Thus, designs
with p = 0.8 m require deeper cores than the designs with p = 1.2 m. For those
designs that are limited by structural requirements, reductions of up to 20 mm (7%)
in depth are possible with reduced web spacing.
98
The face sheet and web thicknesses corresponding to the designs in Figure 6.8 are
plotted as a function of panel length in Figures 6.9 and 6.10 respectively. All foam core
panel designs require the maximum face sheet thickness of 2 mm in order to minimize
depth. The limit on span length for foam core panels is set by the depth limit of 400
mm. For web core designs, face sheet thickness influences both the panel deflection
and face sheet buckling strength. For short to moderate span lengths (e.g. ≈4.5 m
with stainless steel webs), only the minimum face sheet thickness, 0.6 mm, is required.
The required face sheet thickness is smaller for panels with carbon steel webs because
the depth is greater. For longer panels (with either web material), the deflection and
face sheet buckling criteria require an increase in face sheet thickness. The increase is
linear because the representative load varies linearly with length (see Equations (6.7)
and (6.13)).
Figures 6.8 and 6.10 reflect the directly proportional relationship between web thick-
ness and core depth. For example, for panels with carbon steel webs spaced at 0.8
m and loaded at 1500 N/m2, the required web thickness is 0.6 mm for a < 6.3 m.
Panel depth is 283 mm. For a > 6.3 m, the web thickness and panel depth increase
linearly. Web spacing and material influence the web thickness. Panels with p = 1.2
m require webs up to about 40% thicker than those with p = 0.8 m. Similarly, carbon
steel webs must be up to 25% thinner than stainless steel webs. These relationships
between web geometry and material are consistent with the thermal requirement. As
the web spacing decreases, thinner webs are required to satisfy the thermal require-
ment. Webs constructed from materials with higher thermal conductivity must also
be thinner.
The panel weights associated with each of the designs in Figure 6.8 are plotted in
Figure 6.11. All of the designs weigh less than the assumed design weight of 500
N/m2. For 1500 N/m2, foam core panel weight increases from 183 to 239 N/m2 as
the span length increases from 2.5 to 4 m. For 2000 N/m2, panel weight increases
from 203 to 237 N/m2 as the span length increases from 2.5 to 3.3 m. The increase in
panel weight is associated entirely with an increase in foam depth. Foam core panels
weigh less than web core panels with closely-spaced carbon steel webs, but more than
all other web core designs.
For web core panels, increases in face sheet thickness and foam depth affect the weight,
while increases in web thickness have a minimal effect. The increase in weight (with
99
(a)
(b)
(c)
Figure 6.9. Face sheet thickness vs. panel length for panels corresponding to the designsshown in Figure 6.8, applied load of: (a) 1500 N/m2, (b) 2000 N/m2, and (c) 3000 N/m2.Web spacing of 0.8 and 1.2 m are compared.
100
(a)
(b)
(c)
Figure 6.10. Web thickness vs. panel length for panels corresponding to the designs shownin Figure 6.8, applied load of: (a) 1500 N/m2, (b) 2000 N/m2, and (c) 3000 N/m2. Webspacing of 0.8 and 1.2 m are compared.
101
(a)
(b)
(c)
Figure 6.11. Panel weight vs. length for panels corresponding to the designs shown in Figure6.8, applied load of: (a) 1500 N/m2, (b) 2000 N/m2, and (c) 3000 N/m2.
102
increasing span) for web core panels with carbon steel webs follows the same trend
as the increase in panel depth. This result is as expected because the face sheet
thickness is 0.6 mm for all web core panels with carbon steel webs. In the range
where hc increases with constant tf (e.g. carbon steel webs at 3000 N/m2, 3 ≤ a ≤ 6
m), the weight increases relatively slowly with length. In the range where tf also
increases (e.g. same case with a > 6 m), the increase is more dramatic. Because most
of the panel weight comes from the face sheets, the weight is very sensitive to changes
in face sheet thickness.
The effect of web spacing on panel weight is reasonably small. With carbon steel
webs under moderate loading and length, panels with p = 1.2 m weigh about 17%
less than panels with 0.8 m; longer panels under high load weigh up to 10% more
with the wider web spacing. With stainless steel webs, the trends are similar but less
dramatic: panels with wider web spacing weigh 7% less for moderate span and load,
and up to 10% more for greater span and load. In both cases, the increased weight
under greater span and load is the result of increased face sheet thickness. Panels
with slightly closer web spacing can use thinner face sheets and, under the conditions
described here, the reduction in face sheet thickness has more effect than the increase
in depth.
6.7 Conclusions
Panelized residential roofs have several potential benefits over conventional construc-
tion techniques, including reduced construction times, improved energy efficiency,
and architectural benefits. Design considerations governing the use of metal web core
panels for residential roofs have been presented. The specific performance considera-
from the webs were cut in the (y-) direction of panel depth, and the specimen from
the face sheet was cut in the length (x-) direction. The web material properties for
Panel A are typical of mild steels [129].
The predicted behavior for the bearing failure prototypes is listed in Table 7.6. In
addition to bearing strength, predictions of face sheet buckling and shear buckling
strength are also provided. The predicted shear buckling load for both panels is
greater than the load for bearing failure. The predicted face sheet buckling strength
of Panel B is less than the bearing strength due to the fabricating irregularities
discussed above. However, accounting for the considerations in the previous section,
face sheet buckling was not expected to occur during the test on Panel B. In fact,
careful examination of the panel during and after the test revealed no evidence of face
sheet buckling.
7.3.3 Test Procedure
The bearing failure prototypes were tested per the “end one-flange” loading configura-
tion prescribed by steel design codes [102]. The key requirement for this configuration
is a minimum clear distance of 1.5hc between the load and support1. The tests de-
scribed in this chapter were performed with a clear distance of ≈1.8hc. All of the
1Accounting for the supports, the clear distance is λ− (ce + ci)/2 for the setup in Figure 7.1
118
wood reinforcing blocks used for foaming were removed for this test: to provide an
undamaged, unstiffened bearing surface, the blocked ends (yz-faces) were cut off.
As with the shear buckling test, spreader blocks were used at both the actuator and
the supports to spread the load across the full panel width and over a finite bearing
length. The bearing lengths at the load and support points were ci and ce respectively,
chosen to ensure failure at the support. As with the shear buckling test, neoprene
pads were placed between the spreader blocks and the panel. The load was applied
by increasing actuator displacement at a rate of 0.38 mm/min (0.015 in./min) until
a limit load was observed. Bearing failure was observed visually at the supports and
correlated to the load at failure using load-displacement data from the actuator. The
actuator displacement includes deformation of the neoprene pads in addition to panel
displacement. Due to compression of the neoprene pads, large initial displacements
(≈8–10 mm) were observed at low loads. Following this initial displacement, the
compressive modulus of the neoprene became nearly constant [138], and the load-
displacement behavior of the actuators allowed accurate determination of bearing
strength.
7.3.4 Results
With the exception of one test on Panel A, the general behavior was the same for all
tests. The panels exhibited linear load-deflection behavior (following the initial non-
linearity due to the neoprene pads) up to the onset of end bearing failure. Following
end failure, the panels continued to bear load, though with greatly reduced stiffness,
until interior bearing failure occurred. The latter mode led to ultimate panel failure
in every case. In this section, qualitative descriptions of the bearing failure modes
are provided, followed by quantitative descriptions of the individual test results.
The observed end bearing failure mechanism is shown in Figure 7.7. Figure 7.7(a)
shows an end view of the webs, and Figure 7.7(b) shows a side view. Together the
photographs demonstrate that the failure mode qualitatively matches the expected
end failure mechanism (Figure 5.2), i.e. two yield lines meeting at a plastic hinge on
the lower face sheet. The bearing length ce is indicated to show the extent of the
damage. The webs lose their bearing capacity following the formation of the hinge,
so any residual panel strength comes from the foam. Although the foam crushed
119
(a)
(b)
Figure 7.7. Bearing failure mode: (a) end view, and (b) side view showing the location ofyield lines
120
Figure 7.8. Interior bearing failure mode with yield line
in the region near the failed webs, densification and the transfer of stresses into the
surrounding material allowed the bulk of the foam to carry additional loads.
The interior bearing failure mode, shown in Figure 7.8, resembled the interior web
crippling mode typically reported in the literature (e.g. [100]). As with end bearing
failure, it is characterized by the formation of yield lines meeting at plastic hinges. In
this case, however, damage to the web was accompanied by yielding of the compressed
face sheet, leading to ultimate panel failure. Interior bearing failure is not a concern
for simply supported roof panels; therefore, no analysis of the interior bearing failure
mode is provided here beyond a reporting of the observed strengths.
The load-deflection data for the bearing tests are plotted in Figure 7.9 for Panel
A and in Figure 7.10 for Panel B. Each figure has two plots corresponding to the
tests on each end of the panels. The loads corresponding to end and interior bearing
failure are indicated on the plots. The end failure load Q was determined by the same
procedure used to determine the shear buckling load in Section 7.2 (i.e. intersection
of line fits to the behavior before and after failure).
End 1 of Panel A had significant initial debonding between the webs and core material.
As a result, the behavior was very different from that observed in the other bearing
tests. The load-displacement results, plotted in Figure 7.9(a), indicate the behavior
121
(a)
(b)
Figure 7.9. Load vs. displacement for the tests on Panel A: (a) end 1 (containing an initialdebonding imperfection), and (b) end 2
122
(a)
(b)
Figure 7.10. Load vs. displacement for the tests on Panel B: (a) end 1, and (b) end 2
123
was approximately linear up to a load of 11.7 kN. At this point, the initial debonding
suddenly propagated deep in the x-direction. This propagation was accompanied by
shear buckling of the newly-debonded web. Bearing failure occurred along yield lines
immediately below the debond at a load of 13.0 kN and caused further propagation
of the debond, resulting in a sharp decrease in load. Following this behavior, the
panel continued to bear load until the test was stopped at a load of 15.7 kN due to
the onset of interior bearing failure.
End 2 of Panel A experienced end bearing failure at a load of 17.0 kN. A small limit
load occurred at 18.9 kN when the webs creased along the yield lines, leading to a loss
of web bearing capacity. Interior bearing failure occurred at 20.4 kN. The decrease
in load following the interior failure is non-smooth and non-monotonic because the
failure occurred via a series of incremental yielding and propagations of the debonded
region. This behavior was not observed in the tests on Panel B because interior
bearing failure occurred on that panel without debonding.
The test on end 1 of Panel B was paused for several minutes at a displacement of
21.7 mm for visual inspection. Because end failure of the web had commenced (at a
load of 33.1 kN), the damaged region continued to grow (due to foam creep below the
crippled web) during this period. The result, as seen in Figure 7.10(a), was a load
relaxation of about 2 kN. When the test was resumed, the load ramped quickly back
to the previous load (≈37.9 kN). Interior failure occurred at a load of 38.7 kN and
was ultimate. End failure occurred on end 2 of Panel B at a load of 33.6 kN. At a
load of about 41 kN, the load spreader block failed, and the panel was immediately
unloaded. The test was repeated following replacement of the spreader block by a
thicker laminated wood beam. Interior failure occurred at a load of 48.2 kN and was
ultimate.
7.3.5 Discussion
The observed bearing strengths Q are compared to the predicted strengths Qa in
Table 7.7. The accuracy of the predictions is assessed via the ratio of predicted to
observed strength, Qa/Q, also included in the table. The results indicate that the
model in this work overpredicts bearing strength by about 11% on average, although
the strength of Panel B was predicted more accurately than that of Panel A.
124
Table 7.7. Predicted (Qa) vs. observed (Q) bearing strength results
Test Qa Q Qa/QPanel A end 2 22.0 kN 17.0 kN 1.29Panel B end 1 34.0 kN 33.1 kN 1.03Panel B end 2 34.0 kN 33.6 kN 1.01
To understand the differences between the two prototypes, the results in terms of
Q/Qa are illustrated graphically in Figure 7.11. Multiple columns are given for each
panel. The first column shows the breakdown of the web and core contributions to
total strength, and the other columns compare test data to the predicted strengths.
In Panel A, the core contributes 77% of the predicted bearing strength. In Panel
B, the core contribution is 33% of the total strength. If the predicted contribution
Qw from web crippling is taken as exact, the results indicate the core contribution is
overestimated by about 18%. This result is consistent with that in Reference [100] for
web crippling with no foam, i.e. Equation (5.2) overpredicts Qw by 25% on average
if no reduction factor FR is applied.
Although the sample size in this work is limited, the results suggest the foam may re-
duce the variability in bearing strength compared that of webs with no foam. Roberts
and Newark [100] reported a spread of ±45% in observed web crippling strength. The
results in this work had a spread of ±14% which appears to be related at least in part
to the difference in relative web contribution between the two panels. The foam is
less sensitive than the webs to imperfections and is thus expected to provide a more
repeatable contribution to bearing strength than that of the webs.
7.4 Conclusions
The prototype tests reported in this chapter validated the models for the effect of core
material on the shear buckling and bearing strength of the webs in foam-filled panels.
The test described in Section 7.2 validated the deflection and shear buckling models,
both of which predicted the observed results to within 4%. The test also showed that
the postbuckling stiffness can be predicted with reasonable accuracy by assuming the
buckled webs do not contribute to panel stiffness. The latter result is useful as an
indication that shear buckling is not an ultimate failure mode in foam-filled panels
if the core material has sufficient shear strength. Although designs that exploit the
posbuckling capacity are not recommended due to the dependence on the foam, the
125
Figure 7.11. Predicted vs. observed bearing strength; the predicted strengths indicate therelative contribution from the webs (dark shading) and the core (hatched)
results suggest shear buckling in foam-filled panels is not as harmful as in empty
panels. More thorough investigation of the postbuckling behavior is recommended by
this work, as it may be reasonable to reduce the safety factors for shear buckling in
panel design.
The bearing strength of foam-filled panels was overestimated somewhat by the mech-
anism model developed in this work. Based on the breakdown of predicted strength
from the webs versus that from the foam, the results suggest the core contribution is
overpredicted by about 18%. The observed variability in strength was less than that
reported in the literature for webs with no foam. As a result, it may be possible to use
reduced safety factors (compared to current design code) in design as long as com-
pensation is made for the overestimation of foam strength. This compensation can
be achieved by reducing the calculated core contribution or (for panels with slender
webs) by neglecting the contribution from web crippling.
126
Chapter 8
Design of Two-Layer Web Core
Roof Panels
Insulated steel sandwich panels offer several advantages over conventional construc-
tion techniques for residential roof design, including improved energy efficiency, dura-
bility, decreased construction costs, and amenability to integrated solar panels or
other energy-saving technology. Web core panels (foam core panels with internal
webs) provide these benefits, but the webs have a substantial impact on thermal in-
sulating performance. The webs create a thermal bridge between the face sheets,
resulting in the need to use additional insulation to achieve a desired R-value. An
alternative concept investigated in this chapter is the two-layer web core panel, in
which thermal performance is provided in part by an additional insulating layer. The
impact of the insulating layer on panel performance is provided, as well as an inves-
tigation of the substantial tradeoff between total panel depth and weight. Minimum
weight designs are developed for three representative load conditions to investigate
the impact of the insulating layer on design. The designs are shown to also minimize
material cost because cost and weight are both sensitive to face sheet thickness. The
results show that, in some cases, two-layer panels allow reductions in weight and ma-
terial cost compared to panels with no external insulating layer. The reductions are
particularly significant when large loads are applied.
127
8.1 Introduction
Steel sandwich panels offer several advantages over conventional construction tech-
niques for residential roof design. These advantages include improved energy effi-
ciency [3, 5, 8] and durability [13], and decreased construction costs [9]. Foam core
panels (SIPs) have been used successfully in residential wall structures, but they are
ill-suited to meet the unique challenges of roof applications. Roofs are required to
sustain transverse loads over unsupported spans up to 6.8 m while simultaneously
providing thermal insulation. Foam core panels rely on the polymer foam core mate-
rial to provide transverse shear stiffness. Creep in the core material leads to excessive
deformations over the lifetime of a roof.
Web core panels, illustrated in Figure 8.1, are a solution to the limitations of foam core
roof panels. Web core panels are foam filled panels with thin metal webs connecting
the face sheets. The webs provide greater shear stiffness than the core material and are
not subject to creep. However, they create a thermal short between the face sheets,
leading to reduced thermal insulating performance. Additional insulating material
is necessary to compensate for the reduced thermal performance of the webs. The
additional material can be added to the core, as in Figure 8.1(a). It can also be added
as an external insulating layer, Figure 8.1(b). In the extreme case, Figure 8.1(c), the
insulating material is removed from the structural layer entirely. An example of such
a two-layer panel with a metal core is the truss core panel, for which roof designs
were developed in Reference [27].
The design considerations for web core panels with no external insulating layer, Figure
8.1(a), were investigated in Chapter 6. It was shown that roof panel designs are
determined by consideration of four limit states: thermal insulating performance,
panel deflection, face sheet buckling, and shear buckling of the webs. The thermal
performance and shear buckling strength are particularly limiting because large panel
(a) (b) (c)
Figure 8.1. Sandwich panel concepts for roofs: (a) web core, (b) two-layer web core, and(c) two-layer metal core
128
Figure 8.2. Two-layer web core panel geometry and coordinate system; the insulating layeris placed on the exterior or interior face of the structural layer depending on climate
depths are required to meet both requirements simultaneously. One way to reduce
the impact of the thermal requirement is to use web materials with low thermal
conductivity. For example, stainless steel webs allow reductions in core depth of up
to 90 mm compared to panels with carbon steel webs.
A potential drawback to the use of stainless steel webs is cost (the material cost
of stainless steel is 3.6 times that of carbon steel [18]). Other materials with low
thermal conductivity (e.g. composites) are likely also expensive and tend to have
lower stiffness than steel. The two-layer panel, Figure 8.1(b), is proposed in this
chapter as an alternative to the concept described in Chapter 6. The structural layer
is a foam-filled web core panel with carbon steel webs. The contribution to thermal
performance is significant but generally limited by the influence of the webs.
The geometry of two-layer web core panels is illustrated in Figure 8.2. The face sheet
and web thicknesses are tf and tw, and the web spacing is p. The structural layer
has a core depth hc, and the insulating layer has a depth he. The total foam depth
is thus H = hc + he. The insulating layer can be located on the exterior or interior
face of the panel. The choice of location is based on hygrothermal performance and
depends on climate [2]. As a rule of thumb, the insulating layer should be located
on the colder face to keep the interface between the structural and thermal layers
warm and thereby minimize the risk of condensation (leading to corrosion) within
the panel [139]. Thus, in warm (dry) climates, the foam is located on the interior
129
face. In cold climates, the foam is located on the exterior face. Two-layer panels
are not recommended for warm climates with high humidity due to the high risk of
condensation for either placement of the insulating layer [26].
This chapter is focused on the design of two-layer web core panels for roofs. The in-
fluence of the insulating layer on thermal and structural performance is investigated,
along with the resulting impact on feasible panel designs. A sensitivity analysis is
performed to investigate the tradeoff between panel depth and weight and to de-
termine a suitable approach to design. The approach is demonstrated through the
design of web core panels subject to the requirements of typical roofs in three US
climate zones. Because of the tradeoff between depth and weight, minimum material
cost is proposed as a design objective. Minimum cost designs are shown to match
the designs for minimum weight. The results in this chapter demonstrate that, with
carbon steel webs, two-layer panels allow reductions in weight, foam use, and material
cost compared to panels with no external insulating layer.
8.2 Design of Two-Layer Panels
It was demonstrated in Chapter 6 that roof panel design is dictated by four limit
states: thermal performance, panel deflection, face sheet buckling, and shear buckling
of the webs. The same considerations are applicable to the design of two-layer panels,
but slight modifications to the R-value and deflection models to account for the effect
of the insulating layer on the temperature distribution. The considerations related
to that effect are discussed in this section, along with validation of the the thermal
model and a discussion of the impact of the insulating layer on the feasible panel
design space.
8.2.1 Effect of the Insulating Layer on Panel Performance
The thermal insulating performance is evaluated by the R-value, which is a measure
of the resistance of the panel assembly to conductive heat transfer. Higher R-values
translate to improved energy performance by reducing the heating and cooling loads
in the interior space. The R-value is determined in this work using the isothermal
planes method for one-dimensional heat transfer [30]. In this method, the panel is
approximated as a thermal resistance network, illustrated in Figure 8.3. The temper-
atures of the interior and exterior faces are Ti and Te respectively. The temperature
130
Figure 8.3. Isothermal planes approximation for two-layer web core panels; each componenthas a thermal conductivity ki corresponding to a resistance Ri in the circuit diagram
Tm is assumed uniform along the entire interface between the structural and thermal
layers. The webs, core, and insulating material have thermal conductivity kw, kc, and
ke, respectively.
A key assumption of the present approach is that the interface temperature Tm is
uniform across the entire section. In reality, the webs provide a thermal short, and a
slight variation in Tm exists across the panel width (< 2◦C when the gradient across
the panel is 55◦C [74]). The implications of this variation for the accuracy of the
isothermal planes method are examined in Section 8.2.2.
The assembly in Figure 8.3 shows the webs, core, and insulaing layer have R-values
Rw, Rc, and Re, respectively. These R-values are given by
Rw =hckw
twp
, (8.1)
Rc =hc
kc
(1− tw
p
) , (8.2)
Re =heke. (8.3)
The overall R-value of the panel is found by combining the resistances, i.e.
R =(R−1w +R−1c
)−1+Re =
hc
kwtwp
+ kc
(1− tw
p
) +heke. (8.4)
In the present work, the same foam material is used in both the core and the insulating
layer, so ke = kc. Equation (8.4) shows that, in terms of thermal performance,
the foam is necessarily more effective in the insulating layer than in the structural
layer. The most effective use of foam in a web core panel is therefore one in which
131
the structural layer is designed independent of the thermal requirements and the
insulating layer is used to provide additional R-value as needed.
The analysis of panel deflection in Reference [29] includes a thermal contribution
due to the temperature gradient across the face sheets. The use of an insulating
layer affects panel deflection by reducing the thermal gradient across the structural
layer. Referring to Figure 8.3, the temperature difference across the structural layer
is ∆Ti = Ti − Tm, given by
∆Ti = ∆TRi
R, (8.5)
where ∆T = Ti−Te is the gradient across the whole panel, and Ri = (R−1w +R−1c )−1 is
the R-value of the structural layer. As the thickness he increases, thermal deflection
decreases. The use of an insulating layer does not affect the local buckling strength
of the face sheets and webs.
8.2.2 Validation of the Thermal Performance
The equations in the previous section were derived by lumping the panel assembly
into a one-dimensional heat transfer model. This approach is effective for determining
the R-value of panels with no external insulating layer, but it is not entirely accurate
for two-layer panels. The webs create thermal bridges through the structural layer
that result in variations in temperature along the interface with the thermal layer.
As a result, the problem is inherently two-dimensional, and the present approach
underestimates the R-value somewhat [74]. Given the importance of the thermal
requirement in determining feasible designs, it is desirable to understand the impact
of the temperature variations on the accuracy of the isothermal planes approach. To
that end, a finite element study of the thermal performance of two-layer panels was
performed.
Note that Equations (8.4) and (8.5) can be rearranged as
R
Ri
= 1 +Re
Ri
, (8.6)
∆Ti∆T
=Ri
R. (8.7)
The panel performance is expressed in terms of the structural layer properties to
allow for the limiting case of panels with no insulating layer. The work in this section
132
(a) (b)
Figure 8.4. Finite element model and boundary conditions for the analysis of thermal per-formance in two-layer panels: (a) schematic illustration with metal thicknesses exaggeratedfor clarity, and (b) typical mesh
is performed using carbon and stainless steel webs to illustrate the effect of web
properties on the accuracy of the present model.
The finite element model used for the present study is illustrated schematically in
Figure 8.4(a). It is a panel cross section of width p, centered in a web. The face sheets,
web, and insulating material are all modeled in ANSYS using PLANE77 elements.
The PLANE77 a quadrilateral thermal element that uses a quadratic shape function
and was chosen to provide accurate modeling of the thin metal sections with only
a few elements through the thickness. A uniform temperature Ti is applied on the
interior surface and a temperature Te is applied on the exterior surface. The planes of
symmetry (x = ±p/2) are modeled by imposing zero heat flux, i.e. T,x = 0. Carbon
and stainless steel webs are modeled, and the panel geometry is allowed to vary.
Figure 8.4(b) shows a typical mesh used in the analysis. The face sheets and webs
had 2 elements in the direction of thickness, and the rest of the panel was meshed
using 50 elements in the x-direction. The core was meshed using 40 elements in the
y-direction, and the insulating layer used 25 elements in the y-direction. The mesh
density in the core and insulating layer was varied so that the elements near the
boundaries were smaller than the elements in the centers. To check for convergence,
the analysis was repeated after doubling the mesh density. Both R and Tm changed
by 0.1% after refining, so the mesh in Figure 8.4(b) was deemed adequate.
133
The R-value of the panel assembly is determined from the calculated heat flux q′y at
the exterior surface. Following the circuit analogy for one-dimensional heat transfer,
the R-value of the panel assembly (per unit panel length) is
R =∆T
qyp, (8.8)
where qy is the total heat transfer across the surface, obtained by numerically inte-
grating q′y along the panel width.
Equation (8.5) is validated by averaging the temperature along the interface between
the structural and thermal panel layers (y = hc + tf ). The averaged interface tem-
perature Tm is
Tm =1
p
∫ p/2
−p/2T∣∣∣y=hc+tf
dx, (8.9)
and ∆Ti = Ti − Tm. Validation of ∆Ti is important because thermal deflection can
be an important concern in panel design (Chapter 6).
The R-value ratio R/Ri is plotted as a function of Re/Ri in Figure 8.5. For reference,
Equation (8.6) is plotted as a dashed line. For panels with carbon steel webs, the
model in this work predicts panel R-value to within 3%. In panels with stainless steel
webs, the model is accurate to within less than 1%. This result makes sense because
the thermal bridging effect of stainless steel webs is significantly less than that of
carbon steel webs.
The relative temperature drop ∆Ti/∆T across the structural panel layer is plotted
as a function of Ri/R in Figure 8.6, with Equation (8.7) included as a dashed line
for reference. As with the previous figure, the present model predicts ∆Ti to within
about 3% with carbon steel webs and to within less than 1% with stainless steel webs.
The temperature varies along the interface by up to 3◦C, consistent with the results
reported in Reference [74]. The variation in temperature decreases along with Ri/R,
reflecting the decreased ability for thermal shorts to affect R-value as the structural
layer contributes less to thermal performance. As a consequence, the accuracy in
∆Ti/∆T improves systematically as Ri/R decreases.
The results in this section indicate that the isothermal planes method accurately
predicts the thermal performance of two-layer web core panels. Although the interface
between the layers allows for two-dimensional heat transfer, the impact on R-value and
134
Figure 8.5. Plot of R-value ratio R/Ri vs. Re/Ri for panels with carbon and stainless steelwebs
Figure 8.6. Relative temperature gradient ∆Ti/∆T across the structural layer vs. Ri/R forpanels with carbon and stainless steel webs
135
Figure 8.7. Failure mode map for web core panels with a = 7 m, q = 1500 N/m2, andR = 5.3 m2-K/W (p = 1.2 m, tf = 2.0 mm); minimum depth designs for panels with andwithout an external insulating layer are indicated
temperature distribution is limited. Equations (8.4) and (8.5) are thus recommended
without modification for panel design.
8.2.3 Effect of the Insulating Layer on Feasible Designs
To understand the impact of the insulating layer on panel design, it is useful to
examine the influence of the failure modes—especially the R-value requirement—on
panel design. This influence is investigated by mapping the effect of each failure mode
on the feasible (tw,hc) design space (see Section 6.5). An example of a failure mode
map is plotted in Figure 8.7 for panels 7 m long, subject to an applied load of 1500
N/m2 and R-value requirement of 5.3 m2-K/W1. The curves for the minimum web
thickness to prevent shear buckling and the minimum core depth to satisfy the other
requirements are shown for panels with 2.0 mm face sheets and web spacing 1.2 m.
The minimum required core depths for panels with and without an external insulating
layer are indicated in Figure 8.7. For panels with no insulating layer, the core depth is
282 mm. That depth, determined by the thermal requirement, is much greater than
would be possible based on structural requirements only. If an external insulating
1Figure 8.7 is the same as Figure 6.6(b), but only the curves relevant to the present discussionare included.
136
layer is assumed, the core depth reduces to 176 mm, determined by the face sheet
buckling requirement. The structural layer for that design would have an R-value of
2.87. The required insulating layer depth is then 60 mm, so the total foam depth
H is 236 mm—a net reduction of 46 mm compared to the panel with no external
insulating layer.
The example in this section illustrates the potential for two-layer panels to reduce
the required foam use for a given R-value. This reduction is possible because the
insulating layer, which lacks the thermal bridging effect of the webs, is much more
efficient thermally than the structural layer. Note that foam is still necessary in the
structural layer to avoid designs with thick, closely-spaced webs, but this example
demonstrates that the structural layer can be designed without consideration for the
thermal requirements.
8.3 Minimum Weight Design
The weight W of two-layer web core panels is given by
W (tf , tw, hc, p, he) = 2γf tf + γwhctwp
+ γchc
(1− tw
p
)+ γehe, (8.10)
where γi = ρig is the specific weight of each component i. The minimum weight
optimization problem is given by
minimize W (tf , tw, hc, p, he)
subject to Fi ≤ ψiF i. (8.11)
The constraints, Fi ≤ ψiF i, require the panel geometry to meet all thermal and
structural performance criteria with safety factors ψi.
137
The nature of the minimum weight solution can be understood through a sensitivity
analysis, temporarily neglecting the constraints. The gradient ∇W is
∇W =
2γf
(γw − γc) hcp
γwtwp
+ γc
(1− tw
p
)hcptwp
(−γw + γc)
γe
. (8.12)
An order of magnitude evaluation of Equation (8.12) provides insight into the effect of
each geometric variable on panel weight. Assume the face sheet thickness varies by an
amount ∆tf . The resulting variation ∆W in panel weight is approximately W,tf ∆tf .
This process is repeated for each design variable—those that yield the largest values
for ∆W have the greatest influence on panel weight.
In steel panels with PUR core, ρf = ρw = 7870 kg/m3, and ρc = O(101) kg/m3
(e.g. ρc = 36 kg/m3 in this work). For typical designs, hc/p = O(10−1) and tw/p =
O(10−3). Thus,
∇W ≈
O(105)
O(103)
O(102)
−O(100)
O(102)
[N/m3]. (8.13)
The sheet metal thicknesses vary on the order of ±0.1 mm, and the core and insulating
layer depths vary on the order of ±10 mm. Thus, variations in tf and H (i.e. hc +he)
change the panel weight on the order of ±101 and ±100 N/m2 respectively. Changes
in the other variables have smaller effects on weight. The minimum depth required
to meet the deflection and face sheet buckling requirements decreases as face sheet
thickness increases. Thus, in the constrained optimization problem, Equation (8.11),
tf and H are inversely related. Because the sensitivity of panel weight to tf is so
much greater than the sensitivity to H, any weight reductions from using less foam
are more than offset by the corresponding increase due to the face sheets.
A tradeoff thus exists between weight and depth. To meet the deflection and face
buckling requirements with thin face sheets requires relatively deep cores. Minimum
138
Figure 8.8. Pareto optimal curve (weight W vs. panel depth H) for panels with a = 7 m,q = 1500 N/m2, and R = 5.3 m2-K/W (p = 1.2 m)
weight design is therefore achieved by using the thinnest allowable face sheets (e.g. 0.6
mm in this work), with hc as large as necessary to meet the structural requirements.
Conversely, core depth can be reduced by increasing face sheet thickness, and mini-
mum core depth is achieved using the maximum allowable face sheet thickness (2.0
mm). Naturally, the minimum depth design comes at a great cost in terms of weight:
assuming constant H, for example, an increase in tf from 0.6 to 2.0 mm causes an in-
crease in panel weight of 216 N/m2. Minimum depth and minimum weight represent
the limits of possible design objectives.
The tradeoff between weight and depth can be visualized by examining the Pareto
optimal curve (i.e. the locus of designs for which a reduction in one objective requires
an increase in the other) for typical designs. The Pareto curve for the example in
Section 8.2.3 is plotted in Figure 8.8. The endpoints of the curve represent designs
for minimum weight and minimum depth. The range of depths between those two
designs is 236–279 mm. The range of weights is much more dramatic: 203–401 N/m2.
Without a strong motivation for reducing the core depth (e.g. if the foam is much
more expensive than the steel), the corresponding weight increases cannot be justified.
A procedure for minimum weight panel design is suggested by the considerations in
this chapter. The use of an insulating layer allows the design of the structural layer
139
Figure 8.9. Flowchart of the minimum weight design procedure for two-layer web corepanels
without imposing R-value requirements. Thus, an effective design strategy is to vary
the structural depth hc and web spacing p and determine the sheet thicknesses based
on structural requirements. The insulating layer depth he then follows readily from
Equation (8.4).
The procedure described above has two independent variables: hc and p. To allow
efficient placement into a roof assembly, the values for p are restricted to integer incre-
ments of panel width. Because the minimum weight problem is convex, a convenient
strategy is to start with the largest allowable value for p and reduce until the panel
weight begins to increase. In each case, the value of hc is varied using a golden section
search to find the minimum weight. The remaining panel geometry is determined for
a given (hc, p) input based on structural and thermal requirements.
The procedure to determine panel geometry for a given (hc, p) combination is illus-
trated in Figure 8.9. Other inputs are the applied load, R-value, and panel length.
Face sheet thickness tf is determined from the face sheet buckling and deflection re-
quirements. The deflection is minimized by temporarily setting tw to the maximum
value of 2.0 (to minimize Ri, Equation (8.4)). If the face buckling requirement is more
limiting (i.e. requires thicker face sheets) than deflection, the web thickness tw < 2.0
mm is determined from the deflection and shear buckling requirements. The mini-
140
Table 8.1. Loads and R-values used for panel design
Load (N/m2) R-value (m2-K/W)Climate I 1576 5.3Climate II 2173 6.8Climate III 3322 6.8
mum tf and tw to meet the structural requirements in each case are determined using
bisection. The thickness he of the insulating layer is determined from the structural
layer geometry based on the thermal requirement. The total depth H is limited to
400 mm; therefore, a check on H is performed after determining he.
8.4 Roof Panel Designs
In this section, the effect of using an external insulating layer on design is illustrated
through a case study. Web core designs are developed for roof panels 6.8 m long, sub-
ject to three load conditions detailed in Table 8.1. The load conditions—designated
Climate I, II, and III—correspond to the loading and R-value requirements for lo-
cations in the southern, central, and northern US respectively [26]. The R-value
requirements are set by building code [71], and the loads are derived from ground
snow loads (958, 1915, and 3352 N/m2 respectively [43]) per Reference [140], assum-
ing a 6:12 roof pitch. Each load in the table also includes an allowance of 718 N/m2
for dead loads (panel weight plus finishing layers). A panel width of 2.4 m is assumed.
Several geometric constraints are imposed to improve manufacturability. To ensure
that cold-rolled steel can be used, the face sheet and web thicknesses are limited to
the range 0.6–2.0 mm. Based on handling and architectural requirements, the panel
depth H and weigh W are limited to 400 mm and 500 N/m2 respectively. Web spacing
is limited to integer increments of the total width.
Steel face sheets and webs are assumed, with the material properties given in Table
6.1. The core and insulating layer are assumed to be rigid polyurethane (PUR)
foam, with properties reduced to account for creep. The creep reductions depend on
duration of load: 2000 hours for live loads and 100,000 hours for dead loads [70]. The
nominal properties of the foam are given in Table 6.2 along with reduced properties
(based on Reference [34]) for live and dead load creep. Following the recommendations
141
Table 8.2. Minimum weight panel designs with carbon steel webs (all values in mm unlessotherwise noted)
tf tw hc p (m) he H Weight (N/m2)No external insulating layer
Climate I 0.60 0.66 285 1.2 0 285 205Climate II 0.60 0.71 379 1.2 0 379 243Climate III — — — — — — —
With external insulating layerClimate I 0.60 0.68 272 1.2 8 280 203Climate II 0.60 0.79 324 1.2 33 358 235Climate III 1.32 0.61 339 0.6 61 400 372
in Reference [102] (see Table 6.3), the safety factor for web shear buckling is 1.6, and
all other safety factors are set at 1.0.
The geometry of the minimum weight panels is given in Table 8.2 for web core panels
with and without an external insulating layer. Two-layer panels are thinner and
lighter weight than the corresponding web core designs with no insulating layer. The
reductions in W and H become more substantial as load is increased. Thus, while
the designs are nearly indistinguishable in Climate I, design for Climate III is possible
only with the use of two-layer panels. Correspondingly, the depth he of the insulating
layer increases with load from 8 mm in Climate I to 61 mm in Climate III. Referring to
Equation (8.4), the insulating layer provides 36% of the total R-value of the Climate
III design. In contrast, the thin insulating layer in the Climate I design contributes
only 6% of the total R-value. The use of such a thin foam layer is impractical from
a manufacturing standpoint, so the design with no insulating layer is recommended
for Climate I.
It is interesting to compare the minimum weight designs to corresponding designs
with minimum panel depth. Minimum depth designs are given in Table 8.3 for panels
with and without an external insulating layer. Note that the use of an insulating
layer allows considerable reductions in panel depth (64 and 91 mm in Climates I and
II) compared to designs with no insulating layer. Corresponding to the discussion in
the previous section, however, the two-layer panels are considerably heavier than the
panels with no insulating layer. The insulating layer provides most (≈70–80%) of the
R-value in the minimum depth designs.
142
Table 8.3. Minimum depth panel designs with carbon steel webs (all values in mm unlessotherwise noted)
tf tw hc p (m) he H Weight (N/m2)No external insulating layer
Climate I 0.60 0.66 285 1.2 0 285 205Climate II 0.60 0.71 379 1.2 0 379 243Climate III — — — — — — —
With external insulating layerClimate I 2.00 0.60 116 0.4 104 221 400Climate II 2.00 0.60 156 0.4 132 288 428Climate III 2.00 0.60 221 0.4 116 337 453
For panels with no insulating layer, the minimum depth design matches the mini-
mum weight design (compare Tables 8.2 and 8.3). The differences between the mini-
mum weight and minimum depth designs for two-layer panels emphasize the tradeoff
between depth and weight. Consistent with the preceding sensitivity analysis, the
minimum weight designs use thin (0.6 mm) face sheets (except in Climate III, where
thicker face sheets are necessary to meet the structural requirements). The minimum
depth designs use thick (2.0 mm) face sheets, which add almost 200 N/m2 to the
panel weight.
8.5 Material Cost
Given the significant tradeoff between depth and weight, it is informative to consider
alternative design objectives. A natural choice is cost, which can influence builder
acceptance of new roof concepts. A full economic analysis of a related panel concept
was recently performed at the University of Minnesota [2]. From this analysis it was
found that material costs are by far the most significant contribution, at ≈80% of the
total panel cost. Thus, the minimum cost design can reasonably be approximated
based on material cost.
The material cost C is determined by a modification of Equation (8.10):
C(tf , tw, hc, p, he) = 2κfγf tf + κwγwhctwp
+ κcγchc
(1− tw
p
)+ κeγehe, (8.14)
where κi is the cost per unit weight of each panel component i. The material costs
used in the present analysis are listed in Table 8.4. The cost per unit weight of PUR
143
Table 8.4. Web core component material costs κi per unit weight
is about 5.5 times greater than that of steel, so the most cost-effective designs may
involve heavier panels with less foam. As a design objective, Equation (8.14) takes
the same form as the minimum weight. Thus, the design for minimum material cost
is performed using the procedure described in this work
The designs for minimum material cost are detailed in Table 8.5 for panels with and
without an insulating layer. Comparison with Table 8.2 reveals that, in every case,
the minimum cost design matches the design for minimum weight. As such, the
minimum cost design recommendations match those for minimum weight, i.e. the use
of an external insulating layer is recommended for Climates II and III but not for
Climate I. An understanding of these results is obtained by sensitivity analysis. The
gradient ∇C of the material cost function is on the order of
∇C =
2κfγf
(κwγw − κcγc) hcp
κwγwtwp
+ κcγc
(1− tw
p
)hcptwp
(−κwγw + κcγc)
κeγe
≈
O(104)
O(102)
O(102)
−O(10−1)
O(102)
[$/m3]. (8.15)
As with weight, material cost is most sensitive to tf and H. In this case, variations
in each parameter change the panel cost on the order of ±100 [$/m2]. The two effects
are similar due to the high cost of the foam relative to the steel.
8.6 Comparison of Panel Concepts
To provide perspective on the roof panel concepts described in this chapter, minimum
cost designs for two-layer panels are compared to web core designs with stainless steel
webs with no external insulating layer. Based on these results, conclusions are made
regarding the effective use of material in web core roof panels. The designs are also
compared to truss core panel designs developed in Reference [27]. This comparison
144
Table 8.5. Panel designs with carbon steel webs and minimum material cost (all values inmm unless noted)
tf tw hc p (m) he H Cost ($/m2)No external insulating layer
Climate I 0.60 0.66 285 1.2 0 285 53.48Climate II 0.60 0.71 379 1.2 0 379 68.84Climate III — — — — — — —
With external insulating layerClimate I 0.60 0.68 272 1.2 8 280 52.78Climate II 0.60 0.79 324 1.2 33 358 65.45Climate III 1.32 0.61 339 0.6 61 400 81.94
Table 8.6. Minimum cost designs with stainless steel webs (all values in mm unless noted)
tf tw hc p (m) he H Cost ($/m2)Climate I 0.60 0.70 272 1.2 0 272 54.10Climate II 0.60 0.81 324 1.2 0 324 63.65Climate III 1.48 0.60 307 0.48 0 307 75.83
allows a first assessment of the cost-effectiveness of web core panels, as well as insight
into possible avenues of improvement for future designs.
The minimum cost designs for web core panels with stainless steel webs are given in
Table 8.6. All of the designs are developed without an external insulating layer. As
with the two-layer designs, the designs for Climates I and II also provide minimum
weight. In fact, the geometry of the structural layer is essentially the same for the
two concepts in Climates I and II. To understand this result, recall (Table 6.1) that
the thermal conductivity of stainless steel is about a third that of carbon steel, while
the elastic modulus is nearly the same. As a result, the minimum weight designs have
essentially the same structural geometry with either web material. The designs with
stainless steel webs meet the R-value requirements without an external insulating
layer, unlike the designs with carbon steel webs.
The designs for minimum material cost are summarized and compared in Table 8.7.
In addition to the designs from Tables 8.4 and 8.5, truss core panel designs from
Reference [27] for the same loading conditions are included. The total depth H, panel
weight W , and material cost C are provided. The web core designs for Climates I and
II weigh less than the truss core designs. In addition, the panel depths are comparable
or smaller for web core versus truss core panels in Climates I and II. These designs
145
Table 8.7. Summary of minimum material cost designs for each panel type; truss coredesigns from Reference [27] are included for comparison
illustrate the effectiveness of using core materials in the design of lightweight thin-
walled structures.
The web core designs for Climate III weigh more than the truss core designs due to
the effect of the thermal requirement. The designs for Climates I and II use thin
(0.6 mm) face sheets, which keep the designs lightweight. In Climate III, however,
the core depths hc up to 398 mm are necessary with such thin face sheets, and it is
impossible to meet the thermal requirement with H ≤ 400. Thicker face sheets are
necessary, and the panel weights are correspondingly higher.
An obvious result in Table 8.7 is the high cost of web core panels compared to truss
core panels. The material costs of the truss core designs are ≈$14–25/m2 less than
those of the corresponding web core designs. Insight into this result is gained by
examining the breakdown of material cost among the panel components. The con-
tributions of the face sheets, core, webs, and insulating layer for each minimum cost
design, including panels with carbon steel webs and no external insulating layer, are
plotted in Figure 8.102. In the web core designs, the foam is by far the most expensive
panel component, contributing 60–90% of the total material cost. Truss core panels,
in contrast, use almost 50% less foam than web core panels.
2For the truss core designs, the costs are given only in terms of the structural layer and theinsulating layer
146
Figure 8.10. Material cost for each panel concept; the three columns correspond to ClimatesI, II, and III respectively
An important caveat must be noted in the comparison of material costs between truss
core and web core panels. The truss core designs use V-shaped channel webs, with a
spacing of 0.4 m [27]. The V-channels require three welds per web (compared to two
welds per web core web), and more webs per panel compared to any of the minimum
cost web core designs. These differences have a large potential impact on manufactur-
ing costs. To achieve a production volume of 50,000 truss core panels/year requires
seven welding machines [2]. Applying the same capacity assumptions to web core
panels with p = 1.2 m, the same production volume is achieved using two machines.
The five extra machines for truss core panels require significant capital investment, as
well as additional workers and operating expenses. Furthermore, as noted in Chapter
1, the wide web spacing allows the possibility of simplified production processes. It
may be economical, for example, to produce foam core panels 1.2 m wide and use
webs as panel-to-panel joints. The impact of these manufacturing scenarios has not
been studied in the present work, but they create a real possibility that the final cost
of web core panels may be competitive with that of truss core panels.
Focusing on web core designs, Figure 8.10 suggests recommendations for material
use in roof panels. Compared to designs with carbon steel webs and no external
insulating layer, stainless steel webs and two-layer designs allow reduced material
cost for Climates II and III. The designs with stainless steel webs have the lowest
cost in these cases. For Climate I, the lowest-cost option is the panel with carbon
147
steel webs and no insulating layer. These results lead to the conclusion that the use
of an insulating layer does not reduce the material cost of web core panels. The
difference in cost between the face sheets and core material is not great enough to
justify the use of thicker face sheets in place of a thick core. The use of stainless
steel webs, even at a cost of 3.6 times greater than carbon steel, is more effective in
reducing cost.
Reduction in foam cost is a clear avenue for future improvements to web core panel
design. The cost could be reduced either through the development of new, lower-
cost foam materials, or through the use of denser foam in the structural layer. The
latter possibility is of particular interest because the cost per unit weight of foam is
essentially independent of density. The stiffness and strength properties, however,
increase in a nonlinear way (see Equation 2.1). The potential thus exists to achieve
net reductions in weight and material cost by increasing core density, particularly if
low-density (i.e. low thermal conductivity) foam is used in the insulating layer. The
technology to foam higher-density PUR in-situ is not currently available, so it has
not been considered in the present work3.
8.7 Conclusions
Steel web core sandwich panels offer several benefits over conventional construction
methods for residential roofs. A challenge to the design of roof panels, however, is the
impact of the webs on thermal insulating performance. Traditional web core panels
compensate for this impact by increasing the core depth hc. This chapter proposes
an alternate approach, two-layer panels, to satisfying the thermal requirement while
exploiting the core material to achieve lightweight design.
The influence of the insulating layer on thermal and structural performance of web
core panels was investigated, along with the resulting impact on feasible panel designs.
The use of an insulating layer allows net reductions in panel depth by providing
thermal performance more efficiently than in the structural layer. Corresponding
reductions in panel weight are possible as a result. These reductions become more
significant as the applied load is increased. The effect of the insulating layer on
minimum depth design was also investigated. Two-layer panels achieve net reductions
3The comments about cost and in-situ foaming capability are from conversations with MichaelKrupa of BASF
148
of up to 91 mm in panel depth compared to designs with no insulating layer. A
significant tradeoff exists between depth and weight, however, and the minimum
depth designs are heavier than the minimum weight designs by up to ≈200 mm.
Minimum weight designs were developed for panels made of carbon steel and PUR,
subject to typical load conditions for the continental US. Two-layer panels provide
reductions in weight and depth compared to panels with no insulating layer. The
advantage of two-layer designs is particularly notable in Climate III, where designs
are not possible without the use of an insulating layer. In contrast, the benefit of
two-layer panels in Climate I is negligibly small. Based on these results, two-layer
panels are not recommended for Climate I, but they are recommended for Climates
II and III.
Designs for minimum material cost were also investigated in this chapter. The mate-
rial cost for each panel component is proportional to weight, so the resulting design
problem is solved in the same manner as with minimum weight. The minimum cost
design matches the minimum weight design. Even though the core material is by
far the most expensive panel component, it is not sufficiently expensive (compared
to the face sheets) to justify the use of thicker face sheets. Web core panels with
stainless steel webs are thinner and lighter weight than the corresponding two-layer
panel designs. In Climates II and III, they are also lower cost. In all three climates,
however, truss core designs have lower material cost than the web core designs. The
extra cost of the web core panels is due to the added foam use.
This chapter has demonstrated that web core panels are a viable option for resi-
dential roofs. Two methods to compensate for the effect of the webs on thermal
performance—the use of stainless steel webs and the use of an external insulating
layer—were proven viable. Based on material cost, two-layer panels are not recom-
mended for roofs. For Climate I, the recommended panel design uses carbon steel
webs, and for Climates II and III stainless steel webs should be used. The web core
panel designs for Climates I and II are thin and lightweight compared to the cor-
responding truss core designs. The drawback to the web core designs is the high
material cost associated with the use of added foam to achieve the required thermal
insulating performance. Reductions in foam cost are identified as a research area that
could potentially improve the cost competitiveness of web core designs.
149
Chapter 9
Conclusions
This work has examined the structural and thermal considerations for residential roof
design using steel web core sandwich panels. Steel panels offer several benefits over
conventional construction techniques, including improved energy efficiency, reduced
construction costs, increased durability, and architectural benefits. Web core panels
meet the structural and thermal requirements for roofs using steel webs and a polymer
foam core. Compensation for the effect of the webs on thermal performance is achieved
through increased core depth or by adding an external insulating layer. Thermoset
polymer foams are an ideal core material for roof panels because they provide good
thermal insulating performance as well as stiffness to improve the performance of the
webs. Rigid polyurethane has the additional benefit that it can be foamed in-situ,
bonding directly to the panel structure without the need for additional adhesives.
The webs must be thin and widely-spaced to minimize the detrimental effect on
thermal performance. Thin webs are subject to a variety of local failure modes, and
efficient panel design is possible only by understanding and exploiting the interaction
between the webs and core material to prevent these failure modes. To that end, this
work has focused on the development and validation of models for the strength of thin
webs in foam-filled panels. Two models were developed: an elastic foundation model
suitable to the analysis of local buckling modes (particularly shear buckling), and a
bearing strength model, for which the failure mechanism is primarily local crushing
of the core material. Approaches to the design of web core roof panels, with and
without an external insulating layer, were also developed.
150
9.1 Conclusions
The shear buckling strength of the webs is successfully predicted by treating the
webs as plates on a Pasternak elastic foundation. The Pasternak foundation model
is especially suitable for panels with wide web spacing because the influence of shear
stiffness is significant in deep foundations. In addition to the analytical buckling solu-
tion, which was previously not available in the literature, closed-form approximations
were developed for square and infinitely long plates. These approximations match the
analytical solutions with very good accuracy and can be used to find upper and lower
bounds on buckling strength. The approximation for long plates is useful for design
because the buckling strength converges quickly to that of infinitely long plates in
webs with aspect ratio a/hc ≥ 4. Roof panel webs exceed this aspect ratio in practice
(a/hc ≥ 8 for all designs in this work), so the webs can reasonably be treated as
infinitely long.
Another key element of the shear buckling model is the determination of suitable
foundation parameters based on the properties of the core material. A model was
developed in this work using energy methods and validated using finite element anal-
ysis. Applying the resulting foundation constants to the analytical shear buckling
solution results in very accurate strength predictions for plates resting on sufficiently
deep (Hk ≥ 2, see Chapter 4) foundations. The effectiveness of the plate buckling
model for web core panels was also investigated. The webs are slightly stronger than
predicted by the model. This difference is attributable to the assumption of simply
supported webs at the interface with the face sheets. In practice, the face sheets pro-
vide some rotational restraint, thus strengthening the webs. The difference in strength
is small (less than 25%) and, given the large safety factors typically prescribed for
shear buckling [102], can reasonably be neglected for design.
A mechanism model for bearing strength was developed that accounts for the inter-
actions between the face sheets, webs, and core material, thus providing insight into
the influence of each material on bearing strength. A particularly interesting result
is the contribution of core crushing strength, which accounts for up to 80% of the
total bearing strength in panels with thin webs. The form of the model also suggests
a straightforward modification of existing empirical design code equations to account
for the core material. The modified AISI model predicts bearing strength within
about 15% of that predicted by the hinge model. The difference between the models
151
is primarily due to the assumptions about core crushing strength: the core crushing
prediction in the hinge model is based in part on the length of the damaged region in
the web after failure, while in the modified AISI model it is based on bearing length
only.
The shear buckling, deflection, and bearing failure models were validated through
prototype testing. The shear buckling strength was predicted by the present model
to within 4%. The deflection model in this work accurately predicted the panel
stiffness before and after the onset of shear buckling. The model overpredicted bearing
strength by up to 29% for the tests reported in this work. Based on the breakdown
of expected contributions from the webs and core material, the results suggest the
model in this work overestimates the foam crushing strength by about 18%. The
variability in strength is reduced, however, suggesting it may be possible to achieve
greater reliability in bearing strength compared to current practice by using a foam
in-fill.
Design procedures were developed for web core panels by examining the factors that
limit the range of feasible designs. For web core panels with no external insulating
layer, the thermal and shear buckling requirements limit the designs. These two
requirements have opposing effects on panel design—increasing web thickness causes
an increase in shear buckling strength and a decrease in thermal performance. As a
result, the core depth is sensitive to the choice of web material: panels with carbon
steel webs are typically about 100 mm deeper than panels with stainless steel webs.
The structural and thermal insulating layers of two-layer web core panels are designed
independently, thus allowing more design flexibility compared to panels with no ex-
ternal insulating layer. A consequence of this increased flexibility is a substantial
tradeoff between total panel depth and weight. A wide variety of Pareto optimal
designs for depth and weight are possible, and selection of an appropriate single ob-
jective function is useful for design. Minimum material cost was investigated in this
work as a reasonable approximation to minimizing the total panel cost. Given the
materials used in this work (steel, stainless steel, and 36 kg/m3 PUR foam), designs
for minimum material cost were developed for three US climate zones and a panel
length of 6.8 m (corresponding to a span of 6.1 m (20 ft) and 6:12 roof pitch).
The lowest-cost designs are the ones that also minimize panel weight. This result can
be understood through sensitivity analysis of the weight and cost objective functions.
152
The panel weight is much more sensitive to face sheet thickness than to the other
geometric variables, so minimum weight is achieved using thin face sheets and large
core depth (to meet the thermal requirement). Minimum core depth, in contrast, is
achieved using thick face sheets, resulting in high panel weight. The material cost of
each component is proportional to its weight. Although the cost of carbon steel used
for the face sheets is about a fifth that of the core material, the total material cost is
slightly more sensitive to face sheet thickness than to foam depth when carbon steel
webs are used.
The minimum cost designs with carbon steel webs are two-layer panels. As the applied
load or R-value requirement increases, the reduction in cost by using two-layer panels
increases. The minimum cost design with stainless steel webs in Climates I and II
have the same structural layer geometry as the two-layer designs with carbon steel
webs. The thermal conductivity of stainless steel is about a third that of carbon steel,
however, with the result that the stainless steel designs meet the R-value requirement
without an external insulating layer. The panels with stainless steel webs are thinner
and lighter-weight than the panels with carbon steel webs. In Climates II and III,
the designs with stainless steel webs have lower material cost as well.
The minimum cost designs were compared to truss core designs developed in Reference
[27] for the same loading conditions. Web core panels use more foam than truss core
panels and have 40–60% greater material costs as a result. The web core designs for
Climates I and II have weight and depth that are comparable to or lower than those
of the corresponding truss core designs. Thus, if considerations other than material
cost play a role in design, web core panels may become preferable for those climates.
In particular, it can be noted that the fabrication of the web core designs requires
substantially less welding (i.e. lower fabrication costs) than the truss core designs.
Thus, while material cost is a useful objective function for web core design, it may
not be suitable for comparing web core to truss core designs.
9.2 Recommendations for Future Work
The work described in this thesis suggests several avenues for future research. A key
area of improvement is the development of advanced foam technologies. In particular,
higher-density foams that can be formed in-situ are needed. The design space for roof
panels is limited by a combination of the thermal requirement, shear buckling, and
153
face sheet buckling. The use of higher-density foam cores provides increased buckling
resistance that can potentially more than offset the effect on thermal performance.
As a result, it may be possible to use less foam, especially for panels with carbon
steel webs. The development of stiffer or higher density in-situ foams would allow a
broader range of panel designs.
Another approach that should be investigated for roof panels is functionally graded
foams (i.e. foams with material properties that vary with location in the panel).
In web core panels, the foam has a structural role only in localized regions of the
panel—near the supports, for example. Reductions in total foam use may be possible
by using dense foam in locations to prevent buckling failure and low-density (opti-
mized for thermal conductivity) foam everywhere else. The technology to produce
structurally graded foams is currently very preliminary; however, the development
of new processing techniques (e.g. variation of foaming agent ratio and ultrasonic
irradiation [141]) could make the technology more amenable to mass production.
The test results reported in Chapter 7 suggest the possibility of residual postbuckling
capacity in shear and at the bearings. The bearing test results further suggest the
foam may reduce imperfection sensitivity in the webs, which may in turn allow the
use of smaller safety factors compared to current design practice. A complete study
of postbuckling behavior should thus be performed to gain understanding of these
two effects. The study should focus on the relationships of several variables to post-
buckling strength, including foam and web material properties, initial imperfections,
and localized damage (e.g. foam crushing and debonding). In addition, long-term
testing should be performed to characterize the effects of creep deflection and rupture
on postbuckling strength.
154
References
[1] US Department of Energy 2009 Buildings Energy Data Book.http://buildingsdatabook.eere.energy.gov, Accessed November 15, 2009.
[2] J. H. Davidson, S. C. Mantell, G. L. Di Muoio, G. Mittelman, C. Briscoe, B. Schoen-bauer, D. Huang, T. Okazaki, C. K. Shield, B. J. Siljenberg, J. C. Carmody,G. E. Mosiman, D. H. MacDonald, and P. Kalish. Advanced energy efficientroof system: DE-FC26-04NT42114 final report. Project report, available online atwww.osti.gov/servlets/purl/947089-XhPfAF, 2008.
[3] R. Hedrick. Costs & savings for houses built with ducts in conditioned space: Techni-cal information report. Technical Report 500-03-082-A-31, New Buildings Institute,2003.
[4] A. O. Desjarlais, T. W. Petrie, and T. Stovall. Comparison of cathedralized attics toconventional attics: Where and when do cathedralized attics save energy and operat-ing costs? In Performance of Exterior Envelopes of Whole Buildings IX InternationalConference, pages 1–15, Clearwater Beach, FL, 2004.
[5] A. Rudd. Field performance of unvented cathedralized (UC) attics in the USA. Jour-nal of Building Physics, 29(2):145–169, 2005.
[6] A. Rudd and S. Chandra. Side-by-side evaluation of a stressed-skin insulated-corepanel house and a conventional stud-frame house. Technical Report FSEC-CR-664-93, Florida Solar Energy Center, 1994.
[7] J. Christian. Ultra-low energy residences. ASHRAE Journal, 47(1):20–27, 2005.
[8] J. E. Christian, J. Atchley, L. Richards, H. Moon, and P. Childs. Energy efficiency,SIPS, geothermal, and solar PV used in near zero-energy house. ASHRAE Transac-tions, 112(2):275–284, 2006.
[9] M. A. Mullens and M. Arif. Structural insulated panels: Impact on the residen-tial construction process. Journal of Construction Engineering and Management,132(7):786–794, 2006.
[10] Manufactured Housing Research Alliance. Design for a cold-formed steel framed man-ufactured home. Technical report, Partnership for Advancing Technology in Housing,2002.
155
[11] M. Nowak, L. Bowles, J. Lyons, and C. Barbour. Research agenda: Advanced residen-tial roof systems. Project report, Partnership for Advancing Technology in Housing,2005.
[12] J. Nieminen and M. Salonvaara. Hygrothermal performance of light steel-framedwalls. Technical report, VTT Technical Research Centre of Finland, 2000.
[13] S. A. Chini and K. Gupta. A comparison between steel and wood residential framingsystems. Journal of Construction Education, 2(2):133–145, 1997.
[14] T. Hoglund and H. Burstrand. Slotted steel studs to reduce thermal bridges in insu-lated walls. Thin-Walled Structures, 32:81–109, 1998.
[15] T. Blomberg and J. Claesson. Heat transmission through walls with slotted steelU-girders. In International Conference on Steel in Green Building Construction, Or-lando, USA, 1998.
[16] G. Gedge. Structural uses of stainless steel—buildings and civil engineering. Journalof Constructional Steel Research, 64(11):1194–1198, 2008.
[17] N. R. Baddoo. Stainless steel in construction: A review of research, applications,challenges, and opportunities. Journal of Constructional Steel Research, 64(11):1199–1206, 2008.
[18] MEPS world steel prices. http://www.meps.co.uk/world-price.htm, Accessed Decem-ber 20, 2009.
[19] M. J. Kucirka. Analysis and design of sandwich panel residential roof systems. M.S.thesis, Massachusetts Institute of Technology, 1989.
[20] J. Crowley, L. Morse-Fortier, J. Dentz, M. Parent, L. J. Gibson, T. Tonyan, andL. Glicksman. Innovative materials and construction systems for energy-efficientbuilding envelopes. In Thermal Performance of the Exterior Envelopes of Buildings,volume 12, pages 105–113, 1995.
[21] M. A. Dweib, B. Hu, A. O’Donnell, H. W. Shenton, and R. P. Wool. All naturalcomposite sandwich beams for structural applications. Composite Structures, 63:147–157, 2004.
[22] M. A. Dweib, B. Hu, H. W. Shenton, and R. P. Wool. Bio-based composite roofstructure: Manufacturing and processing issues. Composite Structures, 74:379–388,2006.
[23] D. E. Thomas. Structural Analysis of Sandwich Panels for Residential Roof Construc-tion. M.S. thesis, University of Minnesota, 2005.
[24] D. E. Thomas, S. C. Mantell, J. H. Davidson, L. F. Goldberg, and J. Carmody.Analysis of sandwich panels for an energy efficient and self-supporting residentialroof. Journal of Solar Energy Engineering, 128(3):338–348, 2006.
156
[25] J. H. Davidson, S. C. Mantell, C. Briscoe, B. Schoenbauer, D. Huang, and J. Carmody.Options for an energy efficient panelized residential roof. In Solar 2007, pages 623–630, Cleveland, OH, 2007. American Solar Energy Society.
[26] S. C. Mantell, J. H. Davidson, G. L. Di Muoio, G. Mittelman, T. Okazaki, B. J.Siljenberg, C. K. Shield, G. E. Mosiman, J. C. Carmody, and D. H. MacDonald.Manufactured panelized roof system for residential buildings. In Scaling Up: BuildingTomorrow’s Solutions, 2009 ACEEE Summer Study on Energy Efficiency in Build-ings, Pacific Grove, CA, 2008.
[27] G. L. Di Muoio. Investigation of a Light Gage Steel Panelized Roof System for Resi-dential Applications. M.S. thesis, University of Minnesota, 2008.
[28] C. R. Briscoe, S. C. Mantell, and J. H. Davidson. Shear buckling in foam-filled webcore sandwich panels using a pasternak foundation model. Thin-Walled Structures,48(10):460–468, 2010.
[29] C. R. Briscoe, S. C. Mantell, J. H. Davidson, and T. Okazaki. Design procedure forweb core sandwich panels for residential roofs. Journal of Sandwich Structures andMaterials, In press doi: 10.1177/1099636210365441.
[30] ASHRAE Fundamentals. American Society of Heating, Refrigerating, and Air-Conditioning Engineers, Atlanta, GA, 2005.
[31] N. C. Hilyard, editor. Mechanics of Cellular Plastics. Macmillan, New York, 1982.
[32] N. C. Hilyard and A. Cunningham, editors. Low Density Cellular Plastics: PhysicalBasis of Behaviour. Chapman & Hall, London, 1994.
[33] L. J. Gibson and M. F. Ashby. Cellular Solids: Structure and Properties. CambridgeUniversity Press, New York, second edition, 1997.
[34] J.-S. Huang and L. J Gibson. Creep of polymer foams. Journal of Materials Science,26:637–647, 1991.
[35] T. Kilpelainen and P. Hassinen. Long-term behaviour and strength of EPS foamsandwich panels. In Nordic Steel Construction Conference, volume 2, pages 645–652,Malmo, Sweden, 1995. Swedish Institute of Steel Construction.
[36] M. Just. Ergebnisse experimenteller untersuchungen zum langzeitverhalten von pur-hartschaumstoff-stutzkernbauteilen und schlussfolgerungen fur die anwendung (theresults of an experimental investigation of the long-term behavior of building ele-ments utilizing a rigid plastic foam core and conclusions regarding their use). IfL-Mitteilungen, 22(3):95–104, 1983.
[37] D. Zenkert, editor. The Handbook of Sandwich Construction. North European Engi-neering and Science Conference Series. EMAS, Cradley Heath, UK, 1997.
[38] D. Zenkert, A. Shipsha, and M. Burman. Fatigue of closed cell foams. Journal ofSandwich Structures and Materials, 8:517–522, 2006.
157
[39] S. Abrate. Criteria for yielding or failure of cellular materials. Journal of SandwichStructures and Materials, 10(1):5–51, 2008.
[40] D. Benderly and S. Putter. Characterization of the shear/compression failure envelopeof rohacell foam. Polymer Testing, 23(1):51–57, 2004.
[41] J. M. Davies. Design criteria for sandwich panels for building construction. In Pro-ceedings of the ASME Aerospace Division, pages 273–284, 1997.
[42] J. M. Davies, editor. Lightweight Sandwich Construction. Blackwell, Oxford, UK,2001.
[43] 2003 International Residential Code for One- and Two-Family Dwellings. Interna-tional Code Council, Country Club Hills, IL.
[44] ASTM E 84-05: Standard Test Method for Surface Burning Characteristics of Build-ing Materials. ASTM International, West Conshohocken, PA, 2005.
[45] J. G. Abbott. Standard laboratory tests: How meaningful are they in assessing fireperformance of insulation materials? In Conference on Fire and Cellular Polymers,pages 199–218, 1986.
[46] J. M. Davies. Performance of sandwich panels in fire 1. onshore applications. InSandwich Construction 3, University of Southampton, 1996.
[47] J. Rakic. Fire rated insulated (sandwich) panels. Fire Australia, pages 33–37, May2003.
[48] J. Zicherman. Fire performance of foam-plastic building insulation. Journal of Ar-chitectural Engineering, 9(3):97–101, 2003.
[49] A. H. Landrock, editor. Handbook of Plastic Foams: Types, Properties, Manufactureand Applications. Noyes, Park Ridge, NJ, 1995.
[50] J. M. Davies. Core materials for sandwich cladding panels. In International Confer-ence on Building Envelope Systems and Technology, pages 299–306, Singapore, 1994.
[51] S. T. Lee and N. S. Ramesh, editors. Polymeric Foams: Mechanisms and Materials.CRC Press, Boca Raton, FL, 2004.
[52] D. Randall and S. Lee, editors. The Polyurethanes Book. Wiley, New York, 2002.
[54] R. J. Booth, C. DeRushie, and K. Liu. Protection of foam plastic thermal insulationin low sloped roofing systems. Journal of Thermal Envelope and Building Science,25(4):255–274, 2002.
[55] R. C. Wool and X. S. Sun. Bio-Based Polymers and Composites. Elsevier, London,2005.
158
[56] S. S. Narine, X. Kong, L. Bouzidi, and P Sporns. Physical properties of polyurethanesproduced from polyols from seed oils: II. foams. Journal of the American OilChemists’ Society, 84:65–72, 2007.
[57] A. Azim, A. M. Atta, and R. A El-Ghazawy. Synthesis of rigid polyurethane foamsfrom recycled poly(ethylene terephthalate) waste. Cellular Polymers, 25(1):35–48,2006.
[58] K. Ashida. Polyurethane and Related Foams: Chemistry and Technology. Taylor &Francis, Boca Raton, FL, 2007.
[59] N. Mills. Polymer Foams Handbook: Engineering and Biomechanics Applications andDesign Guide. Elsevier, Burlington, MA, 2007.
[60] S. T. Lee and D. Scholz. Polymeric Foams: Technology and Developments in Regula-tion, Process, and Products. Taylor & Francis, Boca Raton, FL, 2009.
[61] ASTM C-578-08: Standard Specification for Rigid, Cellular Polystyrene Thermal In-sulation. ASTM International, West Conshohocken, PA, 2008.
[62] ASTM E 1730-04: Standard Specification for Rigid Foam for Use in Structural Sand-wich Panel Cores. ASTM International, West Conshohocken, PA, 2004.
[63] ASTM C-591-08: Standard Specification for Unfaced Preformed Rigid Cellular Poly-isocyanurate Thermal Insulation. ASTM International, West Conshohocken, PA,2008.
[69] D. Klempner and K. C. Frisch, editors. Handbook of Polymeric Foams and FoamTechnology. Hanser, New York, 1991.
[70] ECCS. European recommendations for sandwich panels: Part I Design. volume TC7. European Convention for Constructional Steelwork, 1991.
[71] 2003 International Energy Conservation Code. International Code Council, CountryClub Hills, IL.
159
[72] A. C. Ugural and S. K. Fenster. Advanced Strength and Applied Elasticity. PrenticeHall, Upper Saddle River, NJ, fourth edition, 2003.
[73] J. Kosny and J. E. Christian. Thermal performance and wall ratings. ASHRAEJournal, 38(3):1–8, 1996.
[74] B. H. Schoenbauer. Thermal Analysis of Panels for Residential Roof Constructions.M.S. thesis, University of Minnesota, 2007.
[75] R. I. Kliger and P. J. Pellicane. Prediction of creep properties of chipboard used instressed-skin panels. Journal of Testing and Evaluation, 23(6):408–414, 1995.
[76] R. I. Kliger and P. J. Pellicane. Time-dependent bending properties of lumber. Journalof Testing and Evaluation, 24(3):187–193, 1996.
[77] S. Thelandersson and H. J. Larsen, editors. Timber Engineering. John Wiley & Sons,West Sussex, UK, 2003.
[78] J. A. Hartsock. Thermal warp of composite panels. Journal of Cellular Plastics,1(2):291–295, 1965.
[79] C. Libove and S. B. Batdorf. A general small-deflection theory for flat sandwichplates. NACA TR 899, 1948.
[80] N. J. Hoff. Bending and buckling of rectangular sandwich plates. NACA TN 2225,1948.
[81] J. R. Robinson. The buckling and bending of orthotropic sandwich panels with alledges simply-supported. Aeronautical Quarterly, 6(2):125–148, 1955.
[82] T. S. Lok and Q. H. Cheng. Elastic deflection of thin-walled sandwich panel. Journalof Sandwich Structures and Materials, 1(4):279–298, 1999.
[83] T. S. Lok and Q. H. Cheng. Elastic stiffness properties and behavior of truss-coresandwich panel. Journal of Structural Engineering, 126(5):552–559, 2000.
[84] A. Klanac. Bending of steel sandwich panels under lateral loading. Report M-285,Helsinki University of Technology Ship Laboratory, 2004.
[85] T. C. Fung, K. H. Tan, and T. S. Lok. Analysis of C-core sandwich plate decking.In Third International Offshore and Polar Engineering Conference, pages 244–249,Singapore, 1993. International Society of Offshore and Polar Engineers.
[86] T. C. Fung, K. H. Tan, and T. S. Lok. Shear stiffness DQy for C-core sandwich panels.Journal of Structural Engineering, 122(8):958–966, 1996.
[87] T. C. Fung, K. H. Tan, and T. S. Lok. Elastic constants for Z-core sandwich panels.Journal of Structural Engineering, 120(10):3046–3055, 1994.
[88] T. C. Fung and K. H. Tan. Shear stiffness for Z-core sandwich panels. Journal ofStructural Engineering, 124(7):809–816, 1998.
160
[89] H. Kolsters. Structural Design of Laser-Welded Sandwich Panels for Marine Appli-cations. Doctoral thesis, Royal Institute of Technology, 2004.
[90] G. Winter. Stress distribution in and equivalent width of flanges of wide, thin-wallsteel beams. NACA TN 784, 1940.
[91] F. B. Hildebrand and E. Reissner. Least-work analysis of the problem of shear lag inbox beams. NACA TN 893, 1943.
[92] C. Lertsima, T. Chaisomphob, E. Yamaguchi, and J. Sa-nguanmanasak. Deflection ofsimply supported box girder including effect of shear lag. Computers and Structures,84(1):11–18, 2005.
[93] S. P. Timoshenko and J. M. Gere. Theory of Elastic Stability. McGraw-Hill, NewYork, second edition, 1961.
[94] N. Pokharel and M. Mahendran. Experimental investigation and design of sandwichpanels subject to local buckling effects. Journal of Constructional Steel Research,59(12):1533–1552, 2003.
[95] N. J. Hoff and S. E. Mautner. The buckling of sandwich-type panels. Journal of theAeronautical Sciences, 12:285–297, 1945.
[96] F. J. Plantema. Sandwich Construction: The Bending and Buckling of SandwichBeams. Wiley, New York, 1966.
[97] H. G. Allen. Analysis and Design of Structural Sandwich Panels. Pergamon Press,Oxford, UK, 1969.
[98] S. Aimmanee and J. R. Vinson. Analysis and optimization of foam-reinforced web corecomposite sandwich panels under in-plane compressive loads. Journal of SandwichStructures and Materials, 4:115–139, 2002.
[99] W. Yu. Cold-Formed Steel Design. Wiley, New York, third edition, 2000.
[100] T. M. Roberts and A. C. B. Newark. Strength of webs subjected to compressive edgeloading. Journal of Structural Engineering, 123(2):176–183, 1997.
[101] J. Romanoff. Tayteaineen vaikutus teraksisen kerroslevypaneelin paikalliseen aari-lujuuteen (The effect of a filling material on the local ultimate strength of an all steelsandwich panel). Report M-256, Helsinki University of Technology Ship Laboratory,2000. In Finnish.
[102] North American Specification for the Design of Cold-Formed Steel Structural Mem-bers. American Iron and Steel Institute, Washington, DC, 2001.
[103] T. Okazaki, B. J. Siljenberg, C. K. Shield, and S. C. Mantell. Web crippling strength ofa steel sandwich panel with V-shaped webs. Journal of Constructional Steel Research,65(8-9):1721–1730, 2009.
[104] C. G. Salmon and J. E. Johnson. Steel Structures: Design and Behavior. HarperCollins, New York, fourth edition, 1996.
161
[105] R. V. Southwell and S. W. Skan. On the stability under shearing forces of a flat elasticstrip. Proceedings of the Royal Society A, 105(733):582–607, 1924.
[106] M. Stein and J. Neff. Buckling stresses of simply supported rectangular flat plates inshear. NACA TN 1222, 1947.
[107] B. Budiansky and R. W. Connor. Buckling stresses of clamped rectangular flat platesin shear. NACA TN 1559, 1948.
[108] I. T. Cook and K. C. Rockey. Shear buckling of rectangular plates with mixed bound-ary conditions. Aeronautical Quarterly, 14(4):349–356, 1963.
[109] D. J. Johns. Shear buckling of isotropic and orthotropic plates: A review. ARC R&M3677, 1971.
[110] A. S. Davies, J. M.and Fragos. Shear strength of empty and infilled cassettes. Thin-Walled Structures, 41:109–125, 2004.
[111] A. S. Davies, J. M.and Fragos. The local shear buckling of thin-walled cassettes infilledby rigid insulation. Journal of Constructional Steel Research, 60(3-5):581–599, 2004.
[112] E. Reissner. Note on the formulation of the problem of the plate on an elastic foun-dation. Acta Mechanica, 4:88–91, 1967.
[113] A. D. Kerr. On the determination of foundation model parameters. Journal ofGeotechnical Engineering, 111(11):1334–1340, 1985.
[114] L. Sironic, N. W. Murray, and R. H. Grzebieta. Buckling of wide struts/plates restingon isotropic foundations. Thin-Walled Structures, 35(3):153–166, 1999.
[115] C. J. Wiernicki, F. Liem, G. D. Woods, and A. J. Furio. Structural analysis methodsfor lightweight metallic corrugated core sandwich panels subjected to blast loads.Naval Engineers Journal, 103(3):192–203, 1991.
[116] C. Libove, S. Ferdman, and J. J. Reusch. Elastic buckling of a simply supported plateunder a compressive stress that varies linearly in the direction of loading. NACA TN1891, 1949.
[117] J. Zaras, J. Rhodes, and M. Krolak. Buckling and post-buckling of rectangular platesunder linearly varying compression and shear: Part 1 - theoretical analysis. Thin-Walled Structures, 14(1):59–87, 1992.
[118] G. Fauconneau and R. D. Marangoni. Natural frequencies and elastic stability of asimply-supported rectangular plate under linearly varying compressive loads. Inter-national Journal of Solids and Structures, 7:473–493, 1971.
[119] H. Hu, A. Badir, and A. Abatan. Buckling behavior of a graphite/epoxy compositeplate under parabolic variation of axial loads. International Journal of MechanicalSciences, 45:1135–1147, 2003.
162
[120] X. Chu, Z. Ye, R. Kettle, and L. Li. Buckling behaviour of cold-formed channelsections under uniformly distributed loads. Thin-Walled Structures, 43(4):531–542,2005.
[121] H. C. Bui. Buckling analysis of thin-walled sections under general loading conditions.Thin-Walled Structures, 47(6-7):730–739, 2009.
[122] A. D. Kerr. Elastic and viscoelastic foundation models. Journal of Applied Mechanics,31:491–498, 1964.
[123] K. Y. Lam, C. M. Wang, and X. Q. He. Canonical exact solutions for levy-plates ontwo-parameter foundation using Green’s functions. Engineering Structures, 22:364–378, 2000.
[124] J. Romanoff. The effect of a filling material on the local ultimate strength of an allsteel sandwich panel. Journal of Structural Mechanics, 35(1):19–39, 2001.
[125] M. Z. Khan and A. C. Walker. Buckling of plates subjected to localized edge loading.The Structural Engineer, 50(6), 1972.
[126] K. C. Rockey and D. K. Bagchi. Buckling of plate girder webs under partial edgeloadings. International Journal of Mechanical Sciences, 12(1):61–76, 1970.
[127] M. Elgaaly. Web design under compressive edge loads. AISC Engineering Journal,20(4):153–171, 1983.
[128] Commentary on North American Specification for the Design of Cold-Formed SteelStructural Members. American Iron and Steel Institute, Washington, DC, 2001.
[131] R. Loov and N. Parthasarathi. Study of shear provisions for stiffened plate girders.Canadian Journal of Civil Engineering, 31(1):160–167, 2004.
[132] T. V. Galambos. Guide to Stability Design Criteria for Metal Structures. Wiley, NewYork, fifth edition, 1998.
[133] ASTM C-393-06: Standard Test Method for Core Shear Properties by Beam Flexure.ASTM International, West Conshohocken, PA, 2006.
[134] A. D. Lanzo, G. Garcea, and R. Casciaro. Asymptotic post-buckling analysis of rect-angular plates by HC finite elements. International Journal for Numerical Methodsin Engineering, 38(14):2325–2345, 2005.
[135] ASTM A-123: Standard Specification for Zinc (Hot-Dip Galvanized) Coatings on Ironand Steel Products. ASTM International, West Conshohocken, PA, 2009.
[136] Zinc, Zn. MatWeb.com online materials database, October 27, 2009.
163
[137] ASTM A-370-09: Standard Test Methods and Definitions for Mechanical Testing ofSteel Products. ASTM International, West Conshohocken, PA, 2009.
[138] L. Fan, J. Rondal, and S. Cescotto. Finite element modelling of single lap screwconnections in steel sheeting under static shear. Thin-Walled Structures, 27(2):165–185, 1997.
[139] H. R. Trechsel. Moisture Analysis and Condensation Control in Building Envelopes.ASTM International, West Conshohocken, PA, 2001.
[140] ASCE/SEI 7-05, Minimum Design Loads for Buildings and Other Structures. Amer-ican Society of Civil Engineers, 2005.
[141] C. Torres-Sanchez and J. R. Corney. Toward functionally graded cellular microstruc-tures. Journal of Mechanical Design, 131(9), 2009.
164
Appendix A
Loads and R-Value Requirements
Design loads and R-value requirements for residential roofs are specified by building
codes. The specifications from the International Residential Code [43] and ASCE-
7 [140] are used in the present work to determine load requirements. The R-value
requirement is determined according to the International Energy Conservation Code
[71]. A full analysis of the live and dead load calculations is provided in Reference [2].
The results are summarized in this appendix.
A.1 Roof Loads
The roof load consists of two contributions: a live load due to snow and wind loading,
and a dead load due to the weight of the panel and any attached roofing and fixtures.
The snow, wind, and dead loads are combined in several manners as defined by code
[140], and the load combination with the highest resultant load is used. Provisions for
wind uplift resistance are also provided by the design code. The net wind uplift loads
are smaller than the live and dead loads, however. The strength of symmetric web
core panels is the same under snow and uplift loads, so the latter are not considered
in the present work.
The continental United States has been divided in the present project into three
climate zones based on snow loads, as illustrated in Figure 3.1. Climate I consists
of areas for which the ground snow load is less than 958 N/m2 (20 psf), Climate II
consists of areas with ground snow loads up to 1915 N/m2 (40 psf), and Climate III
consists of areas with ground snow loads up to 3352 N/m2 (70 psf). Two other regions
165
of interest are included in Figure 3.1. The areas colored white (mainly located in the
Rocky Mountain region) have large local variability in the snow loading and cannot
be readily lumped into any climate region. The hatched regions (mainly the gulf and
east coasts) are subjected to large wind uplift loads. Loading in this region is also
site-dependent, but the net loads are comparable to the live loads for Climate II [2].
The dead load includes the panel self weight (assumed to be less than 500 N/m2, 10.4
psf), plus exterior roofing, felt vapor barrier, and an interior gypsum board (required
for fire protection [43]) and fasteners. The weight of the components is assumed to
be 218 N/m2 (4.6 psf), so the total assumed dead load is 718 N/m2 (15.0 psf) in all
three climates. To ensure that designs do not fail as a result of underestimating the
panel weight, the assumed maximum weight of 500 N/m2 has been set as a design
constraint throughout this work.
The design load for Climate I is based on the combination of dead plus 75% of
the snow and wind loads [2, 140]; the design load for Climates II and III is based
on the dead and snow load. The snow and dead loads are assumed to act due to
gravity, i.e. perpendicular to the ground. They are resolved into the component
acting perpendicular to the roof, which has a 6:12 pitch for all of the designs in this
work. The maximum wind load is 479 N/m2 (10.0 psf) throughout the US (excepting
the hatched regions in Figure 3.1), so the design loads for Climates I, II, and III are
1576, 2173, and 3322 N/m2 (32.9, 45.4, and 69.4 psf) respectively.
A.2 Thermal Requirement
The R-value requirement for insulated residential roofs is specified by building code
and is determined by the average heating degree days (HDD) at the building site
[71]. Heating degree days are defined relative to a base temperature (usually 65◦F,
18◦C)and are a way to quantify the coldness of a climate. The relationship between
R-value requirement and HDD is plotted in Figure A.1. The R-value requirement
ranges from 3.5 m2-K/W in regions with no HDD up to 7.0 m2-K/W in extreme cold
climates.
The heating degree days in the continental US vary from zero in the deep south up
to about 10,500. The R-value requirement corresponding to 10,500 HDD is 6.8 m2-
K/W. The thermal requirements in the present work are developed by dividing the
166
Figure A.1. R-value requirement vs. heating degree days (HDD), as specified by buildingcode [71]
Table A.1. Loads and R-value requirements for panels with a 6:12 roof pitch
Load (N/m2) R-value (m2-K/W)Climate I 1576 5.3Climate II 2173 6.8Climate III 3322 6.8
country into two regions: areas with less than 4400 HDD, which require R-5.3, and
areas with more HDD, which require R-6.8. The boundary between these regions
roughly corresponds with the boundary between Climates I and II. Based on the
considerations given in this appendix, the load and R-value requirements for web
core roof panels are given in Table A.1.
167
Appendix B
Non-Limiting Failure Mode Models
As noted in Chapter 3, two potential failure modes—flexural web buckling, and buck-
ling of the face sheet into the webs—were ruled out as limiting factors for web core
panel design. Models for these failure modes and the resulting implications on panel
design are presented in this appendix.
B.1 Flexural Buckling
The curvature of a loaded panel imposes a bending moment distribution on the webs.
The bending moment in turn causes a load distribution Nx along the transverse edges,
as illustrated in Figure B.1. The load distribution is described by
Nx = −N0
(1− αy
b
), (B.1)
where N0 is the maximum compressive load (located at y = 0) and α is a parameter
that defines the position of the neutral axis. The case α = 0 represents pure com-
pression, and α ≥ 1 represents bending, with the neutral bending axis located at a
distance b/α from the top edge (y = 0). For symmetric web core panels, the neutral
axis is at the midplane y = b/2, i.e. α = 2. As with the shear and face sheet buckling
models, the core material is modeled as a Pasternak elastic foundation.
Timoshenko [93] found the critical buckling load for simply supported plates (with no
foundation) under in-plane bending using the principle of minimum potential energy.
His approach is modified here to include the influence of a Pasternak foundation on
168
Figure B.1. Model used for determination of the web flexural buckling load
buckling strength. The von Karman governing equation in this case is
D∇4w = −(KWw −KP∇2w
)+Nxw,xx. (B.2)
The buckling strength is characterized by the critical load N0, given by [93]
N0 = χfbπ2D
b2, (B.3)
where χfb is the flexural web buckling coefficient. Unless otherwise noted, all other
variables in this section are as defined in Chapter 4.
The minimum potential energy approach requires that δU−δV = 0 (Equation (4.5)).
Approximating w by the double sine series, Equation (4.6), the strain energy U is
given by Equation (4.8). The work V is
V =1
2
∫ b
0
∫ a
0
[N0
(1− αy
b
)w2,x −KWw
2 −KP
(w2,x + w2
,y
)]dxdy. (B.4)
Evaluation of the integral in Equation (B.4) yields
V =ab
8
[N0
∞∑m=1
∞∑n=1
A2mn
m2π2
a2−KW
∞∑m=1
∞∑n=1
A2mn
−KPπ2
(∞∑m=1
∞∑n=1
(ma
)2A2mn +
∞∑m=1
∞∑n=1
(nb
)2A2mn
)]
− N0αa
4b
∞∑m=1
m2π2
a2
[b2
4
∞∑n=1
A2mn −
8b2
π2
∞∑n=1
∞∑i
AmnAmini
(n2 − i2)2
]. (B.5)
169
The final summation is taken only over values of i such that n± i is odd. Substitu-
tion of the terms into the minimum potential energy expression (4.5) yields a set of
equations of the form[ (m2 + n2β2
)2+ fWβ
4 + fPβ2(m2 + n2β2
)− χfb
(1− α
2
)m2β2
]Amn
− 8α
π2m2β2χfb
∞∑i
Amini
(n2 − i2)2= 0. (B.6)
As with shear buckling, the buckling coefficient is approximated by taking a subset
of these equations and solving for the minimum value of χfb to make the system
indefinite. Note that each of the Equations (B.6) contains terms relating to only
one value for m. The system can thus be divided into sub-groups of equations, each
containing a single value of m. If any sub-group is indefinite, the entire system is
indefinite [93]. As a result, the plate will buckle into mc repeating units in the x-
direction, i.e.
Amn = 0,∀m 6= mc. (B.7)
The value of mc is a function of β, fW , and fP and cannot be known a priori. A
useful implication of this property is the ability to determine the buckling coefficient
χfb,∞ for long plates by minimizing χfb with respect to β using an arbitrary value of
m. The results reported here for χfb,∞ are obtained in this manner.
Plots of the flexural buckling mode shape are provided in Figure B.2 for plates
with β = 2 and varying values of α and the foundation constants. The values of
α ∈ {0, 1.5, 2, 3} represent pure compression and bending located at depths b/3, b/2,
and 2b/3 from the top of the plate respectively (illustrated in the second column for
clarity). The foundation parameters used in Chapter 4 are used. The elastic founda-
tion decreases the buckling wavelength in both the x- and y-directions. For the same
reasons discussed in Chapter 4, stiffer foundations result in smaller buckling wave-
lengths. The figure also shows that increasing α leads to increased buckling strength
(along with smaller wavelengths in the y-direction). This result occurs because in-
creasing α means a smaller portion of the plate is loaded in compression and a larger
portion is loaded in tension, both of which effects have a stabilizing effect on the plate
as a whole.
170
Figure B.2. Buckling mode shapes with varying elastic foundation stiffness and α (β = 2)
Figure B.3. Long plate flexural buckling coefficient χfb,∞ vs. fW for fW /fP = 10 and 15;α = 0, 1, and 2
171
The long plate flexural buckling coefficient χfb,∞ is a function of α, fW , and fP . No
attempt was made in the present work to develop a general closed-form equation for
this relationship.
A plot of χfb,∞ versus fW is given in Figure B.3 for α ∈ {0, 1, 2} and two values
of fW/fP : fW/fP = 10 (typical of slender plates on an isotropic foundation), and
fW/fP = 15 (typical of slender plates and the PUR foam used throughout this work).
From the plot it can be seen that χfb,∞ is a function of α in addition to fW and fP .
No attempt was made in the present work to develop a general closed-form equation
for this relationship.
The applied load N0 on the web is obtained from the maximum bending moment on
the web. The web and face sheets act in parallel to resist panel bending, so N0 can
be approximated by
N0 =Dx,w
Dx,f
σf tw ≈qa2t2w48pt2f
, (B.8)
where Dx,f and Dx,w are the first and second terms on the right hand side of Equation
(6.5). The fraction in Equation (B.8) is thus the ratio of web stiffness to face sheet
stiffness in bending. For the designs presented in this work, the face sheets contribute
20–30 times as much as the webs to the total bending stiffness. Combining Equations
(B.3) and (B.8), the load q to cause flexural buckling failure is
q =48π2Dwt
2fp
a2t2wh2c
χfb, (B.9)
with χfb evaluated using the foundation parameters given by Equations (4.26) and
(4.27).
In the designs presented throughout this work, web thickness is consistently deter-
mined by the shear buckling requirement. Flexural and shear buckling affect the
web in different locations for panels under distributed load and can be considered
independent. Based on these considerations, flexural buckling is a concern only for
designs for which the shear buckling load is greater than the flexural buckling load.
Thus, it is possible to develop a sufficient condition for which the flexural buckling
strength is greater than the shear buckling strength. Comparing Equation (B.9) to
172
Equation (4.29), it can be seen that shear buckling will limit the design if
χfbχ∞
>t2wahc24p2t2f
. (B.10)
Consider a panel with tf = tw, a = 6.8 m, p = 0.6 m, and hc = 400 mm. This
geometry represents the design which is least likely to satisfy Equation (B.10). This
geometry requires χfb/χ∞ > 0.3, which is easily satisfied for roof panel designs
(χfb/χ∞ > 1.5 for cores with fW/fP = 15).
B.2 Buckling of the Face Sheet into the Webs
Salmon and Johnson [104] describe the analysis of web buckling under the action of
face sheet stresses, as well as methods for dealing with it according to prescriptive
steel design codes. The analysis is adapted here to account for the effect of the foam
in a web-core panel. The model for face sheet induced web buckling is illustrated in
Figure B.4. Figure B.4(a) shows the development of face sheet stresses due to panel
curvature. The stresses act at an angle dθ with respect to the web. As shown in
Figure B.4(b), the face sheet bending stress σf induces a compressive normal stress
σw in the webs acting over an area twdx. The longitudinal strain εf on the face sheets
is
εf =hc2
dθ
dx, (B.11)
so that, under small rotations dθ, the stress σw on the webs can be expressed as
σw =σfAfdθ
twdx=
2σfAftwhc
εf . (B.12)
The webs are modeled as simply supported columns, and the core is modeled as an
elastic foundation. Neglecting the the shearing contribution KP1, the buckling stress
σw is
σwtw =π2Ewt
3w
12h2cn2 +KW
h2cn2π2
, (B.13)
where hc/n is the buckling half-wavelength, and n is the integer that minimizes σw.
The foundation constant KW is given by Equation (4.23). Analogous to the plate
1Inclusion of the KP term increases the right hand side of Equation (B.15) by a factor 1 + tw/2,i.e. the effect on accuracy is negligible.
173
(a) (b)
Figure B.4. Buckling of the face sheet into the webs: (a) curvature of the web due to panelbending, and (b) distribution of compressive stress (denoted fc in the figure) on a webelement (Figures are from Reference [104])
buckling analyses in this work, the critical stress for infinitely long beams is found by
minimizing σw with respect to hc. The result is
σw =
√EwtwKW
3=
(EwEcGc
6
) 13
. (B.14)
Buckling of the face sheets into the webs is prevented if σw ≤ σw. If the bending
stress is less than the proportional limit of the face sheet material, εf = σf/Ef , and
the web buckling requirement is expressed as
2σ2fAf
Ef twhc≤(EwEcGc
6
) 13
. (B.15)
A conservative estimate of the buckling requirement is obtained by setting the face
sheet stress equal to the yield strength σyf . Then, noting that Af = tfp, Equation
(B.15) is restated as
twhctfp≥
2σ2yf
Ef
(6
EwEcGc
) 13
. (B.16)
174
Equation (B.16) can be used to rule out buckling of the face sheets into the webs as a
potential failure mode for web core panels based on material properties and the limits
of allowable geometry. If the condition imposed by Equation (B.16) is satisfied, this
failure mode cannot occur. If the condition is not satisfied, Equation (B.15) should
be used (with σf from Equation (6.13)) to ensure the design is safe.
Consider a panel with tw = 0.6 mm, tf = 2.0 mm, hc = 250 mm (the thinnest panels
likely to occur in practice), and p = 1.2 m. Assume steel face sheets and webs with
σyf = 225 MPa and PUR core with properties reduced to account for creep. Then
Equation (B.16) evaluates to 0.069 ≥ 0.015, i.e. the condition is satisfied. Buckling
of the face sheets into the webs is not a concern for web core roof panels.
175
Appendix C
Modeling of Shallow Foundations
The elastic foundation model in Section 4.3 is applicable to relatively deep or stiff
foundations, e.g. Equation (6.24). Although this condition is satisfied for all roof
panel designs in practice, it is interesting to note that the approach in Section C
can also be used to model shallow foundations. This appendix follows the approach
used in Section 4.3 to develop Pasternak foundation constants applicable to close web
spacing and compares the results to those obtained through finite element analysis.
The model for shallow foundations is illustrated in Figure C.1. This model matches
the one used for deep foundations (Figure 4.5), except the buckling deformation is
assumed to decay linearly with distance from the plate. In general, the deformation
will decay over a depth h ≤ H, where H is the total foundation depth as used in
Section 4.3. For convenience, the coordinate system is redefined so that the origin is
at the plane of zero deformation.
Figure C.1. Model for the determination of shallow foundation stiffness constants
176
Foundation constants are developed from this model using the principle of minimum
potential energy. The three strain energy components are given by
Uε =Ec2
∫ L
0
∫ h
0
w2,z dzdx =
α2EcL
4h, (C.1)
Uγ =Gc
2
∫ L
0
∫ h
0
w2,x dzdx =
π2α2Gch
12L, (C.2)
Uf =E
2
t3w12
∫ L
0
w2,xx
∣∣∣z=h
dx =π4α2Et3
48L3. (C.3)
The work W done by the applied force Q is
W =Q
2
∫ L
0
w2,x
∣∣∣z=h
dx =π2α2
4LQ. (C.4)
Setting W = Uε + Uγ + Uf and solving for Q yields
Q =π2Et3
12L2+Ech
L2
π2+Gch
3, (C.5)
from which the foundation constants are (see Equation (4.22))
KW =Ech, KP =
Gch
3. (C.6)
The depth h is found by minimizing Equation (C.5) with respect to h and L, yielding
h
t= 3
√3EcE
4G2c
≤ H
t. (C.7)
The inequality is used to emphasize that sufficiently shallow foundations have h = H.
The foundation model in Section 4.3 was validated using a finite element study. The
results of that study can also be used to validate the model in this appendix. Recall
that the finite element analysis yielded a set of buckling coefficients χβ as a function
of non-dimensional depth Hk, with k defined by Equation (4.25). Using the shallow
foundation model in this section, the ratio χ/χβ is plotted as a function of Hk in
Figure C.2. For comparison, the results from the deep foundation model (Figure 4.8
are included using a dashed line.
177
Figure C.2. Comparison of the shallow and deep foundation models vs. non-dimensionalfoundation depth Hk
For deep foundations, Hk > 2, the model in this appendix overestimates buckling
strength by about 16%. As described in Section 4.3, the decay of buckling deforma-
tion in the core is more accurately modeled by the exponential model. For shallow
foundations, the model predicts buckling strength to within 5%. The difference in
accuracy between the deep and shallow foundation models is striking, especially for
Hk ≤ 1.
Note that the two models never intersect in the figure: the deep foundation model
always predicts higher buckling strength than the shallow foundation model. Recall
that the linear and exponential models for decay of buckling deformation are limits to
the exact behavior, Equation (4.15). The decay function is not well approximated by
either simplification for foundation depths approximately in the range 1 ≤ Hk ≤ 2.
It is nonetheless interesting to note that the models in this work provide reasonable
accuracy for most purposes. For example, if the cutoff between the deep and shallow
foundation models is set at Hk = 2, the models predict buckling strength to within
5% over the full range of foundation depths.
178
Appendix D
Rigid Polyurethane Foam Data
Sheets
The following pages contain data sheets on all of the foams used in the present work.
The first sheet (pg. 180) is from the vendor’s nominal property data [66] (the full
data sheet contains several pages of processing data unrelated to the present work,
therefore not included here). The second data sheet (pp. 181–182) contains test
data from the foam sample taken from the shear buckling test. The last data sheet
(pp. 183–184) contains test data from the foam samples taken from the bearing failure
tests. On this data sheet, the foam from Panel A is labeled “#1” (with density 1.92
pcf), and the foam from Panel B is labeled “#2” (density 2.10 pcf).
Designs presented throughout this work are based on the material properties of the
foam from the shear buckling test (pp. 181–182). The compressive modulus was not
obtained by the vendors in that test, so the nominal value is used for design.