50
277 Technology Parkway • Auburn, AL 36830 NCAT Report 99-03 DESIGN OF NEW-GENERATION OPEN-GRADED FRICTION COURSE By Prithvi S. Kandhal Rajib B. Mallick Revised December 1999
| Date post: | 19-Jul-2018 |
| Category: |
Documents |
| Upload: | truonghuong |
| View: | 218 times |
| Download: | 0 times |

277 Technology Parkway • Auburn, AL 36830
NCAT Report 99-03
DESIGN OF NEW-GENERATIONOPEN-GRADED FRICTION COURSE
By
Prithvi S. KandhalRajib B. Mallick
Revised December 1999
DESIGN OF NEW-GENERATION OPEN-GRADED FRICTION COURSE
By
Prithvi S. KandhalAssociate Director
National Center for Asphalt TechnologyAuburn University, Alabama
Rajib B. MallickAssistant Professor
Worcester Polytechnic UniversityWorcester, Massachusetts
NCAT Report 99-03
Revised December 1999

i
DISCLAIMER
The contents of this report reflect the views of the authors who are solely responsible forthe facts and the accuracy of the data presented herein. The contents do not necessarily reflectthe official views and policies of the National Center for Asphalt Technology of AuburnUniversity. This report does not constitute a standard, specification, or regulation.
ii
ABSTRACT
Open-graded friction course (OGFC) has been used by several state departments oftransportation (DOT) since 1950. While many DOTs report good performance, many other statesstopped using OGFC due to unacceptable performance and/or lack of adequate durability. A vastmajority of the states reporting good experience use polymer modified asphalt binders and arelatively coarser aggregate gradation compared to the other states reporting unsatisfactoryperformance. Obviously, there is a need to develop an improved mix design procedure to helpthe highway agencies in successful use of OGFC.
The primary objectives of this study are to evaluate the performance of OGFC in the laboratorywith different gradations and types of additives, and recommend a rational mix design procedurefor the new-generation OGFC mixes.
Several polymers and fibers were used in OGFC mixes. The mixes were evaluated fordraindown, permeability, Cantabro abrasion, rutting, and moisture susceptibility. A tentative mixdesign system for the coarse new-generation OGFC has been recommended.
KEY WORDS: open-graded friction course, OGFC, mix design, polymer modified binder,fiber, draindown, abrasion, permeability, moisture susceptibility

Kandhal & Mallick
1
DESIGN OF NEW-GENERATION OPEN-GRADED FRICTION COURSE
Prithvi S. Kandhal and Rajib B. Mallick
INTRODUCTION
Open-graded friction course (OGFC) has been used since 1950 in different parts of the UnitedStates to improve the surface frictional resistance of asphalt pavements. OGFC improves wetweather driving conditions by allowing the water to drain through its porous structure away fromthe roadway. The improved surface drainage reduces hydroplaning, reduces splash and spraybehind vehicles, improves wet pavement friction, improves surface reflectivity, and reducestraffic noise. The Federal Highway Administration (FHWA) developed a mix design procedurefor OGFC (1) in 1974, which was used by several state departments of transportation (DOTs).While many DOTs reported good performance, many other states stopped using OGFC due tounacceptable performance and/or lack of adequate durability (2). However, significantimprovements have been made during the last few years in the gradation and binder type used inthe OGFC. Recently, a survey (3) on the experience of states with OGFC was conducted by theNational Center for Asphalt Technology (NCAT). Although experience of states with OGFC hasbeen varied, half of the states surveyed in this study indicated good experience with OGFC.More than 70 percent of the states which use OGFC reported service life of eight or more years.About 80 percent of the states using OGFC have standard specifications for design andconstruction. A vast majority of states reporting good experience use polymer modified asphaltbinders. Also, gradations of aggregates used by these states tend to be somewhat coarsercompared to gradations used earlier and gradations used by other states. It seems that gooddesign and construction practice is the key to improved performance of OGFC mixes. There is aneed to develop an improved mix design procedure to help the states in successful use of OGFC.A well-designed and well-constructed OGFC should not have raveling/delamination problemsand should reasonably retain its high permeability and macrotexture.
OBJECTIVE
The objectives of this study are to evaluate the performance of OGFC with different gradationsand types of additives, and recommend a rational mix design procedure for OGFC.
SCOPE OF WORK
The major performance problems associated with OGFC can be classified into two categories:raveling in OGFC and stripping in underlying asphalt courses. The major causes of raveling inOGFC are believed to be inadequate asphalt binder film thickness, excessive aging of binder,and loss of asphalt-aggregate adhesion under freeze-thaw conditions. When OGFC waspromoted by the Federal Highway Administration (FHWA) in the 1970s, many states eitheradopted FHWA’s mix design method (1) or used a recipe mix composition. Since polymermodified asphalt binders were not available at that time, and no fibers were used, design asphaltcontents in OGFC mixes were kept relatively low because of binder draindown problems duringstorage and/or transportation. Some states also experienced significant loss in permeability ofOGFC after 2-3 years because of clogging of voids by deicing materials or other debris.Delamination of OGFC from the underlying pavement course has also been reported.
The following questions were raised to develop a test plan for evaluating different gradations andadditives in this study:
1) What is a good gradation for OGFC to providea) adequate permeability to drain water quickly and maintain a reasonable
permeability during service life?

Kandhal & Mallick
2
Figure 1. Test Plan
b) adequate stability through stone on stone contact to minimize rutting?2) What kind of additive(s) is needed to
a) prevent draindown of binder at binder contents needed to provide sufficientbinder film thickness?
b) improve rutting resistance and decrease temperature susceptibility?c) resist excessive aging?
A flow chart for the laboratory study test plan is shown in Figure 1. In the first phase of the studyblends were prepared with gradation similar to and gradation coarser than the FHWArecommended (1) gradation for OGFC mixes. Table 1 and Figure 2 give the FHWA gradationand the other three new gradations evaluated in this study. The FHWA gradation has 40 percent
Kandhal & Mallick
3
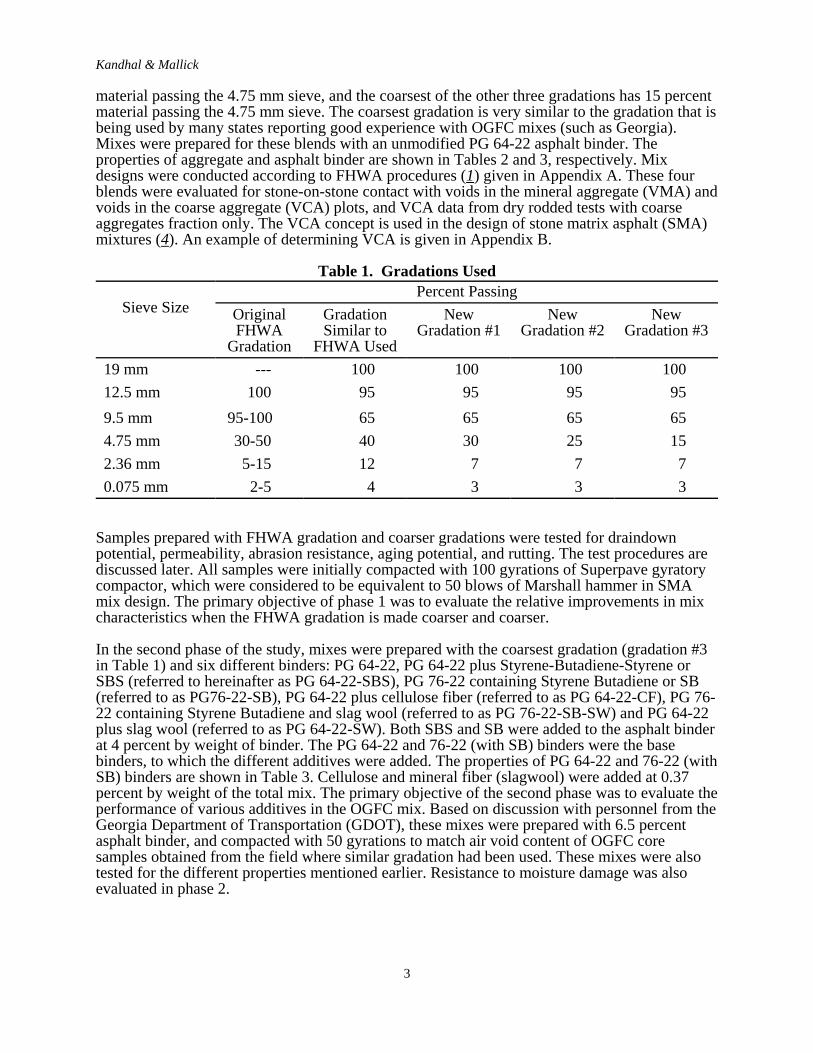
material passing the 4.75 mm sieve, and the coarsest of the other three gradations has 15 percentmaterial passing the 4.75 mm sieve. The coarsest gradation is very similar to the gradation that isbeing used by many states reporting good experience with OGFC mixes (such as Georgia).Mixes were prepared for these blends with an unmodified PG 64-22 asphalt binder. Theproperties of aggregate and asphalt binder are shown in Tables 2 and 3, respectively. Mixdesigns were conducted according to FHWA procedures (1) given in Appendix A. These fourblends were evaluated for stone-on-stone contact with voids in the mineral aggregate (VMA) andvoids in the coarse aggregate (VCA) plots, and VCA data from dry rodded tests with coarseaggregates fraction only. The VCA concept is used in the design of stone matrix asphalt (SMA)mixtures (4). An example of determining VCA is given in Appendix B.
Table 1. Gradations Used
Sieve SizePercent Passing
OriginalFHWA
Gradation
GradationSimilar to
FHWA Used
NewGradation #1
NewGradation #2
NewGradation #3
19 mm --- 100 100 100 10012.5 mm 100 95 95 95 959.5 mm 95-100 65 65 65 654.75 mm 30-50 40 30 25 152.36 mm 5-15 12 7 7 70.075 mm 2-5 4 3 3 3
Samples prepared with FHWA gradation and coarser gradations were tested for draindownpotential, permeability, abrasion resistance, aging potential, and rutting. The test procedures arediscussed later. All samples were initially compacted with 100 gyrations of Superpave gyratorycompactor, which were considered to be equivalent to 50 blows of Marshall hammer in SMAmix design. The primary objective of phase 1 was to evaluate the relative improvements in mixcharacteristics when the FHWA gradation is made coarser and coarser.
In the second phase of the study, mixes were prepared with the coarsest gradation (gradation #3in Table 1) and six different binders: PG 64-22, PG 64-22 plus Styrene-Butadiene-Styrene orSBS (referred to hereinafter as PG 64-22-SBS), PG 76-22 containing Styrene Butadiene or SB(referred to as PG76-22-SB), PG 64-22 plus cellulose fiber (referred to as PG 64-22-CF), PG 76-22 containing Styrene Butadiene and slag wool (referred to as PG 76-22-SB-SW) and PG 64-22plus slag wool (referred to as PG 64-22-SW). Both SBS and SB were added to the asphalt binderat 4 percent by weight of binder. The PG 64-22 and 76-22 (with SB) binders were the basebinders, to which the different additives were added. The properties of PG 64-22 and 76-22 (withSB) binders are shown in Table 3. Cellulose and mineral fiber (slagwool) were added at 0.37percent by weight of the total mix. The primary objective of the second phase was to evaluate theperformance of various additives in the OGFC mix. Based on discussion with personnel from theGeorgia Department of Transportation (GDOT), these mixes were prepared with 6.5 percentasphalt binder, and compacted with 50 gyrations to match air void content of OGFC coresamples obtained from the field where similar gradation had been used. These mixes were alsotested for the different properties mentioned earlier. Resistance to moisture damage was alsoevaluated in phase 2.

Kandhal & Mallick
4
0
10
20
30
40
50
60
70
80
90
100
0 0.2 0.4 0.6 0.8 1 1.2 1.4 1.6 1.8 2 2.2 2.4 2.6 2.8 3 3.2 3.4 3.6 3.8 4
Sieve Size
Perc
ent P
assi
ng
FHWA gradation, 40 % passing 4.75 mm sieve 30 % passing 4.75 mm sieve25 % passing 4.75 mm sieve 15 % passing 4.75 mm sieve
0.075 0.15 0.3 0.6 1.18 2.36 4.75 9.5 12.5 19
Figure 2. Gradations Used in the Study
Table 2. Properties of AggregatesAggregate Size Property Value
Granite Fine Bulk Specific Gravity 2.712Water Absorption, percent 0.63Fine Aggregate Angularity 49.5
Coarse Bulk Specific Gravity 2.688
Water Absorption, percent 0.58

Kandhal & Mallick
5
Table 3. Properties of PG 64-22 and 76-22 (with SB) Asphalt BinderAsphaltBinder(PG)
High Temperature properties Low Temperature Properties
TemperatureoC
OriginalDSR,G*/Sin *(kPa)
RTFOTDSR,G*/Sin *(kPa)
TemperatureoC
RTFOT+ PAV,DSR,G*Sin *(Mpa)
TemperatureoC
RTFOT + PAV
CreepStiffness,S (MPa)
m(slope)
64-22 64 1.784 3.258 22 4426 -12 240 0.317
76-22(withSB)
76 1.478 2.356 31 4450 -12 155 0.32
TEST PROCEDURES
The following test procedures were used in this study.
Voids in Coarse Aggregate (VCA)
Similar to stone matrix asphalt (SMA), the OGFC must have a coarse aggregate (retained on No.4.75 mm) skeleton with stone-on-stone contact to minimize rutting (4). The condition of stone-on-stone contact within an OGFC mix is defined as the point at which the voids in coarseaggregate (VCA) of the compacted OGFC mixture is less than the VCA of the coarse aggregatealone in the dry rodded test (AASHTO T19).
The VCA of the coarse aggregate only fraction (VCADRC) is determined by compacting the stonewith the dry-rodded technique according to AASHTO T19. When the dry-rodded density of thestone fraction has been determined, the VCADRC can be calculated using the following equation:
where:GCA = bulk specific gravity of the coarse aggregate (AASHTO T85)(s = unit weight of the coarse aggregate fraction in the dry-rodded condition
(kg/m3) (AASHTO T19)(w = unit weight of water (998 kg/m3)
An example of determining VCADRC and VCA (of the compacted OGFC mixture) is given inAppendix B.
Draindown Characteristics
The NCAT draindown test method (4) was used. A sample of loose asphalt mixture to be testedis prepared in the laboratory or obtained from field production. The sample is placed in a wirebasket which is positioned on a plate or other suitable container of known mass. The sample,basket, and plate or container are placed in a forced draft oven for one hour at a pre-selectedtemperature. At the end of one hour, the basket containing the sample is removed from the ovenalong with the plate or container and the mass of the plate or container is determined. Theamount of draindown is then calculated.

Kandhal & Mallick
6
This test method can be used to determine whether the amount of draindown measured for agiven asphalt mixture is within acceptable levels. The test provides an evaluation of thedraindown potential of an asphalt mixture during mixture design and/or during field production.This test is primarily used for mixtures with high coarse aggregate content such as porousasphalt (OGFC) and stone matrix asphalt (SMA). A maximum draindown of 0.3 percent byweight of total mix is recommended for SMA and is also considered applicable to OGFC. Thecomplete test method is given in Appendix C.
Permeability
The Florida DOT falling-head laboratory permeability test was used. The detailed test procedureis given in Appendix D.
Resistance to Abrasion
The resistance of compacted OGFC specimens to abrasion loss was analyzed by means of theCantabro test (5). This is an abrasion and impact test carried out in the Los Angeles abrasionmachine (ASTM Method C131).
In this test, an OGFC specimen compacted with 50 blows on each side is used. The mass of thespecimen is determined to the nearest 0.1 gram, and is recorded as P1. The test specimen is thenplaced in the Los Angeles Rattler without the charge of steel balls. The operating temperature isusually 25°C. The machine is operated for 300 revolutions at a speed of 30 to 33 rpm. The testspecimen is then removed and its mass determined to the nearest 0.1 gram (P2). The percentageabrasion loss (P) is calculated according to the following formula:
The recommended maximum permitted abrasion loss value for freshly compacted specimens is20 percent (5). However, some European countries specify a maximum value of 25 percent.
Resistance to abrasion usually improves with an increase in binder content. However, thisresistance is also related to the rheological properties of the binder. For a given gradation andbinder content, mixes containing unmodified binders generally have less resistance to abrasionthan mixes containing polymer-modified binders.
Aging
Both unaged and aged compacted OGFC were subjected to Cantabro abrasion test to evaluate theeffect of accelerated laboratory aging on resistance to abrasion. Because of very high air voidcontents the asphalt binder in OGFC is prone to hardening at a faster rate than dense-graded hotmix asphalt (HMA), which may result in reduction of cohesive and adhesive strength leading toraveling. Therefore, the mix design should be subjected to an accelerated aging test (5).
Aging was accomplished by placing five Marshall specimens compacted with 50 blows in aforced draft oven set at 60°C for 168 hours (7 days). The specimens are then cooled to 25°C andstored for 4 hours prior to Cantabro abrasion test. The average of the abrasion losses obtained on5 aged specimens should not exceed 30 percent, while no individual result should exceed 50percent.
Kandhal & Mallick
7
Freeze and Thaw Test for Resistance to Moisture Damage
Raveling of the OGFC may take place due to stripping in the mix, especially from freeze andthaw cycles in northern tier states with cold climates. Modified Lottman test (AASHTO T283)was used in this study. Instead of using one freeze/thaw cycle used for dense-graded HMA, 5cycles were used for OGFC. Since the air void content is higher in the OGFC compared todense-graded HMA, more severe conditioning was deemed necessary to evaluate the strippingpotential.
Rutting
The potential for rutting of OGFC was evaluated with the Asphalt Pavement Analyzer (APA)which is a modified version of Georgia loaded wheel tester. Cylindrical OGFC specimens wereloaded at 64°C (both dry and under water) for 8000 cycles and rut depth measured.
TEST RESULTS AND ANALYSIS
A summary of data and analyses used to develop the mix design system are presented in thefollowing sections.
Phase One
Two blends with coarse aggregate only were prepared according to the AASHTO T19 procedureto determine the dry rodded voids in coarse aggregate (VCADRC). Next, three blends wereprepared for each gradation with 15%, 25%, 30% and 40% percent passing 4.75 mm sieve. Asmentioned earlier, the 40% passing 4.75 mm sieve represented FHWA gradation and theremaining three gradations were all coarser than the FHWA gradation (Figure 2, Table 1). Since,in general, the NCAT survey indicated good performance of mixes with gradations coarser thanthe FHWA gradation (3), it was decided not to use any gradation finer than the FHWAgradation. Mixes were prepared with PG 64-22 asphalt binder and compacted with 100 gyrationsof the Superpave gyratory compactor (SGC). The asphalt contents were determined by theFHWA method (1) given in Appendix A. The FHWA method consists of the following steps: (1)determination of surface capacity of aggregate fraction retained on 4.75 mm sieve by oilabsorption method, and (2) determination of asphalt content from an empirical formula with thesurface constant (obtained in step 1). The following formula is used:
Table 4 gives the mix design data using the FHWA procedure. Unfortunately, the optimumasphalt content is based on the oil absorption of the material retained on 4.75 mm sieve only.Therefore, the optimum asphalt contents are very similar for all four gradations, which is notlogical. Obviously, the FHWA formula was developed for one gradation band.
The average air voids or voids in total mix (VTM), voids in mineral aggregate (VMA), voids incoarse aggregate (VCA), and voids filled with asphalt (VFA) data for the four different mixesare shown in Table 5. The VCADRC is also shown in Table 5. Plots of VTM, VMA, and VCA areshown in Figures 3 and 4. Although there is a difference of only 0.13% in asphalt contentbetween the mixes with four gradations, there is a significant range in voids (VTM, VMA andVCA). The VTM and VMA generally decrease with an increase in percent passing 4.75 mmsieve. Hence, the coarser the mix, the higher is the VTM and VMA. The dry rodded coarseaggregate VCA (VCADRC) falls between the compacted mix VCA values for gradations with15% and 25% passing the 4.75 mm sieve. This indicates that stone-on-stone contact begins

Kandhal & Mallick
8
10
11
12
13
14
15
16
17
18
19
20
0 5 10 15 20 25 30 35 40 45
Percent Passing 4.75 mm Sieve
Void
s in
Tot
al (M
ix V
TM,%
)
Figure 3. Percent Passing 4.75 mm Sieve Versus Voids in Total MixNote: Samples Compacted with 100 Gyrations of SGC
Table 4. FHWA Mix Design Data (Phase One)Gradation (% passing
4.75 mm sieve)Percent Oil Retained
(POR)Surface Constant,
KcAsphalt Content,
percent15 1.890 0.856 5.5525 1.839 0.836 5.5130 1.808 0.823 5.4840 1.724 0.789 5.42
Table 5. Summary of Mix Volumetric Properties
Gradation (% passing4.75 mm sieve)
AsphaltContent, %
TMD*Compacted OGFC Mix
VTM, % VMA, % VCA, % VFA, %
15 5.55 2.475 15.1 26.3 37.3 42.625 5.51 2.512 14.3 24.5 43.3 41.730 5.48 2.511 13.6 24.0 46.6 43.340 5.42 2.487 12.5 23.9 54.1 47.3
* TMD = Theoretical maximum density Dry rodded VCA = 41.7%.
Kandhal & Mallick
9
20
25
30
35
40
45
50
55
0 5 10 15 20 25 30 35 40 45
Percent Passing 4.75 mm Sieve
Void
s, %
VMA VCA
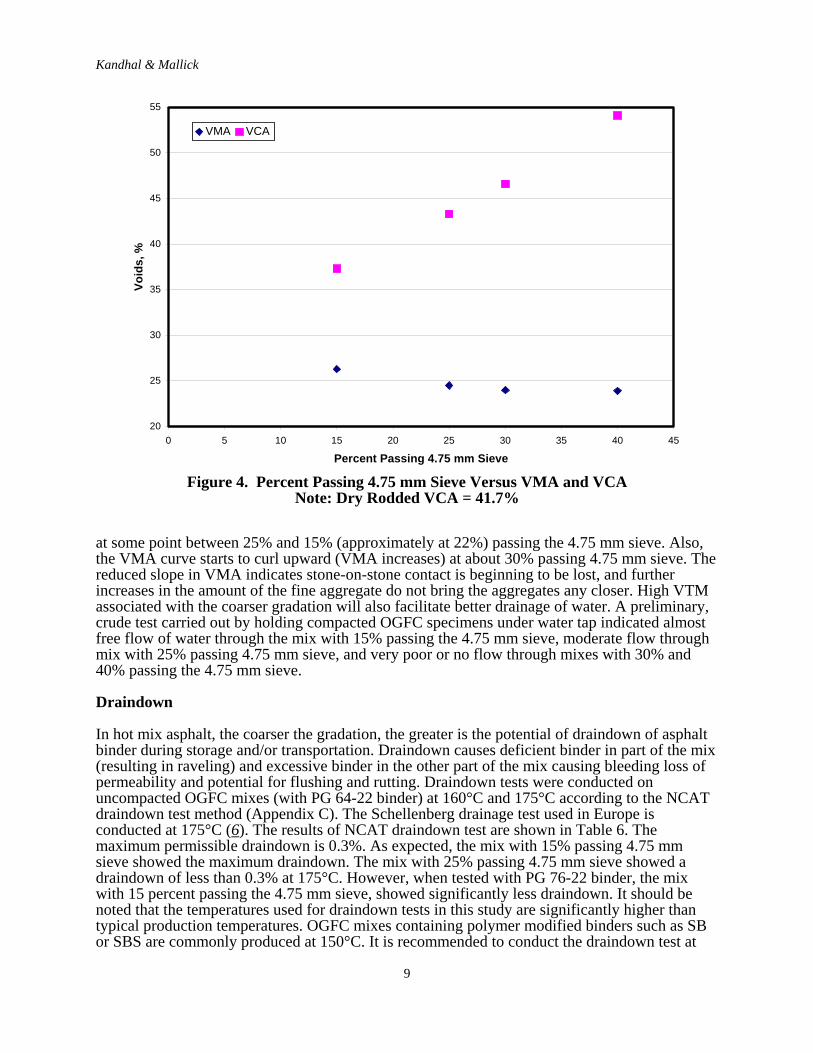
Figure 4. Percent Passing 4.75 mm Sieve Versus VMA and VCANote: Dry Rodded VCA = 41.7%
at some point between 25% and 15% (approximately at 22%) passing the 4.75 mm sieve. Also,the VMA curve starts to curl upward (VMA increases) at about 30% passing 4.75 mm sieve. Thereduced slope in VMA indicates stone-on-stone contact is beginning to be lost, and furtherincreases in the amount of the fine aggregate do not bring the aggregates any closer. High VTMassociated with the coarser gradation will also facilitate better drainage of water. A preliminary,crude test carried out by holding compacted OGFC specimens under water tap indicated almostfree flow of water through the mix with 15% passing the 4.75 mm sieve, moderate flow throughmix with 25% passing 4.75 mm sieve, and very poor or no flow through mixes with 30% and40% passing the 4.75 mm sieve.
Draindown
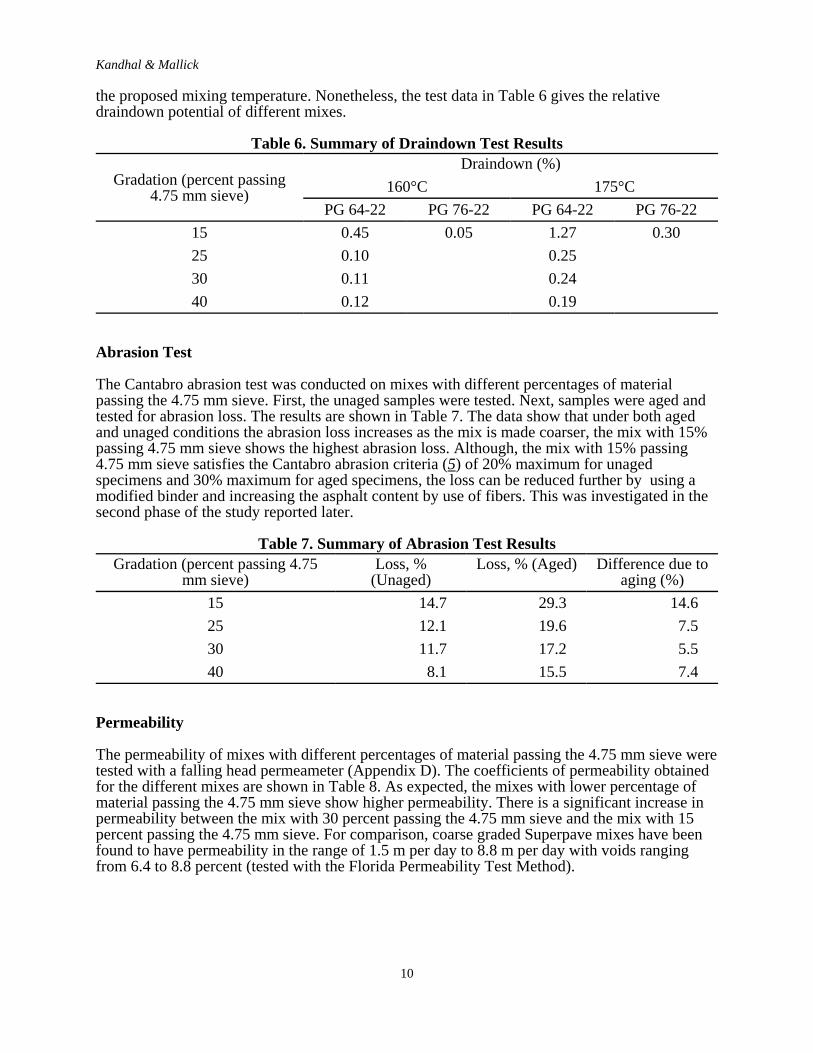
In hot mix asphalt, the coarser the gradation, the greater is the potential of draindown of asphaltbinder during storage and/or transportation. Draindown causes deficient binder in part of the mix(resulting in raveling) and excessive binder in the other part of the mix causing bleeding loss ofpermeability and potential for flushing and rutting. Draindown tests were conducted onuncompacted OGFC mixes (with PG 64-22 binder) at 160°C and 175°C according to the NCATdraindown test method (Appendix C). The Schellenberg drainage test used in Europe isconducted at 175°C (6). The results of NCAT draindown test are shown in Table 6. Themaximum permissible draindown is 0.3%. As expected, the mix with 15% passing 4.75 mmsieve showed the maximum draindown. The mix with 25% passing 4.75 mm sieve showed adraindown of less than 0.3% at 175°C. However, when tested with PG 76-22 binder, the mixwith 15 percent passing the 4.75 mm sieve, showed significantly less draindown. It should benoted that the temperatures used for draindown tests in this study are significantly higher thantypical production temperatures. OGFC mixes containing polymer modified binders such as SBor SBS are commonly produced at 150°C. It is recommended to conduct the draindown test at
Kandhal & Mallick
10
the proposed mixing temperature. Nonetheless, the test data in Table 6 gives the relativedraindown potential of different mixes.
Table 6. Summary of Draindown Test Results
Gradation (percent passing4.75 mm sieve)
Draindown (%)160°C 175°C
PG 64-22 PG 76-22 PG 64-22 PG 76-2215 0.45 0.05 1.27 0.3025 0.10 0.2530 0.11 0.2440 0.12 0.19
Abrasion Test
The Cantabro abrasion test was conducted on mixes with different percentages of materialpassing the 4.75 mm sieve. First, the unaged samples were tested. Next, samples were aged andtested for abrasion loss. The results are shown in Table 7. The data show that under both agedand unaged conditions the abrasion loss increases as the mix is made coarser, the mix with 15%passing 4.75 mm sieve shows the highest abrasion loss. Although, the mix with 15% passing4.75 mm sieve satisfies the Cantabro abrasion criteria (5) of 20% maximum for unagedspecimens and 30% maximum for aged specimens, the loss can be reduced further by using amodified binder and increasing the asphalt content by use of fibers. This was investigated in thesecond phase of the study reported later.
Table 7. Summary of Abrasion Test ResultsGradation (percent passing 4.75
mm sieve)Loss, %
(Unaged)Loss, % (Aged) Difference due to
aging (%)15 14.7 29.3 14.625 12.1 19.6 7.530 11.7 17.2 5.540 8.1 15.5 7.4
Permeability
The permeability of mixes with different percentages of material passing the 4.75 mm sieve weretested with a falling head permeameter (Appendix D). The coefficients of permeability obtainedfor the different mixes are shown in Table 8. As expected, the mixes with lower percentage ofmaterial passing the 4.75 mm sieve show higher permeability. There is a significant increase inpermeability between the mix with 30 percent passing the 4.75 mm sieve and the mix with 15percent passing the 4.75 mm sieve. For comparison, coarse graded Superpave mixes have beenfound to have permeability in the range of 1.5 m per day to 8.8 m per day with voids rangingfrom 6.4 to 8.8 percent (tested with the Florida Permeability Test Method).

Kandhal & Mallick
11
Table 8. Summary of Permeability DataGradation (percent passing 4.75
mm sieve)Permeability, m/day
15 11725 8830 2840 21
Rutting
Rut tests were conducted on the four mixes at design asphalt contents. The Asphalt PavementAnalyzer (APA) was used to rut the mixes under a wheel load of 445 N (100 lb), and a hosepressure of 690 kPa (100 psi). The mixes were tested at 64oC, since the PG grade of the asphaltwas PG 64-22. Table 9 shows the results of rut tests. The rut depths at 8,000 cycles do not showa wide range, nor does it show any particular trend with percent passing the 4.75 mm sieve.However, all of the rut depths are very small, less than 5 mm, and are considered acceptable.
Table 9. Summary of Rut DataGradation (percent passing 4.75
mm sieve)Rut Depth at 8000 cycles, mm
15 4.0525 3.8330 4.2940 3.41
Phase Two
In the next phase of the laboratory study, mixes were prepared with 15 percent passing the 4.75mm sieve and 6.5 percent asphalt content using six different binder/additive combinations. Testsamples for the six mixes were compacted with the SGC, using the number of gyrations requiredto achieve air voids closer to those found in the field at the time of construction (about 18percent).
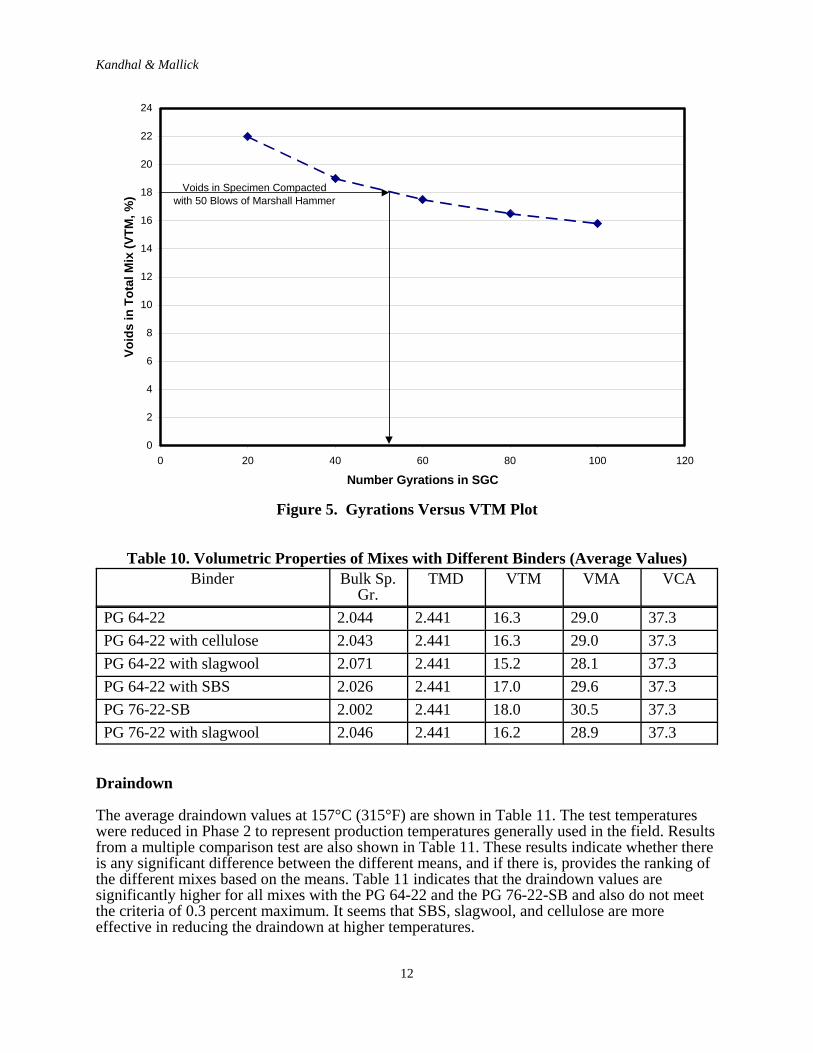
A study was carried out to determine the required number of gyrations. Three samples of eachmix were compacted with 100 gyrations of the SGC and 50 blows of Marshall hammer. The airvoids at different gyrations were compared to air voids generally found in the field and the airvoids of the sample compacted with 50 blows Marshall (Figure 5). It was determined that about50 gyrations with the SGC and 50 blows with the Marshall hammer produce about 18 percent airvoids generally found in the field. The mixes were prepared with six different types of binder asdescribed earlier: PG 64-22, PG 64-22-SBS, PG76-22-SB, PG 64-22-CF, PG 76-22-SB-SW andPG 64-22-SW. The samples were tested for volumetric properties, draindown, aging, rutting, andmoisture susceptibility. The volumetric properties are shown in Table 10. Results from othertests are discussed in the following paragraphs.
Kandhal & Mallick
12
0
2
4
6
8
10
12
14
16
18
20
22
24
0 20 40 60 80 100 120
Number Gyrations in SGC
Void
s in
Tot
al M
ix (V
TM, %
)
Voids in Specimen Compactedwith 50 Blows of Marshall Hammer
Figure 5. Gyrations Versus VTM Plot
Table 10. Volumetric Properties of Mixes with Different Binders (Average Values)Binder Bulk Sp.
Gr.TMD VTM VMA VCA
PG 64-22 2.044 2.441 16.3 29.0 37.3PG 64-22 with cellulose 2.043 2.441 16.3 29.0 37.3PG 64-22 with slagwool 2.071 2.441 15.2 28.1 37.3PG 64-22 with SBS 2.026 2.441 17.0 29.6 37.3PG 76-22-SB 2.002 2.441 18.0 30.5 37.3PG 76-22 with slagwool 2.046 2.441 16.2 28.9 37.3
Draindown
The average draindown values at 157°C (315°F) are shown in Table 11. The test temperatureswere reduced in Phase 2 to represent production temperatures generally used in the field. Resultsfrom a multiple comparison test are also shown in Table 11. These results indicate whether thereis any significant difference between the different means, and if there is, provides the ranking ofthe different mixes based on the means. Table 11 indicates that the draindown values aresignificantly higher for all mixes with the PG 64-22 and the PG 76-22-SB and also do not meetthe criteria of 0.3 percent maximum. It seems that SBS, slagwool, and cellulose are moreeffective in reducing the draindown at higher temperatures.

Kandhal & Mallick
13
Table 11. Results of Draindown Tests from Mixes with Different BindersDraindown at 157°C (315°F)
Duncan Grouping Mean (%) Asphalt BinderA 1.3585 PG 64-22A 1.1845 PG 76-22-SBB 0.5405 PG 64-22 with SBSB 0.1245 PG 76-22-SB with
slagwoolB 0.0510 PG 64-22 with slagwoolB 0.0040 PG 64-22 with cellulose
Aging Test
Samples of mixes prepared with different binders were tested with the Cantabro abrasion test todetermine the effect of aging. All of the samples were aged at 160oC for 168 hours (7 days).Table 12 shows the test values and the results of multiple comparison test. The results show thatthe mixes with unmodified PG 64-22 binder have the highest abrasion loss, and the mixes withPG 76-22-SW have the lowest abrasion loss, with the other mixes having values in between. Ingeneral, mixes with PG 64-22 plus SBS and the PG 76-22-SB binders show less abrasion thanmixes with the other binders. Although all mixes meet the maximum loss criteria of 30 percent,it appears that the combined use of polymer modified binder and fiber will minimize the abrasionloss from aging and thus increase the durability of the OGFC.
Table 12. Abrasion Loss (Aged Samples) for Mixes with Different Types of BinderDuncan Grouping Mean (%) Asphalt Binder
A 26.2 PG 64-22B A 19.3 PG 64-22 with slagwoolB A 18.8 PG 64-22 with celluloseB C 15.7 PG 76-22-SBB C 13.0 PG 64-22 with SBS
C 9.0 PG 76-22 with slagwool
Rutting Test
Rutting tests were conducted on samples of mixes with different binders with the APA usingidentical procedures as phase 1. Table 13 shows the means and the results of multiplecomparison test. The results show that in general mixes with PG 76-22-SB binder show lessrutting compared to mixes with PG 64-22 binder. Of the mixes with different PG 64-22 binders,the mixes with the unmodified binder showed the highest amount of rutting, while the one withSBS showed the least amount of rutting. The lowest rut depth was obtained in case of SBmodified PG 76-22 with slagwool. Again, the combined use of a polymer-modified binder andfiber resulted in the lowest rut depth.

Kandhal & Mallick
14
Table 13. Rut Depth for Mixes with Different Types of BinderDuncan Grouping Mean (%) Asphalt Binder
A 6.28 PG 64-22B A 5.24 PG 64-22 with celluloseB C 5.00 PG 64-22 with slagwoolB C 4.70 PG 64-22 with SBSD C 3.81 PG 76-22-SBD 2.70 PG 76-22 with slagwool
Moisture Susceptibility Test
Moisture susceptibility of mixes was evaluated by conducting tensile strength test onconditioned (5 freeze/thaw cycles) and unconditioned compacted samples (air voids 7±1percent). Table 14 shows the average values of tensile strength ratios obtained for the differentmixes. The results show that mixes with PG 64-22-SBS show the highest TSR (100 percent),whereas the mixes with unmodified PG 64-22 show the lowest TSR (below 70 percent). Ingeneral, all the mixes, except those with unmodified PG 64-22 and PG 64-22-SW show TSRvalues greater than 80 percent. It appears that both polymer-modified binder and fiber should beused especially in the northern tier states of the U.S., which experience cold climates andfreeze/thaw cycles.
Table 14. TSR Values for Mixes with Different BindersAsphalt Binder Mean (%)
PG 64-22 with SBS 100PG 76-22 with slagwool 98PG 64-22 with cellulose fiber 91PG 76-22-SB 87PG 64-22 with slagwool 75PG 64-22 62
CONCLUSIONS AND RECOMMENDATIONS
The following observations can be obtained from the laboratory study:1. A gradation with no more than about 20 percent passing the 4.75 mm sieve is
required to achieve stone-on-stone contact condition and provide adequatepermeability in OGFC mixes.
2. Mixes with 15 percent aggregates passing the 4.75 mm sieve are susceptible tosignificant draindown of the binder. Therefore, it is necessary to provide a suitablestabilizer such as fiber in the mix to prevent excessive draindown.
3. Abrasion loss of OGFC mixes resulting from aging can be reduced significantly withthe addition of modifiers. In this study, all of the modified binders had significantlylower abrasion loss than the unmodified binder. The use of both polymer-modifiedbinder and fiber can minimize the abrasion loss and thus increase the durability ofOGFC.
4. For the binders used in this study, rut depths as measured with the APA did not varyover a wide range. However, within the range of rut values obtained, the mixes withmodified binders had significantly less rutting than mixes with unmodified binders. A
Kandhal & Mallick
15
higher PG binder grade seems to have a greater effect in reducing rutting than a lowerPG binder grade. A polymer-modified asphalt with fiber gave the least amount ofrutting.
5. Moisture susceptibility, as measured by TSR values, is lower for mixes with modifiedbinders than mixes with unmodified binders. All of the modifiers except slagwool(with PG 64-22) produced mixes which had TSR values in excess of 80 percent.Again, both polymer-modified binder and fiber should be most effective especially incold climates with freeze/thaw cycles.
The following tentative mix design system is recommended for the new-generation OGFC mixeson the basis of conclusions from this study, observation of in-place performance of OGFC mixesin Georgia, and experience in Europe. The system can be refined further as more experience isgained in the future.
Step 1. Materials Selection
The first step in the mix design process is to select materials suitable for OGFC. Materialsneeded for OGFC include aggregates, asphalt binders, and additives. Additives include asphaltbinder modifiers, such as polymers and fibers.
Guidance for suitable aggregates can be taken from recommendations for SMA (4). The binderselection should be based on factors such as environment, traffic, and expected functionalperformance of OGFC. High stiffness binders, such as PG 76-xx, made with polymers arerecommended (5) for hot climates or cold climates with freeze-thaw cycles, medium to highvolume traffic conditions, and mixes with high air void contents (in excess of 22 percent). Theaddition of fiber is also desirable under such conditions and also have been shown tosignificantly reduce draindown. For low to medium volume traffic conditions, either polymermodified binders or fibers may be sufficient.
Step 2. Selection of Design Gradation
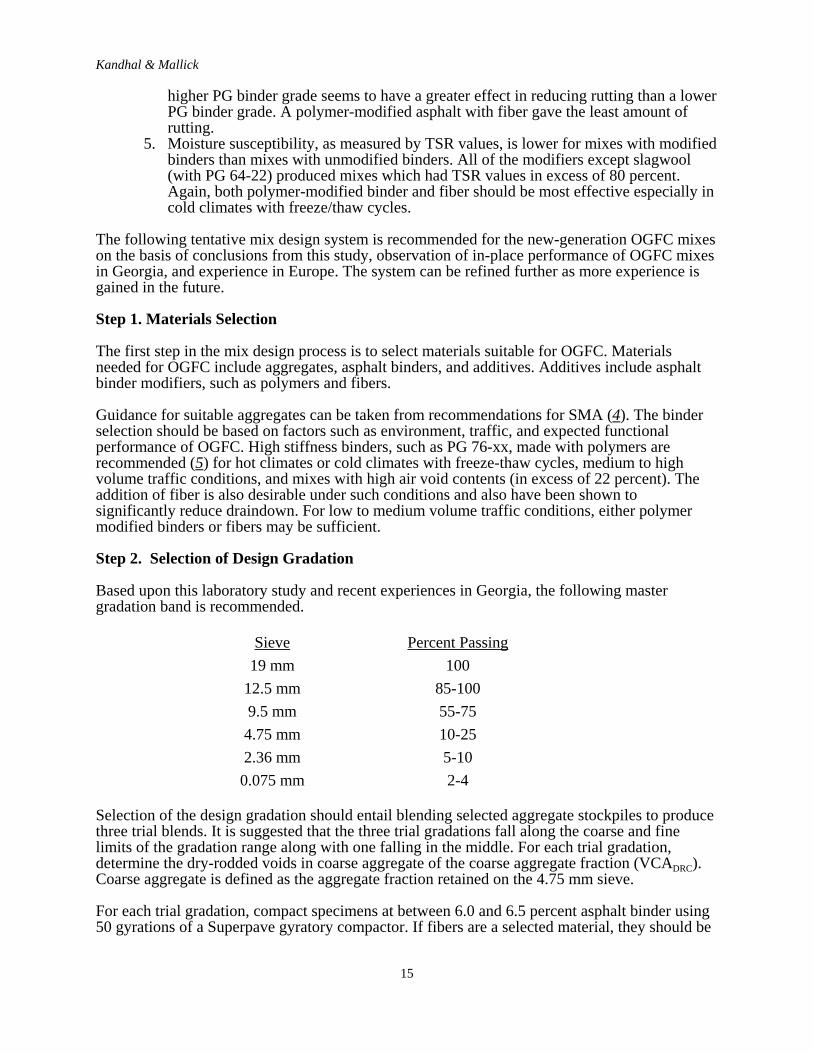
Based upon this laboratory study and recent experiences in Georgia, the following master gradation band is recommended.
Sieve Percent Passing19 mm 100
12.5 mm 85-1009.5 mm 55-754.75 mm 10-252.36 mm 5-100.075 mm 2-4
Selection of the design gradation should entail blending selected aggregate stockpiles to producethree trial blends. It is suggested that the three trial gradations fall along the coarse and finelimits of the gradation range along with one falling in the middle. For each trial gradation,determine the dry-rodded voids in coarse aggregate of the coarse aggregate fraction (VCADRC).Coarse aggregate is defined as the aggregate fraction retained on the 4.75 mm sieve.
For each trial gradation, compact specimens at between 6.0 and 6.5 percent asphalt binder using50 gyrations of a Superpave gyratory compactor. If fibers are a selected material, they should be

Kandhal & Mallick
16
included in these trial mixes. Determine the voids in coarse aggregate (VCA) for each compactedmix. If the VCA of the compacted mix is equal to or less than the VCADRC, stone-on-stonecontact exists (see example in Appendix B). To select the design gradation, choose a trialgradation that has stone-on-stone contact combined with high voids in total mix.
Step 3. Determine Optimum Asphalt Content
Using the selected design gradation, prepare OGFC mixes at three binder contents in incrementsof 0.5 percent. Conduct draindown test (Appendix C) on loose mix at a temperature 15°C higherthan anticipated production temperature. Compact mix using 50 gyrations of a Superpavegyratory compactor and determine air void contents. Conduct the Cantabro abrasion test onunaged and aged (7 days @ 60°C) samples. Rutting tests with the Asphalt Pavement Analyzerand laboratory permeability testing (Appendix D) are optional. Insufficient data wasaccumulated in this study to recommend a critical rut depth; however, laboratory permeabilityvalues greater than 100 m/day are recommended. The asphalt content that meets the followingcriteria is selected as optimum asphalt content.
1. Air Voids. A minimum of 18 percent is acceptable, although higher values aredesirable. The higher the air voids are the more permeable the OGFC.
2. Abrasion Loss on Unaged Specimens. The abrasion loss from the Cantabro testshould not exceed 20 percent.
3. Abrasion Loss on Aged Specimens. The abrasion loss from the Cantabro test shouldnot exceed 30 percent.
4. Draindown. The maximum permissible draindown should not exceed 0.3 percent bytotal mixture mass.
If none of the binder contents tested meet all four criteria, remedial action will be necessary. Airvoids within OGFC are controlled by the binder content. If air voids are too low, the asphaltbinder content should be reduced. If the abrasion loss on unaged specimens is greater than 20percent, more asphalt binder is needed. Abrasion loss values of aged specimens in excess of 30percent can be remedied by either increasing the binder content or changing the type of binderadditive. If draindown values are in excess of 0.3, the amount of binder and/or type of binderadditive can be adjusted. Fiber stabilizers are typically incorporated into the mix at a rate of 0.2to 0.5 percent of the total mix.
Step 4. Evaluate Mix for Moisture Susceptibility
The mix designed with Step 1 through 3 should be evaluated for moisture susceptibility using themodified Lottman method (AASHTO T283) with five freeze/thaw cycles in lieu of one cycle.The retained tensile strength (TSR) should be at least 80 percent.
Kandhal & Mallick
17
REFERENCES
1. Smith, R.W., J.M. Rice, and S.R. Spelman. Design of Open-Graded Asphalt FrictionCourses. Report FHWA-RD-74-2, Federal Highway Administration, January 1974.
2. Smith, H.A. Performance Characteristics of Open-Graded Friction Courses. NCHRPSynthesis of Highway Practice 180, TRB, 1992.
3. Kandhal, P.S., and R.B. Mallick. Open-Graded Friction Course: State of the Practice.Transportation Research Circular Number E-C005, TRB, December 1998.
4. Brown, E.R., and L.A. Cooley. Designing Stone Matrix Asphalt Mixtures for Rut-Resistant Pavement. NCHRP Report 425, TRB, 1999.
5. Porous Asphalt. Manual 17, Sabita Ltd, Roggebaai, South Africa, November 1995.6. Santha, Lanka. Comparison of Standard Open-Graded Friction Courses with Modified
Open-Graded Friction Courses. Georgia Department of Transportation Research ProjectNo. 9110, Final Report, April 1997.

Kandhal & Mallick
18
Appendix AFHWA Procedure for Design of Open Graded Friction Courses (OGFC)
Material Requirements
1.1 It is recommended that relatively pure carbonate aggregates or any aggregates known topolish be excluded from the coarse-aggregate fraction (material retained on the No. 8sieve). In addition, the coarse-aggregate fraction should have at least 75 percent (byweight) of particles with at least two fractured faces and 90 percent with one or morefractured faces. The abrasion loss (AASHTO T 96) should not exceed 40 percent.
1.2 Recommended Gradation for Open-Graded Asphalt Friction Course.
Sieve Sizea Percent Passingb
1/2 in. 1003/8 in. 95-100No. 4 30-50No. 8 5-15No. 200 2-5
a U. S. Sieve Series.b By volume. (This is the same as by weight unless specific gravities of aggregates being combined aredifferent.)
1.3 The recommended grade of asphalt cement is AC-10, AC-20, or AR-40, AASHTO M226. For AC-10 and AC-20, the M 226 Table 2 requirements should apply where suchasphalt is available. AR-40 requirements are given in Table 3 of M 226.
Preliminary Data
2.1 Test coarse and fine aggregates as received for the project for gradation unless otherwiseprovided. If mineral filler is submitted as a separate item, it should also be tested forspecification compliance. Analyze gradation results to determine if proportions ofaggregates and batching operations proposed by the contractor will meet the job-mixformula and the specification limits of step 1.2.
2.2 Determine bulk and apparent specific gravity for the coarse- and fine-aggregate fractions(retained and passing the No. 8 sieve) for each type of material submitted. Additionalspecific gravity tests are not warranted when the only distinction between aggregates issize of grading. Using the information verified in step 2.1, mathematically compute thebulk and apparent specific gravity for the coarse- and fine-aggregate fractions (retainedand passing the No. 8 sieve) for the proposed job-mix gradation.
2.3 Test the asphalt cement to be used for specification compliance (AASHTO M 226),viscosity-temperature data, and specific gravity at 77.0 F.
Asphalt Content
3.1 Determine the surface capacity of the aggregate fraction that is retained on a No. 4 sievein accordance with the following procedure.
Note: For highly absorptive aggregates, use the procedure described in step 3.3.
Kandhal & Mallick
19
Kc is determined from the percent of SAE No. 10 oil retained, which represents the totaleffect of superficial area, the aggregate’s absorptive properties, and surface roughness.
3.1.1 Quarter out 105 g representative of the material passing the 3/8-in. sieve andretained on the No. 4 sieve.
3.1.2 Dry sample on hot plate or in 230 ± 9 F oven to constant weight and allow tocool.
3.1.3 Weigh out 100.0 g and place in a metal funnel (top diam 3-1/2 in., height 4-1/2in., orifice 1/2 in., with a piece of No. 10 sieve soldered to the bottom of theopening).
3.1.4 Completely immerse specimen in SAE No. 10 lubricating oil for 5 min.
3.1.5 Drain for 2 min.
3.1.6 Place funnel containing sample in 140 F oven for 15 min of additional draining.
3.1.7 Pour sample from funnel into tared pan; cool, and re-weigh sample to nearest 0.1g. Subtract original weight and record difference as percent oil retained (based on100 g of dry aggregate).
3.1.8 Use chart shown in Figure A-1 for determination of Kc.
(a) If specific gravity for the fraction is greater than 2.70 or less than 2.60, applycorrection to oil retained, using formula at bottom of chart in Figure A-1.
(b) Start at the bottom of chart in Figure A-1 with the corrected percent of oilretained; follow straightedge vertically upward to intersection with the diagonalline; hold point, and follow the straightedge horizontally to the left. The valueobtained is the surface constant for the retained fraction and is known as Kc.
3.2 Determine the required asphalt content, which is based on weight of aggregate, from thefollowing relationship:

Kandhal & Mallick
20
PERCENT OIL RETAINED--CORRECTED FOR SPECIFIC GRAVITY OF AGGREGATE
Material used: Aggregate--passing 3/8-in. sieve, retained on No. 4 sieveOil--SAE No. 10
Oil Retained Corrected (%) = Oil Retained (%) X apparent specific gravity of coarse aggregate2.65
Figure A-1. Chart for determining surface constant (Kc ) of coarse aggregate.
Where Kc = surface constant(SG)ca = apparent specific gravity of coarse aggregate (3/8 in. to No. 4)
3.3 For highly absorptive aggregates, use the following procedure for determining Kc andasphalt content.
3.3.1 Follow the recommended design procedure from step 3.1 through step 3.1.3.
Kandhal & Mallick
21
3.3.2 Follow the instructions in step 3.1.4, except immerse the specimen for 30 min.
3.3.3 Follow the recommended procedure from step 3.1.5 through step 3.1.7.
3.3.4 Pour the sample onto a clean, dry, absorptive cloth; obtain a saturated surface drycondition; pour sample from cloth into a tared pan; re-weigh sample to nearest 0.1g. Subtract original weight of aggregate and record difference as percent oilabsorbed (based on 100 g of aggregate).
3.3.5 Subtract the percent oil absorbed value (see 3.3.4 above) from the percent oilretained value (see 3.3.3 above), and obtain the percent (free) oil retained value.This value represents the percent oil retained value that would have been obtainedhad the aggregate been a nonabsorptive type. The above technique allows one toevaluate the aggregate’s surface and shape characteristics without theoverwhelming influence of a large quantity of absorbed oil.
3.3.6 Follow the procedure recommended in steps 3.1.8 and 3.2. The only exception isthat the percent (free) oil retained value is used (from step 3.3.5) to obtain Kc.Thus, the asphalt quantity determined is the “effective” asphalt content.
3.3.7 Follow the recommended procedure indicated through sections 4 and 5. Becauseasphalt absorption is not presently included in the formula for the determinationof fine aggregate content, it is particularly desirable that the effects of oilabsorption in the Kc test be excluded in the case of the highly absorptiveaggregate.
3.3.8 Prepare a trial mixture using an asphalt content equal to or somewhat greater than(try to estimate amount that will be absorbed) the effective asphalt contentdetermined in step 3.3.6 and also using the aggregate gradation as determined instep 3.3.7. Using a suitable technique, such as the test for maximum specificgravity of asphalt mixtures (AASHTO T 209), determine the actual quantity ofasphalt absorbed (in percent, based on total weight of aggregate).
3.3.9 Determine the total asphalt content of the subject mixture by adding the effectiveasphalt content (from step 3.3.6) to the absorbed asphalt content (from step 3.3.8).
3.3.10 Follow the recommended procedure indicated in sections 6 and 7, using the totalasphalt content for all subsequent computations and trials (from step 3.3.9).
Void Capacity of Coarse Aggregate
4.1 Use the following procedure to determine the vibrated unit weight and void capacity ofthe coarse-aggregate fraction (material retained on a No. 8 sieve) of the proposed job-mixgradation.
Kandhal & Mallick
22
Figure A-3. Tamper foot and extension.
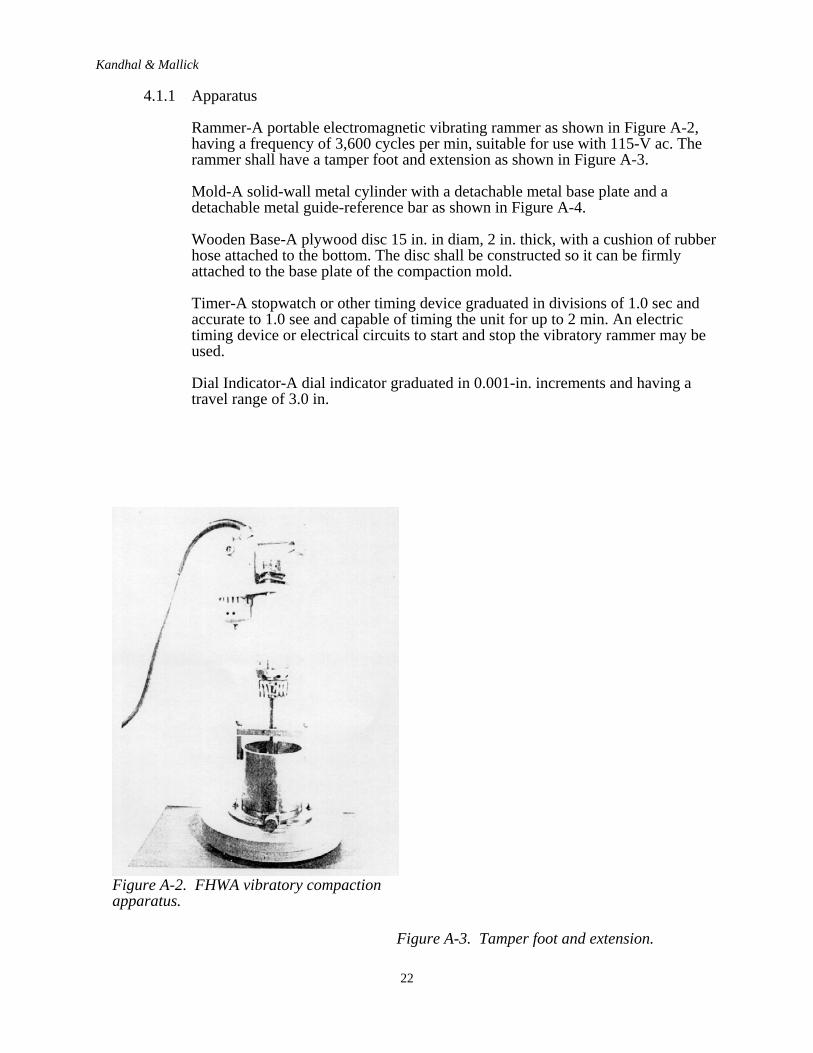
Figure A-2. FHWA vibratory compactionapparatus.
4.1.1 Apparatus
Rammer-A portable electromagnetic vibrating rammer as shown in Figure A-2,having a frequency of 3,600 cycles per min, suitable for use with 115-V ac. Therammer shall have a tamper foot and extension as shown in Figure A-3.
Mold-A solid-wall metal cylinder with a detachable metal base plate and adetachable metal guide-reference bar as shown in Figure A-4.
Wooden Base-A plywood disc 15 in. in diam, 2 in. thick, with a cushion of rubberhose attached to the bottom. The disc shall be constructed so it can be firmlyattached to the base plate of the compaction mold.
Timer-A stopwatch or other timing device graduated in divisions of 1.0 sec andaccurate to 1.0 see and capable of timing the unit for up to 2 min. An electrictiming device or electrical circuits to start and stop the vibratory rammer may beused.
Dial Indicator-A dial indicator graduated in 0.001-in. increments and having atravel range of 3.0 in.

Kandhal & Mallick
23
Figure A-4. Cylindrical mold for testing granularmaterials.
4.1.2 Sample: Select a 5-lb sample of the coarse-aggregate fraction from the proposedjob-mix formula as verified in step 2.1.
4.1.3 Procedure
(a) Pour the selected sample into the compaction mold and place the tamper footon the sample.
(b) Place the guide-reference bar over the shaft of the tamper foot and secure thebar to the mold with the thumb screws.
(c) Place the vibratory rammer on the shaft of the tamper foot and vibrate for 15sec. During the vibration period, the operator must exert just enough pressure onthe hammer to maintain contact between the sample and the tamper foot.
(d) Remove the vibratory rammer from the shaft of the tamper foot and brush anyfines from the top of the tamper foot. Measure the thickness (t) of the compactedmaterial to the nearest 0.001 in.
Note: The thickness (t) of the compacted sample is determined by adding the dialreading, minus the thickness of the tamper foot, to the measured distance from theinside bottom of the mold and the end of the dial gauge when it is seated on theguide-reference bar with stem fully extended.
Kandhal & Mallick
24
4.1.4 Calculations
Calculate the vibrated unit weight (X) as follows:
X = 6912(w)/ B (d)2 t (lb/ft3 )
Where w = wt of coarse-aggregate fraction (lb)d = diam of compaction mold (in.)
If w = 5 lb and d = 6 in.:
X = 305.58/t (lb/ft3 )
Where t is in inches
Determine the void capacity (VMA) as follows:
VMA = 100 (l - X/Uc ) (in percent)
where Uc = bulk solid unit weight (lb/ft3 of the coarse-aggregate fraction. Uc iscalculated from bulk specific gravity, as determined in step 2.2, multiplied by62.4 lb/f t3.
Optimum Content of Fine Aggregate
5.1 Determine the optimum content of fine-aggregate fraction using the followingrelationship:
Where:Y = Percent passing the No. 8 sieve (by weight)X = Actual vibrated unit weight of coarse aggregate (retained on the No. 8 sieve)Uf = Theoretical bulk dry solid unit weight of fine aggregate (passing the No. 8
sieve)Ua = Unit weight of asphalt cement
%AC = Percent asphalt by total weight of aggregate
V = Design percent air voids (15.0 percent)% VMA = Percent voids mineral aggregate of the coarse aggregate (retained on the No.
8 sieve), which is 100 - (100)(X)/UcUc = Theoretical bulk dry solid unit weight of coarse aggregate (retained on the No.
8 sieve)Note: X, Ua, Uc, and Uf are in pounds per cubic foot.
In the above relationship, asphalt absorption by aggregate has been assumed to benegligible. Because asphalt absorption requirements are considered in the test for Kc (seestep 3.1), the estimated air voids of 15 percent in the mixture will actually be greater byan amount equivalent to the volume of asphalt absorbed, in percent. This conditionprovides, if anything, an additional safety factor.
Kandhal & Mallick
25
PERCENT VOIDS (VMA) IN COARSE AGGREGATE (RETAINED ON NO. 8SIEVE)
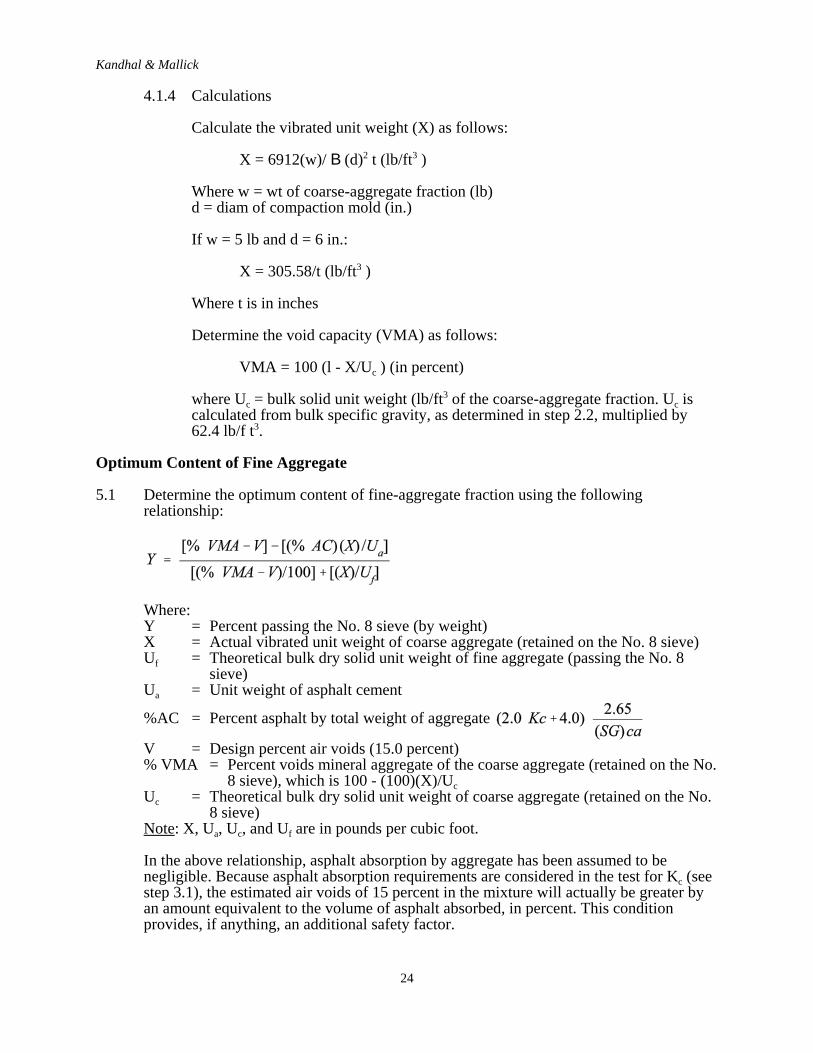
Assumptions Used in Deriving Chart:Uc = 165.4 lb/ft3 (SG = 2.650)Uf = 165.4 lb/ft3 (SG = 2.650)Ua = 62.4 lb/ft3 (SG = 1.000)V = 15.0 percent
Figure A-5. Determination of optimum fine-aggregate content.
As an alternative to the use of the mathematical relationship, one may use the designchart shown in Figure A-5, provided that the assumptions used in designing the chart aresatisfied; that is, the specific gravity values (bulk dry) for the coarse- and fine-aggregatefractions do not deviate beyond the limits of 2.600 to 2.700.
If the value thus obtained for fine-aggregate content is greater than 15 percent, a value of15.0 percent shall be used.
5.2 Compare the optimum fine-aggregate content (Y) determined in step 5.1 to the amountpassing the No. 8 sieve of the contractor’s proposed job-mix formula. If these valuesdiffer by more than plus or minus 1 percentage point, reconstruct a revised or adjustedjob-mix formula using the value determined for optimum fine-aggregate content.
Kandhal & Mallick
26
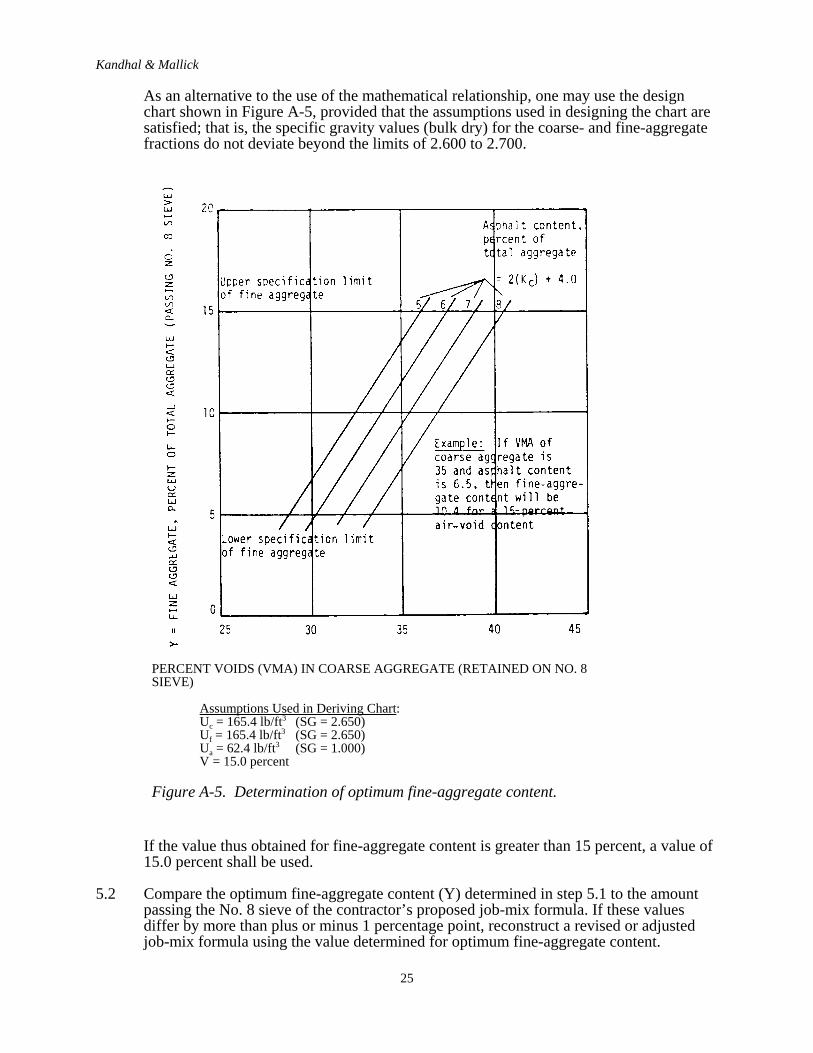
Figure A-6. Drainage test results.
Recompute the proportions of coarse and fine aggregates (as received) to meet therevised job-mix formula for submission to the contractor.
Note: If the proposed and revised job-mix gradations are significantly different, it may benecessary to rerun portions of this procedure.
Optimum Mixing Temperature
6.1 Prepare a 1,000-g sample of aggregate in the proportions determined in section 5. Mixthis sample at the asphalt content determined in step 3.2 at a temperature correspondingto an asphalt viscosity of 800 centistokes determined in step 2.3. When the mixture iscompletely coated, transfer it to a pyrex glass plate (diam 8 to 9 in.) and spread themixture with a minimum of manipulation. Return it to the oven at the mixingtemperature. Observe the bottom of the plate after 15 and 60 min (Fig. A-6). A slightpuddle at points of contact between aggregate and glass plate is suitable and desirable.Otherwise, repeat the test at a lower mixing temperature, or higher if necessary.
Note: If asphalt drainage occurs at a mixing temperature that is too low to provide foradequate drying of the aggregate, an asphalt of a higher grade should be used.

Kandhal & Mallick
27
Resistance to Effects of Water
7.1 Conduct the Immersion-Compression Test (AASHTO T 165 and T 167) on the designedmixture. Prepare samples at the optimum mixing temperature determined in step 6.1. Usea molding pressure of 1,000 psi rather than the specified value of 3,000 psi.
After a four-day immersion at 120 F, the index of retained strength shall not be less than50 percent unless otherwise permitted.
Note: Additives to promote adhesion that will provide adequate retained strength may beused when necessary.
Kandhal & Mallick
28
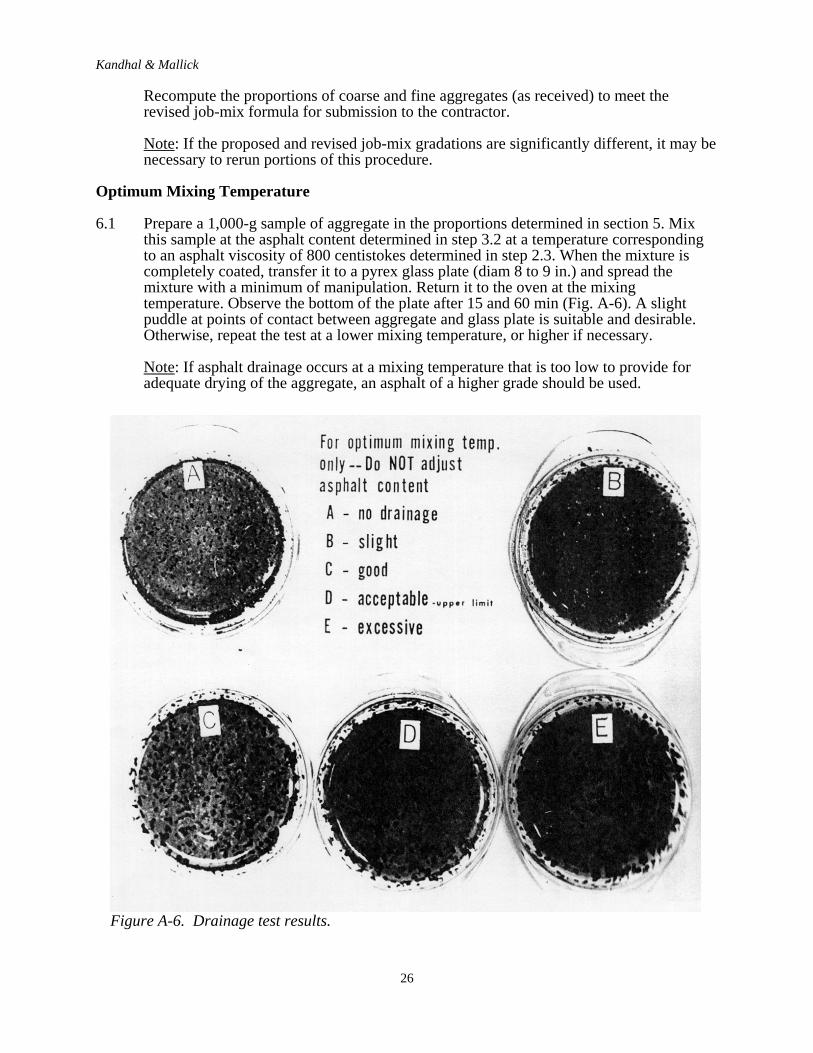
REPORT ON OPEN-GRADED ASPHALT FRICTION COURSE DESIGN1. Aggregates
A. Proposed Proportions (by weight)B. Proposed Job-Mix Gradation
Percent PassingSieve Size Specification
limitsJob-Mix
Blend1/2 in. __________ __________ __________ __________3/8 in. 95-100 __________ __________ __________ __________No. 4 30-50 __________ __________ __________ __________No. 8 5-15 __________ __________ __________ __________No. 16 __________ __________ __________ __________No. 200 2-5 __________ __________ __________ __________
C. Specific Gravity—Unit WeightApparent SG Bulk SG (dry basis) Bulk Solid Unit
Weight (lb/ft3)Coarse aggregate (retained on No. 8 sieve) __________ __________(Uc)Fine aggregate (passing No. 8 sieve) __________ __________(Uf)3/8 in. - No. 4 sieve fraction __________
D. Void Capacity of Coarse AggregateUnit weight (vibrated, lb/ft3) = (X)Voids mineral aggregate (%) = (VMA)
E. Kc DeterminationOil retention (g oil per 100 g aggregate) = __________Oil retention (corrected, 2.65 SG) = __________Kc (from chart) = __________
2. ASPHALTA. Specific Gravity--Unit Weight
Specific gravity at 77°F (25°C) = __________Unit weight (lb/ft3) = __________ (Ua)
B. Viscosity--TemperatureAsphalt grade = __________

Kandhal & Mallick
29
Temperature (°F)Viscosity
(centistokes)290 __________275 __________260 __________245 __________230 __________215 __________
Target: ( - ) (700 - 900)
C. Asphalt Content (AC, %)
Percent asphalt (aggregate basis) =
3. MIXTURE DESIGNA. Optimum Fine-Aggregate Content (Y)
Using: Formula __________ Chart __________Where: X = __________ lb/ft3 VMA = __________ %
Uf = __________ lb/ft3 AC = __________ %Uc = __________ lb/ft3 V = __________ %Ua = __________ lb/ft3
Find: Y = __________ % (Specs limit: 5 < Y < 15)Remarks:
B. Optimum Mixing Temperature
Temperature Viscosity(centistokes)
Drainage Use
__________ __________ __________ ____________________ __________ __________ ____________________ __________ __________ __________
C. Maximum Specific Gravity of Mixture (AASHTO T209)Specific gravity (vacuum saturation) = __________Unit weight (vacuum saturation) = __________ lb/ft3
D. Resistance to Effects of Water (AASHTO T 165 and T 167, 2000 psi)Air dry strength (psi) = __________Wet strength (psi) = __________ 4 days at 120°FRetained strength (%) = __________ 50% minimumAir voids (%) = __________ Bulk volume by dimensional measurement

Kandhal & Mallick
30
Remarks:
4. DESIGN SUMMARYA. Aggregate Proportions (by weight)B. Job-Mix Gradation Percent Passing
Sieve Size Job-Mix Blend1/2 in. __________3/8 in. __________No. 4 __________No. 8 __________No. 16 __________No. 200 __________
C. Asphalt ContentAggregate basis (%) = __________Mixture basis (%) = __________
D. Mixing TemperatureTarget value (°F) = __________Range = __________
E. AdditivesF. Recommendations Accepted _____ Rejected _____

Kandhal & Mallick
31
Appendix BExample of Determining VCADRC and VCA for Checking Stone-on-Stone
Contact in OGFC Mixtures
Three trial gradations were selected for evaluation as shown in Table B-1.
Determination of Voids in the Coarse Aggregate - Dry-Rodded Condition (VCADRC)
VCADRC was determined for Trial Blend 1 coarse aggregate fraction according to AASHTO T19. The VCADRC was determined for the aggregate fraction coarser than the 4.75 mm sieve. Tworeplicates for each test were performed. The average results are given in Table B-2.
Table B-1. Gradations of the Three Trial BlendsPercent Passing by Volume
Sieve Size (mm) Trial Blend 1 Trial Blend 2 Trial Blend 319.0 100 100 10012.5 95 95 959.5 65 65 654.75 15 25 302.36 7 7 71.18 6 6 60.60 5 5 50.30 4 4 40.15 3.5 3.5 3.50.075 3.0 3.0 3.0GCA 2.688 2.688 2.688
GCA - coarse aggregate bulk specific gravity
Table B-2. Density and VCADRC for the Three Trial BlendsBlend No. VCADRC (%) Dry Rodded Unit Weight
1 41.6 1564.27 kg/m3
The calculation for VCADRC for blend 1 is shown below.
Kandhal & Mallick
32
where,(s = unit weight of the coarse aggregate fraction in the dry rodded condition (kg/m3)(w = unit weight of water (998 kg/m3), andGCA = combined bulk specific gravity of the coarse aggregate (Table B-1).
Compact Specimens
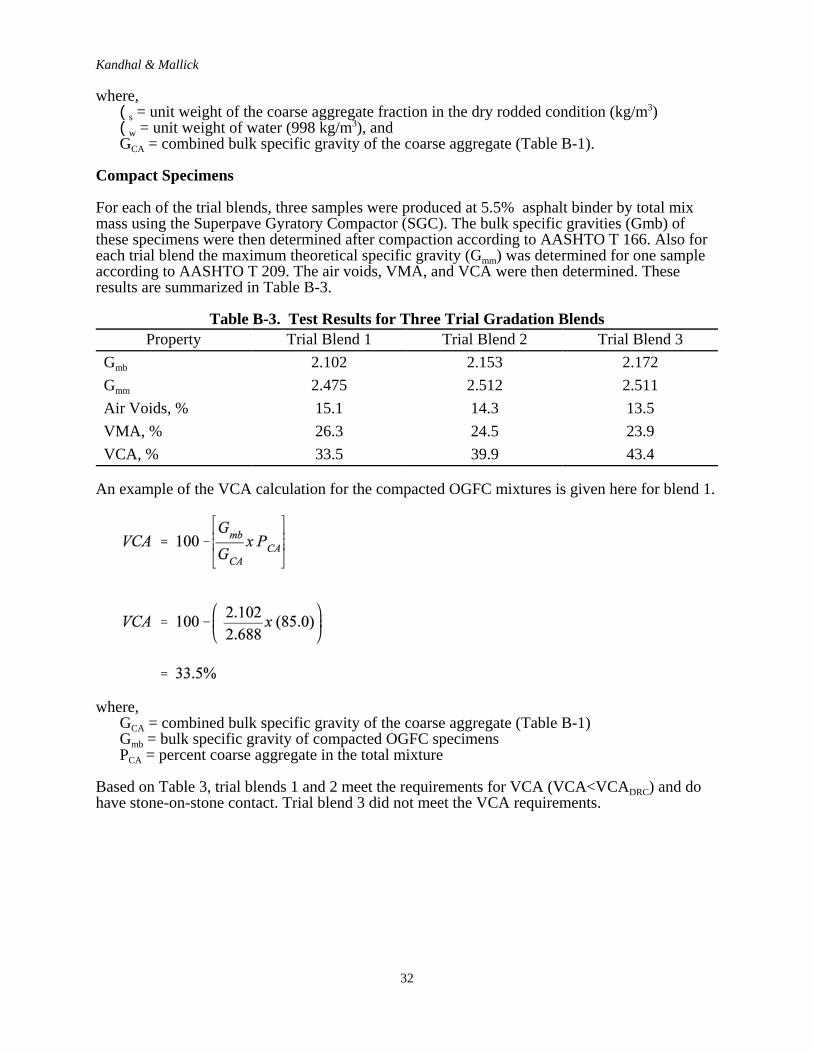
For each of the trial blends, three samples were produced at 5.5% asphalt binder by total mixmass using the Superpave Gyratory Compactor (SGC). The bulk specific gravities (Gmb) ofthese specimens were then determined after compaction according to AASHTO T 166. Also foreach trial blend the maximum theoretical specific gravity (Gmm) was determined for one sampleaccording to AASHTO T 209. The air voids, VMA, and VCA were then determined. Theseresults are summarized in Table B-3.
Table B-3. Test Results for Three Trial Gradation BlendsProperty Trial Blend 1 Trial Blend 2 Trial Blend 3
Gmb 2.102 2.153 2.172Gmm 2.475 2.512 2.511Air Voids, % 15.1 14.3 13.5VMA, % 26.3 24.5 23.9VCA, % 33.5 39.9 43.4
An example of the VCA calculation for the compacted OGFC mixtures is given here for blend 1.
where,GCA = combined bulk specific gravity of the coarse aggregate (Table B-1)Gmb = bulk specific gravity of compacted OGFC specimensPCA = percent coarse aggregate in the total mixture
Based on Table 3, trial blends 1 and 2 meet the requirements for VCA (VCA<VCADRC) and dohave stone-on-stone contact. Trial blend 3 did not meet the VCA requirements.
Kandhal & Mallick
33
Appendix CStandard Test Method for
Determination of Draindown Characteristics in Uncompacted AsphaltMixtures
1. SCOPE
1.1 This test method covers the determination of the amount of draindown in anuncompacted asphalt mixture sample when the sample is held at elevated temperaturescomparable to those encountered during the production, storage, transport, andplacement of the mixture. The test is particularly applicable to mixtures such as porousasphalt (open-graded friction course) and stone matrix asphalt (SMA).
1.2 The values stated in SI units are to be regarded as the standard.
1.3 This standard may involve hazardous materials, operations, and equipment. Thisstandard does not purport to address all of the safety problems associated with its use. It is the responsibility of the user of this standard to establish appropriate safety andhealth practices and determine the applicability of regulatory limitations prior to use.
2. REFERENCED DOCUMENTS
2.1 ASTM Standards:
C 670 - Practice for Preparing Precision and Bias Statements for Test Methods forConstruction Materials.
D 979 - Standard Practice for Sampling Bituminous Paving Mixtures.
D 1559 - Standard Test Method for Resistance to Plastic Flow of Bituminous MixturesUsing Marshall Apparatus.
D 4753 - Evaluating, Selecting, and Specifying Balances and Scales, for Use inTesting Soil, Rock, and Related Construction Materials.
E 11 - Standard Specification for Wire-Cloth Sieves for Testing Purposes.
3. DEFINITIONS
3.1 Draindown—For the purpose of this test method, draindown is considered to be thatportion of material which separates itself from the sample as a whole and is depositedoutside the wire basket during the test. The material which drains may be composed ofeither asphalt binder or a combination of asphalt binder, additives, or fine aggregate.
4. SUMMARY OF METHOD
4.1 A sample of the asphalt mixture to be tested is prepared in the laboratory or obtainedfrom field production. The sample is placed in a wire basket which is positioned on aplate or other suitable container of known mass. The sample, basket, and plate orcontainer are placed in a force draft oven for one hour at a pre-selected temperature.

Kandhal & Mallick
34
At the end of one hour, the basket containing the sample is removed from the ovenalong with the plate or container and the mass of the plate or container containing thedrained material, if any, is determined. The amount of draindown is then calculated.
5. SIGNIFICANCE AND USE
5.1 This test method can be used to determine whether the amount of draindown measuredfor a given asphalt mixture is within specified acceptable levels. The test provides anevaluation of the draindown potential of an asphalt mixture during mixture designand/or during field production. This test is primarily used for mixtures with highcoarse aggregate content such as porous asphalt (open-graded friction course) andstone matrix asphalt (SMA).
6. APPARATUS
6.1 Forced draft oven, capable of maintaining the temperature in a range from 120-175°C.The oven should maintain the set temperature to within ±2°C.
6.2 Plates or other suitable containers of appropriate size. The plates or containers usedshould be of appropriate durability to withstand the oven temperatures. Cake pans orpie tins are examples of suitable types of containers.
6.3 Standard basket meeting the dimensions shown in Figure C-1. The basket shall beconstructed using standard 6.3 mm sieve cloth as specified in ASTM E 11.
6.4 Balance—A balance readable to 0.1g and conforming to the requirements ofspecification D4753, GP2.
7. SAMPLE PREPARATION
7.1 Laboratory Prepared Samples
7.1.1 Number of Samples—For each mixture tested, the draindown characteristicsshould be determined at two different temperatures. The two temperaturesshould be the anticipated plant production temperature as well as 10°C above(Note 1). For each temperature, duplicate samples should be tested. Thus forone asphalt mixture, a minimum of four samples will be tested.
7.1.2. Dry the aggregate to constant mass and sieve it into appropriate size fractionsas indicated in ASTM D 1559.
7.1.3 Determine the anticipated plant production temperature for the specific mix tobe tested based on the specifications, mix design, or recommendations of thebinder supplier.
7.1.4 Place into separate pans for each test sample the amount of each size fractionrequired to produce completed mixture samples having a mass of 1200±200grams. The aggregate fractions shall be combined such that the resultingaggregate blend has the same gradation as the job-mix formula. Place theaggregate samples in an oven and heat to a temperature not to exceed thetemperature established in 7.1.1.

Kandhal & Mallick
35Figure C-1. Wire basket assembly (not to scale).

Kandhal & Mallick
36
7.1.5 Heat the asphalt binder to the temperature established in 7.1.1.
7.1.6 Place the heated aggregate in the mixing bowl. Add any stabilizers (Note 2)and thoroughly mix the dry components. Form a crater in the aggregate blendand add the required amount of asphalt binder. The amount of asphalt bindershall be such that the final sample has the same asphalt content as the job-mixformula. At this point, the temperature of the aggregate and asphalt binder shallbe at the temperature determined in 7.1.1. Mix the aggregate (and stabilizer ifany) and asphalt binder quickly until the aggregate is thoroughly coated.
7.2 Plant Produced Samples
7.2.1 Number of Samples—For plant produced samples, triplicate samples should betested at the plant production temperature.
7.2.2 Samples should be obtained in accordance with ASTM D 979 during plantproduction by sampling the mixture at any appropriate location such as thetrucks prior to the mixture leaving the plant. Samples obtained during actualproduction should be reduced to the proper test sample size.
Note 1—When using the test as part of the mixture design procedure, the test shouldbe performed at two temperatures in order to determine the potential effect that planttemperature variation may have on the mixture during production. When the test isused in the field during production, it should be necessary to perform the test at theplant production temperature only.
Note 2—Some types of stabilizers such as fibers or some polymers are added directlyto the aggregate prior to mixing with the asphalt binder. Other types of stabilizers areadded directly to the asphalt binder prior to blending with the aggregate.
8. PROCEDURE
8.1 Weigh the empty wire basket described in 6.3 (Mass A). Transfer the laboratoryproduced or plant produced uncompacted mixture sample to the wire basket as soon aspossible. Place the entire sample in the wire basket. Do not consolidate or otherwisedisturb the sample after transfer to the basket. Determine the mass of the wire basketplus sample to the nearest 0.1 gram. (Mass B).
8.2 Determine and record the mass of a plate or other suitable container to the nearest 0.1gram at ambient temperature (Mass C). Place the basket on the plate or container andplace the assembly into the oven at the temperature as determined in 7.1.1 or 7.2.1 for1 hour ±5 minutes.
8.3 After the sample has been in the oven for 1 hour ±5 minutes, remove the basket andplate or container from the oven. Let cool to ambient temperature. Determine andrecord the mass of the plate or container plus drained material to the nearest 0.1 gram(Mass D).
9. CALCULATIONS
9.1 Calculate the percent of mixture which drained to the nearest 0.1 percent as follows:

Kandhal & Mallick
* Supporting data are available from ASTM Headquarters. Request RR: D04-XXX (Dan Smith will assign anumber).
37
Draindown (percent) = (D-C)/(B-A) x 100
where A = mass of the empty wire basket,B = mass of the wire basket and sample,C = mass of the empty catch plate or container, and D= mass of the catch plate or container plus drained material.
10. REPORT
10.1 Report the average percent drainage at each of the test temperatures to the nearest 0.1percent.
11. PRECISION AND BIAS*
11.1 Precision statements for mixtures with draindown values of less than 1.0 percent.(Note 3).
Test & Type Index Coefficient of Variation(% of mean)A
Acceptable Range of TwoTest Results (% of mean)A
Single operator precision:Draindown, percent
32.5 92.0
Multilaboratory precision:Draindown, percent
68.2 193.0
A These numbers represent, respectively, the (1s%) and (d2s%) limits as described in ASTM practice C670.
NOTE 3—These precision statements are based on an analysis of a round-robin studyconducted by the National Center for Asphalt Technology, using one stone matrix asphaltmix, three replicates, and ten laboratories. The precision statements are based on a mixturethat had an average draindown value of 0.3 percent.
11.2 Precision statements for mixtures with draindown values of more than 1.0 percent(Note 4).
Test & Type Index Coefficient of Variation(% of mean)A
Acceptable Range of TwoTest Results (% of mean)A
Single operator precision:Draindown, percent
28.1 79.5
Multilaboratory precision:Draindown, percent
35.9 101.6
A These numbers represent, respectively, the (1s%) and (d2s%) limits as described in ASTM practice C670.
NOTE 4—These precision statements are based on an analysis of a round-robin studyconducted by the National Center for Asphalt Technology, using one stone matrix asphaltmix, three replicates, and ten laboratories. The precision statements are based on a mixture

Kandhal & Mallick
38
that had an average draindown value of 1.4 percent.
11.3 Bias—The test method has no bias because the values determined can be defined onlyin terms of the test method.
12. KEYWORDS
12.1 draindown; asphalt mixtures; open-graded friction courses; stone matrix asphalt
Kandhal & Mallick
39
Appendix DFlorida DOT Falling Head Laboratory Permeability Test Method
1. SCOPE
1.1 This test method covers the laboratory determination of the water conductivity of acompacted asphalt paving mixture sample. The measurement provides an indication ofwater permeability of that sample as compared to those of other asphalt samples testedin the same manner.
1.2 The procedure uses either laboratory compacted cylindrical specimens or field coresamples obtained from existing pavements.
1.3 The values stated in metric (SI) units are to be regarded as standard. Values inparenthesis are for information and reference purposes only.
1.4 This standard does not purport to address all of the safety problems associated withits use. It is the responsibility of the user of this standard to establish appropriatesafety and health practices and determine the applicability of regulatory limitationsprior to use.
2. APPLICABLE DOCUMENTS
2.1 AASHTO Standards:
M 231 Weights and Balances Used in the Testing of Highway Materials.
2.2 Florida Test Methods
FM 1-T 166 Bulk Specific Gravity of Compacted Bituminous Mixtures.
3. SUMMARY OF TEST METHOD
3.1 A falling head permeability test apparatus, as shown in Figure D-1, is wed todetermine the rate of flow of water through the specimen. Water in a graduatedcylinder is allowed to flow through a saturated asphalt sample and the interval of timetaken to reach a known change in head is recorded. The coefficient of permeability ofthe asphalt sample is then determined based on Darcy’s law.
4. SIGNIFICANCE AND USE
4.1 This test method provides a means for determining water conductivity ofwater-saturated asphalt samples. It applies to one-dimensional, laminar flow of water.It is assumed that Darcy’s law is valid.
5. APPARATUS
5.1 Permeameter - See Figure D-1. The device shall be meet the following requirements:

Kandhal & Mallick
40
Figure D-1. Water Permeability Testing Apparatus (not to scale)

Kandhal & Mallick
41
a) A calibrated cylinder of 31.75 ± 0.5 mm (1.25 ± 0.02 in.) inner diametergraduated in millimeters capable of dispensing 500 ml of water.
b) A scaling tube using a flexible latex membrane 0.635 mm (0.025 in) thick andcapable of confining asphalt concrete specimens up to 152.4 mm (6.0 in.) indiameter and 80 mm (3.15 in.) in height.
c) An upper cap assembly for supporting the graduated cylinder and expanding ano-ring against the sealing tube. The opening in the upper cap shall have the samediameter as the inner diameter of the calibrated cylinder mentioned previously in5.1 a. The underside of the upper cap assembly should be tapered at an angle of10 ± 1° (see Figure D-1).
d) A lower pedestal plate for supporting the asphalt concrete specimen andexpanding an o-ring against the sealing tube. The opening in the plate should havea minimum diameter of 18 mm (0.71 in.). The top side of the lower cap should betapered at an angle of 10 ± 1° (see Figure D-1).
e) 0-rings of sufficient diameter and thickness for maintaining a seal against thesealing tube.
f) A frame and clamp assembly for supplying a compressive force to the upper capassembly and lower pedestal necessary to expand the o-rings.
g) An air pump capable of applying 103.42 kPa (15 psi) pressure and capable ofapplying vacuum to evacuate the air from tho sealing tube/membrane cavity.
h) A pressure gauge with range 0 to 103.42 kPa (0 to 15 psi) with ± 2% accuracy.
i) Quick connects and pressure line for inflating and evacuating the sealing tube/membrane cavity.
j) An outlet pipe with a minimum inside diameter of 18 mm (0.71 in.) with shutoffvalve for draining water.
NOTE 1: A device manufactured by Karol Warner Soil Testing Systems has been found tomeet the above specifications.
5.2 Water - A continuous supply of clean, non-aerated water, preferably supplied byflexible hose from water source to top of graduated cylinder.
5.3 Thermometer - A mercury or thermocouple device capable of measuring thetemperature of water to the nearest 0.1°C (0.2°F).
5.4 Beaker - A 600 ml beaker or equivalent container to be used while measuring thetemperature of a water sample.
5.5 Timer - A stop watch or other timing device graduated in divisions of 0.1 s or less andaccurate to within 0.05% when tested over intervals of not less than 15 min.
5.6 Measuring Device - A device used to measure the dimensions of the specimen,capable of measuring to the nearest 0.5 mm or better.

Kandhal & Mallick
42
5.7 Saw - Equipment for wet cutting the specimen to the desired thickness. Dry cut typesaws are not to be used.
5.8 Sealing Agent - Petroleum jelly.
5.9 Spatula - Used for applying the petroleum jelly to the sides of laboratory compactedspecimens.
5.10 Fan - An electric fan for drying the wet cut asphalt specimen.
5.11 Container - A five gallon bucket or equivalent container for soaking the specimensprior to testing.
6. PREPARATION OF TEST SAMPLES
6.1 Saw cut the field core or the laboratory compacted specimen to the desired test samplethickness. The thickness shall be as close to the actual or desired in-place thickness aspossible. For both field cores and laboratory compacted specimens, both the top andbottom faces shall be trimmed.
6.2 Wash the test sample thoroughly with water to remove any loose, fine materialresulting from saw cutting.
6.3 Determine the bulk specific gravity of the specimen, if necessary. Use Method B ofFM 1 -T 166.
6.4 Measure and record to the nearest 0.5 mm (0.02 in.) or better, the height and diameterof the sample at three different locations. The three height measurements shall notvary by more than 3 mm (0.2 in.). The diameter of the specimen shall not be less than144 mm (5.67 in.).
NOTE 2: During the permeability test, the sample will need to reach a saturated state asdefined in 7.8. As an aid in saturating the sample, and if time permits, place it inthe container described in 5.11 and fill with a sufficient quantity of water tocompletely cover the sample. Let the sample soak for a period of one to twohours.
6.5 For laboratory compacted specimens it is necessary to apply a thin layer of petroleumjelly to the sides of the specimen. This will fill the large void pockets around the sidesof the specimen which are not representative of the level of compaction of the interiorof the specimen. If the sample is wet, wipe the sides with a towel to remove any freestanding water. Use a spatula or similar device and apply the petroleum jelly to thesides of the specimen only.
7. TEST PROCEDURE
7.1 Evacuate the air from the sealing tube/membrane cavity.
NOTE 3: Complete evacuation of the air is aided by pinching the membrane and slightlypulling it away from the hose barb fitting as the pump is stroked.
7.2 Place the specimen on top of the lower pedestal plate and center it.

Kandhal & Mallick
43
7.3 Place the sealing tube over the specimen and lower pedestal plate making sure that thesealing tube is oriented so that the hose barb fitting will be located between the o-ringson the upper cap and lower pedestal.
7.4 Insert the upper cap assembly into the sealing tube and let it rest on the top of theasphalt concrete specimen.
NOTE 4: Insertion of the upper cap assembly is aided if the graduated cylinder is alreadyinserted into the upper cap assembly. The graduated cylinder can then be used asa handle.
7.5 Install the two clamp assemblies onto the permeameter frame and evenly tighten eachone, applying a moderate pressure to the upper cap assembly. This action seals theo-rings against the membrane and sealing tube.
7.6 Inflate the membrane to 68.9 ± 3.4 kPa (10 ± 0.5 psi). Maintain this pressurethroughout the test.
7.7 Fill the graduated cylinder with water approximately halfway and rock thepermeameter back, forth, and sideways enough to dislodge any trapped air from theupper cavity.
7.8 Fill the graduated cylinder to a level above the upper timing mark, see Figure D-1.Start the timing device when the bottom of the meniscus of the water reaches theupper timing mark. Stop the timing device when the bottom of the meniscus reachesthe lower timing mark. Record the time to the nearest second. Perform this test threetimes and check for saturation. While checking for saturation, do not allow the waterin the graduated cylinder to run out, as this will allow air to re-enter the specimen.
Saturation is defined as the repeatability of the time to run 500 mL of water throughthe specimen. A specimen will be considered saturated when the % difference betweenthe first and third test is 4.0%. Therefore, a minimum of three tests will be required foreach asphalt concrete specimen except as stated in Note 6. Saturation of the specimenmay require many test runs prior to achieving the #4.0% requirement. One techniquethat aids in achieving saturation is to nearly fill the graduated cylinder with water andadjust the water inflow so that it equals the outflow. Allow the water to run in thismanner for five or ten minutes and then begin the timed testing. If more than three testruns are required, which is typically the case, then the #4.0% requirement shall applyto the last three testing times measured.
NOTE 5: If after the third run, the test run time is greater than ten minutes, then the testercan use judgement and consider ending the test, using the lowest time recorded inthe permeability calculation.
NOTE 6: If the test time is approaching thirty minutes during the first test run without thewater level reaching the lower timing mark, then the tester may mark the waterlevel at thirty minutes and record this mark and time. Run the test one more timeand record the mark and time. Use the mark and time which will result in thehighest permeability value.
7.9 Obtain a sample of water in a beaker or other suitable container and determine thetemperature to the nearest 0.1°C (0.2°F).
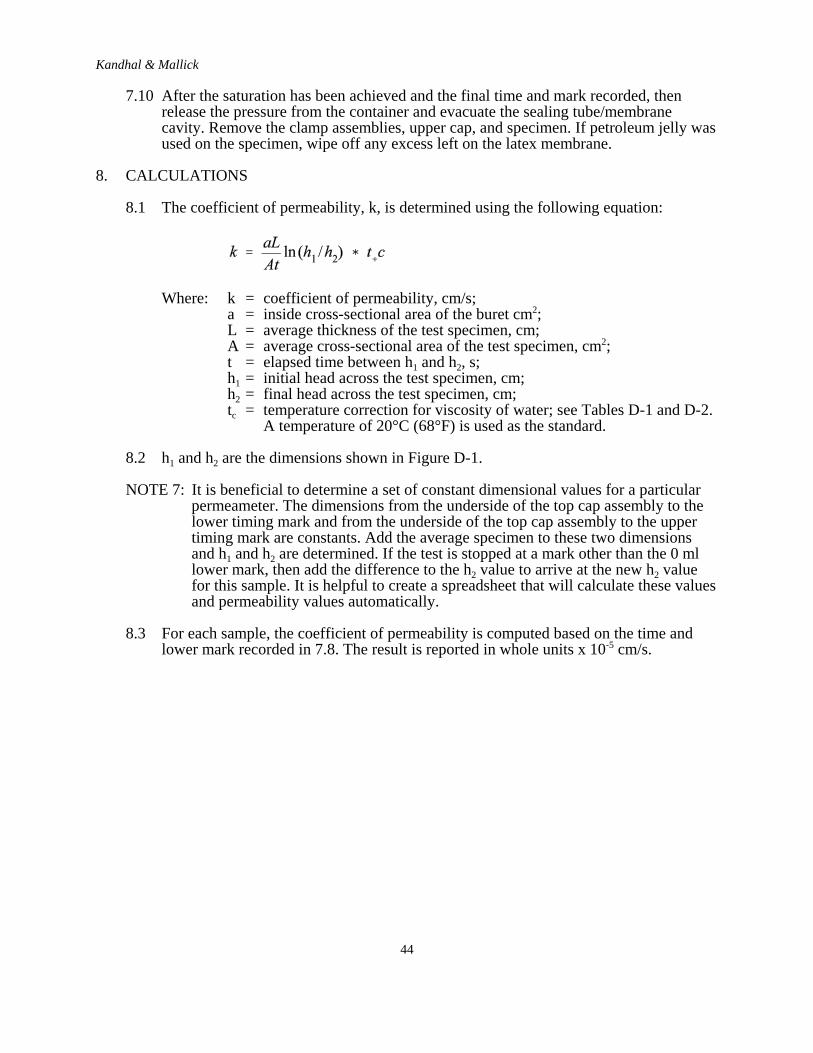
Kandhal & Mallick
44
7.10 After the saturation has been achieved and the final time and mark recorded, thenrelease the pressure from the container and evacuate the sealing tube/membranecavity. Remove the clamp assemblies, upper cap, and specimen. If petroleum jelly wasused on the specimen, wipe off any excess left on the latex membrane.
8. CALCULATIONS
8.1 The coefficient of permeability, k, is determined using the following equation:
Where: k = coefficient of permeability, cm/s;a = inside cross-sectional area of the buret cm2;L = average thickness of the test specimen, cm;A = average cross-sectional area of the test specimen, cm2;t = elapsed time between h1 and h2, s;h1 = initial head across the test specimen, cm;h2 = final head across the test specimen, cm;tc = temperature correction for viscosity of water; see Tables D-1 and D-2.
A temperature of 20°C (68°F) is used as the standard.
8.2 h1 and h2 are the dimensions shown in Figure D-1.
NOTE 7: It is beneficial to determine a set of constant dimensional values for a particularpermeameter. The dimensions from the underside of the top cap assembly to thelower timing mark and from the underside of the top cap assembly to the uppertiming mark are constants. Add the average specimen to these two dimensionsand h1 and h2 are determined. If the test is stopped at a mark other than the 0 mllower mark, then add the difference to the h2 value to arrive at the new h2 valuefor this sample. It is helpful to create a spreadsheet that will calculate these valuesand permeability values automatically.
8.3 For each sample, the coefficient of permeability is computed based on the time andlower mark recorded in 7.8. The result is reported in whole units x 10-5 cm/s.

Kandhal & Mallick
45
Table D-1. Temperature Correction for Viscosity of Water, Celsius°C 0.0 0.1 0.2 0.3 0.4 0.5 0.6 0.7 0.8 0.910 1.30 1.30 1.29 1.29 1.29 1.28 1.28 1.27 1.27 1.2711 1.26 1.26 1.26 1.25 1.25 1.25 1.24 1.24 1.24 1.2312 1.23 1.23 1.22 1.22 1.22 1.21 1.21 1.21 1.20 1.2013 1.20 1.19 1.19 1.19 1.18 1.18 1.18 1.17 1.17 1.1714 1.16 1.16 1.16 1.16 1.15 1.15 1.15 1.14 1.14 1.1415 1.13 1.13 1.13 1.13 1.12 1.12 1.12 1.11 1.11 1.1116 1.10 1.10 1.10 1.10 1.09 1.09 1.09 1.09 1.08 1.0817 1.08 1.07 1.07 1.07 1.07 1.06 1.06 1.06 1.06 1.0518 1.05 1.05 1.05 1.05 1.04 1.04 1.03 1.03 1.03 1.0319 1.02 1.02 1.02 1.02 1.01 1.01 1.01 1.01 1.00 1.0020 1.00 1.00 1.00 0.99 0.99 0.99 0.99 0.98 0.98 0.9821 0.98 0.97 0.97 0.97 0.97 0.96 0.96 0.96 0.98 0.9622 0.95 0.95 0.95 0.95 0.94 0.94 0.94 0.94 0.94 0.9323 0.93 0.93 0.93 0.93 0.92 0.92 0.92 0.92 0.91 0.9124 0.91 0.91 0.91 0.90 0.90 0.90 0.90 0.90 0.89 0.8925 0.89 0.89 0.89 0.88 0.88 0.88 0.88 0.88 0.87 0.8726 0.87 0.87 0.87 0.87 0.85 0.86 0.86 0.86 0.85 0.8527 0.85 0.85 0.85 0.85 0.84 0.84 0.84 0.84 0.84 0.8428 0.83 0.83 0.83 0.83 0.83 0.83 0.82 0.82 0.82 0.8229 0.82 0.81 0.81 0.81 0.81 0.81 0.81 0.80 0.80 0.8030 0.80 0.80 0.80 0.79 0.79 0.79 0.79 0.79 0.79 0.7831 0.78 0.78 0.78 0.78 0.78 0.78 0.77 0.77 0.77 0.7732 0.77 0.77 0.78 0.76 0.78 0.76 0.76 0.76 0.76 0.7533 0.75 0.75 0.75 0.75 0.75 0.74 0.74 0.74 0.74 0.7434 0.74 0.74 0.73 0.73 0.73 0.73 0.73 0.73 0.73 0.7235 0.72 0.72 0.72 0.72 0.72 0.72 0.71 0.71 0.71 0.71
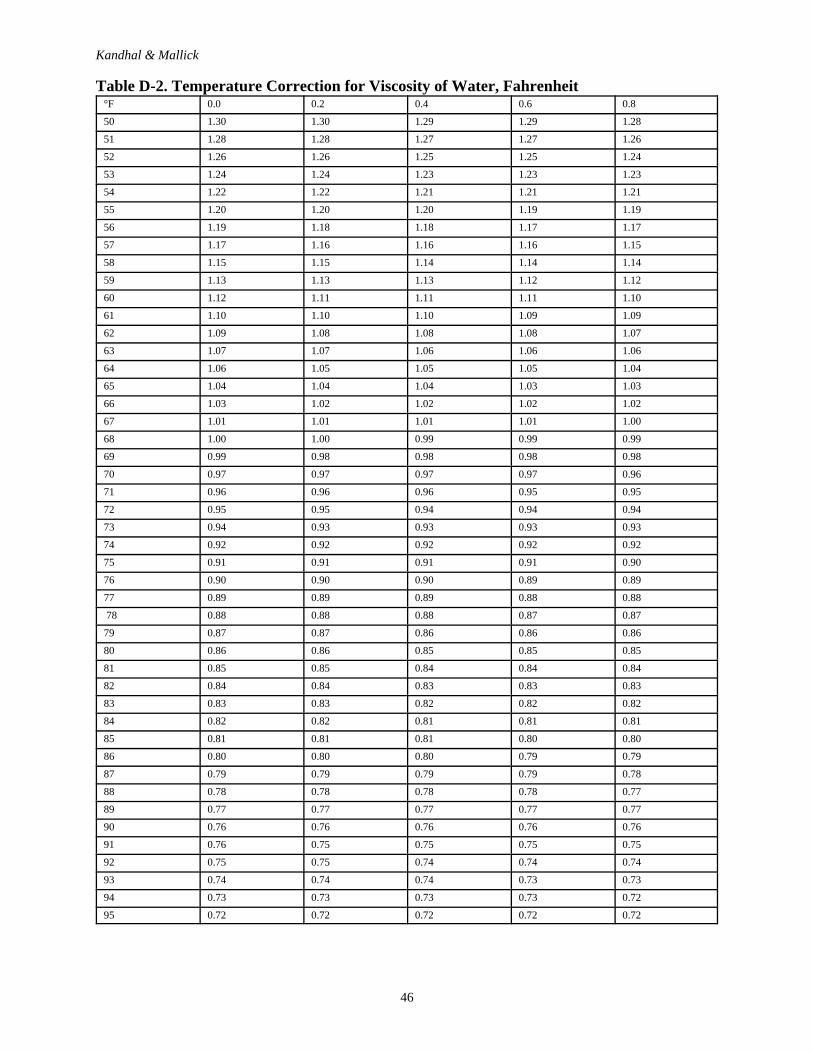
Kandhal & Mallick
46
Table D-2. Temperature Correction for Viscosity of Water, Fahrenheit°F 0.0 0.2 0.4 0.6 0.8
50 1.30 1.30 1.29 1.29 1.28
51 1.28 1.28 1.27 1.27 1.26
52 1.26 1.26 1.25 1.25 1.24
53 1.24 1.24 1.23 1.23 1.23
54 1.22 1.22 1.21 1.21 1.21
55 1.20 1.20 1.20 1.19 1.19
56 1.19 1.18 1.18 1.17 1.17
57 1.17 1.16 1.16 1.16 1.15
58 1.15 1.15 1.14 1.14 1.14
59 1.13 1.13 1.13 1.12 1.12
60 1.12 1.11 1.11 1.11 1.10
61 1.10 1.10 1.10 1.09 1.09
62 1.09 1.08 1.08 1.08 1.07
63 1.07 1.07 1.06 1.06 1.06
64 1.06 1.05 1.05 1.05 1.04
65 1.04 1.04 1.04 1.03 1.03
66 1.03 1.02 1.02 1.02 1.02
67 1.01 1.01 1.01 1.01 1.00
68 1.00 1.00 0.99 0.99 0.99
69 0.99 0.98 0.98 0.98 0.98
70 0.97 0.97 0.97 0.97 0.96
71 0.96 0.96 0.96 0.95 0.95
72 0.95 0.95 0.94 0.94 0.94
73 0.94 0.93 0.93 0.93 0.93
74 0.92 0.92 0.92 0.92 0.92
75 0.91 0.91 0.91 0.91 0.90
76 0.90 0.90 0.90 0.89 0.89
77 0.89 0.89 0.89 0.88 0.88
78 0.88 0.88 0.88 0.87 0.87
79 0.87 0.87 0.86 0.86 0.86
80 0.86 0.86 0.85 0.85 0.85
81 0.85 0.85 0.84 0.84 0.84
82 0.84 0.84 0.83 0.83 0.83
83 0.83 0.83 0.82 0.82 0.82
84 0.82 0.82 0.81 0.81 0.81
85 0.81 0.81 0.81 0.80 0.80
86 0.80 0.80 0.80 0.79 0.79
87 0.79 0.79 0.79 0.79 0.78
88 0.78 0.78 0.78 0.78 0.77
89 0.77 0.77 0.77 0.77 0.77
90 0.76 0.76 0.76 0.76 0.76
91 0.76 0.75 0.75 0.75 0.75
92 0.75 0.75 0.74 0.74 0.74
93 0.74 0.74 0.74 0.73 0.73
94 0.73 0.73 0.73 0.73 0.72
95 0.72 0.72 0.72 0.72 0.72


