Page 1
DESIGN OF SPECIALITY MILK AND COMPETITIVE ADVANTAGE OF
DAIRY PROCESSING FIRMS IN NAIROBI COUNTY
BY
MIRIAM NDUTA MUKUNDI
RESEARCH PROJECT PRESENTED IN PARTIAL FULFILLMENT OF THE
REQUIREMENTS OF THE MASTERS OF BUSINESS ADMINISTRATION-
OPERATIONS MANAGEMENT, SCHOOL OF BUSINESS,
UNIVERSITY OF NAIROBI
2018
Page 2
i
DECLARATION
This research project is my original work and has not been presented for any academic
fulfillment in any other institution of learning.
Signed...................................................... Date...............................................
MIRIAM NDUTA MUKUNDI
D61/87950/2016
This research project has been submitted for examination with our approval as University
of Nairobi Supervisors.
Signed........................................................ Date..............................................
MR. LAZARUS MULWA
DEPARTMENT OF MANAGEMENT SCIENCE
SCHOOL OF BUSINESS,
UNIVERSITY OF NAIROBI.
Signed........................................................ Date..............................................
MR. ERNEST AKELO
DEPARTMENT OF MANAGEMENT SCIENCE
SCHOOL OF BUSINESS,
UNIVERSITY OF NAIROBI.
Page 3
ii
DEDICATION
I dedicate this work to my family for their prayers and moral support.
Page 4
iii
ACKNOWLEDGEMENT
I would like to thank God for enabling me to reach this far and completing my studies.
Secondly, I am grateful to my supervisors Mr. Lazarus Mulwa and Mr. Ernest Akelo who
have guided and criticized my project through valuable discussions and their unreserved
patient with me. I appreciate their time, energy and expertise.
I would also like to thank all the respondents and dairy processing firms who allowed me
to collect data which has helped in this research. Lastly, I would like to thank my family
for their unending support and encouragements which pushed me to complete my research.
Thank You.
Page 5
iv
TABLE OF CONTENTS
DECLARATION ................................................................................................................. i
DEDICATION .................................................................................................................... ii
ACKNOWLEDGEMENT ................................................................................................. iii
LIST OF TABLES ............................................................................................................ vii
LIST OF FIGURES ......................................................................................................... viii
ABBREVIATION AND ACRONYMS ............................................................................ ix
ABSTRACT ........................................................................................................................ x
CHAPTER ONE ................................................................................................................. 1
INTRODUCTION .............................................................................................................. 1
1.1 Background of the Study ...................................................................................... 1
1.1.1 Product Design ................................................................................................. 3
1.1.2 Design Results .................................................................................................. 3
1.1.3 Competitive Advantage .................................................................................... 4
1.1.4 Dairy Processing Firms in Nairobi ................................................................... 6
1.2 Research Problem ................................................................................................. 8
1.3 Research Objectives ........................................................................................... 10
1.4 Value of the Study .............................................................................................. 10
CHAPTER TWO .............................................................................................................. 11
LITERATURE REVIEW ................................................................................................. 11
2.1 Introduction ........................................................................................................ 11
2.2 Literature Review ............................................................................................... 11
2.2.1 Product Design Theory ................................................................................... 11
2.3 Product Design in Dairy Products ...................................................................... 13
2.4 Literature Review ............................................................................................... 14
2.6 Conceptual Framework ...................................................................................... 19
CHAPTER THREE .......................................................................................................... 21
RESEARCH METHODOLOGY...................................................................................... 21
3.1 Research Design ................................................................................................. 21
3.2 Target Population ............................................................................................... 21
3.2.1 Sampling ......................................................................................................... 22
3.3 Data Collection ................................................................................................... 22
3.4 Data Analysis ..................................................................................................... 23
3.4.1 Analytical Model ............................................................................................ 23
Page 6
v
CHAPTER FOUR ............................................................................................................. 25
DATA ANALYSIS, RESULTS AND DISCUSSION ..................................................... 25
4.1 Introduction ........................................................................................................ 25
4.2 Demographic Characteristics ............................................................................. 25
4.2.1 Location .......................................................................................................... 25
4.2.2 Age.................................................................................................................. 26
4.2.3 Household Size .............................................................................................. 27
4.2.4 Employment.................................................................................................... 28
4.2.5 Household Income ......................................................................................... 28
4.3 Design, Brand and Preferences .......................................................................... 29
4.3.1 Specialty Processed Milk Purchase ................................................................ 30
4.3.2 Brand Bought .................................................................................................. 30
4.3.3 Brand Purchase Frequency ............................................................................. 31
4.3.4 Brand Switch Reasons ................................................................................... 32
4.3.5 Likelihood to Change Brand ........................................................................... 33
4.3.6 Specialty Milk Consumption .......................................................................... 34
4.3.7 Visual Design Characteristics- Attention ....................................................... 35
4.3.8 Product Recognition ....................................................................................... 36
4.4 Brand Consumed Agreement ............................................................................ 36
4.5 Product Design Elements and Firm Competition Relationship ......................... 38
4.5.1 Regression Model Summary .......................................................................... 38
4.5.2 ANOVA Results .......................................................................................... 39
4.5.3 Regression Coefficients ............................................................................. 40
4.6 Analysis of Qualitative Data .............................................................................. 40
4.6.1 Basic Information ........................................................................................... 41
4.6.2 Product Design ............................................................................................... 41
4.6.3 Health Factors ................................................................................................. 42
4.6.4 Design Elements on Sales............................................................................... 42
4.6.5 Products Design and Target Groups ............................................................... 43
4.6.6 Texture, Taste and Smell Design .................................................................... 43
4.6.7 Testing of Designs .......................................................................................... 44
4.6.8 Product and Package Design Safety ............................................................... 44
4.7 Quantitative and Qualitative data merger........................................................... 45
Page 7
vi
CHAPTER FIVE .............................................................................................................. 46
SUMMARY OF FINDINGS, CONCLUSIONS AND RECOMMENDATIONS ........... 46
5.1 Introduction ........................................................................................................ 46
5.2 Summary of the Findings ................................................................................... 46
5.3 Conclusions ........................................................................................................ 48
5.4 Recommendations .............................................................................................. 49
5.5 Limitations of the study...................................................................................... 50
5.6 Suggestions for further research ......................................................................... 50
REFERENCES ................................................................................................................. 51
Appendix I: Transmittal Letter ......................................................................................... 55
Appendix II: Interview Guide for Design department heads ............................................ 56
Appendix III: Consumer Respondents Questionnaire ...................................................... 57
Appendix IV: List of processors to be used for the study................................................. 60
Page 8
vii
LIST OF TABLES
Table 1 Location ............................................................................................................... 26
Table 2 Respondent’s age ................................................................................................. 26
Table 3 Household size ..................................................................................................... 27
Table 5 Household Income ............................................................................................... 29
Table 6 Specialty processed milk Purchase ...................................................................... 30
Table 7 Brand purchased .................................................................................................. 31
Table 8 Brand purchase frequency ................................................................................... 32
Table 9 Reasons for the Switch ........................................................................................ 32
Table 10 Likelihood to change brand ............................................................................... 33
Table 11 Mean of likelihood to change brand .................................................................. 34
Table 12 Specialty Milk consumption .............................................................................. 34
Table 13 Design characteristics ........................................................................................ 35
Table 14 Design Recognition............................................................................................ 36
Table 15 Design Recognition............................................................................................ 37
Table 17 Regression Coefficients ..................................................................................... 40
Page 9
viii
LIST OF FIGURES
Figure 2 Conceptual framework .................................................................................................... 20
Page 10
ix
ABBREVIATION AND ACRONYMS
TBC Total Bacterial Count
KCC Kenya Corporation Creameries
KDB Kenya Dairy Board
GDP Gross Domestic Product
SALL Sameer Agricultural & Livestock Limited
UHT Ultra Heat
UOD User Oriented Design
CAD Computer Aided Design
SET Social-Economic-Technological
CBD Central Business District
WMP Whole Milk Powder
ROI Return on Investment
Page 11
x
ABSTRACT
The milk industry in Kenya is a source of income and food and a major contributor to the
national GDP. However, the processing firms in the industry face product design problems
which affect their competitiveness. The purpose of the study was to establish how the
design of specialty milk influence competiveness of the processing firms. The targeted
population was 11 milk processing firms in Nairobi county and 40 consumers of specialty
milk selected randomly to confirm the responses given by firms. The mixed method was
selected for acquiring and analyzing the results of the research. Quantitative data was
collected from 40 respondents via questionnaire and analyzed via SPSS. Qualitative data
was collected through interviews on 7 firms among all the 11 processing firms and content
analysis was conducted. The result of the study showed that product design of specialty
milk is a major contributor to gaining competitive edge. By examining the consumer
perception towards the brands they consume, it was found that design elements like
packaging, colour, graphics and information influence the decision making and attracts
consumer attention but more importantly consumers are concerned with health factors,
taste and smell of the milk they consume. Based on the findings, processing firms could
gain competitive edge by working on their product design to be unique and cooperating
with consumer’s requirements. Further research could investigate on other competitive
product/service design requirements in different industries.
Page 12
1
CHAPTER ONE
INTRODUCTION
1.1 Background of the Study
Consumer market advance each year, and competition increases steadily among different
types of product and goods. Every firm tries to invent new products and keep on developing
the current products to gain a competitive edge by providing what the end consumers want
(Knesia, 2013). One of the most important marketing tools is product design which allows
companies to have more priorities and be different among competitors (Lorenzo, 1986).
The ability to compete with other firms depends on their capability to design viable product
ideas and translate them into success (Canadian, 2012). Product design is a cycle of
continuous improvement that relates to many factors: customers’ changes in taste and
preferences, local and international competition, health issues, convenience and costs,
standards conformance, environmental issues and technological advances (Akrani,
2012). Today, a company which does not invest in innovative product design, stand the
risk of being displaced from its market position.
Product design is a non-price factor that determines the success of a product and its role
changes throughout the product lifecycle (Murray, 2005). The product may create a need
that never existed before (e.g., the introduction of Sony Walkman) or different products
may compete in the same market (e.g., cars and buses collide for the same transportation
services). Walsh (1992) more competitors enter the market as the product lifecycle matures
and the chief role of product design differentiation is through appearance, ease of use,
quality, reliability, performance, and reparability. The design importance as a non-price
Page 13
2
factor is that: Consumers will select superior designed, highly characterized products when
given a choice between two similar commodities of the same price and select cheaper of
two products with identical design and aspects (Murray, 2005). Walsh (1992) the Design
Innovation Group of Open University (DIGOU) and Manchester Institute of Science
conducted studies in the UK on return on investment (ROI) in design. One study showed
that ‘sensitive design firms' had one percent higher profit margin, three percent higher
return on equity, seven percent higher capital growth and twenty-eight percent higher
turnover growth.
The functional demand on milk ingredients have created demand for specialty milk design
which possess specific functional properties for specific uses (Glyn, Phillips & Williams,
2007). Dairy products are designed as functional and nutraceutical food to be consumed by
people who are health conscious (Canadian, 2012). Primila, Akhilesh and Devendra (2015)
stated that this could be done by incorporating required functional ingredients in processing
cycle or modifying the products in protein/amino acid composition, alteration in lactose,
fats and fatty acid modification, eliminating lactoglobulin from milk, decreasing allergies
and adding therapeutic proteins. These dairy product design transformations increase
consumption as specific utilities are met (Balakrishnan, 1996).
Kenya dairy processing firms have not yet managed to reach the level of these technologies
fully hence the need for this study. The social-environmental changes and eating behavior
has contributed to pressure on the dairy products to add unique values and be in a position
to compete with other energy drinks (Mburu, 2016). To be positioned in the market and
meet the demand of its consumers, dairy products has to be designed in a way that increases
their properties according to the environmental needs. The product innovations are
Page 14
3
expensive and risky, but with proper research, the success justifies the costs and risks
(Dickson, 1995).
1.1.1 Product Design
There is rising interest of scholars and management in design following the increase of
awareness in the education realm (Merrit & Lavelle, 2005). Trueman and Jobber (1998)
producers derive many benefits from designed products. Effective design has the capability
of matching the product or service characteristics with what the consumers require,
ensuring consumers’ requirements are met at an affordable cost and reduce time in
designing of new products. The study will research in detail product design as it defines
the appearance of a product, specifies materials to be used, determines dimension and
tolerance and sets performance standards. There are key stages in design processes: design
activities (how design decisions should be made), design Choices (how functional and
formal product properties are affected by design decisions) and design results (How
product properties influence firm performance) (Macpherson, 2010).
1.1.2 Design Results
Design results regarding consumer response, financial performance, and operational
efficiency are related to design choices on commercial, finance and operational
performance. According to Lorenzo (1986), sound design has the capability of positively
affecting the competitive performance of a product. Dickson, Schneir and Lawrence (1995)
showed that CEOs who invest in design activities experience strong organizational
competitiveness. Gemser and Leenders (2001) added that improved levels of design
integration and product development influence profits and turnover growth.
Page 15
4
Whyte et al. (2003) outlined areas where marketing and design integration is desirable and
the underlying conditions. Perks et al. (2005) further showed that an organization that
considers design as a crucial aspect of the new product development process could display
strong financial and competitive performance. Veryzer (1995, 1999) regarded product form
as the first opportunity to capture the customer impression of a product. Based on
traditional experimental studies, research documented how product aesthetics influence
customer preferences, their brand understanding, and categorization and their buying
decisions. Cox and Cox (2002) later showed that visually complex product designs tend to
add their preferences with repeated exposure. Kumar and Garg (2010) recently proved how
consumers prefer designs that match or balance their attentional resources levels needed
and visually evaluating the design pleasantness. Landwehr et al. (2011) elaborated how
product “facial” expression can trigger pleasure and arousal to consumer liking the product.
The results of a product design create a competitive advantage through evoking consumer
attention to investigate the content and information about the actual product (Rundh, 2009).
1.1.3 Competitive Advantage
Product design is the fundamental determinant for product quality, performance, cost and
speed through which improved and new products are brought to the market. Council (1991)
added that this makes design excellence a primary means through which firms can gain
profitability and competitiveness. Studies on US firms propose that designing for
competitive edge need the commitment to continuous advancement, following a tailored
product realization progress, use design practices to implement their parallel redundancy
protocol (PRP) and promote a supportive design surroundings (Stalk, 1988). The main
Page 16
5
issue to win competitive battles is the corporate doubting their ability and the challenges
they are facing.
Competitiveness can be analyzed using past performance indicators (Hartmann, 1997) like
market share, product cost, productivity, gross margin, net income, return on assets, total
factor productivity, (Farole, 2010; Kortelainen, 2011) financial performance ( sales growth,
profit, ROI), non-financial performance (customer satisfaction, employees growth,
balanced scorecard and benchmarking). Profitability, productivity and market share are
traditional indicators of competitiveness, but studies have shown they are inadequate when
alone at the firm level. This scenario is relatively similar to the dairy processing industry
in measuring competitive advantage (Bojnec, 2003; Gaytan & Benito, 2014; Voulgaris &
Papadogonas, 2013). Notta (2011) on the study of food, uses productivity, profitability and
market share. Woodford, Greer, and Phillips (2014) survey on dairy farming sector uses
yield to measure competitiveness. To measure the competitiveness of South Africa
commercial milk producers (Toit, 2010) uses profitability. The success of product
measures is mostly tied to firm performance variables such as market share, quality, sales,
innovativeness, brand advancement, profit and agility to market (Amaldoss & Jain, 2008;
Verma, 2001;Verganti, 2007).
Effects of product design involve consumer feedback on assessment and choice, firm
performance and the success level of product variables (Alba, 2011). In dairy processing,
a competitive advantaged firm will be recognized through the value of its product to the
consumer. A great way of finding strategic advantage is observing the customers
preferences and their purchasing patterns. Swink (1998) summarized characteristics of
Page 17
6
qualifying orders that we might apply in our dairy firms to product information, quality
conformance, flexibility, development costs, and delivery reliability.
1.1.4 Dairy Processing Firms in Nairobi
Dairy processing firms in Kenya were established way back in the colonial era when dairy
commercialization was introduced. This was through the importation of exotic herds to
upgrade local cattle, policy establishment, the institutional and regulatory framework in the
industry among others (William, 1992). Kenya Corporation Creameries (KCC) was the
pioneer processing firm incorporated in 1925 (Muriuki et al., 2003). KCC established
deports in many Kenyan parts to distribute milk products and accommodate farmers and
dairy societies. It processed fresh liquid milk, butter, powder milk, ghee, cream, yogurt,
cream and cheese and became a household name and enjoyed a monopoly status for more
than 60 years not keen to pursue product design innovations.
Since 1992 liberalization, the industry has tremendously grown leading to informal small-
scale milk traders who deal with raw milk marketing producing over 80% of national milk
(Muriuki, 2011). The collapse of the monopoly of Kenya Co-operatives Creameries (KCC)
in 1992, lead to the emergence of new processors. According to the Kenya Dairy Board
statistics in 2010, there were an estimated 27 processors in Kenya. Muriuki et al. (2003)
found that the dairy industry contributes 14% agricultural GDP and 6-8% of country GDP
making Kenya one of the largest milk producer in Africa (FoodBusinessAfrica.com, 2013).
This agricultural subsector is a crucial player in Kenya’s economic growth with an
estimated 5 billion liters of milk produced annually (Foodworld, 2013).
Page 18
7
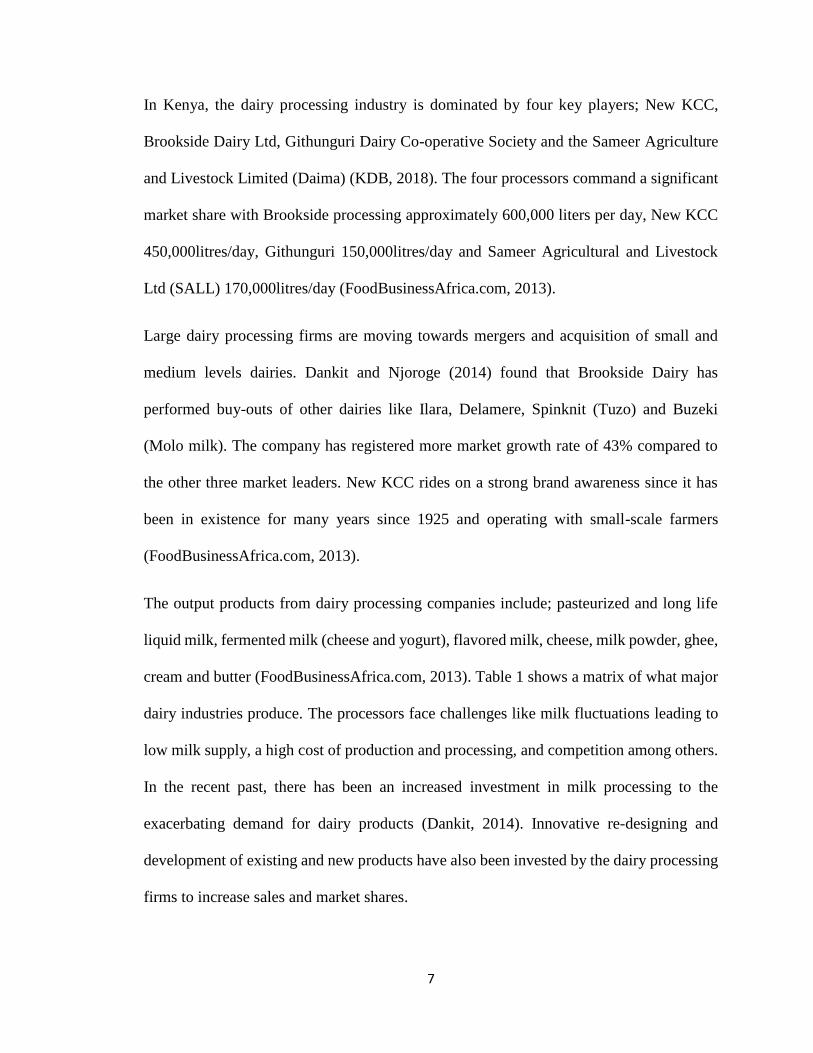
In Kenya, the dairy processing industry is dominated by four key players; New KCC,
Brookside Dairy Ltd, Githunguri Dairy Co-operative Society and the Sameer Agriculture
and Livestock Limited (Daima) (KDB, 2018). The four processors command a significant
market share with Brookside processing approximately 600,000 liters per day, New KCC
450,000litres/day, Githunguri 150,000litres/day and Sameer Agricultural and Livestock
Ltd (SALL) 170,000litres/day (FoodBusinessAfrica.com, 2013).
Large dairy processing firms are moving towards mergers and acquisition of small and
medium levels dairies. Dankit and Njoroge (2014) found that Brookside Dairy has
performed buy-outs of other dairies like Ilara, Delamere, Spinknit (Tuzo) and Buzeki
(Molo milk). The company has registered more market growth rate of 43% compared to
the other three market leaders. New KCC rides on a strong brand awareness since it has
been in existence for many years since 1925 and operating with small-scale farmers
(FoodBusinessAfrica.com, 2013).
The output products from dairy processing companies include; pasteurized and long life
liquid milk, fermented milk (cheese and yogurt), flavored milk, cheese, milk powder, ghee,
cream and butter (FoodBusinessAfrica.com, 2013). Table 1 shows a matrix of what major
dairy industries produce. The processors face challenges like milk fluctuations leading to
low milk supply, a high cost of production and processing, and competition among others.
In the recent past, there has been an increased investment in milk processing to the
exacerbating demand for dairy products (Dankit, 2014). Innovative re-designing and
development of existing and new products have also been invested by the dairy processing
firms to increase sales and market shares.
Page 19
8
Kenya milk processors face challenges in the supply of milk as rainfall patterns dictate it
(oversupply in January, May and December and scarce in September and October) (Njarui,
Gatheru, Wambua, Nguluu & Mwangi, 2010). Njarui et al. (2010) further added that some
processors are constrained in producing some selected milk products due to lack of
equipment, power, lack of skilled workforce and low demand for their products. Poor road
infrastructure hinders quick transportation of milk increasing the costs and lowering the
profit margins (EPZ, 2005). Another major constraint is the high fuel cost that is VAT
taxed.
1.2 Research Problem
Product design conditions the accomplishment of the universal firms and ability to stand
for competition globally (Brondoni, 2015). This takes shape by recognizing the design of
products with new characteristics that are desired by customers and adjusts with time and
space. Product designing, therefore, means designing an offer that best define the specific
unique features with customer and competitors’ information. Firms need to focus on
product design processes to maintain profit limits and cope with competition (Chiva, 2009).
Christiaans and Almendra (2010) mentioned that the functionality of the new design
serving the changing market and responding to market dynamics and shorter product cycles
is essential. In the last few years, Korean chaebols (Kia, KTF, Hyundai, Daewoo
Electronics, Samsung Electronics, and LG) have become sensitive to design trends and are
transitioning to design core competence (Borja & Young, 2009). Payam (2010) found that
in Iran, dairy companies are faced with design issues as many products fail due to trial and
error systems. The issue is solved through R&D departments which conduct analysis on
products design development.
Page 20
9
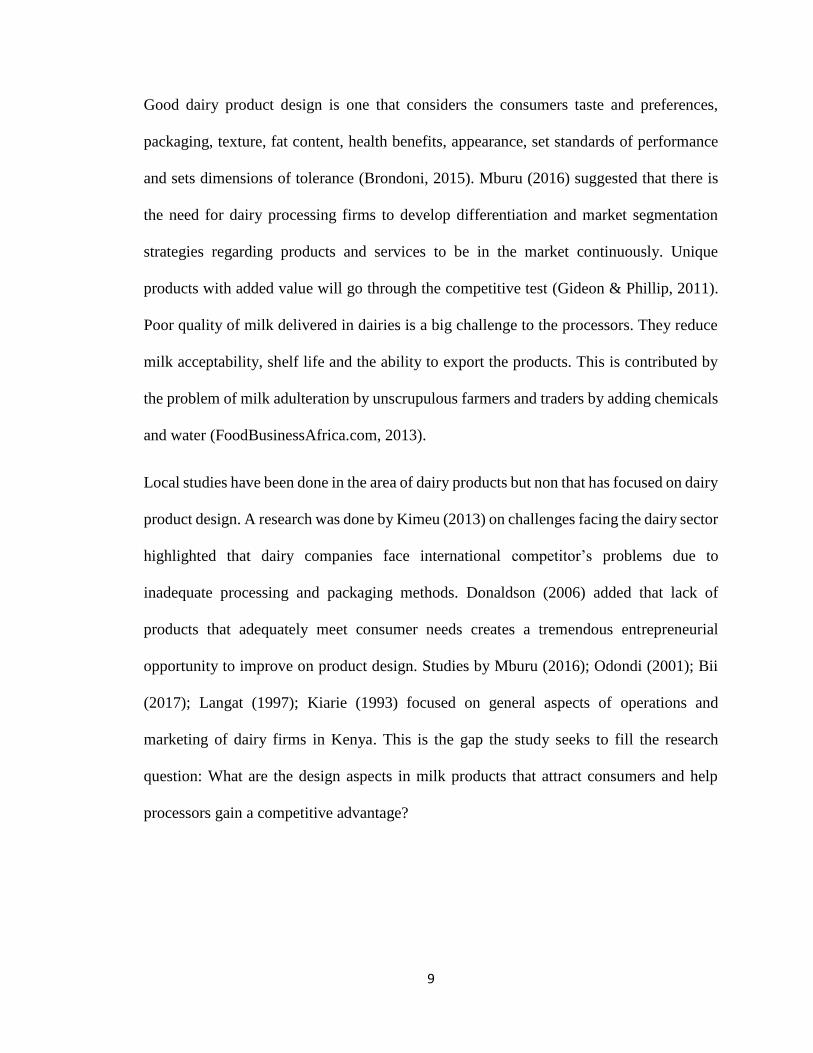
Good dairy product design is one that considers the consumers taste and preferences,
packaging, texture, fat content, health benefits, appearance, set standards of performance
and sets dimensions of tolerance (Brondoni, 2015). Mburu (2016) suggested that there is
the need for dairy processing firms to develop differentiation and market segmentation
strategies regarding products and services to be in the market continuously. Unique
products with added value will go through the competitive test (Gideon & Phillip, 2011).
Poor quality of milk delivered in dairies is a big challenge to the processors. They reduce
milk acceptability, shelf life and the ability to export the products. This is contributed by
the problem of milk adulteration by unscrupulous farmers and traders by adding chemicals
and water (FoodBusinessAfrica.com, 2013).
Local studies have been done in the area of dairy products but non that has focused on dairy
product design. A research was done by Kimeu (2013) on challenges facing the dairy sector
highlighted that dairy companies face international competitor’s problems due to
inadequate processing and packaging methods. Donaldson (2006) added that lack of
products that adequately meet consumer needs creates a tremendous entrepreneurial
opportunity to improve on product design. Studies by Mburu (2016); Odondi (2001); Bii
(2017); Langat (1997); Kiarie (1993) focused on general aspects of operations and
marketing of dairy firms in Kenya. This is the gap the study seeks to fill the research
question: What are the design aspects in milk products that attract consumers and help
processors gain a competitive advantage?
Page 21
10
1.3 Research Objectives
The general objective is to establish how product design can be used as a competitive edge
by dairy processing firms. The study will be guided by the following specific objectives:
i) To determine the dairy products design elements which are key to customers
preferences.
ii) To establish design elements which dairy processing firms choose in designing their
products.
iii) To establish the effect of product design elements and competitive advantage in the
dairy processing industry.
1.4 Value of the Study
The findings of this study will be of value to the future researchers and academicians who
are interested in studying how specialty product design in the dairy processing industry
contribute to the performance of a company. Given there no specific studies done on dairy
products designs, this study will add insight on innovative positional strategies that help
understand the product meaning in the eye of viable consumers and the selected target
market segment (Kim, 1999). The study will be beneficial to informal and formal
processors who endeavor to explore the dairy market in depth. Companies that adopt
product design innovations win improved business performance, reputation for quality,
empowers the product, brand, and marketing, boost customer loyalty and improves
environmental records and regulation compliance (Dankit, 2014).
Page 22
11
CHAPTER TWO
LITERATURE REVIEW
2.1 Introduction
This chapter gives an overview of previous studies on related product design topics
researched on. It will discuss theoretical studies, product design, and design for competitive
advantage, empirical studies, and conceptual framework.
2.2 Literature Review
The study will be based on the product design theory as an art, and a science and will
elaborate on how applicable it can be used by dairy processing firms to achieve a
competitive edge.
2.2.1 Product Design Theory
Hevner (2004) states that the theory of design focuses on "how to do something." This
theory gives explicit prescriptions on designing and developing artifacts whether in
managerial or in technological interventions. Cross (2001), shows how design work can
proceed without reflecting on theory and must keep in mind that design knowledge resides
in product materials, forms and finishes with design attributes. However, Gregor (2007)
agrees with Cross (2001) but insists that design research need development of more formal
knowledge of configuration and shape. Gregor (2007) added that theoretical design
morphology studies are essential to add to the informal knowledge. According to Zeng
(1999), there is so much progress in different disciplines among them philosophy,
Page 23
12
engineering, computer science, psychology, etc. in many aspects like natural phenomena,
design model computation, and cognitive models. The design is a creative act with a style
that can be assessed with information processes while others cannot. New design or
development can be due to demand or motives, malfunction or failure on existing products
or complaints about an existing product (Zeng, 1999).
Many disciplines have also approached design research problems including industrial
designs and architecture. Cross (2001) traces the science of design back in the 20th-century
movement of modern design noting that ‘Design Science' probably was introduced in the
1960s by Buckminster Fuller who held a design science revolution. Gamma (1995)
mentioned that design patterns approach sought to describe problems and solutions that
arose from context forces. Fernadez (1998) added that design patterns apply to a range of
disciplines and system analysis. A further relevant approach of the theory of design appears
in management (Aken, 2005). A theme with many research on design is vital in addressing
the problems and framing solutions to practitioners through an iterative and reflective
research process (Aken, 2004).
The Science aspect of design allows people to gain a better understanding of design
processes while the art aspect will enable designers' maintain their creativity in a
rationalized process (Kirschman, 1196). The main aim of scientific design theory is to
disclose and discover the order of design processes. The formulation of design starts with
design requirements and ends with a product description. In the process of designing,
requirements are represented by design specifications which generate a candidate product.
Halser et al. (2004) added that information on product requirements has to come from the
Page 24
13
consumers. The study will establish whether consumer perception matters in the design of
a product.
Kabecha (1998) documents the innovativeness of product design in the informal sector to
improve on the know-how machinery and appropriate tools to foster growth. Although
product design as an art and science have been widely used, no research has systematically
focused on dairy product designs features and how they affect the competitiveness of the
processors. This theory can be applied by the dairy processing firms in Kenya in developing
more formal design processes and understanding the design patterns to find a solution to
problems.
2.3 Product Design in Dairy Products
Design has been effectively used in dairy products, and all the types of products available
in different outlets scream for attention and communicate to tastier, healthier and better
benefits than the competitors (Gelici, Lutters, Klooster & Weijzen, 2012). According to
tetrapak.com (2015), the material designed for packaging dairy products should be able to
enhance efficient milk distribution, maintain product hygiene, reduce dairy product
spoilage and waste, protect nutrients and flavors and convey product information.
According to Prima et al. (2015) modern era consumers are aware of their health and
processors need to design milk products in a way that it adds particular nutritive value to
compete with today’s demand. Gulati, Kitessa, Ashes, Simos and Wynn (2000) added that
milk has to be designed or enriched with modified content from the constituent milk to be
classified as humanized milk or milk with therapeutic purposes by reducing fat content,
Page 25
14
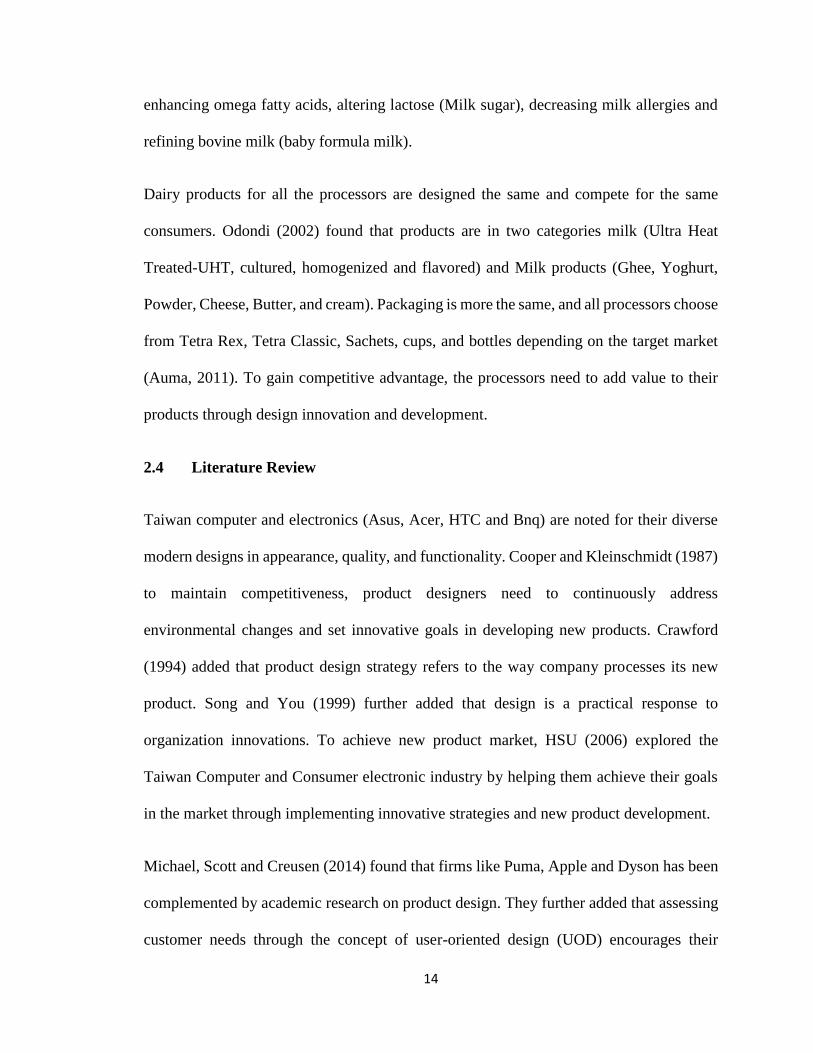
enhancing omega fatty acids, altering lactose (Milk sugar), decreasing milk allergies and
refining bovine milk (baby formula milk).
Dairy products for all the processors are designed the same and compete for the same
consumers. Odondi (2002) found that products are in two categories milk (Ultra Heat
Treated-UHT, cultured, homogenized and flavored) and Milk products (Ghee, Yoghurt,
Powder, Cheese, Butter, and cream). Packaging is more the same, and all processors choose
from Tetra Rex, Tetra Classic, Sachets, cups, and bottles depending on the target market
(Auma, 2011). To gain competitive advantage, the processors need to add value to their
products through design innovation and development.
2.4 Literature Review
Taiwan computer and electronics (Asus, Acer, HTC and Bnq) are noted for their diverse
modern designs in appearance, quality, and functionality. Cooper and Kleinschmidt (1987)
to maintain competitiveness, product designers need to continuously address
environmental changes and set innovative goals in developing new products. Crawford
(1994) added that product design strategy refers to the way company processes its new
product. Song and You (1999) further added that design is a practical response to
organization innovations. To achieve new product market, HSU (2006) explored the
Taiwan Computer and Consumer electronic industry by helping them achieve their goals
in the market through implementing innovative strategies and new product development.
Michael, Scott and Creusen (2014) found that firms like Puma, Apple and Dyson has been
complemented by academic research on product design. They further added that assessing
customer needs through the concept of user-oriented design (UOD) encourages their
Page 26
15
explicit consideration of the product. In addition to which firms can achieve success in
addressing customer needs throughout the product lifecycle (Kahn, 1998). In addition to
the above contribution, Regal Marine, one of the largest powerboat manufacturer achieve
its mission through differentiating its products concerning quality, innovation and unique
features leading to increased sales (Mohammed, 2015). The company can meet the issue
of competitiveness, and the changing consumer tastes through the use of computer-aided
design (CAD) software that helps provide good value to the customers.
Frankie and Skreier (2008) argued that trade-offs between the variety of products to
increase customers appeal and component sharing reducing costs of production is
preferable when the designed product is more visible to customers. Desai et al. (2001)
found that coordination of design, marketing and manufacturing departments help in
balancing revenues and costs from component sharing. Krishnan and Gupta (2001) added
that product platforms for extreme market diversity are not appropriate. Product modularity
improves manufacturing flexibility, quality and cost and can also increase acceptance to
changing customer demands and improve the performance of the new product (Lau et al.,
2010).
Rundh (2009) product design is influenced by consumer behavior which is determined by
demographic and lifestyle factors. Changes in the size of household influence the consumer
lifestyle leading to firms adapting to designing quantities that fit the consumer preferences
and needs (Ksenia, 2013). EU (2006) added that governments around the world pay keen
attention to environmental problems and are suggesting and implementing solutions. The
product design directive describes the minimization of waste and encourages the recycling
of packaging materials.
Page 27
16
Cagan and Vogel (2002) developed the user-centered approach that uses social, economic
and technological (SET) factors to identify product opportunities and exploit the targeted
market. Further, Cagan & Vogel added that for a product to sell, it must form value to the
consumers’ eyes which may be broken down to aesthetics, emotions, product identity,
quality, impact, ergonomics, and core technology. According to Löfgren (2005) packaging
has a powerful and unique tool that persuade consumers to buy a product before
consuming. Moskowitz, Reisner, Lawlor and Deliza (2009) suggested that this persuades
the consumer at the point of purchase despite there being the challenge of a competitive
environment. Young (2004) added that product design through packaging could generate
product expectations which in turn affects consumers’ perception and purchase decision
on the brand. Expectations emerge from package design cues such as word, materials,
symbols, colours, images, and shapes (Langley, Turner & Yoxall, 2010). The identification
of signals that help a product design stand out and communicate to consumers and match
their needs might offer possibilities for consumer product satisfaction.
The product design characteristics and features highlight the originality and uniqueness of
a product through packaging. Visual (size/ shape and graphics) and informational elements
influence the consumer buying decisions (Silayoi & Speece, 2007). Graphics include
colour combination, image layout, colour, product photography, and typography. All these
combinations communicate image with detail information about the product (Herrington
& Capella, 1995). In a supermarket, the positioning and differential perception of the
graphics can be the cause of missing or identifying a product (Silayoi, 2007). Cheskin
(1957) mentioned that the selection of colour and combination of colour is a vital element
of design since it is usually memorable and vivid. The colour creates a meaningful effect
Page 28
17
on the capacity of the consumer to identify the product, the information on the package and
differentiate from other types and company names (Garber, 2000). According to Koch and
Koch (2003), colour on food packaging can influence product perception and expectations.
The right choice of colour serves as an important factor in changing product selection and
the brand impression (Gofman, 2010). The size and shape of a package is a significant
factor in making volume judgments, (Silayoi, 2007) consumers perceive packages that are
elongated to be larger and hence the products.
The information element is core when designing packaging for products. Communication
of information help consumers decide against purchasing processes. Coulson (2000) gives
an example of information significance when labeling food to communicate on healthy
eating which offers the consumer an opportunity to consider alternative products and make
the right choice. Inaccurate or misleading information can lead to contrary results through
small fonts and dense writing styles (Hausman, 2010). McNeal (2003) deem that
technology creates packaging according to consumer behaviors and attitudes and trends
and should be presented visually.
Firms can achieve greater success when they address consumer needs that are connected
to the product-market life-cycle (Khan, 1998). This demands for understanding the
relationship between product designs, cross-cultural differences, and innovation (Moon,
Miller & Kim, 2013). Ksenia (2013) found that the modern market has a wide variety of
product designs and is a reliable sector of industry and customers are fundamental element
of a market achievement allowing growth and development. For a firm to design an
appropriate product or service, it’s important to understand consumers’ perception, their
behaviors and meet their requirements (Solomon & Hogg 2010). This follows the consumer
Page 29
18
segmentation to meet their demands and can be done in different ranges like demography
(gender, age, religion, social-class), geographic (area), psychographic (personality, self-
image, habits) and behavioral (benefits, product usage).
There is an increasing demand for functional foods that are natural and balanced food
(Hasler, Bloch, Thomson, Enrione & Manning, 2004). Technology is enabling dairy
products to be designed as functional and nutraceutical food to be consumed by people
who are health conscious. Primila, Akhilesh and Devendra (2015) stated that this could be
done by incorporating required functional ingredients in processing cycle or modifying the
products in protein/amino acid composition, alteration in lactose, fats and fatty acid
modification, eliminating lactoglobulin from milk, decreasing allergies and adding
therapeutic proteins.
According to Auma (2011) firms presents their products in a way to influence consumers
purchasing decisions which are compelled by packaging colour, quality of the product.
Taste, smell, quantity, and design. Auma (2011) added that personal consumer
characteristics including lifestyle, personality, and demographics (age, occupation,
education, marital status, income, and location) which determines the choice of the brand
the consumer purchase. Kerubo (2011) found that social factors affecting a firm include
believes, attitudes, value, lifestyle and opinions towards the external environment of a firm.
The emerging social issues are strong instigators of industrial changes as consumers are
concerned about sugar, salt, saturated fat, carbohydrates, chemical additives, cholesterol,
and nutrition value food producers. Shifting of the societal concerns, lifestyle and attitudes
alter the competition pattern favoring those that respond quickly to being creative with
products targeted to new conditions and trends. Based on knowledge about the product
Page 30
19
usage and benefits, consumer education level determines what they purchase (Auma,
2011).
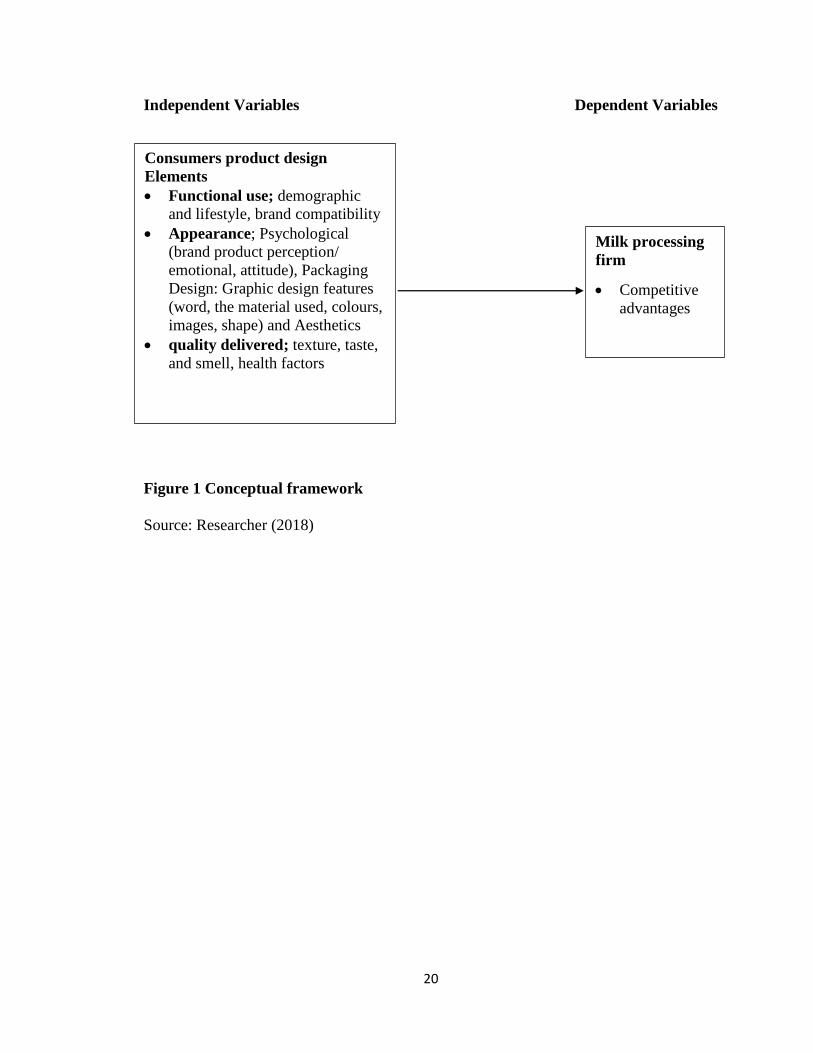
2.6 Conceptual Framework
Mugenda and Mugenda (2003) define the conceptual framework as a scheme of variables
(concepts) that the researcher operationalizes to achieve a set of objectives. It’s an
illustration that shows the independent and dependent variables relationship. From the
empirical studies, independent variables discussed in detail will be divided into:
Specialty product design elements that are key to consumers: Functional use; demographic
and lifestyle, health factors (fats and lactose level, allergic consumers), brand compatibility
with consumer class, original home of the consumer, Appearance; Psychological (brand
product perception/ emotional, attitude), Packaging Design: Graphic design features (word,
material used, colours, images, shape) and Aesthetics, quality delivered; texture, taste and
smell
Specialty product design elements considered when designing dairy products:
Environmental factors (electricity, accessibility, packaging, waste minimization),
Consumer needs, processes flexibility/cost and quality, differentiation factors,
informational elements, visual elements (size, shape, graphics), Consumer segmentation
Dependent variables from empirical studies will be the competitiveness of the dairy
processing firms and growth of the company's market share. In addition to this, economics
factors moderate how the independent variables influence the dependent variables.
Page 31
20
Independent Variables Dependent Variables
Figure 1 Conceptual framework
Source: Researcher (2018)
Consumers product design
Elements
Functional use; demographic
and lifestyle, brand compatibility
Appearance; Psychological
(brand product perception/
emotional, attitude), Packaging
Design: Graphic design features
(word, the material used, colours,
images, shape) and Aesthetics
quality delivered; texture, taste,
and smell, health factors
Milk processing
firm
Competitive
advantages
Page 32
21
CHAPTER THREE
RESEARCH METHODOLOGY
3.1 Research Design
The study used a mixed methodology research design where quantitative research was
employed on questionnaires and qualitative findings were obtained from the interview
guides. The mixture assisted in getting a comprehensive view of specialty milk product
design. Cooper and Schindler (2001) found that a detailed study answers the question of
how, who, what, where and when of an occurrence as connected to the study topic. The
study was formulated to intentionally determine how specialty milk product design can
influence the competitiveness of dairy processing firms in Nairobi County.
3.2 Target Population
The population of interest in this study were all the dairy processing firms in Nairobi
County which total to 11 and consumers of specialty designed milk from different estates
in Nairobi County. Nairobi was chosen for this study because it has a high concentration
of consumers of processed milk and has significant milk processors branches (KDB, 2004).
The firms in Nairobi provided information that can be generalized to represent the rest of
the regions in Kenya. Appendix IV shows the number of processors to be used in this study
as provided by different supermarket suppliers. The study targeted all the 11 dairy
processing firms for the survey.
Page 33
22
3.2.1 Sampling
The study used simple random procedure to sample consumers of specialty processed dairy
products. A sample size of 40 consumer respondents was used for this study to confirm the
response from the firms.
3.3 Data Collection
For this research purpose and to achieve the desired objectives, primary and secondary data
were used. The secondary data contributed more towards the background information to
build the project constructively and comprehend on the survey outcome. Most of the
secondary data were collected from KDB. Primary data was collected through interviews
with the heads/ representatives of the design department. The guide included sets of
questions in a logical series that were conducted via emails.
Secondly, a questionnaire survey was conducted on specialty milk consumers. It involved
visiting hypermarkets in malls, supermarkets in estates, minimarkets and shops in different
areas in Nairobi. This was done to confirm whether the firm response was the same as that
of the consumer. Research assistant was used to administer the questionnaires. Pre-testing
was conducted to ensure accuracy of the questionnaires. The questionnaires were divided
in two sections: - Section A had questions on respondents’ personal details and section B
will had questions asking about the design elements that influence consumer options to the
special milk brands they prefer. Likert type scale was used in ranking the choices of dairy
brand purchased by consumers to assess the degree of importance where 1=not at all
important and 5=most important.
Page 34
23
3.4 Data Analysis
The data was collected through interview guides and questionnaire, sorted and edited.
Statistical Package for Social Scientist (SPSS) was used to conduct analysis of the data
collected through the interview and questionnaire. The first objective of determining the
dairy products design elements that are key to consumers was analyzed using frequencies
and percentages. To assess the relationship between product design and competitive
advantage as perceived by the respondents’, regression analysis was used. Tables were
used to represent the rate of response and variable information considered in establishing
the factors considered by dairy processing firms when designing products. Mean Scores
were used to determine the importance of all the factors individually while standard
deviation evaluated the significance of statistical factors. The data collected through the
consumers’ questionnaire was analyzed through regression where percentages and tables
represented the rate of response and variable information considered in section A. Section
B was analyzed through Mean Scores to determine the importance of all the factors
individually. The Interview guides were analyzed through content analysis. Secondary data
from KDB was collected to establish the competitiveness of the dairy firms, was analyzed
through content analysis.
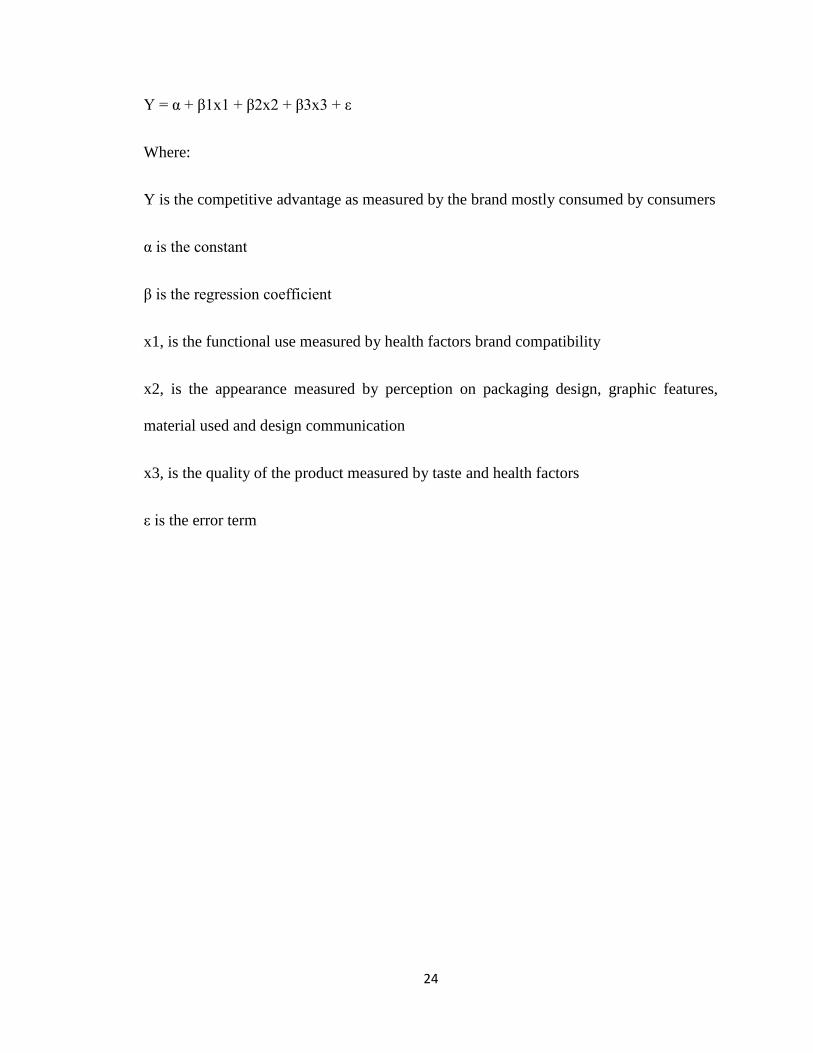
3.4.1 Analytical Model
The following linear multiple regression model was used for data analysis to test if the
effect of the independent variables were significant or not. The regression model was as
follows:
Page 35
24
Y = α + β1x1 + β2x2 + β3x3 + ε
Where:
Y is the competitive advantage as measured by the brand mostly consumed by consumers
α is the constant
β is the regression coefficient
x1, is the functional use measured by health factors brand compatibility
x2, is the appearance measured by perception on packaging design, graphic features,
material used and design communication
x3, is the quality of the product measured by taste and health factors
ε is the error term
Page 36
25
CHAPTER FOUR
DATA ANALYSIS, RESULTS AND DISCUSSION
4.1 Introduction
The chapter presents results and detailed discussion of the study, which set to establish how
specialty milk product design can be used as a competitive edge by dairy processing firms.
The analysis was based on the gathered data collected through interviews and
questionnaires. Interpretation of each finding on milk specialty product design is clearly
discussed on how it can lead to competitiveness of dairy processing firms.
4.2 Demographic Characteristics
Under the independent variable specialty product design elements that are key to
consumers is demographic characteristics. This section sought to determine the
demographic characteristics of the respondents, including how they relate to specialty
product design and competitive advantage by processing firms. Auma (2011) notes that
personal consumer characteristics like demographics (age, occupation, education, marital
status, income, and location) determines the choice of the brand the consumer purchase.
The characteristics to be discussed are age, location, employment, household population
and household income.
4.2.1 Location
The study sought to establish the location of the respondents and whether they are
distributed evenly to buy specialty processed milk. The results are presented in table 1
below.
Page 37
26
Table 1 Location
Frequency Percent
Jamhuri 8 20.0
Karen 5 12.5
Kileleshwa 5 12.5
Buru Buru 6 15.0
South C 2 5.0
Githurai 7 17.5
Kahawa Sukari 4 10.0
Others 3 7.5
Total 40 100.0
Source: Research Data, 2018
It is evident that consumers are located in various estates within Nairobi County. Jamhuri
has the highest number at 20% with Githurai following closely at 17.5%. The consumers
in Buruburu were 15% while those in both Karen and Kileleshwa each had 12.5%. Kahawa
Sukari had 10% while South C had the least representation at 5%. Consumers in other
estates within the county not highlighted made up 7.5%. From the data, it is evident that
specialty milk can get market from all the estates (high-end to low-end) in Nairobi County.
4.2.2 Age
The study sought to establish the age group that consume the most of specialty milk and
whom demands are high.
Table 2 Respondent’s age
Age Frequency Percent
18-28 years 13 32.5
29-38 years 16 40.0
39-48 years 6 15.0
Above 48 years 5 12.5
Total 40 100.0
Source: Research Data, 2018
Page 38
27
From the table 2 above majority (40%) of the respondents were aged between 28 to 38
years which is the active working group with dependants. 32.5% were aged between 18 to
28 years while those between 39 to 48 years were 15%. Those above 48 years came last at
12.5%. According to the literature reviewed, understanding the consumers’ perception,
behaviours and meeting their needs is dependent of demographic factors such as age.
Therefore, it was critical for this study to determine the age of the respondents as it
provided information on whether the firms are meeting the requirements of the respondents
or not.
4.2.3 Household Size
The study sought to establish the household population in terms of members under the
same roof and establish how many in a house hold that can consume specialty milk.
Table 3 Household size
House hold members Frequency Percent
1 Person 3 7.5
2 People 5 12.5
3 People 6 15.0
4 People 10 25.0
5 People 7 17.5
6 People 3 7.5
7 People 4 10.0
8 People 1 2.5
10 People 1 2.5
Total 40 100.0
Source: Research Data, 2018
The findings, as shown in table 3 above revealed majority of the households (25%) had
four members, five members at 17.5%. Those with three and four members followed
closely at 15% and 12.5 % respectively, while those with seven members stood at 10%.
Page 39
28
Those with 8 and 10 members came last at 2.5%. Understanding the number of household
members is important in giving insights to the consumers per household. Additionally, it
can give a sneak peek on the average consumers who take specialty design milk products
including what brands they purchase and reasons for their choice. Ksenia (2013) further
adds that firms design quantities to meet consumer preferences and needs is usually
influenced by household sizes.
4.2.4 Employment
The study sought to know the employment status of the participants as indicated in the
table 4 below and identify those that can afford to purchase specialty designed milk.
Source: Research Data, 2018
The majority of the respondents (87.5%) were employed while 17.5 % were unemployed.
The results were important since they revealed that majority of the participants have an
income thus increasing their purchasing power. This meant they were in a position to
purchase specialty-designed milk and they would help in identifying various design
elements that influence the competitive advantage.
4.2.5 Household Income
To achieve the study objectives, it sought to determine the monthly household income of
the participants as indicated in table 5 below and establish their financial capabilities.
Table 4: Employment
Frequency Percent
Employed 33 82.5
Unemployed 7 17.5
Page 40
29
Table 4 Household Income
Income Frequency Percent
0-10,000 2 5.0
10,001-20,000 6 15.0
20,001-30,000 4 10.0
30,001-40,000 5 12.5
40,001 & Above 23 57.5
Total 40 100.0
Source: Research Data, 2018
Majority of the participants (57.5%) have a monthly household income of Ksh 40.001 and
above. Those with monthly household income of 10,001-30,000 are 15% while those with
between 20,001-30,000 10% of the total participants. Lastly, the households whose income
range between 30,000 and 40,000 stands at 12.5% while those with an income of 10,000
and below are the least percentage at 5%. This is important in that it explains the financial
capability of the household members and its influence in buying specialty milk. From the
literature reviewed, for consumers to make purchases, the product in question must form
value especially for it to be purchased.
4.3 Design, Brand and Preferences
This section offers analysis of information on specific factors on milk product design that
influence the preference of the brand consumed. Its further helps in demystifying the
independent variable; specialty product design elements that are key to consumers. This is
considering that while packaging of milk and milk products is all the same by milk
processors, Auma (2011) notes that processors need to add value to their products through
design in order to gain competitive advantage. According the product theory, brands that
provide solutions to existing problems are more preferred by consumers.
Page 41
30
4.3.1 Specialty Processed Milk Purchase
This study sought to determine the number of participants who buy specialty milk and can
provide credible information for the study.
Table 5 Specialty processed milk Purchase
Frequency Percent
Yes 29 72.5 No 11 27.5 Total 40 100.0
Source: Research Data, 2018
From the findings it is evident that majority (72.5%) of the respondents buy specialized
milk while 27.5% of them do not. The results therefore indicate that those on the
affirmative make up the larger population. Additionally, it proves the assertion by Gulati
et al., (2000) that many modern era milk consumers are more inclined to specialty milk as
they deem it healthier thus better.
4.3.2 Brand Bought
The study sought to know the brand that the consumers who purchased specialty processed
milk bought. The brands consists of several local milk companies with plants within
Nairobi County.
Page 42
31
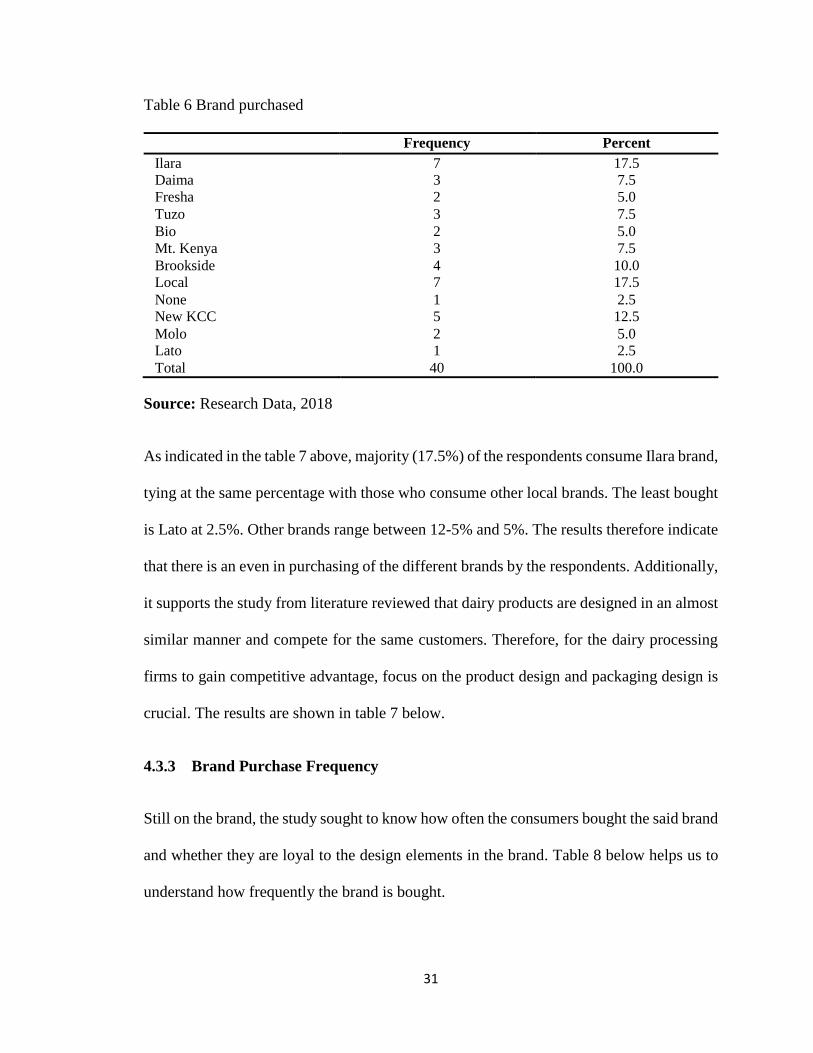
Table 6 Brand purchased
Frequency Percent
Ilara 7 17.5
Daima 3 7.5
Fresha 2 5.0
Tuzo 3 7.5
Bio 2 5.0
Mt. Kenya 3 7.5
Brookside 4 10.0
Local 7 17.5
None 1 2.5
New KCC 5 12.5
Molo 2 5.0
Lato 1 2.5
Total 40 100.0
Source: Research Data, 2018
As indicated in the table 7 above, majority (17.5%) of the respondents consume Ilara brand,
tying at the same percentage with those who consume other local brands. The least bought
is Lato at 2.5%. Other brands range between 12-5% and 5%. The results therefore indicate
that there is an even in purchasing of the different brands by the respondents. Additionally,
it supports the study from literature reviewed that dairy products are designed in an almost
similar manner and compete for the same customers. Therefore, for the dairy processing
firms to gain competitive advantage, focus on the product design and packaging design is
crucial. The results are shown in table 7 below.
4.3.3 Brand Purchase Frequency
Still on the brand, the study sought to know how often the consumers bought the said brand
and whether they are loyal to the design elements in the brand. Table 8 below helps us to
understand how frequently the brand is bought.
Page 43
32
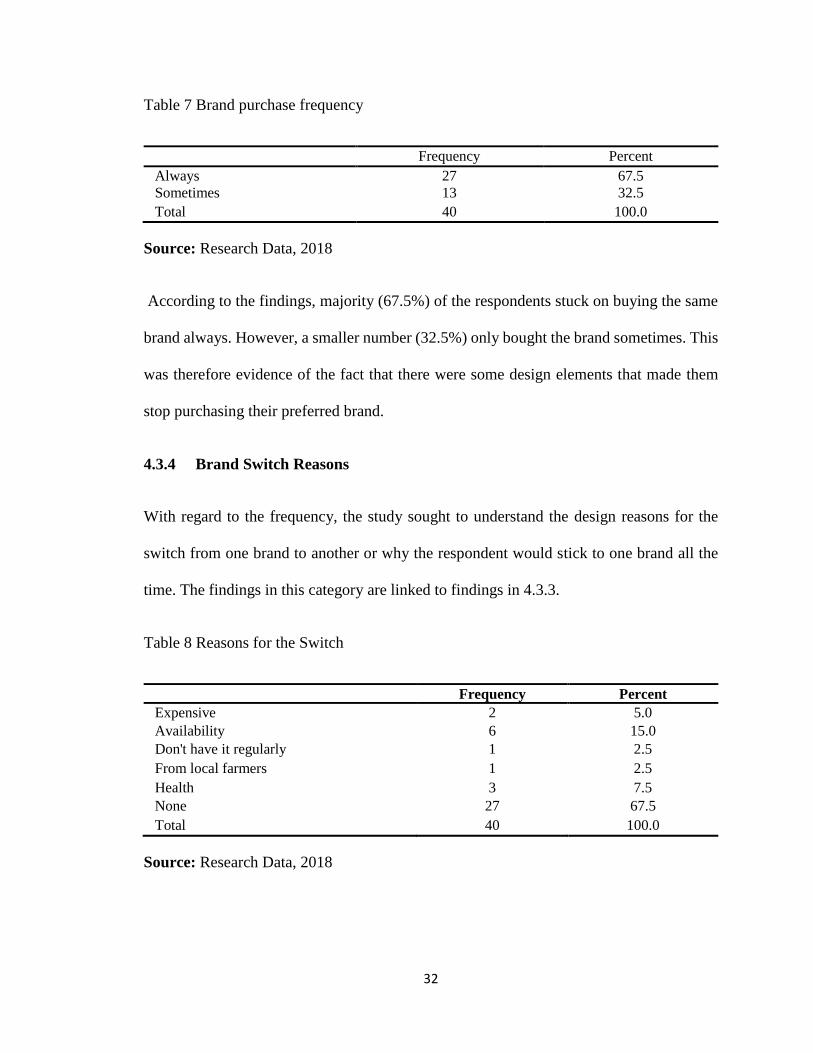
Table 7 Brand purchase frequency
Frequency Percent
Always 27 67.5
Sometimes 13 32.5
Total 40 100.0
Source: Research Data, 2018
According to the findings, majority (67.5%) of the respondents stuck on buying the same
brand always. However, a smaller number (32.5%) only bought the brand sometimes. This
was therefore evidence of the fact that there were some design elements that made them
stop purchasing their preferred brand.
4.3.4 Brand Switch Reasons
With regard to the frequency, the study sought to understand the design reasons for the
switch from one brand to another or why the respondent would stick to one brand all the
time. The findings in this category are linked to findings in 4.3.3.
Table 8 Reasons for the Switch
Frequency Percent
Expensive 2 5.0
Availability 6 15.0
Don't have it regularly 1 2.5
From local farmers 1 2.5
Health 3 7.5
None 27 67.5
Total 40 100.0
Source: Research Data, 2018
Page 44
33
Majority of the respondents (67.5%) stated that they had no reason at all for switching.
Other reasons like the previous product being expensive, availability, failure to have it
regularly, purchase from local farmers and health were evenly distributed at 5%, 15%,
2.5%, 2.5%, and 7.5% respectively. While most of the factors are not related to design,
reasons for switching such as health can be acted upon by improving the design of the
products, thus giving the particular brands a competitive edge. Cost and accessibility also
fall under the independent variable, specialty product design elements considered when
designing dairy products. Table 9 below has the results.
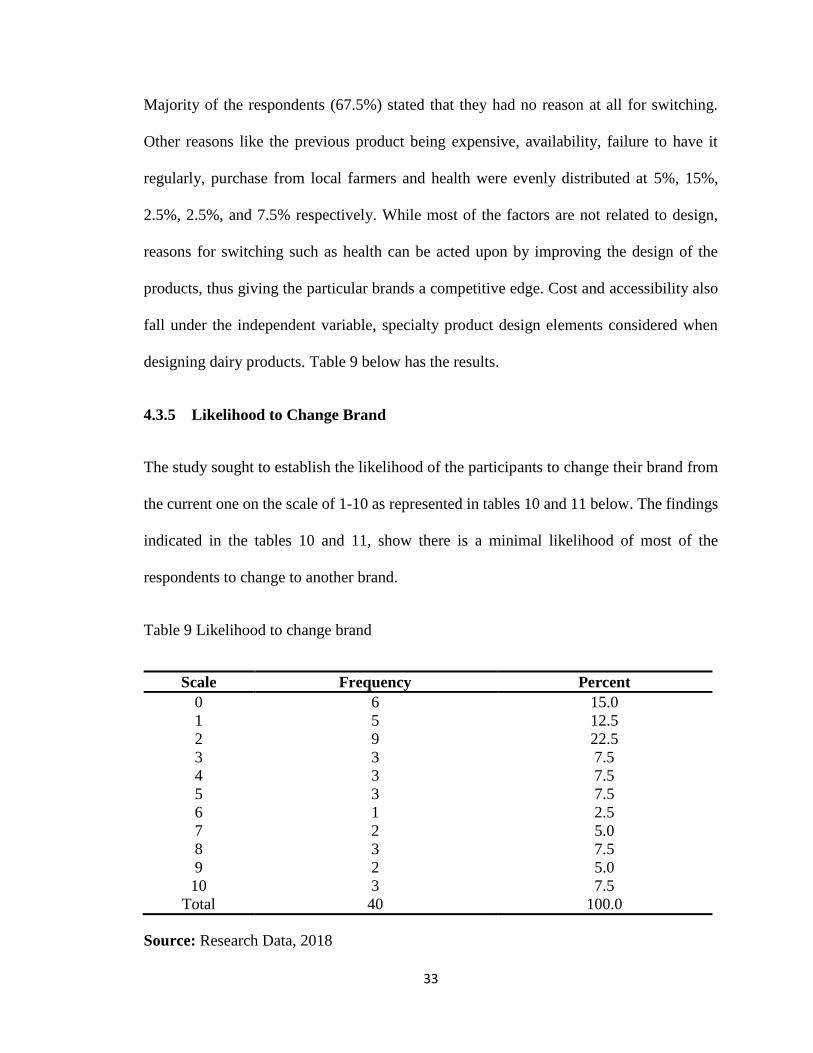
4.3.5 Likelihood to Change Brand
The study sought to establish the likelihood of the participants to change their brand from
the current one on the scale of 1-10 as represented in tables 10 and 11 below. The findings
indicated in the tables 10 and 11, show there is a minimal likelihood of most of the
respondents to change to another brand.
Table 9 Likelihood to change brand
Scale Frequency Percent
0 6 15.0
1 5 12.5
2 9 22.5
3 3 7.5
4 3 7.5
5 3 7.5
6 1 2.5
7 2 5.0
8 3 7.5
9 2 5.0
10 3 7.5
Total 40 100.0
Source: Research Data, 2018
Page 45
34
Table 10 Mean of likelihood to change brand
N 40
Mean 3.78
Std. Deviation 3.238
Source: Research Data, 2018
The findings show that 15% of them stated there was no likelihood whatsoever for them to
change. As indicated by table 11, the mean for the likelihood to change is 3.78. This is
further enhanced by the fact that the values in the range are far away from the mean and
thus a standard deviation of 3.238. As such, it is evident that there are some design elements
lacking in particular brands and available in others hence causing the change.
4.3.6 Specialty Milk Consumption
The study sought to establish whether the respondents are familiar with the specialty
product provided through images provided in the questionnaire. The findings are shown in
table 12 below.
Table 11 Specialty Milk consumption
Frequency Percent
Yes 13 32.5
No 27 67.5
Total 40 100.0
Source: Research Data, 2018
From the findings indicated in the table 12 above, only 32.5% of the respondents reported
to have consumed the milk in the given pictures while 67.5% had not. The respondents
who had never consumed the specialty milk on the questionnaire stated that they have never
Page 46
35
seen it and some mistook them for yoghurts and cooking creams. This indicates a flaw in
both product design and packaging design as both did not communicate the product
information effectively.
4.3.7 Visual Design Characteristics- Attention
The study sought to establish the design characteristics about the packages that first caught
the respondents’ attention and whether the visual characteristics can silently communicate
about the product. The results are indicated in the table 13 below.
Table 12 Design characteristics
Frequency Percent
Graphics/Image 18 45.0
Colour 13 32.5
Product Information 9 22.5
Total 40 100.0
Source: Research Data, 2018
According to the findings indicated in the table 13, majority (45%) of the respondents first
noticed the graphics or image while 32.5% of the respondents’ attention was drawn by the
color. Product information trailed at 22.5%. The results indicate that different people pay
attention to various design elements when purchasing specialty milk. However, it is evident
that the design or image of the packaging is a big influence while few consumers pay
attention to the product information. The literature reviewed supports that various aspects
of the packaging including its size, shape, graphics and colour influence consumer
decisions about particular brands.
Page 47
36
4.3.8 Product Recognition
Other than what drew the attention of consumers, the study sought to establish how the
respondents recognized the product without any assistance or introduction.
Table 13 Design Recognition.
Frequency Percent
Image 13 32.5
Colour 12 30.0
Product name 15 37.5
Total 40 100.0
Source: Research Data, 2018
According to the results as indicated in the table 14, majority (37.5%) of the respondents
recognized the product design by the product name, (32.5%) by image and 30% by colour.
The reviewed literature points out that the image and a visual product name influence the
recognition of particular designs. In addition, the right colour is usually vital in changing
product selection and the brand impression.
4.4 Brand Consumed Agreement
The study sought to establish whether specialty designed milk tends to communicate value
additions and generate product expectations, in turn influencing purchasing decisions of
products. Respondents were asked about their extent of agreement to the various statements
and to indicate their response on a Likert scale (5-very important, 4-important, 3 not
important and unimportant, 2-slightly important, 1-not important) and the results are shown
on the table 15 below.
Page 48
37
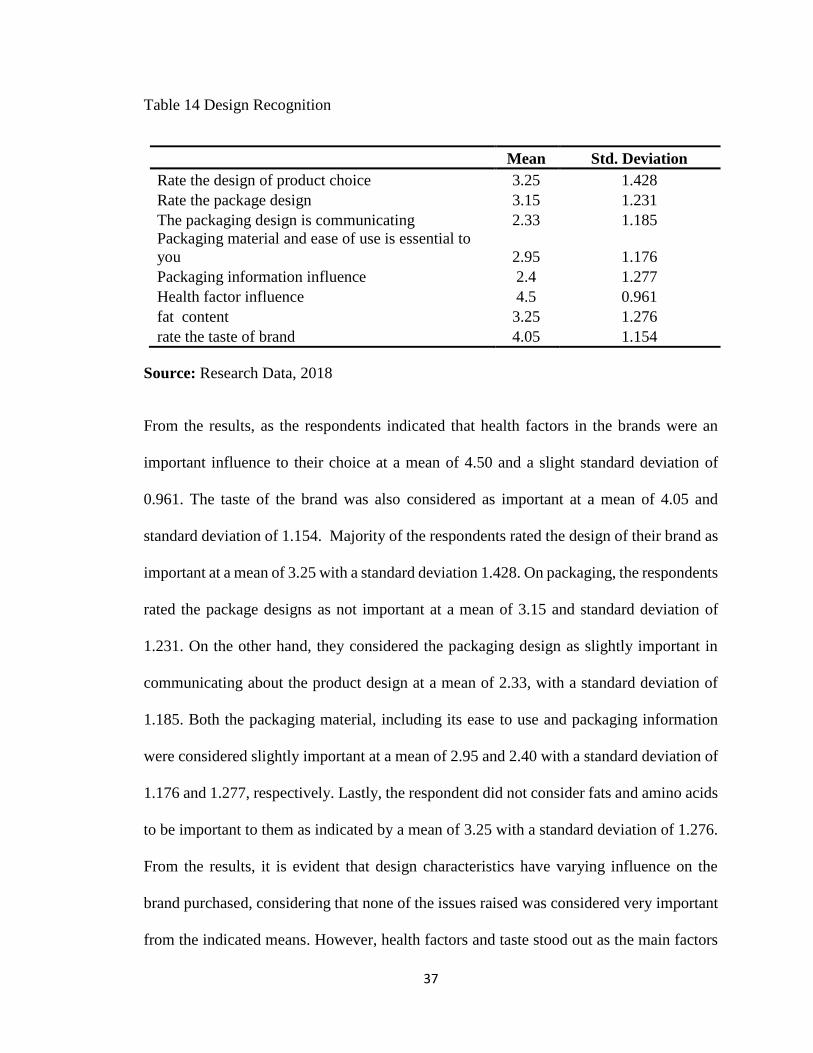
Table 14 Design Recognition
Mean Std. Deviation
Rate the design of product choice 3.25 1.428
Rate the package design 3.15 1.231
The packaging design is communicating 2.33 1.185
Packaging material and ease of use is essential to
you 2.95 1.176
Packaging information influence 2.4 1.277
Health factor influence 4.5 0.961
fat content 3.25 1.276
rate the taste of brand 4.05 1.154
Source: Research Data, 2018
From the results, as the respondents indicated that health factors in the brands were an
important influence to their choice at a mean of 4.50 and a slight standard deviation of
0.961. The taste of the brand was also considered as important at a mean of 4.05 and
standard deviation of 1.154. Majority of the respondents rated the design of their brand as
important at a mean of 3.25 with a standard deviation 1.428. On packaging, the respondents
rated the package designs as not important at a mean of 3.15 and standard deviation of
1.231. On the other hand, they considered the packaging design as slightly important in
communicating about the product design at a mean of 2.33, with a standard deviation of
1.185. Both the packaging material, including its ease to use and packaging information
were considered slightly important at a mean of 2.95 and 2.40 with a standard deviation of
1.176 and 1.277, respectively. Lastly, the respondent did not consider fats and amino acids
to be important to them as indicated by a mean of 3.25 with a standard deviation of 1.276.
From the results, it is evident that design characteristics have varying influence on the
brand purchased, considering that none of the issues raised was considered very important
from the indicated means. However, health factors and taste stood out as the main factors
Page 49
38
influencing the purchase of specialty designed milk. This is in agreement with Prima et al.,
(2015) that consumers in the modern era are conscious of their health thus for processors
to compete with the demand, they need to ensure the design adds nutritive value. The
packaging design and packaging information were the factors that the consumers
considered as least important. In regard to this, following Silayoi (2007) assertion that
packaging design and information are critical in influencing the purchasing of a particular
brand, processors should focus on improving this aspect of their designs in order to gain a
competitive edge.
4.5 Product Design Elements and Firm Competition Relationship
The study sought to establish the relationship of specialty product design and
competitiveness of the processing firms. Regression model was used to analyze the
findings.
4.5.1 Regression Model Summary
Table 16: Regression Model Summary
Model R R Square Adjusted R Square Std. Error of the
Estimate
1 .758a .574 .539 .26064
a. Predictors: (Constant), quality, appearance, functional use
Source: Research Data, 2018
Table 16 gives the model from where the equation that could fit the data was obtained.
From the table, a positive correlation existed as shown by the correlation coefficient value
i.e. (r=0.758) between the dependent and independent variables. Majority of data points
represented by 57.4% were represented and explained by the model with the effect from
Page 50
39
quality, appearance and functional use. From these results therefore, the undetailed factors
in this research to the competitive advantage was 42.6%. This therefore makes it open for
other research to be conducted to look into details for other factors whose effects are 42.6%
to the Competitive advantage among the Dairy Processing Firms in Kenya.
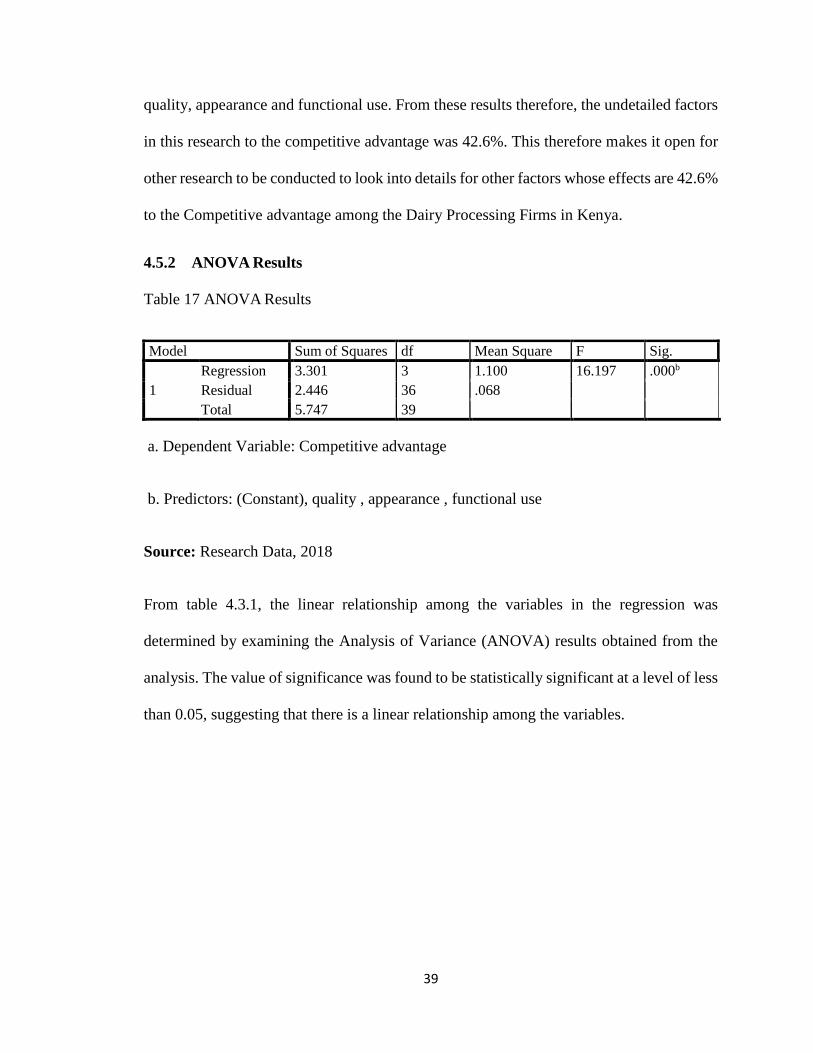
4.5.2 ANOVA Results
Table 17 ANOVA Results
Model Sum of Squares df Mean Square F Sig.
1
Regression 3.301 3 1.100 16.197 .000b
Residual 2.446 36 .068
Total 5.747 39
a. Dependent Variable: Competitive advantage
b. Predictors: (Constant), quality , appearance , functional use
Source: Research Data, 2018
From table 4.3.1, the linear relationship among the variables in the regression was
determined by examining the Analysis of Variance (ANOVA) results obtained from the
analysis. The value of significance was found to be statistically significant at a level of less
than 0.05, suggesting that there is a linear relationship among the variables.
Page 51
40
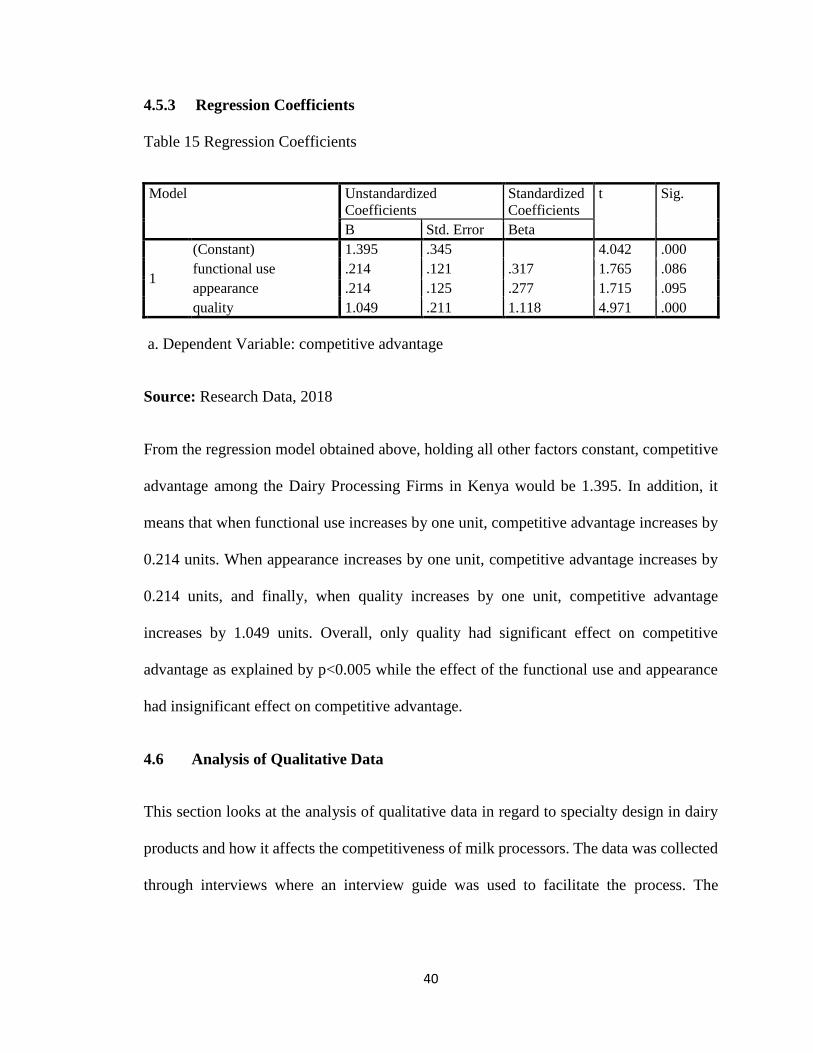
4.5.3 Regression Coefficients
Table 15 Regression Coefficients
Model Unstandardized
Coefficients
Standardized
Coefficients
t Sig.
B Std. Error Beta
1
(Constant) 1.395 .345 4.042 .000
functional use .214 .121 .317 1.765 .086
appearance .214 .125 .277 1.715 .095
quality 1.049 .211 1.118 4.971 .000
a. Dependent Variable: competitive advantage
Source: Research Data, 2018
From the regression model obtained above, holding all other factors constant, competitive
advantage among the Dairy Processing Firms in Kenya would be 1.395. In addition, it
means that when functional use increases by one unit, competitive advantage increases by
0.214 units. When appearance increases by one unit, competitive advantage increases by
0.214 units, and finally, when quality increases by one unit, competitive advantage
increases by 1.049 units. Overall, only quality had significant effect on competitive
advantage as explained by p<0.005 while the effect of the functional use and appearance
had insignificant effect on competitive advantage.
4.6 Analysis of Qualitative Data
This section looks at the analysis of qualitative data in regard to specialty design in dairy
products and how it affects the competitiveness of milk processors. The data was collected
through interviews where an interview guide was used to facilitate the process. The
Page 52
41
analysis represents information obtained from seven processors operating within Nairobi
County.
4.6.1 Basic Information
This question sought to know the name of the company, the designation of the interviewee
and the number of years they had worked for the company. The companies were Brookside,
Edoville, Githunguri, Meru, New KCC, Daima and Bio food products limited. The
interviewees held various positions, where the majority (3) were sales and marketing
officers, two were human resource managers and then there was a production manager and
a graphic designer. They had worked in the organizations for an average of six years with
the one who had been employed for most years at eight and the least one for three years. It
is important to note that the dairy processing firms’ interviews did not have designers to
develop the packaging design apart from one (Bio Foods Ltd.)
4.6.2 Product Design
The study established that none of the companies had a design department. As such, some
of them outsource when they want to conduct product designing but most of them use the
sales and marketing department. The study further noted that product’s design are not often
reviewed. The main reason that stood out for carrying out product design review is when
the competition in the market has increased and the product performance reduces. The
study additionally noted that it would also occur after research and innovation of new
designs or when the current design becomes outdated. Functional use, appearance and
quality of the product stood out as the main reasons considered in implementing design
elements. Market research outcomes were noted as the main determinants of the manner in
Page 53
42
which the product design are implemented. The target group of a particular product was
also noted to be a major determinant applied by close to all the companies. For instance,
interesting graphics such as cartoons and bright colours were considered for products
targeting children since they are captivating. Additionally on the target group, there was a
concern on allergies where Githunguri dairy company noted that they considered the safety
of all users in terms of allergic reactions. As such, they captured information related to this
on the graphics and the product information when implementing design elements.
Additionally, from the literature discussed, product designers in dairy processing firms
need to continuously address environmental changes and set innovative goals in developing
new products to maintain competitiveness (Kleinschmidt, 1987).
4.6.3 Health Factors
It was evident that health factors were a key consideration in designing of the products
across the companies. The packaging material used is expected to preserve the dairy
product’s quality by protecting the food against physical and bio chemical changes.
Additionally, to prevent the consumers from allergies, the companies use non-
biodegradable packaging materials. Auma (2011) further ascertains that lately, consumers
have been quite keen on the nutritional value and health benefits of the products that they
purchase, including milk.
4.6.4 Design Elements on Sales
The study sought to understand how the process of colour, image and graphics influenced
the sale of products. All the seven companies stated that the process first involved the
identification of the target group. Therefore, by basing the design process on the
Page 54
43
preferences of the target groups, it is evident that it has a great influence on the sales.
Further, the colour image and graphics have been identified as standing out in shelves and
therefore contributing to increase in sales of the particular products. In this effect, Silayoi
(2007) notes that the colour and graphics of a package on a supermarket shelf makes
identification of the particular product easier.
4.6.5 Products Design and Target Groups
The study sought to understand whether designs of products were dependent on target
groups. This was in regard to dependents and households, and the younger and older
generation. All the seven companies agreed that they considered the target groups of their
various products in coming up with the designs. This is because every target group reacts
differently to the design of projects. For example, if a product is meant for a family, it will
capture the sense of a family in its design and the same applies to all other products. In this
regard, Ksenia (2013) notes that it was important for firms to understand the target group
of their particular product to design it according to their preference. Further, from the
literature discussed above, we can deduce that product design should be complemented by
academic research and assessing customers’ needs through user-oriented design.
4.6.6 Texture, Taste and Smell Design
The study sought to understand how taste, smell and texture were factored in during
designing of the products. The firms had different means of ensuring this was achieved,
during processing of the produce by incorporating various flavors and essences. The
additives used during the processing of the produce also influenced the texture. The
marketing team on the other hand decides upon the texture of the packaging the design.
Page 55
44
The packaging is usually in such a way that it captures all the contents of the product inside,
have an edge for the product over their competitors. Additionally, it sought to know the
major design factors considered by the various firms before designing their products. The
factors varied across the firms though a number of them were the same. They included;-
type of product, nature of product e.g. low fat, lactose free, nature of the target group,
materials to be used including availability and cost, aesthetics, colour schemes, flavours
and colour schemes to be adopted by the project.
4.6.7 Testing of Designs
The study further sought to understand how the companies tests new designs. It was found
that the companies first did the testing internally within the companies to get the opinion
of the staff. After incorporating their reviews, they conduct test promotions done by the
consumers with the guide of a review sheet. The reviews of the customers are then
considered and those deemed appropriated incorporated in the final designs.
4.6.8 Product and Package Design Safety
The study noted that new necessities for dairy products safety had little or no influence on
the product and package design for most firms. Five of the seven firms actually indicated
that new necessities did not influence their product package design in any way. They only
ensure that the package designs are safe to use on the package. However, Brookside stated
that they had a certain level of influence since they had to incorporate new technologies in
the package designs. New KCC on the other hand noted that due to the changing
environments, product safety influences the package design to reduce on losses through
spillage, damage and contamination through handling and transport. In the literature
Page 56
45
discussed above, tetrapack.com (2015) stated that the material for packaging dairy products
should be able to enhance efficient milk distribution, maintain product hygiene, reduce
dairy product spoilage and waste, and protect nutrients and flavours. This is an aspect the
dairy processing firms have not fully taken advantage of, despite using the packaging
materials in the market leading to losses through product damage and spillage during
distribution.
4.7 Quantitative and Qualitative data merger
The findings of qualitative and quantitative data show that firms do not consult with the
consumers when designing their products. From the findings, firms design products when
they face competition or when their products are outdated. The quantitative data confirms
that what matters most about the products they consume is heath and taste factors. They
are also not so familiar with specialty milk designs and why the brands are unique. The
packaging designs are of less importance to the consumers, yet the firms come up with
some expensive packaging but they don’t attract them. This proves that some of the designs
that the firms comes up with are not of importance to the consumers because they are not
aware of them thus affecting their competitive advantage.
Page 57
46
CHAPTER FIVE
SUMMARY OF FINDINGS, CONCLUSIONS AND
RECOMMENDATIONS
5.1 Introduction
The chapter presents the summary, conclusions and recommendations of the study. It
comprises of a brief summary of the study as it was conducted, conclusions drawn from
the main findings and recommends on viable steps to enhance product design so that it can
be used as a competitive edge by milk processing firms. Finally, it offers suggestions on
areas for further research.
5.2 Summary of the Findings
The study set out to establish how specialty product design could be used as a competitive
edge by dairy processing firms. To accomplish this, it was driven by three major objectives
that is; to determine dairy products design elements that are key to consumers, to establish
design elements that the dairy processing firms choose in designing their product and to
establish the effect of product design elements and competitive advantage in the dairy
processing industry. To achieve the objectives, the study used both primary and secondary
sources of data in gathering information. In primary, it employed the use of both
questionnaires and interviews. Questionnaires sought to get people’s perception on design
of specialty milk and how it influenced their purchasing choice. It also sought to know
among various local brands, the brand of their preference and the design properties that
they consider. The data collection was done outside hypermarkets, supermarkets and
minimarkets within various parts of Nairobi County to get diverse views. Other than this,
Page 58
47
the study also used interview guides in seven dairy processing firms within Nairobi County.
This sought to get their views on various elements of specialty design products that they
produce and if and how it gives them a competitive edge over other firms.
From the findings it is evident that majority of the respondents consume specialty designed
milk with a low likelihood to switch from their current brands. Graphics, colour and
product information were the main considerations that attract consumers’ attention often.
The study further revealed that health factors and taste were their main considerations when
choosing the brands they consume. The findings also revealed that of the seven dairy
processing firms where interviews were conducted, none of them has a product-designing
department. Additionally, it was realized that the products were rarely reviewed, and the
main reason for carrying out product reviews was based on competition and to ensure their
growth in the market share. Functional use, appearance and quality of the product were the
main considerations that the study noted influenced company’s implementation of design
elements. Additionally, market research outcomes especially considering competitor
products were determinants in the implementation of products design.
On target groups, the study noted a general agreement that the product’s target group highly
influenced the mode of design. Further, texture, taste and smell were highly considered in
the design, incorporated at various stages of the processing of the specific product. Lastly,
the study found that in order to gain a competitive edge, new designs were first tested
internally, before having test promotions and then the reviews were included in the final
designs.
Page 59
48
5.3 Conclusions
Based on the findings, the study concludes that consumers consider various specialty
product design elements when purchasing their preferred milk brand. It notes that the
considerations in this case according to the findings should be health factors, appearance,
packaging design, graphics, colour, and aesthetics including quality and texture, smell and
taste. Additionally, the study concludes that specialty design elements relating to the firms
like accessibility, waste minimization, cost flexibility, consumer segmentation,
differentiation factors and quality should also be considered. As such, it concludes that
milk-processing firms need to consider consumer views and incorporate the same in the
designs of their products in order to compete with rival firms and facilitate growth in the
market share.
Additionally, the study concludes that none of the milk processing firms within Nairobi
County has a design department. Further, the findings revealed that the firms rarely
reviewed the products designs. However, the reasons for conducting the reviews were
noted to be due to the competition and introducing of better designs by competitor brands
in the markets. It was noted this was done after conducting market research to assess the
gap and identify new entrants. The study further concludes that the target group of a
particular design was a high consideration in design, and if the groups design expectations
were met, the study concludes that the sales of those particular products would
automatically go up. Finally, the study therefore concludes that specialty product design
elements can be used as a competitive edge by milk processing firms.
Page 60
49
5.4 Recommendations
In view of the major findings and conclusions drawn, the following recommendations have
been made for actions to be taken with the view of promoting the use of specialty design
elements as a competitive edge by milk processing companies.
Set up design departments within milk processing firms- it was noted that the firms lack
design departments and as a result, product designs were rarely reviewed. By setting up the
departments, the firms will take an active role in regular reviews of the designs in relation
to consumer needs. Additionally, it will ensure prompt actions on any issues raised on the
designs present without having to outsource which will take a longer duration and using
the appropriate expertise.
Make consumer health information more appealing- considering that consumers revealed
the health of product as a major determinant of the brand they purchase, brands should
ensure that they present the health information in a manner that is more appealing and more
visual to capture the attention of the consumers. This will therefore ensure that the sales of
the brand’s product automatically increase thus giving them an edge over their competitors.
Lastly, the study recommends that the firms should be keen on ensuring that they establish
new designs regularly, considering that consumer needs are met due to market evolution.
By noting that consumers are always curious about new designs, appealing designs will
ensure they keep on buying the products hence maintaining a company’s competitive edge.
Page 61
50
5.5 Limitations of the study
Some of the firms’ respondents were not willing to share information as they thought it
would expose their weaknesses to their competitors. This was sorted out by assuring to
them the purpose of the study was confidential and academic only. The respondents filling
in the questionnaires in some places were asking for payment before they give in answers.
5.6 Suggestions for further research
The research was conducted on milk processing firms in Nairobi as a representative of
other firms in Kenya and according to the findings, design of products is not invested on.
Accordingly, further studies could be conducted on how product/ service designs influence
consumers buying behavior.
Page 62
51
REFERENCES
Aken. (2004,2005). Management Research as a Design Science: Articulating the
Research Products of Mode 2 Knowledge Production in Management,. British
Journal of Management, 19-36.
Akrani, G. (2012, 8 2). Factors Affecting Determining Product Design. Retrieved from
Kaylan City Blog: http://kalyan-city.blogspot.com/2012/02/factors-affecting-
determining-product.html
Ampuero O., V. N. (2006). Consumer perceptions of product packaging. Journal of
Consumer Marketing , 23(2), 100-112.
Balakrishnan, P. V. (1996). Genetic Algorithms for Product Design. . Management
Science, 1105-1117.
Board, K. D. (2018). Retrieved from http://www.kdb.co.ke/
Brondoni, S. (2015). Product Design Management and Global Competition. Symphonya
Emerging Issues in Management.
Canadian, G. o. (2012, 12 06). Product Design, Research and Development:. Retrieved
from Government of Canadian: https://www.ic.gc.ca/eic/site/dsib-
dsib.nsf/vwapj/PDRDReport_en.pdf/$file/PDRDReport_en.pdf
Chiva, R. A. (2009). Investment in Design and Firm Performance: The Mediating Role of
Design Management,. Journal of Product Innovation Management, 424-440.
Christiaans Henri, A. R. (2010, November). Accessing Decision-Making in Software
Design, Design Studies. Korea, 31(6), 641-662.
Clark, K. B. (1985). The Interaction of Design Hierarchies and Market Concepts in
Technological Evolution. Research Policy, 235-251.
Clark, K. B. (1990). The Power of Product Integrity. Harvard Business Review, 107-116.
Council, N. N. (1991). Improving Engineering Design: Designing for Competitive
Advantage . Washington DC: National Academy Press.
Cross, N. (2001). Design/Science/Research: Developing a Discipline,” in the 5th Asian
Design Conference. International Symposium on Design Science . Seoul, Korea:
Su Jeong Dang Printing Company.
Dankit N., N. N. (2014). Milk Production And Marketing In Kenya. Nairobi: Kenya
Dairy Board Press.
Dickson, P. S. (1995). Managing design in small high-growth companies. Journal of
Product Innovation Management , 406-414.
Donaldson, K. M. (2006). Product design in less industrialized economies: constraints
and opportunities in Kenya. London: Springer.
Page 63
52
Dumas, A. a. (1991). Managing the Form, Function and Fit of Design. Design
Management Journal, 26-31.
Elsbach, K. D. (2009). Identity affirmation through “signature style”: A study of toy car
designers. . Human Relations, 1041-1072.
Ewa H., a. I. (2013). Identification and Categorization of Order Qualifiers and Order
Winners in Knowledge Intensive Business Services. Swiden: E-huset, LTH,
Lund.
FoodBusinessAfrica.com. (2013, November 17). Food Business Africa.com. Retrieved
from Food Business Africa.com:
https://www.foodbusinessafrica.com/2013/11/17/the-dairy-industry-in-kenya/
Foodworld. (2013, November 17). Food Business Africa.com. Retrieved from Food
Business Africa.com: https://www.foodbusinessafrica.com/2013/11/17/the-dairy-
industry-in-kenya/
Franke, N. A. (2008). Product uniqueness as a driver of customer utility in mass
customization. . Marketing Letters, 93-107.
Gelici, L. W. (2012). Studying the Influence of Packaging Design on Consumer
Perceptions (of Dairy Products) Using Categorizing and Perceptual Mapping.
Netherlands: wileyonlinelibrary.com.
Gemser, G. a. (2001). How Integrating Industrial Design in the Product Development
Process Impacts on Company Performance. Journal of Product Innovation
Management, 28-38.
Gideon, M. a. (2011). The Competitive Dynamics of Entrepreneurial Market Entry.
United Kingdom: Edward Elgar Publishing.
Gorb, P. (1990). Design Management. London: Phaidon Press.
Gregor, J. (2007). The Anatomy of a Design Theory. Journal of the associaon of
Information System, 312-335.
Gulati SK, K. S. (2000). Designing milk fat for the new millennium by dietary strategies.
Asian Aust J Anim , 538-541.
Hasler CM, B. A. (2004). Position of the American Dietetic Association: Functional
foods. The Philosophy of food, 104: 814-826.
Heskett, J. (2002). Toothpicks & Logos. Design in Everyday Life. New York: Oxford
University Press.
Hevner, A. (2004). Design Science in Information Systems Research. MIS Quarterly,
28(1), 75-105.
Hill, A. H. (2009). Manufacturing Operations Strategy”, 3r edition, Palegrave.
Hampshire, England: Macmillan.
Page 64
53
Hill, T. (1993). Manufacturing strategy: The strategic management of the manufacturing
function. Basingstoke: Macmillan.
Issar, G. C. (2003). Success Strategies Being Implemented In Fresh Milk Supply Chains.
International Farm Management Progess.
Kabecha, W. (1998). Technological Capability of the Micro-enterprises in Kenya's
Informal Sector. Technovation, 117-126.
Karanja, A. M. (2003). The dairy industry in Kenya. The post liberalization agenda,
Working paper 1.
Kim, W. M. (1999). How to Discover the Unknown Market. London: FT.
Kimenju, C. K. (2017). Market Concentration in the Dairy Processing Industry in Kenya
and Producer Milk Prices. Tegemeo Institute of Agriculture Policy and
Development(24).
Kimeu, P. (2013). The challenges facing the dairy sector Kenya. Nairobi: Unpublished.
Kirschman, C. e. (1196). Classifying functions for mechanical design., (p. Proceedings of
The 1996 ASME Design Engineering Technical Conference and Computers in
Engineering Conference). Irvine.
Krishnan, V. A. (2001). Appropriateness and Impact of Platform-Based Product
Development. Management Science, 53-68. .
Langley, T. a. (2010). Attributes of packaging and influences on waste. . Packaging
Technology and Science , 161-75.
Löfgren, M. (2005). Winning at first and second moment of truth: an exploratory study.
Managing Service Quality, 15(1), 102-115.
Lorenz, C. (1986). The Design Dimension: the new competitive weapon for business.
Macpherson, A. J. (2010). Strategies for the Development ofInternational Journal of
Management. International Journal of Management , 107-113.
Mburu, G. (2016). Factors Affecting Production Of Dairy Products In Kenya: A Case Of
Co- Operative Societies In Kiambu County. Nairobi.
Mohammed, S. (2015). Regal marine case study.
Muriuki, A. O. (2003). The Policy environment in the Kenya dairy sub-sector: A review.
Nairobi: Ministry of Livestock and Fisheries Development (MoLFD).
Muriuki, H. (2011). Dairy development in Kenya - FAO. Rome: Office of Knowledge
Exchange, Research and Extension.
Odero, W. (2017). Smallholder dairy production in Kenya; a review.
Pramila, U. K. (2015). Designer Milk - A Milk of Intrinsic Health Benefit. Journal of
Food Processing and Technology.
Page 65
54
S., Y. (2004 ). Winning at retail: research insights to improve the packaging of children’s
products. Young consumers. Insight and Ideas for Responsible Marketers, 17–22.
Sang-Bing, T. a. (2013). Examining How Manufacturing Corporations Win Orders.
Taiwan: Graduate Institute of China Studies.
Shahram G., H. G. (2013). Affecting Factors Of Packaging Milk Production On Guilan
Consumer Behavior. Arabian Journal of Business and Management Review
(Nigerian Chapter), 1( 3), 1-40.
SNV. (2012). SNV, Zimbabwes Dairy Subsector Study, Stichting Nederlandse
Vriwilliger. Retrieved from SNV, Zimbabwes Dairy Subsector Study, Stichting
Nederlandse Vriwilligers:
http://www.snv.org/public/cms/sites/default/files/explore/download/rarp_2016-
dairy-subsector-study.pdf.
Tetrapak. (2015). dairyprocessinghandbook. Retrieved from dairyprocessinghandbook:
http://dairyprocessinghandbook.com/chapter/designing-process-line
Thomke, S. H. (2002). Customers as innovators. . Harvard Business Review, 74-81.
Turner, B. (1985). Managing design in the new product development process – methods
for company executives. . Design Studies, 51-56.
Tushman M. L. and Anderson, P. (1986). Technological discontinuities and
organizational environments. Administrative Science Quarterly, 439-465.
Tybout, J. R. (2000). Manufacturing firms in developing countries. how well do they do,
and why? J Econ, 11-44.
Veryzer R.W., B. d. (2005). The impact of user-oriented design on new product
development: An examination of fundamental relationships. Journal of Product
Innovation Management, 128-143.
William, R. O. (1992). An Economic History of Kenya. Nairobi: East African Publishers.
Zeng, Y. G. (1999). A science-based approach to product design theory. Part I:
formulation and formalization of design process, 331-339.
Page 66
55
Appendix I: Transmittal Letter
University of Nairobi,
P. O. Box 30197 - 00100,
Nairobi, Kenya.
Dear Sir/Madam
RE: INTRODUCTION LETTER
I am a Master of Business Administration student at the University of Nairobi,
specializing in Operations Management. I am surveying "DESIGN OF SPECIALITY
MILK AND COMPETITIVE ADVANTAGE OF DAIRY PROCESSING FIRMS IN
NAIROBI COUNTY”. As a requirement for the completion of my coursework, I am
required to do a research project, and I would like your organization to be part of my
study.
The information provided will be confidential, and the results of the report will be used
solely for academic purposes. I, therefore, request you to allow me to collect data required
for the study.
Thanks in advance.
Yours faithfully,
Miriam Mukundi
Page 67
56
Appendix II: Interview Guide for Design department heads
My name is Miriam Mukundi. I am a postgraduate student at University of Nairobi and
carrying out a study on how specialty dairy products design influence competitiveness of
milk processors. The information given will be treated with utmost confidentiality and will
be used for academic purposes only.
1. What is the name of the company? What is your designation? How long have been
working for the organization?
2. Do you have a designing department? YES/ NO
3. How often are products design reviewed?
4. How do you implement design elements (functional use, appearance and quality of the
product)?
5. What health factors do you consider in designing your products? Explain
6. How does the process of colour, image, and graphics influence the sale products?
(provide figures)
7. Does your dairy products design depend on the target groups? (dependents and
households, young/ old generation)
8. How do your firm ensure texture, taste and smell are factored in when designing your
products.
9. What are the major design factors do you consider before designing your products?
10. How does your company test new designs?
11. How do new necessities for dairy products safety influence on the product and package
design?
Page 68
57
Appendix III: Consumer Respondents Questionnaire
My name is Miriam Mukundi. I am a post graduate student at University of Nairobi and
carrying out a study on dairy products design. Information collected in this questionnaire
is for studies on processed dairy product design as a review on dairy firms. The
questionnaire is divided into two sections; A and B. Complete both parts to make the
information valid. The information given will be treated with utmost confidentiality and
will be used for academic purposes only.
SECTION A
This section seek to collect information on characteristics likely to influence consumer
preference on milk brand used. Kindly complete this part by marking (✔) in the box.
Answer all questions.
1. Which area do you stay?
2. How old are you?
18-28 years ( ) 29- 38 years ( )
39-48 years ( ) Above 48 yrs ( )
3. How many people are in your household? (Specify)……………….
4. Are you employed? YES ( ) NO ( )
5. Below is income categories, specify the category that best fit your family income
per month in Ksh.
0-10,000 ( )
10,001-20,000 ( )
20,001- 30,000 ( )
30,001- 40,000 ( )
40,001 and above ( )
Page 69
58
SECTION B
This section seeks to gather information on the specific factors on milk product design that
influence the preferences of the brand consumed. Answer all the questions accordingly.
1. Do you buy specialty processed milk?
YES ( ) NO ( )
2. If yes, which brand do you buy? (Specify)
……………………………………………………………………
3. How often do you buy the brand you consume?
a ). Always ( )
b). Sometimes ( )
4. If sometimes, what are the reason(s) for the switch?
………………………………………………………….
5. On a scale of 0-10, how likely are you to change to another brand?
6. Please take a look at the below image of special processed milk
Choose your answer by making the best alternative
a. Have you ever consumed the milk above? Yes ( ) No ( ). Give reason for your
answer …………………………………………
Page 70
59
b. What first caught your attention?
Graphics/ image ( ) Colour ( ) Product Information ( )
c. How did you recognize the product design
Image ( ) Colour ( ) Product name ( )
7. Specialty designed milk tend to communicate value additions and generate product
expectations influencing the purchasing decision of the products. Do you agree with
the statement in regard to the brand you consume? Tick appropriately how you agree
with the following statements (5-very important, 4-important, 3 not important and
unimportant, 2-slightly important, 1-not important)
5 4 3 2 1
a. How would you rate the design of your product ( ) ( ) ( ) ( ) ( )
choice
b. How would you rate the packaging design ( ) ( ) ( ) ( ) ( )
c. The packaging design is communicating about the ( ) ( ) ( ) ( ) ( )
product
d. Packaging material and ease of use is essential to you ( ) ( ) ( ) ( ) ( )
e. Packaging information influence your brand choice ( ) ( ) ( ) ( ) ( )
f. Health factors in these brand influence your choice ( ) ( ) ( ) ( ) ( )
g. Is fat & amino acid content a concern to you ( ) ( ) ( ) ( ) ( )
h. How would you rate the taste of this brand ( ) ( ) ( ) ( ) ( )
Page 71
60
Appendix IV: List of processors to be used for the study
Name Product
Brand name
Products
Brookside Ilara, Tuzo,
Molo Milk and
Delamere
UHT milk, flavored milk, flavored fruit yogurt,
butter, ghee, maziwa lala, milk powder, and
cream
New KCC New KCC Fresh and UHT milk, maziwa lala, flavored
milk/ yogurt, cheese, butter, ghee, cream,
powdered milk
SALL Daima Maziwa lala, UHT milk, yogurts, cream,
flavored milk, butter, ice creams
Githunguri Fresha Yogurts, UHT milk, cream, maziwa lala, ghee,
butter.
Bio Food Bio Fruit yogurt, probiotic yogurt, skimmed
flavored milk
Kinangop dairy Fresh milk, Yoghurt, maziwa lala, whole cream
Lattana Dairy Lattana Fresh Milk and Yoghurt
Pascha Uplands Pascha Yoghurt, fresh milk, maziwa lala
Eldoville Dairies Eldoville Cheese, Yoghurt, butter, cream, maziwa lala,
whey cool
Meru dairy coop Mt. Kenya UHT, fresh milk,
Aspendos Dairies Mountain
Fresh
Fresh milk, yoghurt