+ All Categories
Home > Documents > Design of System for Classification of Vocal Cord/Glottis ... · calculated to see the difference...

Design of System for Classification of Vocal Cord/Glottis ... · calculated to see the difference...

Date post: 09-Sep-2018
Category:
Upload: nguyenthuy
View: 219 times
Download: 0 times
Share this document with a friend
7
International Journal of Computer Applications (0975 8887) Volume 132 No.4, December2015 1 Design of System for Classification of Vocal Cord/Glottis Carcinoma using ANN and Support Vector Machine Syed Mohammad Ali Department of Electronics & Telecommunication Engineering, Anjuman College of Engineering & Technology, Nagpur, India Pradeep Tulshiram Karule, PhD Department of Electronics Engineering, Yeshwantrao Chavan College of Engineering, Wanadongri, Nagpur, India. ABSTRACT Decision support system in voice disorder classification has developed more and more momentum now days because of complication in routine methods. Neurological disorder creates speech problems. Therefore, decision support system can serve as an important mean to detect voice disorders. In this research work, normal & vocal cord cancer voice samples are used & a system is designed to classify vocal cord cancer speech from Normal speech. Vocal cord carcinoma is defined as a malignant tumor in the vocal fold. It is a form of laryngeal cancer, also called as glottis cancer. Pre-processed diseased and normal speech signals are used for spectral analysis to detect disease. Autocorrelation of speech signals is calculated to see the difference between normal and vocal cord cancer speech signal. Two sets of twenty five features are calculated and three neural networks like MLP, GFF, Modular and SVM are used for classification. Feature sets, Networks with highest classification accuracy were found. It is observed that the accuracy of this disease classification is 100%. General Terms Biomedical signal processing, Classification, Algorithms. Keywords Vocal cord speech signals; Spectral analysis; Feature extraction, SVM; MLP; Feed forward; Modular Networks. 1. INTRODUCTION Pathological speech detection has received great drive in the last decade. Digital signal processing has become a vital means for speech disorder detection [1]. Due to nature of jobs, harmful societal habits people are subjected to risk of voice problem [2].Usually aged patients are affected by vocal cord cancer. The vocal cord carcinoma leads to early roughness in speech. German voice disorder database and samples from Dr. Naresh Agarwal hospital forms source for this experiment. In this disorder database, patients have pronounced vowel like „a‟ [3]. Physicians often use endoscopy to diagnose symptoms of vocal cord carcinoma, however; it is possible to detect disease using definite features of speech signal [1].voice signal is sinusoidal signal having different frequency, amplitude, & phase. [4].Composition of various organs forms speech signal. Lungs, Bronchi, Tracheas producing running out air steam Larynx is amplifying the initial speech Root of the tongue, throat, nasal cavity, oral cavity forms tone quality & speech sound [5]. The use of automation techniques to evaluate the larynx and vocal tract helps the speech specialists to perform accurate diagnosis [6].Speech signal in non-intrusive in nature & it has potential for providing quantitative data with reasonable analysis time and hence study of pathological voice signal has become an significant subject for research as it reduces efforts in diagnoses of disease [7]. Prominent researches in literature survey suggest that most of the research has classified two classes which are normal and pathological disease. Some have worked on dysarthria. Some have classified normal, bicyclic and rough voice or normal, hyper function and paralysis speech. Still, there is an ample scope for suggesting a novel and systematic approach with a view to design an optimal decision support system for diagnosis of dreaded diseases. It is evident that there are many issues, diseases which are yet to be classified and in our work we shall shed light on all these aspects. The algorithm shown in figure 1 below shows the flowchart of the design. Here in this work, speech samples of vocal cord cancer disorder and normal persons were used. These speech samples are passed through pre-emphasis filter which is a high pass filter, the filtered output is framed and then each frame is passed through window. The output signal which is framed and windowed is used for spectral analysis. In spectral analysis derivative of logarithmic spectrum is taken, then logarithmic spectrum is used to get cepstrum. Autocorrelation of speech signal is also found to differentiate normal and vocal cord speech signal. From spectrum, cepstrum and autocorrelation, pattern classification is done for finding normal and vocal cord cancer speech signal. 2. ALGORITHM Algorithm of vocal cord cancer normal speech classification consists of speech acquirement, preprocessing, spectral analysis, feature extraction and disease classification. Speech samples are sinusoidal in nature with different frequency, different amplitude and different phase. 2.1 Pre-emphasis filter design The pre-emphasis filter is high pass filter. This filter flattens the speech signal spectrum and amplifies the area of spectrum. Thus improving the efficiency of spectral analysis [8, 9]. The time domain presentation of this filter is represented by the difference equation given below. Yn =Xn−λXn 1 (1)
Transcript

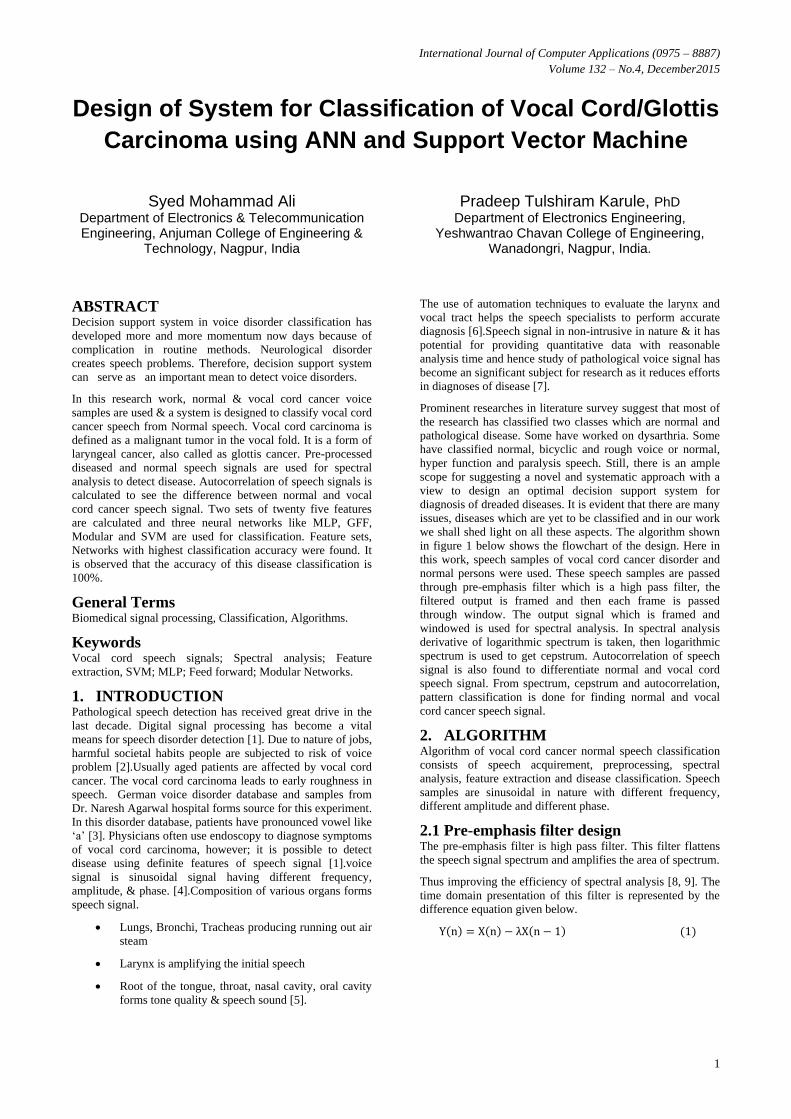
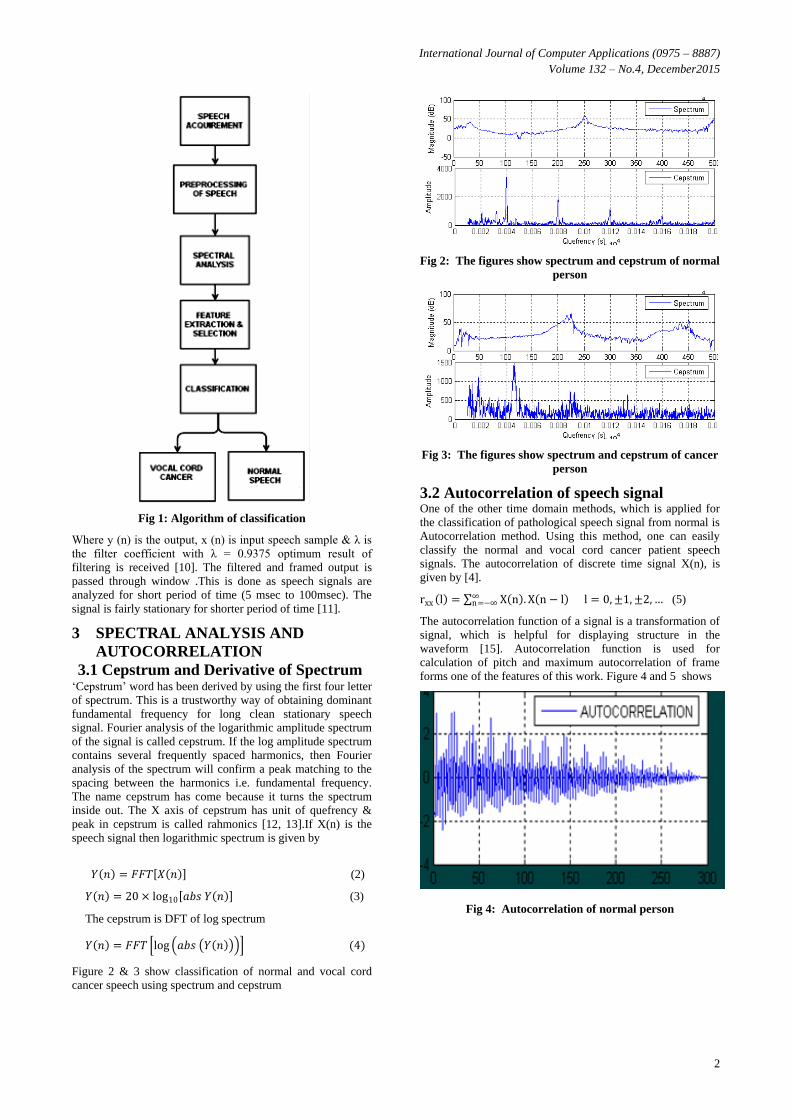
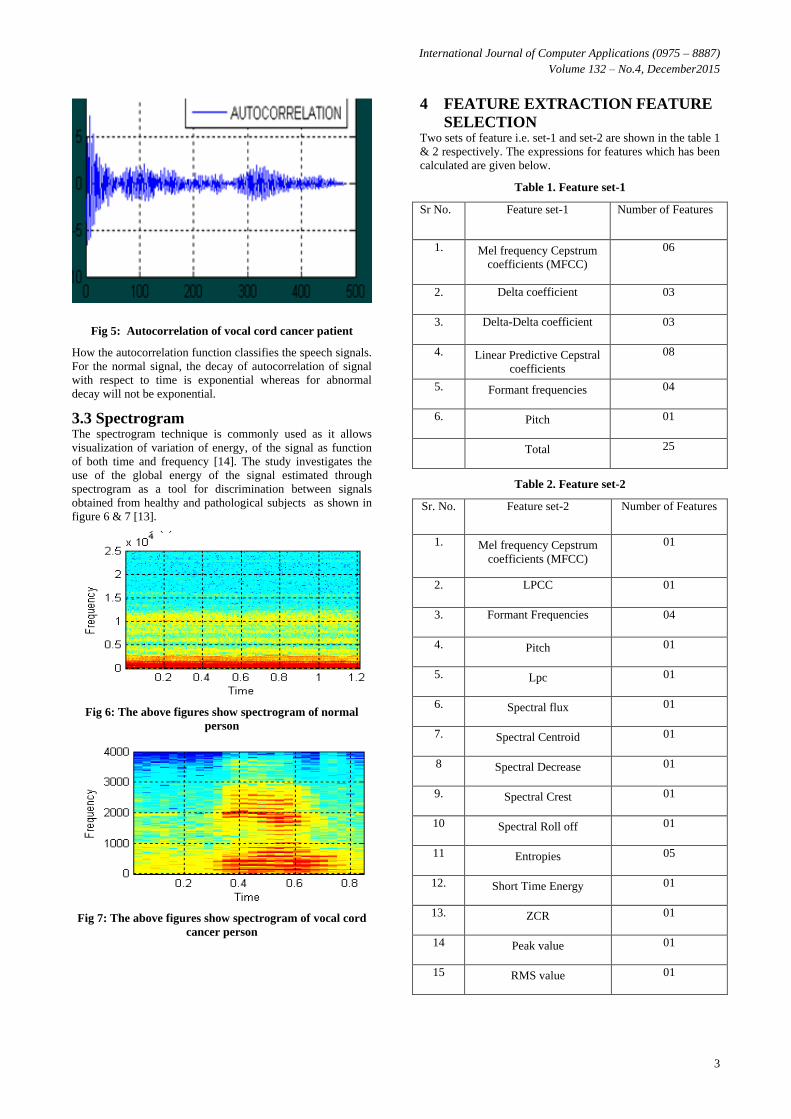
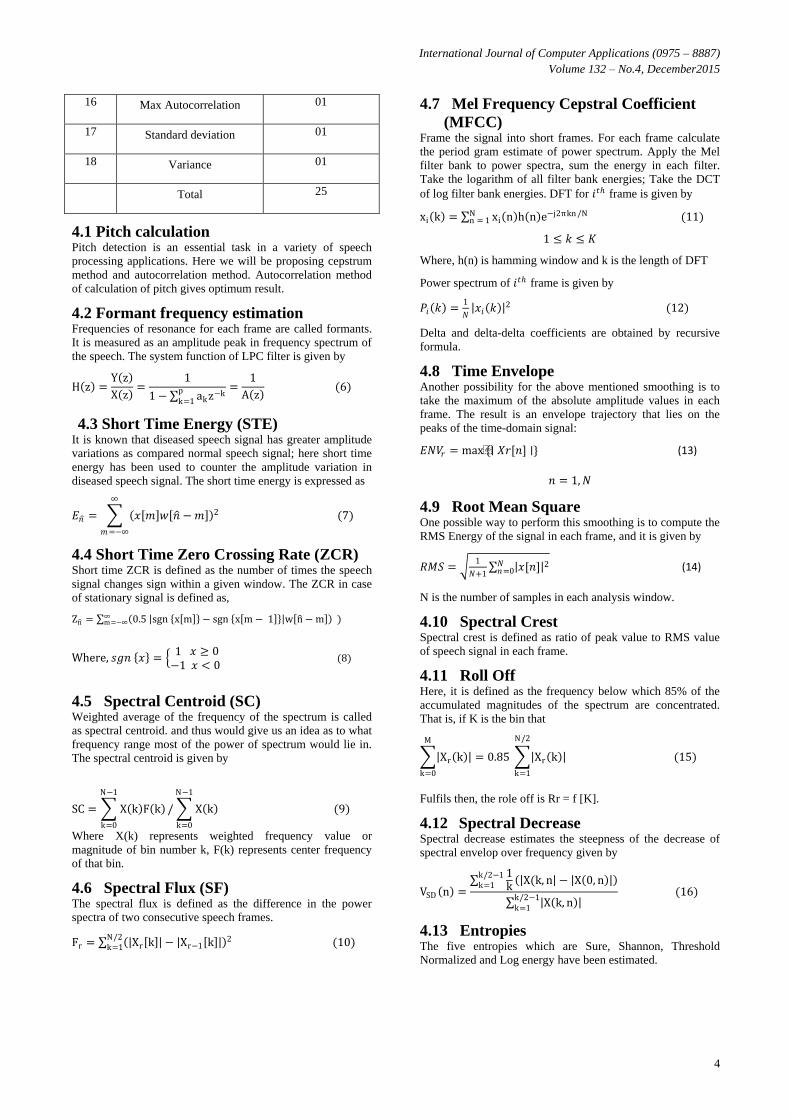
International Journal of Computer Applications (0975 – 8887)

Volume 132 – No.4, December2015

1

Design of System for Classification of Vocal Cord/Glottis

Carcinoma using ANN and Support Vector Machine

Syed Mohammad Ali

Department of Electronics & Telecommunication Engineering, Anjuman College of Engineering &

Technology, Nagpur, India

Pradeep Tulshiram Karule, PhD

Department of Electronics Engineering, Yeshwantrao Chavan College of Engineering,

Wanadongri, Nagpur, India.

ABSTRACT

Decision support system in voice disorder classification has

developed more and more momentum now days because of

complication in routine methods. Neurological disorder

creates speech problems. Therefore, decision support system

can serve as an important mean to detect voice disorders.

In this research work, normal & vocal cord cancer voice

samples are used & a system is designed to classify vocal cord

cancer speech from Normal speech. Vocal cord carcinoma is

defined as a malignant tumor in the vocal fold. It is a form of

laryngeal cancer, also called as glottis cancer. Pre-processed

diseased and normal speech signals are used for spectral

analysis to detect disease. Autocorrelation of speech signals is

calculated to see the difference between normal and vocal

cord cancer speech signal. Two sets of twenty five features

are calculated and three neural networks like MLP, GFF,

Modular and SVM are used for classification. Feature sets,

Networks with highest classification accuracy were found. It

is observed that the accuracy of this disease classification is

100%.

General Terms

Biomedical signal processing, Classification, Algorithms.

Keywords Vocal cord speech signals; Spectral analysis; Feature

extraction, SVM; MLP; Feed forward; Modular Networks.

1. INTRODUCTION Pathological speech detection has received great drive in the

last decade. Digital signal processing has become a vital

means for speech disorder detection [1]. Due to nature of jobs,

harmful societal habits people are subjected to risk of voice

problem [2].Usually aged patients are affected by vocal cord

cancer. The vocal cord carcinoma leads to early roughness in

speech. German voice disorder database and samples from

Dr. Naresh Agarwal hospital forms source for this experiment.

In this disorder database, patients have pronounced vowel like

„a‟ [3]. Physicians often use endoscopy to diagnose symptoms

of vocal cord carcinoma, however; it is possible to detect

disease using definite features of speech signal [1].voice

signal is sinusoidal signal having different frequency,

amplitude, & phase. [4].Composition of various organs forms

speech signal.

Lungs, Bronchi, Tracheas producing running out air

steam

Larynx is amplifying the initial speech

Root of the tongue, throat, nasal cavity, oral cavity

forms tone quality & speech sound [5].

The use of automation techniques to evaluate the larynx and

vocal tract helps the speech specialists to perform accurate

diagnosis [6].Speech signal in non-intrusive in nature & it has

potential for providing quantitative data with reasonable

analysis time and hence study of pathological voice signal has

become an significant subject for research as it reduces efforts

in diagnoses of disease [7].

Prominent researches in literature survey suggest that most of

the research has classified two classes which are normal and

pathological disease. Some have worked on dysarthria. Some

have classified normal, bicyclic and rough voice or normal,

hyper function and paralysis speech. Still, there is an ample

scope for suggesting a novel and systematic approach with a

view to design an optimal decision support system for

diagnosis of dreaded diseases. It is evident that there are many

issues, diseases which are yet to be classified and in our work

we shall shed light on all these aspects. The algorithm shown

in figure 1 below shows the flowchart of the design. Here in

this work, speech samples of vocal cord cancer disorder and

normal persons were used. These speech samples are passed

through pre-emphasis filter which is a high pass filter, the

filtered output is framed and then each frame is passed

through window. The output signal which is framed and

windowed is used for spectral analysis. In spectral analysis

derivative of logarithmic spectrum is taken, then logarithmic

spectrum is used to get cepstrum. Autocorrelation of speech

signal is also found to differentiate normal and vocal cord

speech signal. From spectrum, cepstrum and autocorrelation,

pattern classification is done for finding normal and vocal

cord cancer speech signal.

2. ALGORITHM Algorithm of vocal cord cancer normal speech classification

consists of speech acquirement, preprocessing, spectral

analysis, feature extraction and disease classification. Speech

samples are sinusoidal in nature with different frequency,

different amplitude and different phase.

2.1 Pre-emphasis filter design The pre-emphasis filter is high pass filter. This filter flattens

the speech signal spectrum and amplifies the area of spectrum.

Thus improving the efficiency of spectral analysis [8, 9]. The

time domain presentation of this filter is represented by the

difference equation given below.

Y n = X n − λX n − 1 (1)

International Journal of Computer Applications (0975 – 8887)

Volume 132 – No.4, December2015

2

Fig 1: Algorithm of classification

Where y (n) is the output, x (n) is input speech sample & λ is

the filter coefficient with λ = 0.9375 optimum result of

filtering is received [10]. The filtered and framed output is

passed through window .This is done as speech signals are

analyzed for short period of time (5 msec to 100msec). The

signal is fairly stationary for shorter period of time [11].

3 SPECTRAL ANALYSIS AND

AUTOCORRELATION

3.1 Cepstrum and Derivative of Spectrum „Cepstrum‟ word has been derived by using the first four letter

of spectrum. This is a trustworthy way of obtaining dominant

fundamental frequency for long clean stationary speech

signal. Fourier analysis of the logarithmic amplitude spectrum

of the signal is called cepstrum. If the log amplitude spectrum

contains several frequently spaced harmonics, then Fourier

analysis of the spectrum will confirm a peak matching to the

spacing between the harmonics i.e. fundamental frequency.

The name cepstrum has come because it turns the spectrum

inside out. The X axis of cepstrum has unit of quefrency &

peak in cepstrum is called rahmonics [12, 13].If X(n) is the

speech signal then logarithmic spectrum is given by

𝑌 𝑛 = 𝐹𝐹𝑇 𝑋 𝑛 (2)

𝑌 𝑛 = 20 × log10 𝑎𝑏𝑠 𝑌 𝑛 (3)

The cepstrum is DFT of log spectrum

𝑌 𝑛 = 𝐹𝐹𝑇 log 𝑎𝑏𝑠 𝑌 𝑛 (4)

Figure 2 & 3 show classification of normal and vocal cord

cancer speech using spectrum and cepstrum

Fig 2: The figures show spectrum and cepstrum of normal

person

Fig 3: The figures show spectrum and cepstrum of cancer

person

3.2 Autocorrelation of speech signal One of the other time domain methods, which is applied for

the classification of pathological speech signal from normal is

Autocorrelation method. Using this method, one can easily

classify the normal and vocal cord cancer patient speech

signals. The autocorrelation of discrete time signal X(n), is

given by [4].

rxx l = X n . X n − l ∞n=−∞ l = 0, ±1, ±2, … (5)

The autocorrelation function of a signal is a transformation of

signal, which is helpful for displaying structure in the

waveform [15]. Autocorrelation function is used for

calculation of pitch and maximum autocorrelation of frame

forms one of the features of this work. Figure 4 and 5 shows

Fig 4: Autocorrelation of normal person

International Journal of Computer Applications (0975 – 8887)

Volume 132 – No.4, December2015

3

Fig 5: Autocorrelation of vocal cord cancer patient

How the autocorrelation function classifies the speech signals.

For the normal signal, the decay of autocorrelation of signal

with respect to time is exponential whereas for abnormal

decay will not be exponential.

3.3 Spectrogram The spectrogram technique is commonly used as it allows

visualization of variation of energy, of the signal as function

of both time and frequency [14]. The study investigates the

use of the global energy of the signal estimated through

spectrogram as a tool for discrimination between signals

obtained from healthy and pathological subjects as shown in

figure 6 & 7 [13].

Fig 6: The above figures show spectrogram of normal

person

Fig 7: The above figures show spectrogram of vocal cord

cancer person

4 FEATURE EXTRACTION FEATURE

SELECTION Two sets of feature i.e. set-1 and set-2 are shown in the table 1

& 2 respectively. The expressions for features which has been

calculated are given below.

Table 1. Feature set-1

Sr No. Feature set-1 Number of Features

1. Mel frequency Cepstrum

coefficients (MFCC)

06

2. Delta coefficient 03

3. Delta-Delta coefficient 03

4. Linear Predictive Cepstral

coefficients

08

5. Formant frequencies 04

6. Pitch 01

Total 25

Table 2. Feature set-2

Sr. No. Feature set-2 Number of Features

1. Mel frequency Cepstrum

coefficients (MFCC)

01

2. LPCC 01

3. Formant Frequencies 04

4. Pitch 01

5. Lpc 01

6. Spectral flux 01

7. Spectral Centroid 01

8 Spectral Decrease 01

9. Spectral Crest 01

10 Spectral Roll off 01

11 Entropies 05

12. Short Time Energy 01

13. ZCR 01

14 Peak value 01

15 RMS value 01

International Journal of Computer Applications (0975 – 8887)

Volume 132 – No.4, December2015

4

16 Max Autocorrelation 01

17 Standard deviation 01

18 Variance 01

Total 25

4.1 Pitch calculation Pitch detection is an essential task in a variety of speech

processing applications. Here we will be proposing cepstrum

method and autocorrelation method. Autocorrelation method

of calculation of pitch gives optimum result.

4.2 Formant frequency estimation Frequencies of resonance for each frame are called formants.

It is measured as an amplitude peak in frequency spectrum of

the speech. The system function of LPC filter is given by

H z =Y z

X z =

1

1 − akz−kpk=1

=1

A z (6)

4.3 Short Time Energy (STE) It is known that diseased speech signal has greater amplitude

variations as compared normal speech signal; here short time

energy has been used to counter the amplitude variation in

diseased speech signal. The short time energy is expressed as

𝐸𝑛 = 𝑥 𝑚 𝑤 𝑛 − 𝑚 2

𝑚=−∞

(7)

4.4 Short Time Zero Crossing Rate (ZCR) Short time ZCR is defined as the number of times the speech

signal changes sign within a given window. The ZCR in case

of stationary signal is defined as,

Zn = 0.5 sgn x m − sgn x m − 1 w n − m ∞m=−∞ )

Where, 𝑠𝑔𝑛 𝑥 = 1−1

𝑥 ≥ 0 𝑥 < 0

(8)

4.5 Spectral Centroid (SC) Weighted average of the frequency of the spectrum is called

as spectral centroid. and thus would give us an idea as to what

frequency range most of the power of spectrum would lie in.

The spectral centroid is given by

SC = X k F k

N−1

k=0

/ X k

N−1

k=0

(9)

Where X(k) represents weighted frequency value or

magnitude of bin number k, F(k) represents center frequency

of that bin.

4.6 Spectral Flux (SF) The spectral flux is defined as the difference in the power

spectra of two consecutive speech frames.

Fr = Xr k − Xr−1 k 2N/2

k=1 (10)

4.7 Mel Frequency Cepstral Coefficient

(MFCC) Frame the signal into short frames. For each frame calculate

the period gram estimate of power spectrum. Apply the Mel

filter bank to power spectra, sum the energy in each filter.

Take the logarithm of all filter bank energies; Take the DCT

of log filter bank energies. DFT for 𝑖𝑡ℎ frame is given by

xi k = xi n h n e−j2πkn /NNn = 1 (11)

1 ≤ 𝑘 ≤ 𝐾

Where, h(n) is hamming window and k is the length of DFT

Power spectrum of 𝑖𝑡ℎ frame is given by

𝑃𝑖 𝑘 =1

𝑁 𝑥𝑖 𝑘

2 (12)

Delta and delta-delta coefficients are obtained by recursive

formula.

4.8 Time Envelope Another possibility for the above mentioned smoothing is to

take the maximum of the absolute amplitude values in each

frame. The result is an envelope trajectory that lies on the

peaks of the time-domain signal:

𝐸𝑁𝑉𝑟 = max{∣ 𝑋𝑟[𝑛] ∣} (13)

𝑛 = 1, 𝑁

4.9 Root Mean Square

One possible way to perform this smoothing is to compute the

RMS Energy of the signal in each frame, and it is given by

𝑅𝑀𝑆 = 1

𝑁+1 𝑥[𝑛] 2𝑁

𝑛=0 (14)

N is the number of samples in each analysis window.

4.10 Spectral Crest Spectral crest is defined as ratio of peak value to RMS value

of speech signal in each frame.

4.11 Roll Off Here, it is defined as the frequency below which 85% of the

accumulated magnitudes of the spectrum are concentrated.

That is, if K is the bin that

Xr k

M

k=0

= 0.85 Xr k

N/2

k=1

(15)

Fulfils then, the role off is Rr = f [K].

4.12 Spectral Decrease

Spectral decrease estimates the steepness of the decrease of

spectral envelop over frequency given by

VSD n =

1k X(k, n − X 0, n

k/2−1k=1

X k, n k/2−1k=1

(16)

4.13 Entropies

The five entropies which are Sure, Shannon, Threshold

Normalized and Log energy have been estimated.

International Journal of Computer Applications (0975 – 8887)

Volume 132 – No.4, December2015

5

4.14 Standard deviation, Variance The other features which were used are Standard deviation,

Variance, maximum autocorrelation, Lpc.

Every new feature should put some new information about the

disease. In this work, in what way these features vary with

respect to above disease is seen and if there is variation mean

they are giving some information then they were considered.

Variation of fo is shown in Fig.8. Each single feature was

trained and tested for considered diseases and in this way

feature vector was formed. The % corrects detection of feature

fo for chordectomy, cancer, laryngitis, laryngeal paralysis and

psychogenic dysphonie diseases are 0, 0, 78.26, 29.41, 88.23

respectively. This means that feature fo is good at accuracy

for laryngitis and psychogenic dysphonie disease. So we have

used fo as one of the features in feature vector.And in this

way all the features were tested and those features with good

accuracy were considered.

Fig 8: The above figures show spectrogram of vocal cord

cancer person

5. CLASSIFICATION The classifiers which were used for classification are MLP,

GFF, Modular and Support Vector Machine (SVM). Two sets

of twenty five features were chosen for classification . In the

first three N/Ns, five transfer functions with single layer

network, which were used are Tanh axion, L-Tanh axion,

Sigmoid axion, L-sigmoid axion and Softmax axion were

used and in SVM only epochs can be changed so we have

changed the epochs. In this case male samples of vocal cord

cancer and normal were taken, as males are ten times prone to

this disease. Training was done for 75% of samples for three

runs and testing on 25% of samples.The total number of

samples taken are 106. All the experimental values put in

tabular form are given in table 3. It is clear from all the

experiment i.e 1A,1B,2A,2B,3A,3B,4A and 4B that the

detection of vocal cord cancer disease and normal from the

speech is 100% .

6. RESULT AND DISCUSSION We have performed four experiments and the neural networks

were used are MLP, GFF, MODULAR and SVM and for each

network, we have used two sets of feature i.e. set-1 and set-2.

In the first three experiments we have used five transfer

function which are Tanh axion, Sigmoid axion, Linear

tanhaxion, Linear sigmoid axion and softmax axion, epochs

used were 1500 and for last experiment epochs used

were1500 & 2000. Graph 1 is the graph of accuracy of MLP

verses transfer function from which we can conclude that for

feature set-1, except for softmax axion, the accuracy is 100 %

in determining the vocal cord cancer disease from normal for

all other four specified transfer functions. And similarly in the

same experiment with feature set-2, except for Tanh axion,

the accuracy is 100 % in determining the vocal cord cancer

disease from normal for other specified transfer function.

The second experiment is of classification with GFF n/w and

from graph 2, we conclude that, with set-1 as feature, the

accuracy is 100% for all the five transfer function and with set

-2 as feature vector, the accuracy is 100% only for Linear

Tanh axion.

In experiment three where classification is done with modular

n/w, from graph 3, with set-1 as features and Tanhaxion,

Linear Tanhaxion, and Softmaxaxion as transfer function we

conclude that the accuracy is 100%. And with set -2 as feature

accuracy is 100% only for Linear Tanh axion.

Table 3. Experimental values and Accuracy

S

r

.

N

o

Experiment-

ation,

N/N,

Feature sets

Transfer

Function Epoch

Maximum

%

Accuracy

1 1A, MLP,

set-1

Tanh Axion 1500 100

Sigmoid Axion 1500 100

Linear

TanhAxion 1500 100

Linear Sigmoid

Axion 1500 100

Softmax Axion 1500 92.30

2

1B, MLP,

set-2

Tanh Axion 1500 92.30

Sigmoid Axion 1500 100

Linear

TanhAxion 1500 100

Linear Sigmoid

Axion 1500 100

Softmax Axion 1500 100

3 2A, GFF,

set-1

Tanh Axion 1500 100

Sigmoid Axion 1500 100

Linear Tanh

Axion 1500 100

Linear Sigmoid

Axion 1500 100

Softmax Axion 1500 100

4 2B, GFF,

set-2

Tanh Axion 1500 92.30

Sigmoid Axion 1500 92.30

Linear Tanh

Axion 1500 100

Linear Sigmoid

Axion 1500 92.30

Softmax Axion 1500 84.61

5 3A, Modular,

set-1

Tanh Axion 1500 100

Sigmoid Axion 1500 57.69

Linear Tanh

Axion 1500 100

Linear Sigmoid

Axion 1500 65.38

Softmax Axion 1500 100

6 3B, Modular,

set-2

Tanh Axion 1500 92.30

Sigmoid Axion 1500 65.38

Linear

TanhAxion 1500 100

Linear Sigmoid

Axion 1500 65.38

Softmax Axion 1500 88.46

7 4A, SVM,

set-1 ------- 1500 100

International Journal of Computer Applications (0975 – 8887)

Volume 132 – No.4, December2015

6

S

r

.

N

o

Experiment-

ation,

N/N,

Feature sets

Transfer

Function Epoch

Maximum

%

Accuracy

8 4B, SVM,

set-2 -------

1500,

2000 84.61, 100

Fourth experiment is with SVM, in which we can change only

epochs. So, in this experiment with set-1 as feature, 1500

epochs, we got 100 % accuracy. And when set-2 was used as

feature vector, with 2000 epochs we got 100% classification

accuracy. The accuracy of this experiment for two different

set of feature is shown in bar chart graph 4.

Graph 1: Accuracy verses Transfer function for MLP

Graph 2: Accuracy verses Transfer function for GFF

Thus, finally from all the four experiments, we can conclude

that, mostly accuracy is 100 % with Tanh Axion and Linear

Tanh axion as transfer function..In SVM, with 1.5K and 2k

epochs the accuracy is 100% for both the feature sets. The

input and output nodes used in the network were Twenty-five

and two respectively, since twenty features were used to

classify two classes. Future scope for this experiment may be

reduced new features to get 100% accuracy. Hence, for all

four networks i.e MLP, GFF, Modular network and SVM,

The Vocal cord cancer from Normal speech is 100%

classified.

Graph 3: Accuracy verses Transfer function for Modular

n/w

Graph 4 : Accuracy verses Transfer function for SVM

889092949698

100102

Tan

h a

xio

n

Sigm

oid

axi

on

Lin

ear

tan

h a

xio

n

Lin

ear

sigm

oid

Soft

max

axi

on

AC

CU

RA

CY

TRANSFER FUNCTION

ACCURACY VS TRANSFER

FOR FEATURE SET

1 & 2

MLP N/W,FEATURE SET-1

MLP N/W,FEATURE SET-2

7580859095

100105

Tan

h a

xio

n

Sigm

oid

Lin

ear …

Lin

ear …

Soft

max

…AC

CU

RA

CY

TRANSFER FUNCTION

ACCURACY VS TRANSFER

FUNCTION FOR FEATURE SET

1 & 2

GFF N/W, FEATURE SET-1

GFF N/W,FEATURE SET-2

020406080

100120

Tan

h a

xio

n

Sigm

oid

axi

on

Lin

ear

tan

h a

xio

n

Lin

ear

sigm

oid

axi

on

Soft

max

axi

on

AC

CU

RA

CY

TRANSFER

ACCURACY VS TRANSFER FOR FEATURE SET

1 & 2

MODULAR N/W,FEATURE SET-1

MODULAR N/W,FEATURE SET-2

100 100

0

20

40

60

80

100

120

1.5K Epoch

2k Epoch

A

C

C

U

R

A

C

Y

EPOCH

ACCURACY ,FEATURE SET 1 & 2

set-1 Feature

set-2 Feature

International Journal of Computer Applications (0975 – 8887)

Volume 132 – No.4, December2015

7

7. REFERENCES [1] Salhi, L., Mourad, T., Cherif, A.,2010 “Voice Disorders

Identification Using Multilayer Neural Network”, The

International Arab Journal of Information Technology,

Volume 7-No.2, (April 2010),177-185.

[2] Hariharan, M., Paulraj, M.P., Jaacob, S., 2010, “Time

Domain Features and Probabilistic Neural Network For

the Detection Of Vocal Fold Pathology”, Malaysian

journal Of Computer Science, Vol(23) (2010),60-67.

[3] Putzer, M., Koreman, J., 1997, “A german database for

a pattern for vacal fold vibration” Phonus 3, Institute of

Phonetics, University of the Saarland, Tavel, P. 2007

Modeling and Simulation Design. AK Peters Ltd, 143-

153.

[4] Proakis, J. G. G., Manolakis, “Digital Signal Processing.

Principles, Algorithm and Applications”, Prentice Hall

India, Third Eition.309, 122.

[5] Orzechowski, Izworski,A., Izworski, R., Tadeusiewiez

,K., Chmunzynska, P., Radkowski, I., Gotkowska, 2005,

“ Processing of pathological change in speech caused by

Dysarthria ”, IEEE Proceedings of 2005 International

symposium on intelligent signal processing &

communication system, 49-52.

[6] Oliveira Rosa, M. de, Pereira ,J. C, Gellet, M.,2000

“Adaptive Estimation of Residue Signal for Voice

Pathology Diagnose”, IEEE Transaction on Biomedical

Engineering , Vol.47, No.1(Jan.2000).

[7] Cesar , M. E., Hugo, R. L.,2000, “Acoustic Analysis of

speech for detection of Laryngeal pathologies”, IEEE

proceeding of the 22nd Annual EMBS international

conference chicago IL,(2000) ,2369-2372.

[8] Picone, J.W., 1993 “Signal modeling techniques in

speech recognition”, Proceedings of the IEEE, Vol.81,

No.9, Sept.1993.

[9] Lipeika, A., Lipeikiene, J., Lipeikiene, L.,

Telksnys,2000, “Development of Isolated speech

Recognition System”, INFORMATICA, Vol 13, No.1,

2002,37-46.

[10] Sigmund, M. “Voice Recognition By Computer”,

TectumVerlag publication, pp no20-22.

[11] Gill, M. K.,2010 “Vector Quantization based Speaker

identification”, International Journal of Computer

Application(0975-8887)Volume 4-No.2,2010,1-4.

[12] Schafer ,R.W., Rabiner, L.R.,1970 “System for

automatic formant analysis of voiced

speech,”J.Amer.,vol.47, (Feb.1970) 634-648,

[13] http://www.phon.ucl.ac.uk/resource/sfs/rtgram/AboutSpe

ctrography

[14] Fernandes, M., Mattioli, F.E.R., LamounierJr.,E.A. and

Andrade,A.O.,2011,“Assesment of Laryngeal Disorders

Through TheGlobal Energy of Speech,”IEEE Latin

American Transactions,vol.9,No.7,( December 2011).

[15] Rabiner,L. R.,1977 “On the use of Autocorrelation

Analysis for Pitch Detection”,IEEE Transaction

Acoustics,Speech and signal Processing ”,Vol.ASSP-

25,No.1, (February 1977),24-30.

IJCATM : www.ijcaonline.org


Recommended