Transportation Research Record 930 1 Design Study of Asphalt Membrane-Overlay for Concrete Runway Pavement WILLIAM D.O. PATERSON A design analysis for a medium-thickness asphalt overlay incorporating a thin stress-absorbing membrane interlayer of styrene-butadiene-styrene elastomer- asphalt for the rehabilitation of cracked concrete pavements is presented. The study extends the application of this type of membrane from successful road trials of thin overlays to more severe conditions--e.g., joint movements of up to 7 mm and airport runway loadings. Finite-element analysis and time-tem- perature-dependent material properties are used to analyze response and fatigue under diurnal therrrial and aircraft dynamic loading in various modes. This shows that resistance to cracking is improved by increasing overlay thick- ness and stiffness and reducing membrane stiffness. Results were verified by laboratory tests. An BO-mm-thick composite membrane-overlay system fea- turing an extended interlayer of open-graded asphalt above the membrane is found to satisfy the design requirements and is comparable to a 230-mm- thick conventional overlay for control of crack reflection over a 15-year life. The system is shown to be safe under all aircraft loading conditions. The control of reflection cracking in bituminous overlays of concrete pavement has been subject to considerable study (1-4), and yet a Federal Aviation Administration revie;(5) concluded that few defini- tive indications of goOa performance were available except for the fact that thick overlays perform best. Conditions on major airport runways are par- ticularly severe for such overlays. Dynamic wheel loadings, tire pressures, and horizontal shear stresses (e.g., during touchdown and turning) are considerably higher than for highways. The volume of traffic, however, is lower so that weathering effects often dominate performance. A weak bond of the overlay and spalling of the reflection cracks are particular hazards under the high uplift stresses around jet engines, which can lead to in- gestion and foreign object damage. The rehabilita- tion method should rapid and permit the continued use of the runway between work periods. Road trials had indicated that a thin (40-mm) asphalt overlay system incorporating a thin ( 2-mm) elastomer-asphalt stress-absorbing membrane inter- layer (SAM!) performed well. This study was there- fore undertaken during an airport runway design case to extend the application to more exacting condi- tions through theoretical analysis and laboratory testing. Previous work by Coetzee and Monismith (,2) on flexural loading conditions indicated that (a) a soft interlayer reduces the crack tip stresses by a factor of 5 to 8 and thus delays the initiation of cracking, ( b) the stress reduction is improved by decreasing the stiffness of the interlayer, and (c) the optimum thickness of the interlayer is 2. 5 to 3. 0 mm. The interlayer, which was a crumbed tire rubber-asphalt blend, remained intact after cracking and did not debond from the concrete as the conven- tional tack coat had done. Early use of crumbed rubber asphalt interlayers showed largely successful performance under severe temperature conditions in Arizona (2,3). Still better performance with styrene-butadi-;;ne-styrene (SBS) elastomer-asphalts in waterproofing membranes for bridge decks in Ohio led to the development in Australia (!!l of a predigested concentrate suitable for blending with asphaltic cements to produce a sprayable elastomer-asphalt of high resilience and high yield strain. This last material was used in the study. DESIGN CONCEPTS AND APPROACH Reflection cracking is the result of fatigue caused by repeated cycles of loading and is thus tractable for analysis when the mode, amplitude, and duration of the loading can be established. There are four fatigue modes of primary interest for a bituminous overlay on a concrete pavement: 1. Diurnal thermal stresses in the asphalt and concrete create direct tension-compression cycles in the overlay due to contraction and expansion in the concrete. The relative displacement at a disconti- nuity such as a construction joint or crack may be substantial--e.g., 7 mm for a 75-m slab and a daily ambient temperature range of 20°C. Any warping stresses are usually second . order. 2. Vertical shear stresses develop from relative vertical displacement at a joint between two adja- cent slabs under a loaded wheel. The displacements are usually small ( O. 5 to 2. O mm) but represent a severe scissor action. 3. The flexure of the overlay is usually slight because of the stiffness of the concrete pavement, but stress concentration develops above crack and joint discontinuities. 4. Horizontal joint shear may develop over lon- gitudinal joints when adjacent slabs have different effective slab lengths--e.g., due to bound dowel joints or uncontrolled cracking. Displacements may be as much as 6 mm. In the case study, a condition survey of the 175- to 250-mm-thick concrete pavement indicated extensive areas of severe transverse cracking, diag- onal warping, and block fatigue cracking but little faulting. Measurements were made of joint movements and deflections. These are summarized in Table 1 Table 1. Design loading parameters for thermally induced movements and wide-bodied jet aircraft loadings on concrete pavement overlays. Aircraft Wheel Loads Thermal Loading Parameter Touchdown Taxiing Laboratory Diurnal Loading time (s) 0.01 0.02-0.08 IS 13,000 Frequency (Hz) IS l.S 0.01 Aircraft speed (m/s) 70 8-35 Static load (kN), incidence angle Locked wheel 270,38 With antilock 216,14 210 Dynamic load (kN), in cid en ce angle Locked wheel S40,38 With antilock 430,14 230-270 No. of repetitions• Normal 10,000 S0,000 S,000 Locked wheel I Joint relative displacement (mm) Horizontal s 3.3-7 Longitudinal 4 0-6 Vertical 3 O.S-3 Maximum deflection (mm) 1.0 aFifteen-year life.
Transcript
Transportation Research Record 930 1
Design Study of Asphalt Membrane-Overlay for
Concrete Runway Pavement
WILLIAM D.O. PATERSON
A design analysis for a medium-thickness asphalt overlay incorporating a thin stress-absorbing membrane interlayer of styrene-butadiene-styrene elastomerasphalt for the rehabilitation of cracked concrete pavements is presented. The study extends the application of this type of membrane from successful road trials of thin overlays to more severe conditions--e.g., joint movements of up to 7 mm and airport runway loadings. Finite-element analysis and time-temperature-dependent material properties are used to analyze response and fatigue under diurnal therrrial and aircraft dynamic loading in various modes. This shows that resistance to cracking is improved by increasing overlay thickness and stiffness and reducing membrane stiffness. Results were verified by laboratory tests. An BO-mm-thick composite membrane-overlay system featuring an extended interlayer of open-graded asphalt above the membrane is found to satisfy the design requirements and is comparable to a 230-mmthick conventional overlay for control of crack reflection over a 15-year life. The system is shown to be safe under all aircraft loading conditions.
The control of reflection cracking in bituminous overlays of concrete pavement has been subject to considerable study (1-4), and yet a Federal Aviation Administration revie;(5) concluded that few definitive indications of goOa performance were available except for the fact that thick overlays perform best. Conditions on major airport runways are particularly severe for such overlays. Dynamic wheel loadings, tire pressures, and horizontal shear stresses (e.g., during touchdown and turning) are considerably higher than for highways. The volume of traffic, however, is lower so that weathering effects often dominate performance. A weak bond of the overlay and spalling of the reflection cracks are particular hazards under the high uplift stresses around jet engines, which can lead to ingestion and foreign object damage. The rehabilitation method should rapid and permit the continued use of the runway between work periods.
Road trials (~) had indicated that a thin (40-mm) asphalt overlay system incorporating a thin ( 2-mm) elastomer-asphalt stress-absorbing membrane interlayer (SAM!) performed well. This study was therefore undertaken during an airport runway design case to extend the application to more exacting conditions through theoretical analysis and laboratory testing.
Previous work by Coetzee and Monismith (,2) on flexural loading conditions indicated that (a) a soft interlayer reduces the crack tip stresses by a factor of 5 to 8 and thus delays the initiation of cracking, ( b) the stress reduction is improved by decreasing the stiffness of the interlayer, and (c) the optimum thickness of the interlayer is 2. 5 to 3. 0 mm. The interlayer, which was a crumbed tire rubber-asphalt blend, remained intact after cracking and did not debond from the concrete as the conventional tack coat had done.
Early use of crumbed rubber asphalt interlayers showed largely successful performance under severe temperature conditions in Arizona (2,3). Still better performance with styrene-butadi-;;ne-styrene (SBS) elastomer-asphalts in waterproofing membranes for bridge decks in Ohio led to the development in Australia (!!l of a predigested concentrate suitable for blending with asphaltic cements to produce a sprayable elastomer-asphalt of high resilience and high yield strain. This last material was used in the study.
DESIGN CONCEPTS AND APPROACH
Reflection cracking is the result of fatigue caused by repeated cycles of loading and is thus tractable for analysis when the mode, amplitude, and duration of the loading can be established. There are four fatigue modes of primary interest for a bituminous overlay on a concrete pavement:
1. Diurnal thermal stresses in the asphalt and concrete create direct tension-compression cycles in the overlay due to contraction and expansion in the concrete. The relative displacement at a discontinuity such as a construction joint or crack may be substantial--e.g., 7 mm for a 75-m slab and a daily ambient temperature range of 20°C. Any warping stresses are usually second . order.
2. Vertical shear stresses develop from relative vertical displacement at a joint between two adjacent slabs under a loaded wheel. The displacements are usually small ( O. 5 to 2. O mm) but represent a severe scissor action.
3. The flexure of the overlay is usually slight because of the stiffness of the concrete pavement, but stress concentration develops above crack and joint discontinuities.
4. Horizontal joint shear may develop over longitudinal joints when adjacent slabs have different effective slab lengths--e.g., due to bound dowel joints or uncontrolled cracking. Displacements may be as much as 6 mm.
In the case study, a condition survey of the 175- to 250-mm-thick concrete pavement indicated extensive areas of severe transverse cracking, diagonal warping, and block fatigue cracking but little faulting. Measurements were made of joint movements and deflections. These are summarized in Table 1
Table 1. Design loading parameters for thermally induced movements and wide-bodied jet aircraft loadings on concrete pavement overlays.
Aircraft Wheel Loads Thermal Loading
Parameter Touchdown Taxiing Laboratory Diurnal
Loading time (s) 0.01 0.02-0.08 IS 13,000 Frequency (Hz) IS l.S 0.01 Aircraft speed (m/s) 70 8-35 Static load (kN),
incidence angle Locked wheel 270,38 With antilock 216,14 210
Dynamic load (kN), in cid en ce angle
Locked wheel S40,38 With antilock 430,14 230-270
No. of repetitions• Normal 10,000 S0,000 S,000 Locked wheel I
Joint relative displacement (mm)
Horizontal s 3.3-7 Longitudinal 4 0-6 Vertical 3 O.S-3
Maximum deflection (mm) 1.0
aFifteen-year life.
2
along with the design loadings and load durations typical of a wide-bodied jet passenger aircraft (e.g., Boeing 747B), which wet"e adopted for the analysis. An extra loading duration of 15 sec (equivalent to a cyclic frequency of 0.01 Hz) has been included in the analyses to replicate the practical loading rate selected for the laboratory experimental study of overlay behavior under simulated thermal loading cycles.
Preliminary laboratory tension-compression tests indicated that the common membrane-overlay system, with 40-mm thickness of open-graded friction course and 2.0 or 2.5 mm of elastomer-asphalt membrane, whicn haa proved adequat.e on many road pavements, was inadequate for the large amplitude of movements anticipated in joints and cracks on runway pavement. Two composite, medium-thickness overlay configurations with total thickness of 80 and 100 mm were then devised as shown in Figure 1. The thin lower layer of an open-graded macadam (OM) or friction course type of material serves the dual purpose of increasing the effective depth of the interlayer with a low-stiffness asphaltic mixture and minimizing the penetration of the membrane into this layer by using a material with a relatively low laydown temperature (e.g., 120°C) to be constructed on the elastomer-asphalt membrane. The wearing course layer of asphaltic concrete (AC) provides the primary load-bearing capacity, durability, and resistance to deformation.
The alternative conventional thick overlay of 170 mm (in three layers, as shown in Figure 2) was included in order to compare the behavior of the two systems.
Figure 1. Overlays with thin elastomer membrane.
JI ,,, • • It • I ~ I I • •
o: t".6 o .. · 6· o_ • , 6 c;;.., ·· .· ·. ot>
• "· 'O ; O. ' I> .. ~ • • o .
DENSE-GRADED ASPHALT CONCRETE
OPEN-GRADED MACADAM
ELASTOMER-AC INTERLAYER 2+ mm THICK
CRACKED P.C. CONCRETE
175 to 250 mm THICK
Transportation Research Record 930
Material Properties
The time- and temperature-dependent properties of the bituminous materials cover a wide range: Load duration ranges from 0.01 sec at touchdown to 13,000 sec under diurnal thermal cycles. These properties were determined by using the Shell method (_2) and the van der Poel nomograph, allowing for hardening during construction. The characteristics of the New Zealand-refined asphalt cements used in the study are given in Table 2, and the stiffness relations are shown in Figure 3.
The stiffness properties of the elastomer-asphalt membrane material are alsu shown .in Fiquce 3 .Lu1 c:t
50-50 blend between the concentrate and the 80-100 penetration asphaltic cement. In the blend range of 50 to 60 percent concentrate, the membrane has a high resilience of 50 to 80 percent by the Colorado L-2207 test. This is much higher than that of most crumbed rubber asphalt blends and gives the material good long-term performance under high cyclic strains of 100 to 800 percent. Other properties of the elastomer blends are given in Table 2.
The corresponding mixture stiffnesses are shown in Figure 4 for the three mixes that constitute the overlay configurations--i.e., dense-graded asphaltic concrete, open-graded bituminous macadam (or friction course material), and the composite material of elastomer-filled macadam created in the vicinity of the membrane by interpenetration. Under normal construction conditions, a 3-mm-thick ( 3-L/m2 J membrane penetrates 3 to 5 mm up into a macadam at 120°C, leaving a 2. 0-mm free thickness of membrane interlayer at the interface.
SUCCESSFUL ROAD
PERFORMANCE
AIRFIELD DESIGN CONFIGURATION
Figure 2. Conventional thic_k overlay without membrane.
175 to 250
~========r----- FRICTION COURSE (20 mm)
•------ ASP HAL TIC CONCRETE (75 mm)
1-.----- OPEN MACADAM (75 mm)
SLAB
Transportation Research Record 930 3
Table 2. Properties of asphaltic cements and blends of SBS elastomer asphalt with 80 to 100 penetration asphaltic cement.
Unaged Asphaltic Cement
Property Test Designation A I) c
Penetration at 25° C ASTM D5 60-70 80-100 180-200 Softening point (°C) ASTM 02398 55 49.4 40.7 Penetration index -0.3 -0.3 -0.2 Resilience Colorado L-2207
:From 80 to 100 penet ration O!phaltic cement blend Blend between percentage conccinlrate and perct.!11l1'ge 80-100 penetralion asphaltic cement.
Figure 3. Effect of temperature and loading time on weathered binder stiffness.
The fatigue life relations for the asphaltic concrete and macadam mixtures shown in Figure 5 were determined from binder volume and stiffness by the volumetric method (9). Controlled strain conditions apply in all of the modes of loading because the response of the stiff concrete pavement dominates the response of the softer overlay. This method gave more conservative estimates of safe tensile strain than the energy dissipation method (_2) and also agreed better with the experimental observations. The curves control the initiation of crack-ing, and
These various analyses
propagation is considered separately. figures have been included so that the
relations that emerge from the following can be interpreted.
THERMAL ANALYSIS
Model
Analysis of the behavior under thermal stress conditions was conducted by using a two-dimensional fi-
Elastomer'
50/SOb 60/40b
124 128 62 79.5 6.4 7 .3 50 81
Figure 4. Mix stiffness versus binder stiffness for full range of loading time.
nite-element model in the SOLID SAP computer program <.!Q). Dimensional difficulties arise in designing a su1table model. A general diagram of the one selected is shown in Figure 6. In this case, the slab length between doweled expansion joints was 76 m, which is long for reinforced concrete pavement. This gave rise to large daily joint movements--as much as 7 mm. The model takes symmetry about the joint centerline, and it was assumed that asymmetrical movement, which had been observed and could be ascribed to locked dowels or differences in frictional restraint between slabs, could be approximated by this. Second, the model was truncated 1 m from the joint centerline to permit the use of smaller element sizes and to achieve an acceptable accuracy of solution. This length is at least five times greater than the distance of the peak surface strain from the joint centerline. Continuity was preserved by the selection of the boundary conditions shown and nodal point loads at the truncated face, as follows.
4 Transportation Research Record 930
Figure 5. Maximum design tensile strain to control fatigue cracking for given mixes.
Figure 6. Schematic configuration of pavement for finite-element analyses of thermal stresses.
0 + 0 0 0
SLAB
REGION ANALYSED
JOINT
i I
175
40
2501
500
JOINT SLAB
t. HALF LENGTH = JBOOO ~ :: .
" ' :-\ ~
INTERNAL STA ESSES
JOINT SEALANT
THERMAL LOADS
CONCRETE SLAB
SUB BASE OLD PCC OR GRAVEL
SLIP LAYER MEMBRANE
SUBGRADE
1000
NB: Dimensions mm
A minimum element size of 2.5x2.0 mm was adopted for the region near the joint, where the stress and strain gradients are extremely high, and along the elastomer membrane, which through penetration during the construction process was reduced to a net thickness of 2 mm. Triangular elements were incorporated in all but noncritical areas to avoid violating compatibility between four- and five-node elements.
Nodal point loads and thermal stresses (oT) within the overlay and the slabs were derived from
(!)
----• A::if'HALTIC CONCR ET E - - - - OPEN MACADAM
Figure 7. Effect of asphalt overlay thickness on daily joint movement and average slab temperature of 75-m-long slab.
ET = stiffness of asphaltic mixes at loading time of 13,000 sec and computed mean temperature,
- 6 - 6 a = 35.10 /°C for asphaltic concrete and 9.10 I
°C for concrete, and T = temperature differential at the node between
null and peak conditions (°C).
For the design case in a tropical zone, the mean air temperature (w - M~T) was 25.5°C and the maximum variation from the mean was l0.6°C. The corresponding temperature gradients computed by the Barber method <2> ranged from a stable mean of 25. 5°C at a depth of 500 mm to a maximum of 47°C and a minimum of 15°C at the surface. At the mid-depth of
Transportation Research Record 930
the slab, the maximum temperature range was 8. 7°C; on a 76-m-long slab, this causes a joint movement of 6 mm. This compares well with the range of 3.3- to 7. 0-mm movements measured in the field. The computed influence of overlay thickness on joint movements, shown in Figure 7 indicates that insulation occurs for thicknesses greater than 50 mm and movement and thermal stress are reduced by 40 percent with an overlay thickness of 100 mm.
The thermal stresses computed at the boundary of the overlay were less than 21 kPa, but at the boundary of the concrete slab they were more than 100
5
times higher. During development of the model it was found that the net displacement of the slab caused by applying these stresses as nodal loads was strongly influenced by the frictional restraint provided by the underlying subbase. Because the mode of loading for the overlay is essentially controlled by strain, it was decided best to control the slab displacement rather than to attempt to estimate the true nature and degree of the underslab restraint. Thus, a thin slip zone of low shear strength but normal vertical stiffness was introduced at the top of the subbase, and displacement
Table 3. MaKimum tensile strain and factor of safety for 5,000 cycles under diurnal thermal loading.
Layer Thickness Layer Analysis Stiffness ET F (mm) Slab
AC OM Ml Displacement AC AC AC OM Code8 (MP a) (MPa) (kPa) (mm) Surface AC-OMb OM Max MI Surface
:Layer c:odcs and thicknesses correspond to Figure 11. At surt:acc of OM (i.e. FC) l:.yor for 40 mm design; at bottom of AC layer in composite designs.
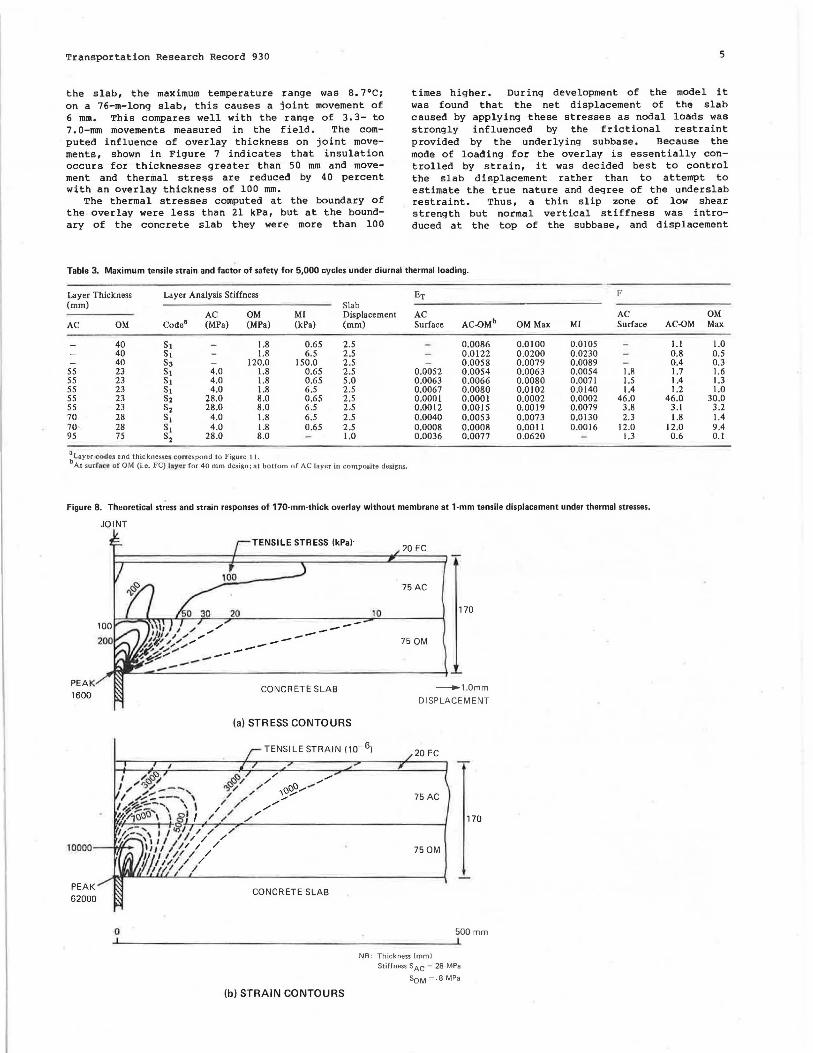
Figure 8. Theoretical st~ess and strain responses of 170-mm·thick overlay without membrane at 1-mm tensile displacement under thermal stresses.
PEA K
1600
PEAK
62000
JOINT
0
TENSILE STRESS (kPa)· 20 FC
75 AC
10 170
-----------CONCRETE SLAB
(a) STRESS CONTOURS
75 OM
-1.0mm DISPLACEMENT
TENSILE STRAIN (10-6) 20 FC
CONCRETE SLAB
(b) STRAIN CONTOURS
75 AC
170
75 OM
500 mm
NB : Thickness (mm) Stiffness SAC = 28 MPa
SoM = .8MPa
OM AC-OM Max
I.I l.O 0.8 0.5 0.4 0.3 1.7 1.6 1.4 1.3 1.2 1.0
46 .0 30.0 3.1 3.2 1.8 1.4
12.0 9.4 0.6 0.1
6
elements were placed at the nodes of the concrete slab boundary. This approach also obviated errors from the temperature gradient analysis, which showed poor accuracy at depth. The respective displacements used in the analyses were 2.5- and 1.0-mm tension for 80- and 170-mm-thick overlays.
Analyses
Eleven analyses were conducted. They covered the range of values expected for the materials in the design configurations (Figure 1). Most of these configurations were also included in the laboratory test program referred to later in chis paper.
Because initial analyses comparing 2. 5- and 5. 0-mm slab displacements indicated that the induced stresses and strains· were essentially linear in relation to displacement, subsequent analyses were conducted with only 2.5-mm displacement (half-amplitude), th.e maximum expected ·in reality under an BO-mm-thick overlay [linearity had been reported previously (_!)]. The 170-mm-thick overlay without membrane configuration was analyzed and tested with the corresponding expected displacement of 1.0 mm.
During warm afternoon conditions, the overlay is in compression. Although the preliminary analyses indicated that a slight hump of 0.5 to 2.0 mm developed over the joint at peak compression, the strains
Transportation Research Record 930
were small and subcritical. Thus, the analyses concentrated on the tensile phase that occurs during the cool temperatures of early morning, the peak occurring between the hours of 4:00 and 6:00 a.m.
Element stiffnesses were determined from relations between material stiffness and temperature for a loading time of 13,000 sec (over a 24-hr period). Nodal temperature differences determined from the temperature gradients of the early morning peak and the evening null were included for the computation of internal thermal stresses.
Results
The results of the analyses are given in Table 3. Contours of the induced tensile stresses and strains on longitudinal sections of three of the overlay systems as well as average values of the applicable layer stiffness are shown in Figures 8 to 10.
The conventional thick overlay system of 170 mm without a membrane, shown in Figure B, had a peak tensile stress of 1,600 kPa and a peak tensile strain of O. 062 at a slab displacement of 1 mm. Note that the OM layer of lower stiffness not the AC layer has had a slight attenuating effect on the tensile stress distribution. The peak strain path runs diagonally upward from the near edge of the joint at an angle of approximately 40° from the
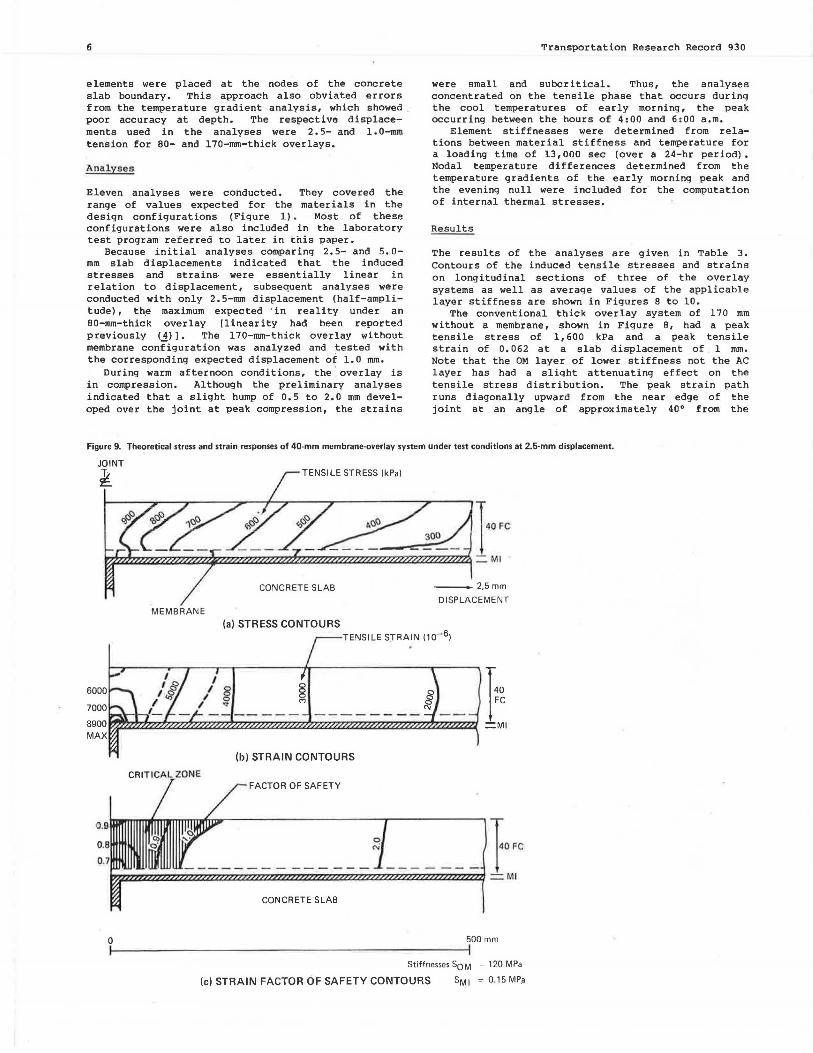
Figure 9. Theoretical stress and strain responses of 40-mm membrane-overlay system under test conditions at 2.5-mm displacement.
(c) STRAIN FACTOR OF SAFETY CONTOURS SMI = 0.15MP.a
Transportation Research Record 930
vertical. Allowing variations for the redistribution of stresses during propagation, this is the approximate path that would be taken by crack growth. The chart of fatigue life shown in Figure 5 indicates that for a stiffness of B MPa cracking would initiate in the lower layer on the first loading cycle--i.e., the first day. To extend the life to crack initiation to 5,000 cycles--i.e., 15 years--the peak strain would have to be reduced to 0.009, which is equivalent to a slab displacement of 0.15 mm. According to Figure 7, to achieve this degree of insulation the overlay thickness would have to be increased to 230 mm or mor e.
The thin flexible overlay system of 40-mm friction course with membrane, shown in Figure 9, had a peak tensile stress of 960 kPa--i.e., 40 percent lower than the thick overlay--and a corresponding peak tensile strain of O.OOB9 under a slab displace~ ment of 2.5 mm. Under these conditions, the time to crack initiation would be 1, 000 cycles, or 3 years. Under the field conditions of the design study, this would be augmented by a factor of 3. 5 ·to 2. 5 to estimate the strain at a 7-mm slab displacement-i.e., 0.013. The time to crack initiation would then be approximately 100 cycles, or 4 months.
To assess the life and level of strain in different materials, it is useful to define a strain safety factor (F) :
F =safe strain for 5 ,000 cycles/estimated maximum strain (2)
7
This defines a critical zone (shown shaded in Figure 9c). The analysis suggests that this configuration, which has a safe strain of 0.0075 for 5,000 cycles, could sustain a repeated displacement of 2 mm.
The composite overlay system, comprising BO mm of asphaltic mixes and a membrane (Figure 10) had an even lower peak tensile stress of 90 kPa and a peak tensile strain of O. 0079 under a slab displacement of 2. 5 mm. Because the peak tensile strain in the unmodified macadam layer above the elastomer penetration is less than this value (0. 004) and the design displacement is also 2.5 mm, this configuration is safe. Because the fatigue properties of the elastomer-penetrated macadam are unknown, F can best be estimated in the unpenetrated region and is thus 1.9. The attenuating effect of the composite system is evident in each of the four effective layers--the membrane, the elastomer-penetrated macadam, the open macadam, and the asphaltic concrete. Thus, the system effE!ctively attenuates the high stress concentration at the joint.
The results of the analyses appear in more general form in Figure 11, which shows the effects of changes in overlay thickness, mix stiffness, and membrane stiffness. The effects are shown in terms of F which is normalized across mix type and stiffness. The relations indicate the basic trends and mechanisms that appear to dictate the behavior of membrane-overlay systems under thermal load cycles and could be used as a basis for formulating future
Figure 10. Theoretical stress and strain responses of BO-mm composite overlay under thermal stresses at 2.5-mm displacement.
JOINT
~ TENSILE STRESS (kPa)
8 2 CONCRETE SLAB
(a) STRESS CONTOURS
TENSILE STRAIN (10-6)
AC
80
OM
Ml
-2.5mm DISPLACEMENT
AC
80
OM
I ~2}:z~~:zzt12Z1ZZZZfzl2ZZZ:ZZ:!2Z2:ZZZz:zzl!"zzzzzz;zzz.;i:zzzzzz;2ZZZ2ZZZZ2:ZZZ!Z!:;l_MI
PEAK 7900
0
(b) STRAIN CONTOURS
CONCRETE SLAB
500 mm
Stiffnesses SAC= 28 MPa
SoM = 8 MPa SMI = 6.5 kPa
8
Figure 11. Joint effects of overlay thickness and stiffness and membrane stiffness on tensile strain factor of safety under thermal loading. STRAIN FACTOR OF SAFETY
·1 00------~------1~------,
40 S3 ['.) (TEST)
-
-
0.1 ________ _,, _ ______ .__1 ____ __ ....
100 1000 10.000 100.000 MACADAM/MEMBRANE STIFFNESS RATIO
• NB: Thickness mm
Stiffnesses Si in Table 3
designs. These trends and mechanisms include the following:
1. Increasing the overlay thickness has the dual effect of reducing the peak induced strain for a given constant displacement and also reducing the slab displacement by increasing the insulation effect. Figure 10 shows the net effect, given the preoverlay condition of 6-mm amplitude displacement at the joint. overlay thickness therefore plays a much stronger part in reducing crack tip stresses under thermal loading than was shown <1> under flexural loading.
2. Increasing the overlay stiffness for a given ratio of overlay to membrane stiffness increases the factor of safety. This trend is contrary to that observed for behavior under flexure, which is improved by a decreasing mix stiffness <1> . This indicates that it is possible to have stiff, stable asphaltic concrete mixes in this kind of overlay system, with beneficial effects, provided the interlayer system beneath has sufficiently low stiffness.
3. Increasing the stiffness ratio between the overlay and the membrane has a strong influence on increasing the factor of safety. This implfes that the membrane should have as low a stiffness as possible. Because this requirement generally conflicts with the associated needs for high resilience and reasonably high softening point in the membrane, a compromise is necessary.
AIRCRAFT LOADING ANALYSES
Model and Analyses
For the analysis of overlay behavior under various modes of aircraft wheel loading, the finite-element model used for the thermal analyses (Figure 6) was modified in the following ways:
1. The length was extended to 3 m. 2. The boundary (displacement) elements and
thermal loads at the truncated face were replaced by two- and three-dimensional boundary restraints.
3. Loads were applied at surface nodal points
Transportation Research Record 930
Table 4. Maximum induced tensile strains and factors of safety on tensile strain for 50,000 repetitions under flexure by rolling wheel load.
Note: Swface deftec 1lon under desJan wheel load= 0.93 m. Surface temperature = 15° C.
variously to represent a rolling-wheel vertical load on the joint centerline and the inc l ined wheel loads of impact ~t touchdown and two conditions of braking.
This series of analyses was confined to the 80-mm composite overlay system, which satisfied the design conditions for thermal stresses. In each case the material properties used were those appropriate to the loading time (Figures 3-5). The stiffnesses are much higher than they were for the thermal analyses: 2,000 to 6,000 MPa for the mixes and 1 to 30 MPa for the elastomer membrane.
Behavior in Flexure
Flexural fatigue and crack propagation were analyzed for the rolling-wheel vertical load condition and two widths of underlying discontinuity--a 20-mm-wide construction joint and a 2-mm-wide crack. No load transfer was assumed for both cases. The peak deflection above the discontinuity under load was 0.93 mm; this compares well with the measured design condition of 1-mm deflection, which is high for concrete pavement.
The results, given in Table 4, indicate that the factors of safety for 100, 000 load repetitions were greater than 1 throughout the overlay although they were rather low within ttte macadam layer. There was little difference between the 20- and 2-mm-wide discontinuity conditions. Because these were determined for the more critical cool condition, the correct factors of safety for average conditions are higher than those cited.
Touchdown Conditions
The primary concern regarding touchdown and the subsequent slowing of the aircraft is whether shoving and sliding could occur within the overlay. The analysis included two loading conditions: locked and unlocked wheel. Although most modern aircraft are fitted with wheel antilock devices, records show a finite small chance of 0.01 percent of the occurrence of the more severe locked-wheel condition. Two design life criteria, 10,000 and 1 loading cycles, were established for the unlocked- and locked-wheel restrictive conditions.
The analyses were conducted for both cool and warm temperatures. Under cool conditions, the fac-
' tors of safety were greater than 2. The contours of vertical strain computed for loading toward and away from a discontinuity under warm temperature conditions are shown in Figure 12. These indicate that the peak compressive strains are developed in the interlayer and macadam layers and are within the capacity of the materials.
Two tension zones develop, one in front of and one behind the wheel. The peak vertical tensile
Transportation Research Record 930 9
Figure 12. Theoretical response of 80-mm membrane-overlay system under touchdown during warm temperatures.
TENSION
PEAK VERTICAL + 900.10-6
JOINT
T-
-14000.10-6 PEAK VERTICAL
PEAK + 2900.10- 6
P.C.C. SLAB
(a) VERTICAL STRAIN CONTOURS - BEHIND LOAD
JOI NT
0
LOAD
PEAK VERTICAL STRAIN + 4000.10-6
55 AC
230M
+ 2MI T PCC
500 mm
(b) VERTICAL STRAIN CONTOURS - AHEAD OF LOAD NB: AVE. STIFFNESSES AC 2900 MPa
OM 1700 MPa Ml 9 MPa
strains develop near the interface between the macadam and the asphaltic concrete and are high: O. 029 behind the wheel and O. 004 in front of the wheel. These are safe for the asphaltic mixtures but could be critical at the interface if the tack-coat bond were inadequate. The results therefore indicate a need to pay close attention to the tack coat.
There is no indication that the overlay would roll up in front of the wheels under emergency braking conditions. The surface deflection profile shows a maximum deflection of o. 4 mm and a positive bow wave in front of the wheel of only O. 04 mm, which is negligible.
Permanent Deformation
As a final check, the permanent deformation under rolling-wheel conditions for a taxiway with strongly channelized wheel paths was estimated by using the Shell method ( 9). This indicated that the 15-year deformation after 60, 000 wheel loads would be approximately 10 mm if the wearing course binder were 60/70 penetration asphaltic cement. This was considered acceptable. The stiffer binder also contributes to the resistance to crack initiation. However, the binder of the macadam layer was kept at 80/100 penetration in order to keep the macadam interlayer stiffness as low as practicable and to
.keep the construction temperature low with respect to the softening point of the membrane.
LABORATORY VERIFICATION
An experimental study was conducted to verify the predicted behavior of the membrane-overlay system under controlled conditions. Thirteen test specimens prepared under full-scale construction conditions were tested in horizontal direct tension-compression, horizontal joint shear, and vertical joint shear under controlled temperatures of 20°C and 35°C. Cyclic displacements were applied at a basic frequency of O. 01 Hz for thermal loads and, for wheel loads, at 25 Hz with a 0.34-sec rest period.
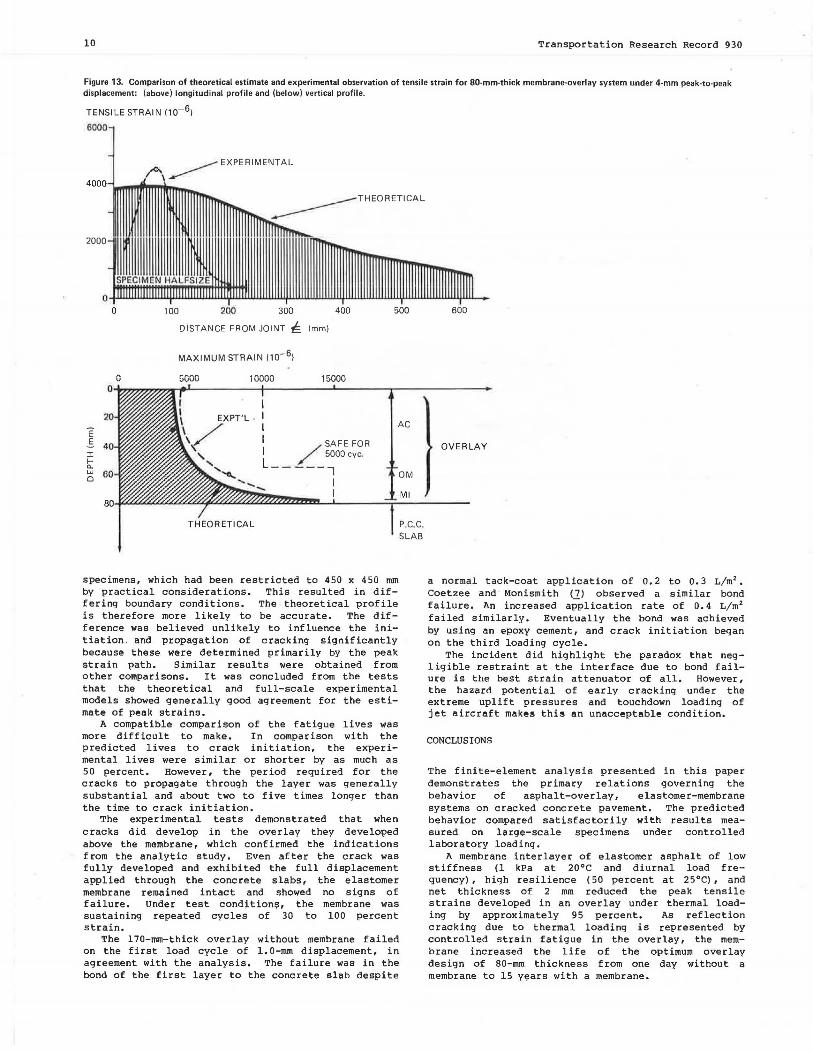
The analytic estimates of strain determined by using the material stiffnesses estimated in Figures 3 to 5 could be verified from the experimental measurements. In Figure 13 the profile of the theoretical thermally induced surface tensile strain is compared with the experimental observations of surface strain under 2-mm tensile static displacement for the 80-mm-thick composite membrane-overlay configuration.
Figure 13 shows that the theoretical peak strain is within 10 percent of the observed strain and that it also occurs at the same location--i. e., 75 mm from the joint centerline or in a plane at 43° from the plane of the joint. After repeated load cycles, the observed path of crack propagation was along this inclined plane of peak strain. Outside the peak zone, however, the shapes of the strain attenuation profiles are different. This was primarily because of the smaller size of the experimental
10 Transportation Research Record 930
Figure 13. Comparison of theoretical estimate and experimental observation of tensile strain for 80-mm-thick membrane-overlay system under 4·mm peak-to·peak displacement: (above) longitudinal profile and (below) vertical profile.
TENSI LE STRAI N (10-6)
6000
__.....--EXPERIMENTAL ,...~'\ ...--
40oo,__.'Pll"I'..., _ _ ..-------THEORETICAL
2000
0 0 100 200 300 400 500
DISTANCE' FROM JOINT E (mm)
MAXIMUM STRAIN (10-6)
0 5000 10000 15000 0
I 20 I
"E I AC
.s I SAFE FOR 40 I / 5000cyc. :i:
I-a.. L ___ __ l
w 60 OM 0 I I
80
THEORETICAL
specimens, which had been restricted to 450 x 450 mm by practical considerations. This resulted in differing boundary conditions. The theoretical profile is therefore more likely to be accurate. The difference was believed unlikely to influence the initiation . and propagation of cracking significantly because these were determined primarily by the peak strain path. Similar results were obtained from other comparisons. It was concluded from the tests that the theoretical and full-scale experimental models showed generally good agreement for the estimate of peak strains.
A compatible comparison of the fatigue lives was more difficult to make. In comparison with the predicted lives to crack initiation, the experimental lives were similar or shorter by as much as 50 percent. However, the period required for the cracks to propagate through the layer was generally substantial and about two to five times longer than the time to crack initiation.
The experimental tests demonstrated that when cracks did develop in the overlay they developed above the membrane, which confirmed the indications from the analytic study. Even after the crack was fully developed and exhibited the full displacement applied through the concrete slabs, the elastomer membrane remained intact and showed no signs of failure. Under test condition!;!, the membrane was sustaining repeated cycles of 30 to 100 percent strain.
The 170-mm-thick overlay without membrane failed on the first load cycle of 1.0-mm displacement, in agreement with the analysis. The failure was in the bond of the first layer to the concrete slab despite
Ml
P.C.C. SLAB
600
OVERLAY
a normal tack-coat application o f o. 2 to o. 3 L/ m2•
Coetzee and Monismith (7) observed a similar bond failure. An increased application rate of O. 4 L/ m2
failed similarly. Eventually the bond was achieved by using an epoxy cement, and crack initiation began on the third loading cycle.
The incident did highlight the paradox that negligible restraint at the interface due to bond failure is the best strain attenuator of all. However, the hazard potential of early cracking under the extreme uplift pressures and touchdown loading of jet aircraft makes this an unacceptable condition.
CONCLUSIONS
The finite-element analysis presented in this paper demonstrates the primary relations governing the behavior of asphalt-overlay, elastomer-membrane systems on cracked concrete pavement. The predicted behavior compared satisfactorily with results measured on large-scale specimens under controlled laboratory loading.
A membrane interlayer of elastomer asphalt of low stiffness (1 kPa at 20°C and diurnal load frequency), high resilience (50 percent at 25°C), and net thic kness of 2 mm reduced the peak tensile strains developed in an overlay under thermal loading by approximately 95 percent. As reflection cracking due to thermal loading is represented by controlled strain fatigue in the overlay, the membrane increased the life of the optimum overlay design of 80-mm thickness from one day without a membrane to 15 years with a membrane.
Transportation Research Record 930
An increase of overlay thickness caused a strong reduction in the peak tensile strain above the membrane ~hrough two effects: (a) increased attenuation of strain at constant displacement and (b) reduced slab displacement due to the increased thermal insulation afforded by overlay thicknesses greater than 50 mm. The reduction was approximately 90 percent for an increase in thickness from 40 to 100 mm. This is much greater than the small effect of thickness on stress under flexural loading <ll •
Peak tensile strains were also considerably reduced by increasing the stiffness ratio between the overlay and the membrane, which should be about 10, 000. The minimum stiffness of the membrane is generally constrained by its softening point, which should be higher than 50°C to 60°C below the overlay construction temperature. With these constraints, a high mix stiffness is beneficial in the overlay under thermal loading.
A composite overlay design composed of two layers, an open-graded asphalt mix of moderately low stiffness above the membrane and a moderately stiff asphaltic concrete as the surfacing, is particularly effective under the conflicting constraints cited previously.
The optimum design thickness of the composite system with membrane for the case study was 60 mm. This was shown to resist reflection cracking as well as a 200- to 230-mm-thick conventional overlay without membrane. Contract costs of the 60-mm design were approximately 25 percent less than the costs of a 170-mm conventional overlay.
In warm temperatures and under the abnormal conditions of locked-wheel touchdown that characterize wide-bodied aircraft, high but subcritical vertical tensile strains develop above the membrane that could cause delamination if the bond between layers were defective.
The bond strength between a conventional overlay without membrane and a concrete pavement is usually exceeded by the shear stresses of daily thermal loading. If an elastomer membrane is not used, alternative measures such as sawn sealed joints and increased overlay thickness are required.
The elastomer-asphalt membrane remained intact and impervious even after eventual cracking of the overlay under testing. Under these conditions, it sustains repeated cycles of tensile strain in excess of 100 percent.
ACKNOWLEDGMENT
The study described in this paper was conducted for Beca, Carter, Hollings, and Ferner, Ltd., of Auck-
11
land and Yee, Morgan, and Company, Ltd., of Suva on behalf of the Civil Aviation Authority of Fiji and is published with their permission. The participation and guidance of H. Richard Green and L. Gavin Cormack of Beca, Carter, Hollings, and Ferner, Ltd., and Athol J. Carr of the University of Canterbury are gratefully acknowledged. The views expressed in this paper are mine and do not necessarily reflect the views of the other parties.
REFERENCES
1. K.H. McGhee. Attempts to Reduce Reflection Cracking in Bituminous Concrete Overlays on Portland Cement Concrete Pavements. TRB, Transportation Research Record 700, 1979, pp. 106-114.
2. G.R. Morris and C.M. McDonald. Asphalt-Rubber Stress-Absorbing Membranes: Field Performance and State of the Art. TRB, Transportation Research Record 595, 1976, pp. 52-56.
3. G.B. Way. Prevention of Reflective Cracking in Arizona. TRB, Transportation Research Record 756, 1960, pp. 29-32.
4. K. Majidzadeh and G.G. Sukarieh. Analytical Modeling and Field Verification of Thermal Stresses in Overlay. TRB, Transportation Research Record 632, 1977, pp. 44-48.
5. A. L. McLaughlin. Reflection Cracking of Bituminous Overlays for Airport Pavements: A State of the Art. FAA, Rept. FAA-RD-79-57, 1979.
6. W.D.O. Paterson. Rubber Bitumen Materials in Corrective Maintenance and Rehabilitation of Pavements. Proc., Australian Asphalt Paving Assn., Brisbane, Aug. 1961.
7. N.F. Coetzee and C.L. Monismith. Analytical Study of Minimization of Reflection Cracking in Asphalt Concrete Overlays by Use of a RubberAsphalt Interlayer. TRB, Transportation Research Record 700, 1979, pp. 100-107.
8. J. Yeaman. Rubberized Bitumen: A State of the Art. Pavement Management Services, Ltd., Sydney, Australia, 1961.
9. Shell Pavement and Design Manual: Asphalt Pavements and Overlays for Road Traffic. Shell International Petroleum Company, London, 1976.
10. E.L. Wilson. SOLID SAP: A Static Analysis Program for Three-Dimensional Solid Structures. Univ. of California, Berkeley, Sept. 1971.
Publication of this paper sponsored by Committee on Pavement Rehabilitation.