Page 1
University of South CarolinaScholar Commons
Theses and Dissertations
2018
Design, Synthesis, And Characterization OfMonometallic And Bimetallic CatalystsSonia EskandariUniversity of South Carolina
Follow this and additional works at: https://scholarcommons.sc.edu/etd
Part of the Chemical Engineering Commons
This Open Access Dissertation is brought to you by Scholar Commons. It has been accepted for inclusion in Theses and Dissertations by an authorizedadministrator of Scholar Commons. For more information, please contact [email protected] .
Recommended CitationEskandari, S.(2018). Design, Synthesis, And Characterization Of Monometallic And Bimetallic Catalysts. (Doctoral dissertation).Retrieved from https://scholarcommons.sc.edu/etd/4699
Page 2
DESIGN, SYNTHESIS, AND CHARACTERIZATION OF MONOMETALLIC AND
BIMETALLIC CATALYSTS
by
Sonia Eskandari
Bachelor of Science
Tabriz University, 2004
Master of Science
Amirkabir University of Technology, 2008
Master of Engineering
Clemson University, 2014
Submitted in Partial Fulfillment of the Requirements
For the Degree of Doctor of Philosophy in
Chemical Engineering
College of Engineering and Computing
University of South Carolina
2018
Accepted by:
John R. Regalbuto, Major Professor
John R. Monnier, Committee Member
John W. Weidner, Committee Member
Christopher T. Williams, Committee Member
Aaron K. Vannucci, Committee Member
Cheryl L. Addy, Vice Provost and Dean of the Graduate School
Page 3
ii
© Copyright by Sonia Eskandari, 2018
All Rights Reserved.
Page 4
iii
DEDICATION
Dedicated to my parents, Leili and Moharram, for trusting and believing me. Also
to my best friend and sister ever, Soheila for her nonstop support during this long journey,
her husband Rahim and their lovely son Ryne.
Page 5
iv
ACKNOWLEDGEMENTS
I would like to acknowledge my supervisor, Dr. John R. Regalbuto for accepting
me in his wonderful group and giving me the opportunity to learn research. He is just
wonderful and patient in process of training every bit of research. I was so fortuned to work
with him. He just wants student to progress. I appreciate his support for letting me to attend
various conference over US to present my work and learn other researchers work.
I would like to thank Dr. Monnier, National Academy of Engineer member. He is a tough
but an awesome advisor to learn a lot from. Every day he gave me new insight related to
different projects. I appreciate his time for training me in different areas of catalysis with
patience.
I would also like to appreciate my committee members, Dr. Christopher T.
Williams, Dr. Aaron K. Vannucci and Dr. John W. Weidner for their advices after my
comprehensive exam and their time to review my work.
I would like to thank Dr. Feng and his group on doing EXAFS experiments, which
covers an important part of my second chapter.
The help of staffs in the Department of Chemical Engineering: Marcia Rowen,
Loretta Hardcastle, Carol Stork, Vernon Dorrell, Chase Ferch and Brian Loggans is truly
appreciated.
Page 6
v
It is pleasure to thank my colleagues: Dr. Jadid E. Samad, Dr. John M. Tengco, Dr.
Shuo Cao, Dr. Kerry O’Connell, Dr.Ritubarna Banerjee, Dr. Bahareh Tavakkoli Al-Sadat,
Andrew P. Wong, Fahad Almalki, Jayson Keels, Greg, Sean Noble, Jeremiah W. Lipp,
Abolfazl Shakouri, Mozhdeh and Nathan for helping me to learn experimental work.
I sincerely appreciate my friends for their support and motivation.
I love to thank my favorable restaurant “OLIVE GARDEN” with its refill soup and
salad.
I am so happy of accomplishing my PhD at USC in Columbia and proud of that.
Page 7
vi
ABSTRACT
Supported catalysts are used extensively in a variety of heterogeneously catalyzed
reactions for industrial processes. Techniques for preparing supported noble metal catalysts
are typically chosen to achieve high metal dispersions in order to obtain high activity for a
given metal loading. Enhancing the catalytic performance of heterogeneous catalysts can
be done by increasing active site count as well as modification of the physico-chemical
characteristics of the catalyst material. For supported metal nanoparticles this can be
achieved by decreasing particle size, thus increasing dispersion or metal utilization on the
surface of the particles, while modification of metal properties can be attained by addition
of a secondary metal that has a strong interaction to the primary metal, beneficial for a
given reaction. In this dissertation, the first two chapters cover preparation methods to
control metal particles size and the third chapter goes over evaluations of monometallic
and bimetallic catalyst.
In the preparation of supported metal catalysts, the methods of Strong Electrostatic
Adsorption (SEA), and its incipient wetness analog, Charge Enhanced Dry Impregnation
(CEDI), can yield supported metal nanoparticles with high dispersion and narrow size
distribution. Catalysts prepared by SEA and CEDI therefore are desirable as seeds for
addition of secondary metal using Electroless Deposition (ED), as the prepared bimetallic
catalysts should be of similar dispersion as the base catalyst. CEDI and ED methods were
used to demonstrate the preparation of monometallic and bimetallic catalysts containing
Page 8
vii
noble and base metals which were then characterized and evaluated for hydrogenation
reactions. The first system used Pt, Pd, Co, Ni as the single metal, prepared by CEDI on
silica support. In the second system Ag-Ir bimetallic catalysts prepared by ED method were
characterized with hydrogenation reactions, FTIR and H2 temperature program desorption
(H2-TPD).
In the first work, it was demonstrated that sintering of metal nanoparticles can be
induced by the presence of residual balancing ions such as Cl-. We further show how
particle size can be drastically reduced by the removal of residual ions. X- ray diffraction
(XRD) was used to analyze the particle size.
In the second work, Pt(NH3)4(OH)2 as a model metal precursor has been studied to
investigate the effect of different anions such as Cl-, Br-, NO3-, and C6H5O7
-3- on the size
and polydispersity. Chloride, and bromide had largest impact on sintering and growth of
Pt particles along with wide size distribution, confirmed by XRD and STEM images.
In the third work, Ag-Ir bimetallic catalysts at different coverages of Ag were
studied. A direct method of reaction and two indirect methods including H2-TPD and FTIR
experiments were done to evaluate the unusual H2-uptake of these catalysts. Two different
hydrogenation reactions were used to evaluate catalytic properties of the Ir@Ag catalysts,
the hydrogenation of propylene (C3H6) and hydrogenolysis of methyl cyclopentane (MCP).
In situ transmission Fourier transform infrared spectroscopy (FTIR) of CO adsorption
indicates that the Ag is randomly deposited on all types of Ir surface sites during the ED
process.
Page 9
viii
TABLE OF CONTENTS
DEDICATION ................................................................................................................... iii
ACKNOWLEDGEMENTS ............................................................................................... iv
ABSTRACT ....................................................................................................................... vi
LIST OF TABLES ...............................................................................................................x
LIST OF FIGURES ........................................................................................................... xi
CHAPTER 1 INTRODUCTION AND LITERATURE REVIEW ....................................1
INTRODUCTION ....................................................................................... 1
CHAPTER 2 EXPERIMENTAL METHOD....................................................................12
CATALYSTS PREPARATION ................................................................ 12
CATALYST CHARACTERIZATION ..................................................... 15
CATALYSTS EVALUATION (PROPYLENE HYDROGENATION
AND METHYL CYCLOPENTANE HYDROGENOLYSIS) .......... 19
CHAPTER 3 SYNTHESIS OF SUPPORTED METAL PARTICLES OF
CONTROLLED SIZE ...............................................................................................22
INTRODUCTION ..................................................................................... 22
MATERIAL AND METHODS ................................................................. 24
RESULTS AND DISCUSSION ................................................................ 26
CONCLUSION .......................................................................................... 36
Page 10
ix
CHAPTER 4 NANOPARTICLE SYNTHESIS VIA ELECTROSTATIC
ADSORPTION USING INCIPIENT WETNESS IMPREGNATION......................37
INTRODUCTION ..................................................................................... 37
MATERIAL AND METHODS ................................................................. 39
RESULTS AND DISCUSSION ................................................................ 42
CONCLUSION .......................................................................................... 58
CHAPTER 5 EVALUATION OF AG–IR/AL2O3 BIMETALLIC CATALYSTS
PREPARED BY ELECTROLESS DEPOSITION FOR HYDROGENATION OF
PROPYLENE AND HYDROGENOLYSIS OF METHYL CYCLOPENTANE .....59
INTRODUCTION ..................................................................................... 59
MATERIALS AND METHODS ............................................................... 63
RESULTS AND DISCUSSION ................................................................ 67
CONCLUSION .......................................................................................... 77
REFERENCES ..................................................................................................................78
Page 11
x
LIST OF TABLES
Table 2.1. Summary of chemicals and materials ...............................................................12
Table 3.1. EXAFS fitting data for Pt samples on SiO2. .....................................................34
Table 4.1. Metal loss after washing dried samples prepared by DI and CEDI methods. ..56
Table 4.2. Washing samples as wet without drying. ..........................................................57
Table 5.1 Bimetallic Ag-Ir Catalysts for C3H6 hydrogenation, and MCP hydrogenolysis69
Table 5.2. Selectivity to isomerization products of MCP, TOF (s-1) based on MCP reacted,
rate (µmol/g cat. Min), and Conversion (%) at reaction conditions of 300 °C and 1
atm, tot. flow of 50 sccm. .........................................................................................75
Page 12
xi
LIST OF FIGURES
Figure 1.1. Impregnation method to prepare supported platinum nanoparticles 8. Modified
from Chan, K. Y.; et al. J. Mater. Chem. 2004, 14(4),505–516. Copyright 2004 Royal
Society of Chemistry.....................................................................................................4
Figure 1.2.(A) A schematic of the deposition precipitation procedure for the synthesis of
the Pt–Au/CeO2 catalyst. (B) TEM images and EDX spectra of the Pt–Au/CeO2
catalyst, respectively14. Modified from Hong, X.; et al. Catal. Sci. Technol. 2016, 6,
3606–3615. Copyright 2015Royal Society of Chemistry. ............................................6
Figure 1.3.(A) A schematic of the procedure for silver nanoparticles synthesized using
coreduction approach. (B) FEG-TEM images of silver nanoparticles16. Based on
Agnihotri, S.; et al. RSC Adv. 2014, 4(8), 3974–3983. Open access publication. .......7
Figure 1.4.An illustration of the synthesis of the polyol method. .......................................8
Figure 1.5. Steps of SEA mechanism: a) determination of PZC point of support by single
point method; b) metal precursor uptake to obtain optimal pH, c) adsorption of
precursor on support including hydration sheaths precursor at optimal pH. ...............9
Figure 3.1.(a) XRD profile and b) STEM image and particle size distribution of 4.5 wt %
Pt/SiO2 (PTAOH) prepared by CEDI. .......................................................................26
Figure 3.2. (a) XRD pattern, and (b) STEM image of 4.5 wt% Pt/SiO2 containing chloride
prepared by CEDI. .....................................................................................................27
Figure 3.3. Deconvolution of Cl-/Pt=1, PTAOH as precursor on silica support. ..............27
Figure 3.4. (a) XRD pattern, and (b) STEM image of 4.5 wt% Pt/SiO2 containing bromide
prepared by CEDI. ......................................................................................................28
Figure 3.5. Deconvolution of Br-/Pt=1, PTAOH as precursor on silica support. ..............28
Figure3.6.(a) XRD pattern, and (b) STEM image of 4.5 wt% Pt/SiO2 containing citrate
prepared by CEDI .......................................................................................................29
Figure3.7. Deconvolution of Cit3-/Pt=1, PTAOH as precursor on silica support. .............29
Page 13
xii
Figure3.8(a) XRD pattern, and (b) STEM image of 4.5 wt% Pt/SiO2 containing nitrate
prepared by CEDI. ......................................................................................................30
Figure3.9. Deconvolution of NO3-/Pt=1, PTAOH as precursor on silica support.. ...........31
Figure 3.10 (a) reduction of dried 4.5% Pt(NH3)4(OH)2 in 10% H2, (b) He flow over the
previously reduced sample, (c) Repeating previous step. ...........................................32
Figure 3.11 (a) Temperature-programmed desorption of ammonia(NH3-TPD) profile of
silica (SiO2). ................................................................................................................32
Figure 3.12. Mass - TPR on dried samples prepared by CEDI by looking at the evolved
NH3 (mass 15) during reduction, (a) Cl-/Pt=1, (b) Br-/Pt=1, (c) NO3-/Pt=1, and (d)
citrate3-/Pt=1 by comparing them to anion free sample. .............................................33
Figure 3.13. EXAFS: the fitting plot of (a) Pt(NH3)4(OH)2 + SiO2 (physical mixture), (b)
Na2PtCl4+SiO2 (physical mixture), (c) Pt(NH3)4(OH)2 / SiO2 (CEDI), and (d)
Pt(NH3)4(OH)2 + NaCl / SiO2 (CEDI), dashed line shows Pt-ligand bond length. .....35
Figure 3.14. Schematic mechanism of NH3 ligand exchange with Cl-. .............................36
Figure 4.1. XRD patterns for PTAOH and PTACl samples: (a) CEDI – prepared series of
PTAOH , (b) CEDI – prepared series of PTACl, (c) DI - prepared series of PTACl,
and (d) Cl- free samples from CEDI – prepared PTACl samples after wash with
soultion at pH 10.5. .....................................................................................................42
Figure 4.2. Peak fitting for (a) 0.25 ML, (b) 0.50 ML, (c) 1.0 ML, (d) 1.5 ML, and (e) 2.0
ML Pt from Pt(NH3)4(OH)2 on SiO2 prepared by CEDI ............................................43
Figure 4.3. Deconvolution of XRD peaks for (a) 0.25 ML, (b) 0.50 ML, (c) 1.0 ML, (d) 1.5
ML, and (e) 2.0 ML Pt from Pt(NH3)4Cl2 on SiO2 prepared by CEDI. ......................44
Figure 4.4. XRD peak deconvolution for (a) 0.25 ML, (b) 0.5 ML, (c) 1.0 ML, (d) 1.5 ML,
and (e) 2.0 ML from Pt(NH3)4Cl2 on SiO2 prepared by DI.. ......................................45
Figure 4.5. X-ray diffraction pattern with deconvolution for different coverages of Pt after
washing PTACl samples for (a) 0.5 ML, (b) 1.0 ML, (c) 1.5 ML, and (d) 2 ML.. ....47
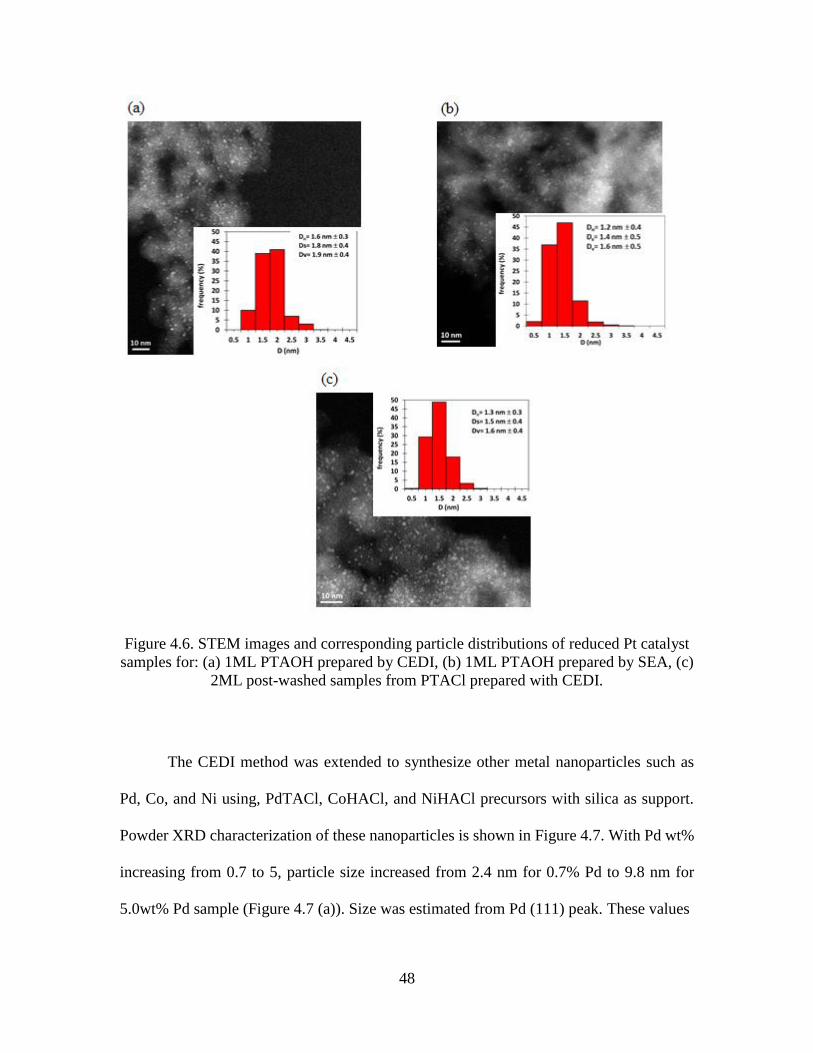
Figure 4.6. STEM images and corresponding particle distributions of reduced Pt catalyst
samples for: (a) 1ML PTAOH prepared by CEDI, (b) 1ML PTAOH prepared by SEA,
(c) 2ML post-washed samples from PTACl prepared with CEDI. .............................48
Figure 4.7. XRD patterns of silica supported catalysts, CEDI-prepared before wash and
after wash: (a,b) PdTACl, (c,d) CoHACl, (e,f) NiHACl. pH of solution was adjusted
at 10.5. .........................................................................................................................49
Page 14
xiii
Figure 4.8. Metal particle size before and after wash with the metal loss (%) for the silica
supported catalysts, CEDI-prepared: (a) Pd(PdTACl)/silica, (b)
Co(CoHACl)/silica,(c) Ni(NiHACl)/silic ...................................................................50
Figure 4.9. Peak fitting of (a) 0.5 ML, (b) 1.0 ML, (c) 1.5 ML, and (d) 2 ML Co from
CoHACl precursor on silica prepared by CEDI... ......................................................51
Figure 4.10. X-ray diffraction pattern with deconvolution for different coverages of Ni
from NiHACl precursor before wash (a) 0.5 ML, (b) 1.0 ML, (c) 1.5 ML, and (d) 2
ML...............................................................................................................................52
Figure 4.11. Metal particle size before and after wash with the metal loss (%) for the silica
supported catalysts, CEDI-prepared: (a) Pd(PdTACl)/silica, (b) Co(CoHACl)/silica,
(c) Ni(NiHACl)/silica..... ...........................................................................................54
Figure 4.12. XRD of 1 ML prepared by DI and CEDI for before and after wash of (a,b)
PTACl, (c,d) PdTACl (e,f) CoHACl, (g,h) NiHACl. pH of solution was 10.5.. .......55
Figure 5.1.The H2 uptake of the Ag-Ir bimetallic catalysts remained higher
than the Ir monometallic catalysts after the elevated annealing
temperatures of 600 and 800°C. .................................................................................70
Figure 5.2. Effect of annealing temperature on TOF for C3H8 formation on (a) 1% Ir, (b)
0.14% Ag-1% Ir, (c) 0.24% Ag-1% Ir, and (d) 0.47% Ag-1% Ir. ..............................71
Figure 5.3. Comparison of initial TOF's for Ir and Ag-Ir catalysts. ..................................72
Figure 5.4. H2-TPD for before and after reaction of (a,b) 1% Ir, (c,d) 0.14%Ag, (e,f) 0.24%
Ag, and (g,h) 0.47% Ag. .............................................................................................73
Figure 5.5. Effect of Ag coverage on selectivity of MCP isomerization at 10% C3H6, 50%
H2, bal He at 100 SCCM flow, 6mg cat diluted to 60 mg with δ,θ-Al2O3, Temp =
100 °C and P=1 atm. ...................................................................................................74
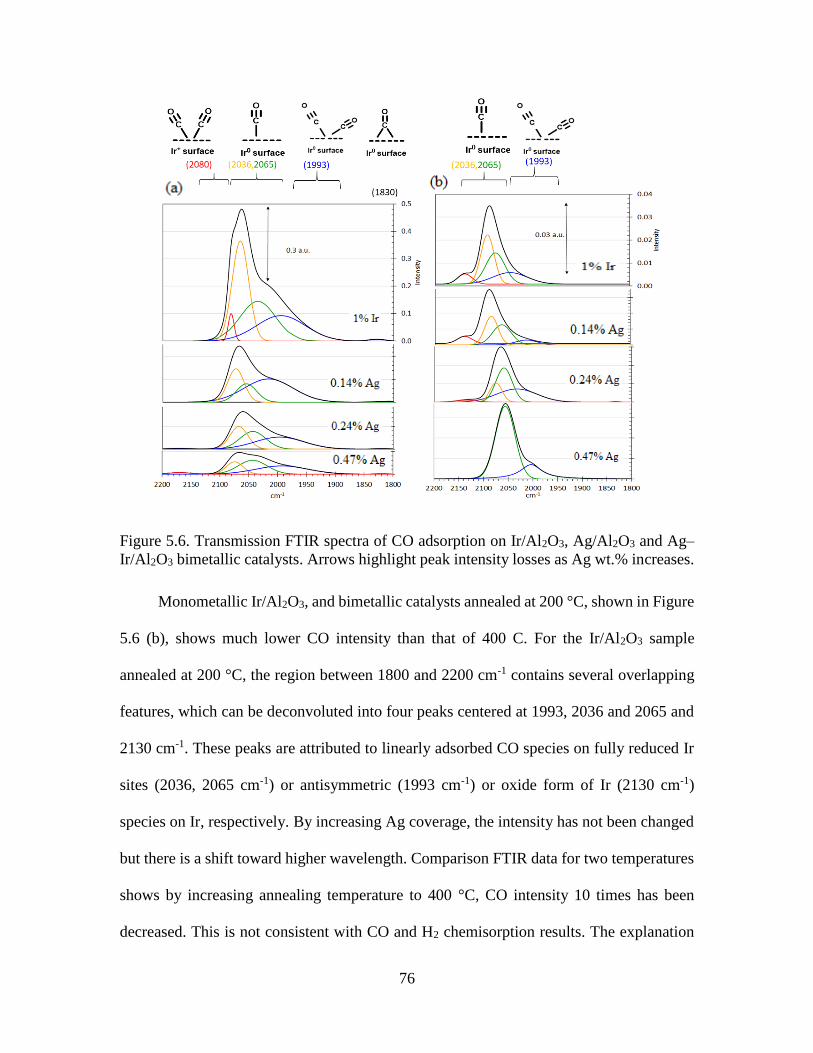
Figure 5.6.Transmission FTIR spectra of CO adsorption on Ir/Al2O3, Ag/Al2O3 and Ag
Ir/Al2O3 bimetallic catalysts. Arrows highlight peak intensity losses as Ag wt.%
increases. .....................................................................................................................76
Page 15
1
CHAPTER 1
INTRODUCTION AND LITERATURE REVIEW
INTRODUCTION
Supported metal catalysts play a vital role in many important chemical and energy
production which are highly favorable in environmental protection. The active component
of many catalysts is a supported noble metal such as platinum, palladium, or base metals
like Co, and Ni, and since only the surface of the metal is available to catalyze the reaction,
it is usually desirable to maximize the accessible metal surface area while decreasing the
amount used. For catalyst preparation, availability of surface sites of metal nanoparticle
catalysts is a critical aspect of its design, since overall activity of catalysts is largely
dependent on the number of active sites for molecular level reactions to occur on. For
supported nanoparticles, it is desired to expose the metals on the particle surface to decrease
the unused bulk nanoparticles. Therefore, smaller nanometals having a high ratio of surface
area to volume are preferred in catalyst preparation by maximizing utilization of the surface
nanoparticles. In chemical industry, metal particles are in the size of a few nanometers or
single atoms.
The ratio of exposed metal surface to the total number of metal atoms is defined as
dispersion which has a reciprocal relation with particle size. There are various techniques
to determine dispersion such as selective adsorption and measurement of an analyte gas or
titration of a gas chemisorbed on the surface of the metal. Based on chemisorption
Page 16
2
stoichiometry for each metal, the amount of available metal on the surface of the
nanoparticles can be calculated from the measured gas by chemisorption. X-ray diffraction
(XRD) and electron microscopy (EM) are other methods for determining dispersion. In
these methods the amount of metal on the surface of nanoparticles can be calculated by
assumption of particle geometry.
Controlling sizes, shapes and the prevention of aggregation are the most important
challenges for catalyst preparation during synthesis process. Also, activity, selectivity, and
lifetime of the supported catalysts mainly depends on preparation method 1. According to
these criteria, a varied number of methods have been developed beyond the oldest, most
common method of impregnation and show a better degree of control of the catalyst
dispersion 2. In particular, strong electrostatic adsorption (SEA) and charge-enhanced dry
impregnation (CEDI) methods have been recently used as simple techniques to prepare
catalysts with more control over particle size and size distributions. However, other various
methods for making both monometallic and bimetallic catalyst have been developed such
as impregnation 3, deposition-precipitation 4, and reduction-oxidation 5.
1.1.1 Impregnation Methods
Among the many methods to prepare supported metal catalysts, impregnation is the most
prevalent catalyst preparation method in industry. By adding an amount of the precursor
solution in excess of the pore volume of the support which gives a thin slurry, is called wet
impregnation (WI). In wet impregnation, during filtration of impregnated support, excess
liquid containing any precursor that was not retained by the support is filtered out. This
leads to one more step to recycle the excess liquid to minimize loss of the precursor.
Page 17
3
Dry or incipient wetness impregnation (DI) can be done by limiting the solution
amount to just fill the pore volume. In this method there is not strong metal-support
interaction and therefore leads to less homogenous metal deposition. However, this method
is known as simplest, quickest, and least expensive method of monometallic and bimetallic
nanoparticles preparation without loss of metals 6,7. Compared with Dry impregnation
method, WI requires longer time about several hours to reach equilibrium because diffusion
of metal precursor into pores in support is a slower process. Evaporation during water
removal can occur which causes precursor crystallization and metal precipitation and
wasting cause metal precursor. Due to lack of filtration step during DI synthesis of catalyst
any counterions from the metal precursor salt, such as the chloride from will be remained
in the dried catalyst. To remove these substances further processing is required. Figure 1.1
illustrates impregnation method for preparation of supported Pt catalysts.
Figure 1.1. Impregnation method to prepare supported platinum nanoparticles 8. Modified
from Chan, K. Y.; et al. J. Mater. Chem. 2004, 14(4), 505–516. Copyright 2004 Royal
Society of Chemistry.
There are two other methods for bimetallic catalysts synthesis beside “wet” and
“dry” impregnation: co-impregnation and successive impregnation. In co-impregnation
two or more metal precursors are simultaneously impregnated. In Successive impregnation,
first metal salt on a support is applied and then second metal on the monometallic catalyst
deposits by impregnation. In these methods like single metal analog pH is not controlled
Page 18
4
and there is not strong interaction between precursors and support. Due to the lack of this
interaction, mixing between two metal precursor components is usually poor. Since there
is no control on the deposition of second metal on the core metal, random distribution of
monometallic and bimetallic particles occurs which are usually large in size.
1.1.2 Precipitation-deposition
The deposition-precipitation (D-P) method involves a process in which highly
soluble metal salt precursor precipitate selectively on the support and not in solution 9.
Typically, this process involves addition of a precipitation agent, addition of a reducing
agent, or change in the concentration of a complexation agent or pH of the solution. Sodium
hydroxide 10 and urea 11,12 are the most commonly used agents for this preparation. There
are two main conditions to make sure of precipitation only on the support instead of in
solution: controlled amount of the metal precursor in the solution and stablishing strong
interaction between support and metal precursor. Generally, solubility limit decreases in
the presence of the support to favor deposition on the support, while this amount increases
in only solution. To prevent precipitation in the solution the concentration of the metal
precursor should be kept between the solubility point and the super solubility point. In this
method there is not strong control on metal distribution and surface composition which doesn’t
allow to synthesize true bimetallic catalysts with well controlled compositions13. Figure 1.2 shows
deposition precipitation method for synthesis of Pt–Au/CeO2 (RDP) catalyst.
Page 19
5
Figure 1.2. (A) A schematic of the deposition precipitation procedure for the synthesis of the Pt–
Au/CeO2 catalyst. (B) TEM images and EDX spectra of the Pt–Au/CeO2 catalyst, respectively14.
Modified from Hong, X.; et al. Catal. Sci. Technol. 2016, 6, 3606–3615. Copyright 2015Royal
Society of Chemistry.
1.1.3 Reductive Deposition
Liquid phase reduction method is one of the easiest procedures between various
procedures to prepare nanoparticles. In this method nanoparticles can be directly made by
various precursors soluble in a specific solvent15–18. To synthesize metal nanoparticles by
this method, metal precursors were dissolved in organic or aqueous solvent. Then reducing
agent was added to the solution and the reduction occurs which allows selectively
deposition of metal particles on supports. To reduce metal precursors usually thermal
decomposition at high-temperature or electrochemical routes are used. However, reducing
agents such as sodium borohydride, hydrazine, ethylene glycol, and ascorbic acid can also
be used in liquid phase for reduction of metal precursors. This method has some drawbacks
such as toxicity of reducing agents and need to provide additional electrochemical devices
Page 20
6
for electrochemical routes. Poor control on the size of resulting nanoparticles is another
disadvantage of this method. Figure 1.3 demonstrates preparation of silver nanoparticles
using coreduction procedure.
Figure 1.3. (A) A schematic of the procedure for silver nanoparticles synthesized using
coreduction approach. (B) FEG-TEM images of silver nanoparticles19. Based on Agnihotri, S.; et
al. RSC Adv. 2014, 4(8), 3974–3983. Open access publication.
1.1.4 Colloidal
Colloidal syntheses methods consist of three major steps: (1) solving metal
precursors and protective agent like surfactant in a solvent, (2) letting colloids to deposit
on the support, and (3) chemically reduction of the mixture20. To prepare colloidal metals
stabilizing agents determine the type of preparation phase to be aqueous or organic. Main
advantage of colloidal procedure is forming very small particles. However, the presence of
surfactant and protective agents in this method requires washing catalyst in an appropriate
solvent for several times or treat at high temperatures to decompose these extra materials.
Page 21
7
Thus, another method is preferred to use to make small metal nanoparticles in an easy way
without having difficulties of contamination due to protecting agents. Figure 1.4 illustrates
synthesis of supported Pt nanoparticles using colloidal method.
Figure 1.4. An illustration of the synthesis of the polyol method8.
1.1.5 Strong electrostatic adsorption (SEA)
Fundamental studies have been made in catalyst impregnation procedures. Brunelle
postulated in his work that the adsorption of noble metal complexes onto oxides supports
occurs due to electrostatically interaction21. Using concept of Brunelle’s work, a scientific
method, namely, strong electrostatic adsorption (SEA) was introduced to synthesize
heterogeneous metal nanoparticles with small particle size and tight size distribution3,22–26.
SEA is the same wet impregnation method with adjusted final pH in which the electrostatic
interaction is strongest. Figure 1.5 illustrates SEA mechanism occurs between support and
metal precursor.
Oxide and carbon surfaces terminate in hydroxyl groups and carboxylic acids can
be protonated or deprotonated by adjusting solution pH. In this way electrostatic
interaction can be established between the charged support and metal precursor of
Page 22
8
opposite charges. At pH below the PZC of support anion precursors adsorbs on a
protonated surface, while cationic metal precursors will adsorb on a deprotonated surface
at pH higher than PZC of support.
Figure 1.5. Steps of SEA mechanism: a) determination of PZC point of support by single point
method; b) metal precursor uptake to obtain optimal pH, c) adsorption of precursor on support
including hydration sheaths precursor at optimal pH.
Induction of this strong columbic force prevents metal migration during thermal
treatment, and therefore results in metal nanoparticles with smaller size. Using SEA
method, ultra-small metal nanoparticles (1-2 nm) with high dispersion have been
synthesized on a variety of oxide and carbon supports27–31.
According Figure 1.5, the pH of solution containing support is adjusted depending
on PZC of support to establish electrostatic interaction; for supports with low PZC such as
silica by increasing pH of solution, higher amount of metal cationic precursors is adsorbed
on the support. To determine optimal pH for maximum uptake of metal precursor uptake
Page 23
9
survey should be performed. Using ICP the amount of adsorbed metal precursor on support
in SEA process can be determined. Following formula shows the difference between initial
metal concentration, Ci, and final metal concentration, Cf, both in ppm unit. Surface loading
(SL) and Molecular weight (MWM) of metal precursor should be specified.
Metal uptake (μmoles/m2) = (Ci−Cf)[ppm]×1000 MWM
SL [𝑚2/liter]
Surface loading (SL) [𝑚2/𝑙𝑖𝑡𝑒𝑟] = Surface Area of support [𝑚2/g]×grams of support[g]
Volume of Precursor Solution[liter]
The metal uptake capacity is limited to numbers of hydration sheaths which gives
closed packed geometry of metal ion precursor (Figure 5.1c). Cationic metal precursor
retains two and anionic metal precursor retain one layer of hydration respectively. For
example, maximum adsorption capacity Pt(NH3)42+ and Pd(NH3)4
2+ precursors with two
hydration sheaths is ~0.84 mol/m2. However, for anionic precursors such as PtCl62- and
Ru(CN)64- with one hydration sheath the maximum uptake is around 1.6 mol/m2 28.
Adsorption capacity can be retarded at extreme pH values due to high ionic strength 27.
Therefore, using this method by induction strong electrostatic interaction between
precursor-support in a controlled manner small nanoparticle with tight size distribution can
be achieved.
1.1.6 Charge-enhanced dry impregnation (CEDI)
Due to lose metal using SEA method through filtration and limited amount of metal
loading, another method with the same concept has been introduced. Charge Enhanced Dry
Impregnation (CEDI) is the same incipient wetness impregnation method with controlled
Page 24
10
pH of precursor solution32. Therefore, impregnating solution is basified or acidified to
make a columbic force between the support surface and the oppositely charged metal
precursor but applied on dry impregnation method. Due to higher amount of support and
its buffering effect, the amount of acid or base required to overcome the PZC point is
significantly large 33,34. Pt particles synthesized over silica, alumina, and titania have sizes
< 1.5 nm (the XRD limit of detection is 1.5 nm) 35.
While in this method electrostatic interaction between the support surface and the
oppositely charged metal precursor give very small particles, study has shown that the
remaining residual balancing ions from the precursor play effective role on nanoparticle
sintering. For example, counter ion of metal precursor such as chloride or nitrate plays an
important role on final metal particle size and dispersity during the synthesis of catalysts
via CEDI 32.
Therefore, removing these counterions from prepared samples is required to
prevent metal nanoparticles sintering. By washing away chloride counter anion from dried
samples which contains noble or base metal gives very small particles with tight size
distribution 36. Simultaneous SEA or co-SEA can be used to make bimetallic catalysts or
sequential SEA to prepare core-shell structure37,38.
1.1.7 Electroless deposition (ED)
Electroless deposition (ED) is another route to synthesize core-shell bimetallic
catalysts. In this method a shell metal is deposited with different coverages on a core
supported metal. This method includes an aqueous bath with a predetermined right pH, a
Page 25
11
secondary metal precursor, and a reducing agent such as (Hydrazine (N2H4),
dimethylamine borane (DMAB), formaldehyde (HCHO), and hypophosphite (H2PO2-) 39.
For ED first monometallic core metal should be prepared with any monometallic
preparation method such as SEA, CEDI, or DI. Adjusting pH is required through ED
process to not let SEA occur on support. By this method second metal can exclusively
deposits on first metal core as a partial shell which offers the control over synthesis of true
bimetallic surfaces. ED can proceed catalytically or autocatalytically depending on the rate
of reaction. In the quick deposition there is the chance of deposition of metal over pre-
existing deposited metal as layers which is called autocatalytic. However, in slow reaction
rate with more control over deposition of second metal desired coverages of second metal
can be obtained which is called catalytic. Reducing agent in the solution phase is activated
only on the surface of metal particles. Thus, secondary metal can be deposited only onto
the base catalyst particles or pre-existing second metal. Several studies have been done to
synthesize various bimetallic catalysts using ED such as Cu−Pd 39, Ag−Pt40, Pt−Co41,
Au−Pd42, and Ag−Pd43. To successfully synthesize these bimetallic catalysts by ED
method, the base catalyst, secondary metal ion source, and reducing agent were carefully
determined and bath temperature, and pH were controlled. Ag-Ir bimetallic catalysts
prepared by ED method were evaluated in this study.
The objective of this work is to design, synthesis, and characterization of noble and
base monometallic and bimetallic catalysts using the rational catalyst synthesis methods
outlined earlier.
Page 26
12
CHAPTER 2
EXPERIMENTAL METHOD
CATALYSTS PREPARATION
The metal salts, oxide supports, and other chemicals used in this thesis are
summarized in Table 2.1.
Table 2.1. Summary of chemicals and materials
Commercial name Formular/abbr. Supplier
Tetraamineplatinum(II) hydroxide Pt(NH3)4(OH)2/PTAOH Sigma Chem Co.
Tetraamineplatinum(II) chloride Pt(NH3)4Cl2/PTACl Sigma Chem Co.
Tetraaminepalladium(II) chloride Pd(NH3)4Cl2/PdTACl Sigma Chem Co.
Hexaamminecobalt(III) chloride Co(NH3)6Cl3/CoHACl Sigma Chem Co.
HexaamminenickelIII) chloride Ni(NH3)6Cl3/CoHACl Sigma Chem Co.
Sodium chloride NaCl Fisher Scientific
Sodium bromide NaBr Fisher Scientific
Sodium citarte Na3Citrate Fisher Scientific
Sodium nitrate NaNO3 Fisher Scientific
Ammonium hydroxide NH4OH BDH, 5N
Sodium hydroxide NaOH Sigma-Aldrich
Aerosil 300 SiO2 Evonik
δ,θ- alumina Al2O3 Sasol
potassium hexachloroiridiate (II) K2IrCl6 Alfa Aesar
Hydrazine N2H4 Sigma-Aldrich
Page 27
13
Commercial powder supports were used as recieved. All chemicals including metal
precursors, acid/base solution to adjust pH are presented in the following table.
2.1.1 Catalyst synthesis by SEA
a) Determination of support PZC
Deionized water at 25 mL was added to one gram support in incipient wetness mode.
pH of the thick slurry was measured using a spear-tip pH meter.
b) Uptake surveys
Metal uptake-pH surveys were performed in 100-mL polypropylene bottles containing
55 mL of precursors with concentration of 200 ppm. Initial pH was adjusted in the range
of 2 to 13 by NH4OH for cationic metal precursors:PTACl, PdTACl, NiHA, and CoHA).
6 ml solution was taken out for determining initial concentration of metal using ICP
analysis (Cmetal,initial). Depending on desired surface loadings (500 or 1000 m2/L), amount
of supports were specified.
Solutions containing support and metal precursors were stirred on an orbital shaker for 1 h
to establish maximum adsorption. Solution pH values were measured using a standard pH
meter and 5 ML aliquot of solution was filtered for ICP analysis to determine final metal
concentration after adsorption on support (Cmetal,final). The metal surface density, Γ, can be
calculated with the following equation:
Page 28
14
Γ(μmol
L) =
(𝐶metal,initial−𝐶metal,final)(μmol
L)
SLm2
L
.
2.1.2 Catalysts by CEDI
Using maximum uptake determined from SEA, metal loadings for different
coverages were specified to prepare CEDI catalysts. pH of solution was adjusted based on
maximum uptake taken from SEA. 1 g of PTAOH was dissolved into 2.8 ml solution with
pH 11.5 using 1M NH4OH. Sodium chloride (NaCl), sodium bromide(NaBr), sodium
citrate(Na3Citrate), and sodium nitrate(NaNO3) were added into the solution to achieve
anion/metal atomic ratio of 1 in a centrifuge tube. After tapping tube well and thorough
mixing, the thick slurries were oven dried overnight to remove excess water. The dried and
crushed powder was then reduced for 1 hour in 20% H2/He at 250 oC at a ramp rate of 5
oC/min.
PTACl, PdTACl, NiHACl, and CoHACl catalysts were synthesized with CEDI
method on silica support. Metal loading and right pH were determined from maximum
uptake measured by SEA. All samples were dried in oven at 120 oC overnight except
PTACl which was dried under vacuum at room temperature overnight.
2.1.3 Catalysts by DI
Alumina supported Ir monometallic catalysts were prepared at 1% metal loading
by dry impregnation (DI) method. The K2IrCl6 precursor was dissolved into the quantity
of deionized water needed to just fill the pore volume of 1 grams of alumina support. The
thick slurry was dried overnight at room temperature in air and reduced in a flow of 20%
Page 29
15
H2/He at 400 oC for 1 hour. Ir particles sizes were below (<1.5 nm) which is the limit of
detection through XRD.
2.1.4 Ag-Ir/Al2O3 catalysts by ED
The DI prepared 1.0% Ir/Al2O3 was utilized as the core metal catalyst for ED.
Electroless Deposition (ED) was applied to the DI prepared Ir catalysts to synthesize Ag-
Ir bimetallic nanoparticles. The procedure was taken from earlier work which was done to
form bimetallic Ag-Ir catalysts structures by electroless deposition44. As the silver
precursor potassium silver cyanide, KAg(CN)2, and as the reducing agent hydrazine (N2H4)
were used. pH of ED bath was kept at 10 which was above the PZC of support, to prevent
any electrostatic adsorption of anionic Ag ion on the support.
CATALYST CHARACTERIZATION
2.2.1 pH probe meter
A standard pH electrode (Orion 3-star benchtop) was calibrated by 3-point
calibration using three pH buffer solutions (pH = 4.0, 7.0, 10.0) with standard deviation of
97% or higher. For determination of support PZC, pH of the thick slurry was measured by
a spear-tip pH meter from Fisher Scientific.
2.2.2 N2 physisorption (BET surface area)
To measure surface area of support BET measurements were performed by an
automated adsorption system (ASAP, 2100, Micromeritics). 0.1gram support was degassed
at 150 ºC, 10-3 Pa. After degassing step, the sample was charged in analysis port by N2 gas
at T=77 K with relative pressure ranging from 0~0.99. Specific surface area was measured
Page 30
16
using the linear relation between P/P0 and 1/ [v/ (P/P0-1)] with 8 points from P/P0 values
of 0-0.35. Surface area of silica and δ,θ-Al2O3 was measured to be 280 and 37 m2/g
respectively.
2.2.3 Inductively coupled plasma spectrophotometry (ICP-OES)
ICP-OES from PerkinElmer was used to measure metal concentration before and
after SEA or after washing samples. Metal loading on support was calculated from the
difference between initial and final concentration of metal in solution. For all metal
precursors used here, a 5ppm Y solution was used as internal standard for ICP analysis.
For optical alignment magnesium solution was used. Depending on the expected metal
amount in solution different concentrations of standard metal solutions were used for
calibration. To get accurate data each analysis was repeated 3x times using an auto-
sampler. Acceptable fit for calibration was chosen to be larger than 0.999. After calibration
a quality check (QC) was performed at medium concentration to make sure of accuracy of
calibration.
2.2.4 Temperature program reduction (TPR)
To determine reduction temperature of samples, TPR was carried on Micromeritics
AutoChem II 2920 using a thermal conductivity detector. Samples were first dried in He
flow at 100oC for 1 hour to remove any moisture in sample. 10% H2/He was used for TPR
analysis and TCD signals were recorded from 40oC to 500oC at a ramp rate of 5oC/min.
Page 31
17
2.2.5 X-ray diffraction (XRD)
XRD experiment was performed on a Rigaku Miniflex-II with a silica strip detector
(D/teX Ultra). Cu Kα radiation was used with λ = 1.5406 Å, at 15 kV and 30 mA. Patterns
were recorded in the range of 20°−80° 2θ, at a scan rate of 2.0° 2θ/min. Fityk software was
used to fit metal diffractions patterns using Gaussian to obtain FWHM values. Scherrer
equation was used to calculate metal particle sizes.
2.2.6 Pulse chemisorption
Micromeritics Autochem II 2920 instrument was used to run chemisorption
measurements. To do experiment, desired samples were reduced in situ in flowing H2 for
2 hrs at reduction temperature and then purged with flowing Ar for 30 min. Sample was
cooled to 40°C in Argon flow. After cooling catalyst was then contacted with 10% O2/bal.
helium for 30 min to form O-covered metal species. Ar for 30 min was flowed to remove
any residual physisorbed O2. Then sample was dosed in pulses of 10% H2/Ar at 4 min
intervals till all oxygen adsorbed on surface reacted with H2 to form H2O and metal−H
species. Each metal had one assumed stoichiometry. Cobalt and Nickel were not able to
chemisorb H2 or O2. Size of particle were determined from chemisorption by assumption
of hemispherical geometry.
2.2.7 Temperature programmed desorption (TPD)
ASAP 2920 was used to perform TCD- H2 TPD measurements. To run the
experiment each sample was reduced in situ with the flow of 10%H2/bal. Ar at 200 C for
2 hrs followed by flowing Ar at the same temperature for 2 hrs. After sample was cooled
down to room temperature H2 was flowed over sample to populate hydrogen on the
Page 32
18
particles surface. After saturating particles surface with hydrogen temperature ramping
started along with Ar flow. H2 desorption pattern was recorded by increasing temperature.
2.2.8 Scanning tunneling electron microscopy (STEM)
Z contrast images were obtained using an aberration-corrected JEOL 2100F
scanning transmission electron microscope (STEM) equipped with a 200Kv field emission
gun. High angle annular dark-field (HAADF) STEM images were acquired on a Fischione
Model 3000 HAADF detector with a camera length such that the inner cut-off angle of the
detector was 50 mrad. For each sample, approximately 500 particles were counted over all
images for determination of size distribution.
2.2.9 Fourier transform infrared spectroscopy (FTIR)
Nicolet Nexus 4700 spectrometer equipped with a mercury–cadmium–telluride B
(MCT-B) detector was used to perform in situ FTIR spectra. At room temperature FTIR
spectra were collected for each sample with 40 mg in single beam absorbance mode with
a resolution of 4 cm-1. The samples were reduced in 5% H2/bal. He for 1 h at 200 °C and
then cooled to room temperature. Background spectra were taken in Ar flow before Co
exposure. Sample was saturated with 1% CO and then was flushed with pure Ar for 20 min
to remove weakly bonded CO species and gas phase CO. Deconvolution of FTIR peaks
were done for all samples based on spectrum of 1% Ir/Al2O3 to obtain peak position, width,
eight, and area of overlapped peaks.
Page 33
19
CATALYSTS EVALUATION (PROPYLENE HYDROGENATION AND
METHYL CYCLOPENTANE HYDROGENOLYSIS)
The monometallic Ir/Al2O3 and the series of bimetallic Ag–Ir/Al2O3 were evaluated
for hydrogenation of propylene (C3H6) to propane (C3H8). Catalysts were placed in a single
pass, 0.19” ID tubular packed bed reactor (316 stainless steel). Reactor was loaded with
0.006 g of catalyst diluted by 0.054 g of the Al2O3 supported on glass wool in the middle
of the reactor. All samples were treated in situ at 200 °C in 10%H2/bal. He for 2 hrs; then
400 ◦C for 4 hrs and finally cool down to reaction temperature. To monitor the reaction
temperature a thermocouple was inserted into the catalyst bed. All catalysts were reduced
in situ at 200 ◦C in 10% H2/balance He for 2 h and then cooled to 100 ◦C to start the reaction.
All lines between the reactor outlet and the inlet of the GC were held at 120 °C to prevent
any condensation. Prior Using mass flow controllers for adjusting gas flows the reaction
feed stream were determined to be 10% C3H6, 50% H2, balance He at a total flow rate of
100 SCCM. To maintain differential conversion conditions, it was tried to keep the
conversion low for all set of reactions. An automated, on-line Hewlett-Packard 5890 Series
II gas chromatograph with flame ionization detection was used for analyzing both reaction
feed and products at every 1.0 h over the full length of the run. Due to transient behavior
for the first several hours on line all the reaction data reported here were based on stable
catalyst performance after 15 to 20 h on line.
The kinetic measurements for methyl cyclopentane hydrogenolysis/ hydrogenation
were studied using the same reactor system. To vaporize MCP from liquid phase, a vapor
liquid equilibrium (VLE) system was used. VLE was encased in a jacketed shell with liquid
inlet and exit ports at the bottom and top of the shell, respectively, which was connected to
Page 34
20
an ethylene glycol/H2O recirculation bath to maintain isothermal behavior to give
convenient MCP vapor pressure for reaction. Calibration for feed and all ring opening
products including 2-MP, 3-MP, C1-C4, and n-C6 were done separately.
Page 35
22
CHAPTER 3
SYNTHESIS OF SUPPORTED METAL PARTICLES OF CONTROLLED
SIZE
INTRODUCTION
Noble metal heterogeneous catalysts play an important role in the chemical
manufacturing, energy-related applications and environmental remediation36,45,46. In
heterogeneous catalysts, it is often desirable to have high metal dispersion (ultra-small
nanoparticle sizes) especially for expensive noble metals, so maximize the number of
active sites per mass of metal. Strong Electrostatic Adsorption (SEA) 3 and Charge
Enhanced Dry Impregnation (CEDI) 29 give much smaller particle size with very narrow
size distribution than the DI preparations in which agglomeration is likely caused by the
accumulation of metal in the solution phase during drying.
Metal particle size is an important parameter to be considered while designing a
rational catalyst for different reactions since particle size not only influences the activity
but also plays a crucial role in determining selectivity. It has been shown that catalysts
prepared by the SEA method have the highest catalytic activity for different reactions.
Klaigaew et al. used SEA method to make small Co/SF particles to get highest activity for
FTS reaction 47, and Zhang et al. synthesized Pd/CNTs particles around 1 nm by SEA to
increase specific activity value for Suzuki coupling reaction 48. Cao et al. 49 used CEDI to
Page 36
23
prepare Pd/Mo carbon supported bimetallics. Their results for the oxygen reduction
reaction indicated increased activity of the CEDI-prepared samples compared to DI-
prepared catalysts.
Several research groups have shown that the TOF in Fischer-Tropsch (FT) reaction
decreased for catalysts with cobalt particle sizes smaller than 10 nm 50. Karim et al.
indicated that NH3 decomposition activity over Ru/γ-Al2O3 increases with the particle size
larger than 7 nm51. Matthias Bauer et al showed that Pd/ CNT at larger nanoparticles (∼15
nm) were selective (88%) toward propene at full propylene conversion 52. Kumar et al.
used Pt-SBA-15, for dehydrogenation of propane and showed larger particles are more
selective for propene formation 53. Some other researches also indicated that activity and
selectivity was improved by increasing metal nanoparticle size 44,54. Therefore, ability to
tightly control the particle size with narrow distribution of supported metal catalysts is
extremely important.
This can be done with colloidal route which allows for better control of the
particle size with narrow size distribution. However, this method still has disadvantages
such as washing surfactant and protective agents in an appropriate solvent several times;
or use high temperatures in an inert environment to decompose or remove these foreign
compounds 55.
In a preliminary work, we showed that adding salt to charge enhanced electrostatic
adsorption (CEDI) preparations increased particle size in a controllable way, however, the
resulting size distributions were wide32. In the current work, we undertook a broader study
of salt addition to investigate the mechanism of size control and to produce larger sized
Page 37
24
particles with tighter size distributions. XRD and STEM gave consistent results, halides
had greatest effect, nitrate and citrate least effect.
MATERIAL AND METHODS
3.2.1 Catalyst preparation
As supports, SiO2 Aerosil 300 was used as received. PZC, BET surface area and
pore volume of the support were 3.5, 280 m2/g and 2.8 ml/g respectively.
Tetraammineplatinum(II) hydroxide (PTAOH), purchased from Sigma Aldrich, were used
as precursors without any purification. All samples were prepared by the method of Charge
Enhanced Dry Impregnation (CEDI) with optimal initial and final pH values as reported in
previous work 35. PTAOH was dissolved into NH4OH solution at an initial pH of 11.5,
which resulted, after 2.8 ml of the solution had been contacted with 1 g of the silica support,
in a final pH of 10.0. The amount of metal precursor placed in solution corresponds to the
amount able to be adsorbed on the respective surface by electrostatic adsorption, or about
0.86 micromoles/m2 (4.5wt%) for amorphous silica56. Sodium chloride (NaCl), sodium
bromide (NaBr), sodium nitrate (NaNO3), and sodium citrate (Na3C6H5O7) were added into
the solution to achieve anion/Pt atomic ratio of 1. The thick slurry/paste were oven dried
at 100 ◦C overnight to evaporate excess water. The dried powder was then reduced for 1 h
in 10% H2/He at the optimal temperature of 250 °C determined by temperature
programmed reduction (TPR), with a 5◦C/min ramp rate.
Page 38
25
3.2.2 Catalyst characterization
Powder XRD analysis was performed using a Rigaku Miniflex-II system with a
silica strip detector (D/teX Ultra) with Cu Kα radiation (λ = 1.5406 Å), operated at tube
voltage of 15 kV and a current of 30 mA. Scans were made in the 30°−80° 2θ range with
a scan rate of 2.0° 2θ/min. Pt particle sizes were calculated by Scherrer equation using the
FWHM value obtained from Gaussian fitting.
Temperature programmed reduction was performed on a custom TPx System fitted
with an Inficon Transpector 2 Mass Spectrometer. 100 mg of dried sample was loaded in
a tubular TPx cell (6 mm, Pyrex) with an expanded bulb space fitted with a fritted glass
disc for holding powder samples. No pretreatment was done before reduction. The TPR
analysis was proceeded with 10% H2/ balance with a ramp rate of 5 °C/min. While the
spectra from 1 to 50 amu were recorded, the signals for ammonia was primarily monitored.
Z-contrast STEM imaging for particle size determination in the materials was
conducted with a JEOL JEM-2100F HRTEM with CEOSGmbH hexapole STEM probe
corrector. Approximately 500 particles were counted to determine averaged particle sizes
(volume averaged Dv, surface averaged Ds and number averaged particle size Dn).
Extended X-ray absorption fine structure (EXAFS) experiment was performed at
Stanford Synchrotron Radiation Lightsource (California, USA). The X-ray was
monochromated by a double Si (111) crystal. The samples were pressed into pellets and
mounted on the sample stage. The X-ray absorption signal was measured by a Ge 13-
channel detector under fluorescence model. The absorption spectrum of the Pt metal foil
reference was also collected and utilized as the energy calibration reference. The XAS data
Page 39
26
files were analyzed and fitted using the Demeter software package. The amplitude factor
S02 was obtained by fitting the reference spectrum with full coordination in the 1st shell
and used in subsequent data fitting wherein the coordination number, bond length and the
Debye Waller factor were the fitted variables. The fitted k range was 3~12 Å-1 and the
fitted R range was 1~4Å.
RESULTS AND DISCUSSION
A 4.5 wt% Pt/SiO2 was made by CEDI using pH-adjusted PTAOH solution. XRD
characterization and STEM image of this sample is shown in Figure 3.1. Pt particle size
determined form XRD (Figure 3.1a) was 1.2 nm which agrees reasonably well with the
STEM volume size average (Figure 3.1b). The broad Pt3O4 (210) peak appearing in the
XRD pattern of Pt/SiO2 samples is due to spontaneous oxidation of small Pt nanoparticles
in ambient57.
Figure 3.1. (a) XRD profile and b) STEM image and particle size distribution of 4.5
wt % Pt/SiO2 (PTAOH) prepared by CEDI.
Page 40
27
NaCl was added to the sample with the atomic ratio of Cl-/Pt=1 prepared by the
same procedure. XRD pattern of the reduced material is shown in Figure 3.2. With addition
of residual ion, Pt diffraction peaks became discernable. In Figure 3.2a Pt particle size
increased from 1.2 nm for the Cl- free control to 4.5 nm for the Cl- sample. STEM
characterization of the chloride containing silica supported sample supports the wider
distribution as well as the particle size trend (Figure 3.2b). Remaining NaCl in sample was
detected in the XRD pattern.
Figure 3.2. (a) XRD pattern, and (b) STEM image of 4.5 wt% Pt/SiO2 containing chloride
prepared by CEDI.
Pt (111) peak fitting in Figure 3.3 suggests that in the presence of chloride the particles
have bimodal size distribution.
NaCl was replaced by NaBr with the atomic ratio of Br-/Pt=1 in the pH-adjusted
PTAOH solution prepared by the same CEDI method. The XRD pattern and STEM image
of the reduced particles are shown in Figure 3.4. Pt particle size increased from 1.2 nm for
the Br- free control to 6.5 nm for the Br- sample shown in Figure 3.4a (deconvolution in
Figure 3.5).
Page 41
28
Figure 3.3. Deconvolution of Cl-/Pt=1, PTAOH as precursor on silica support.
Figure 3.4. (a) XRD pattern, and (b) STEM image of 4.5 wt% Pt/SiO2 containing
bromide prepared by CEDI.
With the addition of bromide, not only is the average size larger, but the size distribution
is much broader (Figure 3.4b). The effect of bromide was stronger than that of chloride on
growth of particles and their polydispersity.
The presence of Cl-or Br-at the adsorption layer might reduce the strength of the precursor-
support interaction by locally increasing ionic strength. Therefore, anion of Citarte3- with
higher negative charge was chosen to see if higher ionic strength with much larger particles
will be obtained. Here, Na3Citarate was added to the solution with the atomic ratio of
Page 42
29
Citrate3-/Pt=1 and catalysts sample was prepared by the same procedure. X-ray diffraction
peak and STEM image with size distribution analysis of the reduced sample.
Figure 3.5. Deconvolution of Br-/Pt=1, PTAOH as precursor on silica support.
Figure 3.6. (a) XRD pattern, and (b) STEM image of 4.5 wt% Pt/SiO2 containing citrate
prepared by CEDI.
is shown in Figure 3.6. As shown in Figure 3.6a Pt particle was estimated around 1.6 nm
with the appearance of Pt3O4 of 0.9 nm with peak fitting shown in figure 3.7. STEM image
Page 43
30
Figure 3.7. Deconvolution of Cit3-/Pt=1, PTAOH as precursor on silica support.
of the sample in Figure 3.6b shows relatively tight size distribution compared to chloride
and bromide samples. This indicates that increasing ionic strength is not the main reason
for sintering of nanoparticles containing chloride or bromide.
CEDI method was extended to synthesize Pt nanoparticles using NaNO3. Silica
supported Pt particles was made using pH-adjusted PTAOH solution for NO3-/Pt=1. XRD
characterization of the sample is shown in Figure 3.8a.
Figure 3.8. (a) XRD pattern, and (b) STEM image of 4.5 wt% Pt/SiO2 containing nitrate
prepared by CEDI.
Pt particles are small around 2.3 nm with broad Pt3O4 peak. STEM analysis on the sample
was performed to gauge the effect of nitrate on particle size and on breadth of size
Page 44
31
distribution. Representative STEM Z-contrast image and particle size distribution is shown
in Figure 3.8 b. The small average size of the NO3- sample with tight size distribution was
confirmed. XRD deconvolution for this sample is shown in Figure 3.9.
Figure 3.9. Deconvolution of NO3-/Pt=1, PTAOH as precursor on silica support.
To explore the number of species in the anion added samples mass-temperature
programmed reduction (Mass-TPR) was performed. Since ammonia is the indictor of
decomposition of the metal precursor during reduction, only evolution of NH3 was
evaluated. Prior to NH3-TPD experiments, the physically adsorbed moisture was desorbed
from the sample with He flow (25 mL/min) at 25 °C for 30 min. Figure 3.10.a shows the
temperature-programmed desorption of ammonia (NH3-TPD) profiles of Pt/SiO2
(PTAOH) catalyst. Reduction of the silica supported Pt precursor shows two peaks
centered at 240 and 400 °C. The first peak around 240 °C belongs to decomposition of
PTAOH during reduction. To investigate the source of second peak, the temperature-
programmed desorption of ammonia (NH3-TPD) of SiO2 was done in 10%H2/bal He. SiO2
support showed only one peak corresponding to weak acidic sites with Tmax at 220 °C
Page 45
32
(shown in Figure 3.11) 58–61. Therefore, the second peak at the temperature of 400 °C was
assigned to reverse spillover of adsorbed ammonia on reduced Pt. Figure 3.10(b,c) shows
NH3 TPD of the reduced sample for successive TPD experiments in which second peak
disappeared after second TPD.
Figure 3.10. (a) reduction of dried 4.5% Pt(NH3)4(OH)2 in 10% H2, (b) He flow over the
previously reduced sample, (c) Repeating previous step.
Figure 3.11. Temperature-programmed desorption of ammonia(NH3-TPD) profile of
silica (SiO2).
Page 46
33
Figure 3.12 shows the temperature-programmed desorption of ammonia (NH3-
TPD) profiles of NaCl, NaBr, Na3Citrate, and NaNO3 samples. On NH3-TPD curve of
applied chloride, and bromide in Figure 3. 12 a, and b multiple desorption peaks of
ammonia centered at 170, 230, 350, and 450°C were observed. The low temperature peaks
of 170, and 230°C belong to reduction of two different precursor species. The high
temperature peaks were assigned to reverse spillover of NH3 from reduced Pt to silica.
Figure 3.12 c, and d for nitrate and citrate samples show only desorption peaks similar to
anion free sample. First peak corresponds to decomposition of precursor at 230 °C and
second peak belongs to reverse spillover of ammonia from Pt to silica at temperature of
400 °C. Basolo62 using Grinbergs polarization theory showed that the metal(Pt)- ligand
Figure 3.12. Mass - TPR on dried samples prepared by CEDI by looking at the evolved
NH3 (mass 15) during reduction, (a) Cl-/Pt=1, (b) Br-/Pt=1, (c) NO3-/Pt=1, and (d)
citrate3-/Pt=1 by comparing them to anion free sample.
Page 47
34
(NH3) bond strength can get weaker by polarization of Pt (II) by Cl- anion. In this way
NH3 group can be easily replaced by Cl-. The ligand exchange of the 5 wt.% Pt/SiO2
material prepared by CEDI was estimated using the Pt–ligand coordination number
obtained from EXAFS. Pt(NH3)4(OH)2 + SiO2 (physical mixture) as sample 1 and
Na2PtCl4+SiO2 (3.5% Cl physical mixture) as sample 2 were used as reference to get
amplitude of Pt-N and Pt-Cl, respectively. Coordination number of Pt-N in sample 1 and
Pt-Cl in sample 2 were both fixed as 4, due to their square planar structure. Both Pt-N and
Pt-Cl bond were used for the fitting of Pt(NH3)4(OH)2/SiO2 (CEDI) as sample 3 and
Pt(NH3)4(OH)2 + NaCl / SiO2 (1.8wt% Cl, CEDI) as sample 4, so that sample 3 can be seen
as reference compared with sample 4. SO2 of fitting of sample 3 and sample 4 were set as
0.0025. Coordination numbers obtained from EXAFS for the dried samples is given in
Table 3.1.
Table 3.1. EXAFS fitting data for Pt samples on SiO2.
Sample
# Pathway CN s.s
1 Pt(NH3)4(OH)2+SiO2(Physical mix) Pt-N 4a 0.0043
2 Na2PtCl4+SiO2 (Physical mix) Pt-Cl 4a 0.0035
3
Pt(NH3)4(OH)2+SiO2 (CEDI) Pt-N 4.3±0.241
0.0025b
Pt-Cl 0.1±0.157
4 Pt(NH3)4(OH)2+NaCl+ SiO2(CEDI) Pt-N 3.5±0.262
0.0025b
Pt-Cl 1.1±0.276 Note: a. coordination number was constrained at 4; b. ss was constrained at 0.0025.
Amplitude of sample 1 and sample 2 were 0.846 and 0.923 respectively. Amplitude
of sample 3 and sample 4 used the amplitude gained from sample1 and sample 2. Fourier
Page 48
35
transforms of the EXAFS spectra of the samples are shown in Figure 3.9. According to
Figure 3.13 and Table 3.1., it's clear that Pt-Cl coordination for (sample#2) shows a peak
larger than Pt-N coordination (sample #1). In the sample#4 which is Pt(NH3)4(OH)2 +
NaCl, we can find a component at ~1.9 °A, which could be assigned to Pt-Cl coordination.
Figure 3.13. EXAFS: the fitting plot of (a) Pt(NH3)4(OH)2 + SiO2 (physical mixture), (b)
Na2PtCl4+SiO2 (physical mixture), (c) Pt(NH3)4(OH)2 / SiO2 (CEDI), and (d)
Pt(NH3)4(OH)2 + NaCl / SiO2 (CEDI), dashed line shows Pt-ligand bond length.
According to Figure 3.13 and Table 3.1., it's clear that Pt-Cl coordination for
(sample#2) shows a peak larger than Pt-N coordination (sample #1). In the sample#4 which
Page 49
36
is Pt(NH3)4(OH)2 + NaCl, we can find a component at ~1.9 °A, which could be assigned
to Pt-Cl coordination. Apparently, ligand exchange between NH3 and Cl- occurs according
to mechanism shown in Figure 3.14. After ligand exchange the overall charge of Pt
precursor decreases from 2+ to 1+. Therefore, the interaction of precursor with support is
not that strong anymore and that gives rise to sintering and wide distribution of metal sizes.
Figure 3.14. Schematic mechanism of NH3 ligand exchange with Cl-.
CONCLUSION
XRD results shows increasing particle size for all the anions, especially Br- and Cl.
STEM images show that accompanying the larger average size is a wider particle size
distribution. This is related to different metal precursor species formed during the
impregnation and drying. This hypothesis is consistent with the evolved NH3 mass at
different temperatures during reduction which suggests multiple adsorbed Pt species in
presence of anions like Pt(NH3)3Cl or Pt(NH3)3Br.
Page 50
37
CHAPTER 4
NANOPARTICLE SYNTHESIS VIA ELECTROSTATIC ADSORPTION
USING INCIPIENT WETNESS IMPREGNATION
INTRODUCTION
Supported metal catalysts for the production of fuels, commodity and specialty
chemicals, and pharmaceutical drugs, as well as for energy production and pollution
abatement, underpin the global economy and continually upgrade the world’s standard of
living. In many applications it is desirable to synthesize the smallest possible metal
particles on the catalyst support so as to maximize the number of active sites per mass of
metal. The predominant method of synthesizing metal particles on oxide and carbon
supports is incipient wetness impregnation (or pore filling or dry impregnation) in which
the pore volume of a catalyst support is just filled with a solution containing the desired
amount of metal precursor63. The thick paste is dried and pretreated in oxygen (air) and/or
hydrogen to remove the ligands and reduce the metal to its active, zero valent state. While
this method is simple and cheap, the problem with dry impregnation is that the resultant
metal particles are relatively large with wide particle size distributions55. This is due, in
most cases, to a lack of interaction between the metal precursor and the support surface,
such that metal precursors agglomerate in the liquid phase during drying 36. The resulting
metal utilization is relatively poor. A recent review of Pt nanoparticle preparation on silica,
Page 51
38
aluimina, titania, and carbon supports in1500 papers from the catalysis literature the past
three years revealed that the average particle size from impregnation was 10 nm, with
average particle size distributions as large or larger than the particle size itself 55.
Based on the hypothesis that well dispersed metal nanoparticles require a well-dispersed
metal precursor, and starting from the pioneering work of Brunelle 21 and Schwarz 64,
we have developed the method of Strong Electrostatic Adsorption (SEA) 56,65,66 in which
coulombic metal precursor-support interactions are induced between a charged surface and
an oppositely charged metal precursor complex. This is achieved by controlling the final
pH of the impregnating solution relative to the point of zero charge (PZC) of the support;
values above the PZC of an acidic support like silica (PZC = 4) the surface hydroxyl groups
are deprotonated, the surface is negatively charged, and cationic complexes such as metal
ammines are strongly adsorbed. For a higher PZC support such as alumina (PZC = 8), at
acidic pHs the surface hydroxyl groups are protonated and positively charged, and anionic
precursors such as metal chloride complexes are electrostatically adsorbed. A recent
review of Pt nanoparticle preparation on silica, aluimina, titania, and carbon supports
in1500 papers from the catalysis literature the past three years revealed that the average
particle size from impregnation was 10 nm, with average particle size distributions as large
or larger than the particle size itself, while for SEA the average particle size was 1.8 nm
with standard deviation typically about 25% of the particle size55.
In the laboratory, SEA is normally employed with a great excess of solution for
experimental convenience; thin slurries minimize pH shifts and make sampling of the
liquid metal concentration easier. In large scale catalyst synthesis, however, the use of thin
slurries necessitates an additional filtration step, and any excess metal is lost in the filtrate.
Page 52
39
There is no reason in principle why electrostatic attraction cannot be induced in the thick
slurries employed in dry impregnation; our preliminary work with platinum over silica,
aluimina, and carbon supports has shown that a simple modification of the dry
impregnation recipe – adding enough acid or base to charge up the support surface – results
in a drastic reduction of nanoparticle size29. We have termed this method “Charge
Enhanced Dry Impregnation” (CEDI). In the present work, we first extend CEDI to other
noble and base metals (Pt, Pd, Co, and Ni) over a silica support. We additionally refine
the method to show that the counterions (balancing salts such as chloride from platinum
tetraammine chloride, (NH3)4PtCl2) can be removed by washing. If left in the CEDI slurry,
chloride leads to larger particles 32. The removal of chloride counterions by washing
renders small particle size.
MATERIAL AND METHODS
4.2.1 Catalyst preparation
Tetraammineplatinum(II) hydroxide (PTAOH), Tetraammineplatinum(II) chloride
(PTACl), Tetraamminepalladium(II) chloride (PdTACl), Hexamminecobalt(III) chloride
(CoHACl), and Hexaamminenickel(II) chloride (NiHACl), purchased from Sigma Aldrich,
were used as precursors without any purification. As support, SiO2 Aerosil 300 was used
as received. The PZC, BET surface area, and water accessible pore volume of the support
were 3.5, 280 m2/g, and 2.8 ml/g respectively. A spear tip pH probe was used for pH
measurements at incipient wetness.
All samples were prepared by the CEDI method with optimal initial and final pH
values as reported in previous work 35: each precursor was dissolved into NH4OH solution
Page 53
40
at an initial pH of 11.5, which resulted, after 2.8 ml of the solution had been contacted with
1 g of the silica support, in a final pH of 10.0. The amount of metal precursors placed in
solution was calculated relative to one monolayer of those precursors as determined from
previous work. A monolayer of PTAOH, PTACl, PdTACl, NiHACl and CoHACl
respectively are 0.86 micromoles/m2 (4.5wt%), 0.80 micromoles/m2 (4.2 wt%)56, 0.90
micromoles/m2 (2.5 wt%), 1.4 micromoles/m2 (2.2 wt%), and 1.3 micromoles/m2 (2.1
wt%) 23. These values correspond to a close-packed layer of precursors retaining one or
two hydration sheaths55. For each metal, precursor concentrations were employed to give
metal loadings of 0.25, 0.5, 1.0, 1.5 and 2.0 monolayers.
After impregnation all samples except PTACl were dried in ambient air at 120 °C
overnight. The PTACl/silica samples were dried overnight under vacuum at room
temperature since Pt(NH3)4Cl2 precursor decomposes to a neutral Pt(NH3)2O species when
drying at 120°C or more 67. This species could be easily filtered out during washing step
which causes more than 70% Pt loss regardless of the initial metal coverage. The dried
samples were reduced for 1 h in 10% H2/He with the ramp rate of 5°C/min at the reduction
temperatures determined by temperature programmed reduction (TPR). The reduction
temperatures were based on the minimum reduction temperatures from TPR studies of
PTAOH, PTACl, PdTACl, NiHACl and CoHACl were 250 °C, 300 °C, 200 °C, 500 °C
and 450 °C, respectively23,29,56.
A set of samples was prepared with residual chloride removed. To do so, the CEDI-
derived dried, unreduced samples were re-ground to a fine powder and washed using a
dilute NH4OH solution (300 mL/g catalyst) with the pH=10.5 so that the final pH after
Page 54
41
sample addition was at or close to the final pH of adsorption. The sample and wash solution
were agitated for 10 minutes by means of an orbital shaker, at a rate of 120 rpm. After the
washing, a 5cc aliquot was taken for metal loss analysis by ICP. The post-wash sample
was filtered, dried and reduced at the same condition as for the unwashed samples. An
additional series of samples was washed immediately after the impregnation, that is,
without the drying step.
4.2.2 Catalyst characterization
Powder XRD analysis was performed on a Rigaku Miniflex-II equipped with a
silicon strip detector (D/teX Ultra) and Cu Kα radiation (λ = 1.5406 Å) source, operated at
15 kV and 30 mA. Scans were made in the 2θ range of 30°−80°, with a scan rate of 2.0°
2θ/min; metal diffraction patterns were deconvoluted using Gaussian function to achieve
FWHM values. Average particle sizes were calculated using the Scherrer equation.
The weight percentages of metal for each catalyst were determined by measuring
liquid concentrations of metal in the impregnating solution and the washing solution by the
inductively coupled plasma-optical emission spectroscopy (ICP-OES) with a Perkin Elmer
Optima 2100DV.
Z contrast images were obtained using an aberration-corrected JEOL 2100F
scanning transmission electron microscope (STEM) equipped with a 200Kv field emission
gun. High angle annular dark-field (HAADF) STEM images were acquired on a Fischione
Model 3000 HAADF detector with a camera length such that the inner cut-off angle of the
detector was 50 mrad.
Page 55
42
RESULTS AND DISCUSSION
A series of silica supported Pt nanoparticles were initially synthesized by CEDI
from the Cl- free precursor, PTAOH. Powder XRD characterization of these samples is
shown in Figure 4.1. Samples were prepared at coverages of 0.25 (1.1%), 0.5 (2.3%), 1
(4.5%), 1.5 (6.8%), and 2 (9.0%) monolayers. The resulting size of Pt phase after reduction
and exposure to ambient air was estimated from the deconvoluted Pt (111) and Pt3O4 (210)
peaks. These are shown in Figure 4.2.
Figure 4.1. XRD patterns for PTAOH and PTACl samples: (a) CEDI – prepared series
of PTAOH, (b) CEDI – prepared series of PTACl, (c) DI - prepared series of PTACl,
and (d) Cl- free samples from CEDI – prepared PTACl samples after wash with solution
at pH 10.5.
Page 56
43
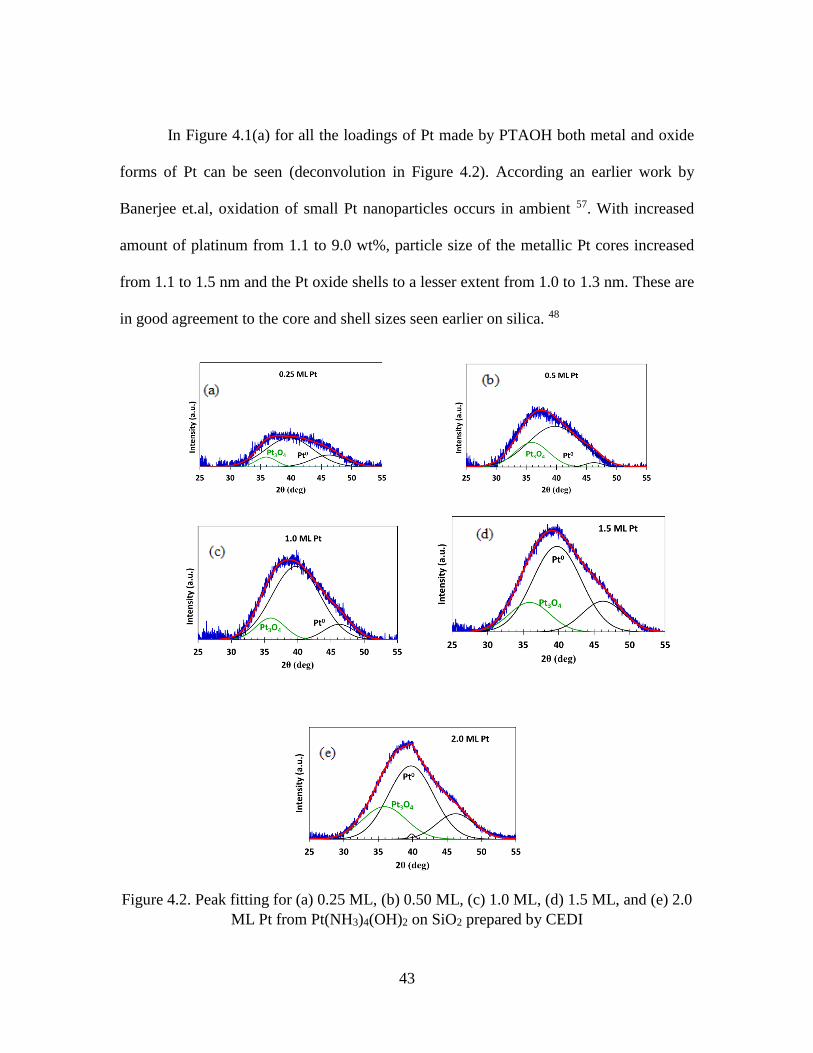
In Figure 4.1(a) for all the loadings of Pt made by PTAOH both metal and oxide
forms of Pt can be seen (deconvolution in Figure 4.2). According an earlier work by
Banerjee et.al, oxidation of small Pt nanoparticles occurs in ambient 57. With increased
amount of platinum from 1.1 to 9.0 wt%, particle size of the metallic Pt cores increased
from 1.1 to 1.5 nm and the Pt oxide shells to a lesser extent from 1.0 to 1.3 nm. These are
in good agreement to the core and shell sizes seen earlier on silica. 48
Figure 4.2. Peak fitting for (a) 0.25 ML, (b) 0.50 ML, (c) 1.0 ML, (d) 1.5 ML, and (e) 2.0
ML Pt from Pt(NH3)4(OH)2 on SiO2 prepared by CEDI
Page 57
44
In a parallel series of experiments, Pt samples were prepared by CEDI from PTACl.
XRD patterns of these samples are shown in Figure 4.1(b) and deconvolutions of them are
given in Figure 4.3. With increased wt loading of Pt, diffraction peaks became sharper.
Figure 4.3. Deconvolution of XRD peaks for (a) 0.25 ML, (b) 0.50 ML, (c) 1.0 ML, (d) 1.5 ML,
and (e) 2.0 ML Pt from Pt(NH3)4Cl2 on SiO2 prepared by CEDI.
The deconvolutions in Figure 4.3 shows that particles have bimodal size distribution for all
coverages 1.0 ML and above. To compare the effect of adjusting pH on particle size in
CEDI with no pH adjustment, a third series of PTACl samples was prepared by DI. The
XRD patterns of these reduced materials are shown in Figure 4.1 (c) and the deconvolutions
are shown in Figure 4.4. At equivalent metal loadings, the Pt nanoparticles made by DI are
Page 58
45
larger than particles made by CEDI. The DI particles have a bimodal size distribution at
low Pt weight loading of 0.25ML.
Figure 4.4 XRD peak deconvolution for (a) 0.25 ML, (b) 0.5 ML, (c) 1.0 ML, (d) 1.5 ML, and
(e) 2.0 ML from Pt(NH3)4Cl2 on SiO2 prepared by DI.
.
Page 59
46
Zhu et al. prepared nanoparticles at 2wt% Pt/SiO2 using PTACl by CEDI, and DI
methods. They reported particle sizes of <3 nm and 7.9 nm, respectively29. From our XRD
results, it can be estimated that at Pt weight loading around 2.1 wt%, CEDI and DI gave
particle sizes of 4.9 and 7.8 nm, respectively. The slight difference in CEDI results is from
difference in surface density. In their work surface density was around 0.3 µmole/m2 which
is lower than ours around 0.4 µmole/m2. It also can be related to sensitivity of XRD
instrument. These results show that basifying the precursor solution gives rise to
electrostatic interaction between precursor and support which results in small particles after
pretreatment. However, the addition of more metal to the solution in the form of a PTACl
precursor may also increase the concentration of counterions (e.g. Cl-) associated with the
complex35. This will increase the ionic strength of the solution for thicker slurries such as
CEDI and DI methods and increase particle size.
Therefore, it is expected that particle size can be lowered by eliminating the residual
chloride by washing the PTACl samples after impregnation. To do this, dried and
unreduced PTACl samples prepared by CEDI were washed using ammonium hydroxide
solution at pH=10.5. XRD patterns of the post washed and reduced samples revealed very
small particles (<1nm); Figure 4.1 (d) and deconvolutions are shown in Figure 4.5. The
broad Pt3O4 (201) peak appearing in the XRD patterns of these samples is again due to
spontaneous oxidation of very small Pt nanoparticles. It is notable that the XRD peaks are
even broader (the nanoparticles are even smaller) for the PTACl CEDI/washed samples in
Figure 4.1c than the corresponding PTAOH CEDI samples in Figure 4.1a.
Page 60
47
Figure 4.5. X-ray diffraction pattern with deconvolution for different coverages of Pt
after washing PTACl samples for (a) 0.5 ML, (b) 1.0 ML, (c) 1.5 ML, and (d) 2 ML
To corroborate the size distribution of particles for the chloride free samples, STEM
characterization of these samples with the coverage of 1 ML was done. STEM image in
Figure 4. 6(a) shows tight size distribution for nanoparticles made from PTAOH precursor
by CEDI. PTAOH samples prepared by SEA also gives very small particles with tight size
distribution, Figure 4.6(b). Removing chloride from sample during washing step results in
small particle with the tight size distribution, shown in Figure 4.6(c). All STEM images for
these three chloride free samples support the tight size distribution which agrees reasonably
well with the XRD estimates.
Page 61
48
Figure 4.6. STEM images and corresponding particle distributions of reduced Pt catalyst
samples for: (a) 1ML PTAOH prepared by CEDI, (b) 1ML PTAOH prepared by SEA, (c)
2ML post-washed samples from PTACl prepared with CEDI.
The CEDI method was extended to synthesize other metal nanoparticles such as
Pd, Co, and Ni using, PdTACl, CoHACl, and NiHACl precursors with silica as support.
Powder XRD characterization of these nanoparticles is shown in Figure 4.7. With Pd wt%
increasing from 0.7 to 5, particle size increased from 2.4 nm for 0.7% Pd to 9.8 nm for
5.0wt% Pd sample (Figure 4.7 (a)). Size was estimated from Pd (111) peak. These values
Page 62
49
Figure 4.7. XRD patterns of silica supported catalysts, CEDI-prepared before wash and
after wash: (a,b) PdTACl, (c,d) CoHACl, (e,f) NiHACl. pH of solution was adjusted at
10.5.
smaller than that in the literature survey68–76. Deconvolution of the XRD patterns (Figure
4.8) suggests that the particles have a bimodal size distribution, with no evidence of PdO.
Page 63
50
Figure 4.8. X-ray diffraction pattern with deconvolution for different coverages of Pd frorm
PdTACl precursor before wash (a) 0.25 ML, (b) 0.5 ML, (c) 1.0 ML, (d) 1.5 ML, and (e) 2.0 ML.
For Co catalysts, XRD results confirm a complex composition of nanoparticles
(Figure 4.7 (b)). Metallic cobalt for 0.25 (0.5wt% Co) and 0.5ML (1.1wt% Co) is detected
Page 64
51
only as a fcc phase at 2θ = 44.6° with particle size of smaller than 2.5 nm. For the samples
with higher amount of Co with significantly larger particle size, one additional peak
appears at 2θ = 44.4° which may be attributed to hcp phase of metallic cobalt 77–79. With
Co wt% increasing from 2.1 to 4.2, fcc Co particles increased from 4.2 to 7.5 nm and at
the same time hcp Co particles increased from 2.2 to 2.3 nm (deconvolution in Figure 4.9).
Figure 4.9. Peak fitting of (a) 0.5 ML, (b) 1.0 ML, (c) 1.5 ML, and (d) 2 ML Co from
CoHACl precursor on silica prepared by CEDI.
The Co catalyst prepared via CEDI leads to relatively large particle size. However,
the literature shows that those catalysts prepared via IWI result in even larger particles with
the size of >20 nm, except for the case in which Co(CH3COO)2 is applied as the
precursor80–91.
Page 65
52
Using CEDI with Ni yields nanoparticles at the average size of 2.1 nm for 0.57%
to 17.4 nm for 4.60% Ni (Figure 4.7 (c)). Deconvolution of the Ni (111) peak at 2θ =
4.45° (Figure 4.10) gives two different particle sizes, indicating bimodal size distribution.
Figure 4.10. X-ray diffraction pattern with deconvolution for different coverages of Ni
from NiHACl precursor before wash (a) 0.5 ML, (b) 1.0 ML, (c) 1.5 ML, and (d) 2 ML.
Ni catalysts synthesized via CEDI show smaller sizes than have been reported to date with
impregnation with the average of 25nm 92–100.
Page 66
53
In another series of experiments chloride containing catalysts were washed and
filtered to remove Cl- counterion from the samples. A dilute NH4OH solution (300 mL/g
catalyst) with the pH value adjusted so that the final pH after sample addition was at or
close to the adsorption pH of 10.5 was used. The XRD profiles of the washed and then
dried and reduced samples confirm the presence of very small metal particles (<1.0 nm;
Figure 4.3 d, e, f). Jiao et al. applied SEA method to the preparation of supported metal
catalysts using the noble and base ammine complexes PdTACl, CoHACl, and NiHACl. By
their method at 2.2wt% Pd, 1.8wt%Co, and 1.6wt% Ni corresponding particle sizes were
1.6 nm, 4.3 nm, and 1.7 nm, respectively 23. This suggests that washing CEDI-prepared
samples leads to small particles similar to SEA even at higher weight loading of metal
without using a lot of solution. Summary of particle size before and after wash with the
amount of loss during washing step is shown in Figure 4.11.
ICP analysis revealed negligible metal loss for metal coverages up to 1ML after
washing. This result is consistent with the theory of strong electrostatic interaction between
the precursor and the support for the first deposited layer. For Pt and Pd metals at higher
coverages of 1.5 and 2.0 MLs, loss increases to about 15 and 30% respectively (Figure 4.11
(a,b)). Cobalt particles show 17% and 22% loss for 1.5 and 2.0 MLs correspondingly
(Figure 4.11 (c,d)). Nickel, unlike other metals during washing, shows almost no loss even
at high coverages; at present there is no explanation for the unusually strong interaction
between the Ni precursor and the support. The higher amount of metal loss after 1 ML
confirms that beyond the first layer deposition, electrostatic interaction is not strong enough
to keep the precursor attached to the support.
Page 67
54
Figure 4.11. Metal particle size before and after wash with the metal loss (%) for the
silica supported catalysts, CEDI-prepared: (a) Pd(PdTACl)/silica, (b) Co(CoHACl)/silica,
(c) Ni(NiHACl)/silica.
Other experiments were performed in attempts to simplify the synthesis procedure;
these explored first, using a wash step after DI, and second, eliminating the drying
procedure between the CEDI and washing steps. As a baseline, CEDI versus DI was
performed for all four metals at 1 ML precursor deposition and XRD results are shown in
Figures 4.12 a, b, c, and d for Pt, Pd, Co and Ni respectively. From this comparison we
see that CEDI yields smaller particle size than DI. At DI conditions, the surface of the
support is negligibly charged, due to the tremendous buffering capacity of the support 33,
whereas for CEDI, the surface is strongly charged, and the precursors are deposited at the
pH of the strongest electrostatic attraction. The average particle size of Pt via
Page 68
55
Figure 4.12. XRD of 1 ML prepared by DI and CEDI for before and after wash of (a,b)
PTACl, (c,d) PdTACl (e,f) CoHACl, (g,h) NiHACl. pH of solution was 10.5.
Page 69
56
CEDI is about 5.9 nm which is smaller than DI with the size of 8.3 nm at the same metal
loading of 4.2% (Figure 4.12 a). The Pd catalyst (Pd% = 2.5%) prepared via CEDI has an
average particle size of around 5.1 nm, which is smaller than the size obtained by DI with
9.3 nm (Figure 4.12(b)). The Co catalyst prepared via CEDI have particle size of 4.2 nm
compared to DI with the size of 5.6 nm (Figure 4.12 (c)). Ni catalysts synthesized via CEDI
also show smaller sizes (5.6 nm) than DI (7.2 nm) (Figure 4.12 (d)).
Next, it was attempted to redisperse DI-applied precursors at 1 ML by a washing
step. When neutral pH solutions were utilized, the majority of metal was lost (not shown
in Figure 4.12 but listed in Table 4.1). However, when a high pH wash (which resulted in
a wash pH slurry of about 10.5) was applied after the DI and drying steps, metal retention
was much higher (Table 4.1), though not as high as following CEDI. XRD patterns of
high pH post washed samples prepared by CEDI and DI using PTACl, PdTACl, CoHACl,
and NiHACl are shown in Figure 4.12e, f, g, and h respectively. For all four metals the
particle sizes of the high pH washed and reduced DI samples were virtually as small as
CEDI- derived particles. Apparently, the precursors do not degrade after DI followed by
drying. When electrostatically adsorbed, dried precursors exist in an aqueous-like
environment in which electrostatic attraction can exist 101. Presumably, they maintain their
ligand and hydration sheaths even after being agglomerated during DI and drying, and the
Table 4.1. Metal loss after washing dried samples prepared by DI and CEDI methods.
Initial Coverage/wash pH Pt loss (%) Pd loss (%) Co loss (%) Ni loss (%)
1.0 ML DI, pH 6.5 85 72 87 23
1.0 ML DI, pH 10.5 12.0 9.5 9.6 0.0
1.0 ML CEDI, pH 10.5 5.0 2.0 9.0 0.0
Page 70
57
presence of the high pH wash solutions allow the precursors to redissolve and adsorb over
the charged silica surface during the washing step. That is, electrostatic adsorption is
achieved following the initial DI deposition. The advantage of the initial CEDI deposition
is the somewhat higher retention of three of the four metals upon washing, notably, a 2%
loss for Pt CEDI vs 10% for DI, and a 5% loss for Pd CEDI vs. 10% for DI. At lower
metal loadings these differences would likely become smaller.
The second exploration of streamlining the synthesis was to determine the impact
of the drying step after CEDI. If electrostatic adsorption is sufficiently strong, it may be
possible to eliminate the drying step after the initial impregnation. Thus, four weight
loading or each metal precursors were deposited by CEDI, and after one hour contact were
placed in the pH 10.5 washing solutions. Metal loss in the wash solutions was measured
by ICP and results are summarized in Table 4.2.
Table 4.2. Washing samples as wet without drying.
Initial Coverage Pt loss (%) Pd loss (%) Co loss (%) Ni loss (%)
0.25 ML 0.0 2.0 0.0 0.0
0.5 ML 1.5 4.0 0.0 0.0
1.0 ML 2.0 2.0 55.0 2.3
1.5 ML 46.0 56.0 96.0 2.0
With the exception of cobalt, metal loss up to 1 ML was about what it was for the
dried samples. At 1.5 ML, however, the losses became significantly higher those with
drying which are seen in Figure 4.1 to be about 15% for all metals except Ni. Therefore,
samples with loadings higher than 1 ML require drying before washing.
Page 71
58
CONCLUSION
In this chapter it has been demonstrated that charge enhanced dry impregnation of a silica
support with a wide variety of noble (Pt, Pd) and base (Co, Ni, Cu) metals from the
respective tetra- or hexa-ammine chloride precursors yields smaller particles than dry
impregnation at the same metal loading, since electrostatic interactions can be induced at
the incipient wetness condition. Metal particle size can be considerably decreased, and
approaches that of strong electrostatic adsorption, if the chloride ions can be eliminated
either by 1) starting with a hydroxide ammine complex such as Pt tetraammine hydroxide,
2) removing chloride by washing a CEDI deposition with a high pH solution (to maintain
electrostatic interactions), or even 3) washing a DI impregnation with a high pH solution
(to induce electrostatic interactions and to remove chloride). For precursor loadings greater
than 1 ML, a drying step after the CEDI deposition and before the washing step minimizes
metal loss.
It is possible to extend this method to other systems, including anionic precursor adsorption
over high PZC supports. In view of the Chapter 3 results showing that nitrate ions has a
much weaker effect on particle size growth than chloride ions, the use of metal ammine
nitrate salts may work better than metal ammine chloride salts to give small particles via
CEDI with no washing step.
Page 72
59
CHAPTER 5
EVALUATION OF AG–IR/AL2O3 BIMETALLIC CATALYSTS PREPARED
BY ELECTROLESS DEPOSITION FOR HYDROGENATION OF
PROPYLENE AND HYDROGENOLYSIS OF METHYL CYCLOPENTANE
INTRODUCTION
In very recent work (submitted), Wong et al.102 have characterized Ag-modified alumina-
supported Ir catalysts prepared by electroless deposition (ED) of Ag on monometallic Ir
catalysts. For this study, they used highly dispersed, monometallic Ir particles on δ,θ-
alumina catalyst synthesized by SEA as core and Ag as shell metals. Ag-Ir catalysts were
characterized by H2 chemisorption, x-ray diffraction, scanning transmission electron
microscopy (STEM) and computational methods. After thermal treatments up to 800°C,
monometallic Ir and monometallic Ag catalysts sintered to average XRD particle sizes of
19 nm and 33 nm, respectively. The addition of a partial Ag shell on Ir cores caused a
suppression in extent of sintering for both the Ag and Ir components compared to the
monometallic analogs. H2 chemisorption results for the bimetallic catalysts treated in
flowing Ar at 400, 600, and 800°C also indicated higher Ir dispersions, thus confirming the
enhanced stability of the catalytic surface. More interestingly, following thermal annealing
at 400 and 600°C the H2 uptakes during chemisorption (at standard conditions of 40°C)
were much higher than observed at 200°C, and, in fact, were even higher than for the
monometallic Ir catalyst.
Page 73
60
To investigate these unusual high chemisorption uptakes of H2 from the Ag-Ir
bimetallic particles, temperature programmed desorption (TPD) of H2 experiments were
done. For Ag-Ir bimetallic catalysts, there were high temp (~270°C) desorption peak due
to unmodified Ir surface sites and low temp peaks due to Ag-modified Ir sites at 100-170
°C. After annealing at 800°C in Ar, there was greatly reduced desorption from Ir-only sites
due to heavy sintering which confirmed that the residual H2 desorption at 100-170 °C was
associated only with Ag-modified Ir sites. This enhanced stability and unusual H2 uptake
of the Ag-Ir core shell particles were investigated using computational studies. Results
indicated that Ir atoms, or possibly very small ensembles of Ir atoms, exposed in a partial
Ag shell were able to chemisorb more than one H atom per Ir surface atom; two adsorbed
H atoms/Ir site were energetically quite favorable. Surface Ag atoms did not bind H in any
configuration or particle morphology.
Another direct method to understand how the distribution of Ag and Ir on the
surface of bimetallic Ag-Ir catalyst particles could influence H uptake is to examine a
catalytic reaction that involves adsorbed H. Such reactions include hydrogenation of simple
terminal olefins or hydrogenolysis of a structured paraffin such as methylcyclopentane
(MCP). There is extensive work regarding the catalytic activity of Ir for the hydrogenation
of propylene103–106 and hydrogenolysis of methyclcyclopentane 107–111; Ag catalysts are
reported to be inactive for both classes of reactions112–115. It has been repeatedly reported
that alkene hydrogenation is a structure- insensitive reaction. According a work done by
Boudart et al., activities for simple olefin hydrogenation on metal nano particles larger than
2 nm are independent of the catalyst particle size and morphology and therefore are
Page 74
61
structure-insensitive reactions 116. Ortiz-Soto et al. showed that 2% Pt/SiO2 at reaction
condition of 40 °C, 10% C3H6, 20% H2, 70% He gives TOF= 12 sec-1 117.
Argo et al. used EXAFS spectroscopy to evaluate the Ir cluster structures and
cluster-support interactions during hydrogenation of olefin. His data indicates that however
the metal clusters remain intact and bonded to the support during reaction, but slight
rearrangements occur to accommodate reactive intermediates. Increasing concentrations of
reactive intermediates on the clusters causes cluster frame to expand, and flexed away from
the support. This shows self-inhibition of reaction occur by adsorbed hydrocarbons and
differences between hydrogenation of propene and other olefins is mainly due to different
adsorbate-adsorbate interactions118. Panjabi et al. studied supported iridium cluster
catalysts for propene Hydrogenation119. Using FTIR and EXFAS as characterization
techniques they identified Ir4 and Ir6 clusters as the catalytically active species with quite
unchanged cluster frames under the different reaction conditions which is consistent with
the results of Argo et al. 118.
In a work done by Bond et al. hydrogenation of olefins over alumina supported
platinum and iridium has been studied. They found out that (i) the behavior of platinum
and iridium is qualitatively similar which both show relatively small amounts of olefin
exchange, hydrogen exchange and isomerization (ii) with each metal the tendency to give
olefin- and hydrogen exchange is the same for ethylene, propylene and the butene, so that
the effect of molecular structure is small 120.
One of the main challenges in the chemical, petrochemical, and pharmaceutical
industries is to develop environmental friendly processes with minimum by-products. In
Page 75
62
the petrochemical industry, the ring opening of methyl cyclopentane (MCP) is one of
important reactions to understand which catalyst modification could be effective towards
increasing the cetane number of gasoline/diesel feed stocks 121 with minimal unfavorable
emissions. However various noble metals of Pt, Rh, Ru, and Ir are capable of ring opening
MCP but not all of them give products with high cetane numbers122. The ring opening
products of MCP are branched including 2-methylpentane (2- MP), 3-methylpentane (3-
MP) and linear paraffins (n-hexane, C6) as desired product with higher cetane number.
Rao et al. studied the effects of structure and acid–base properties of γ-alumina and
other oxide supports on conversion and selectivity of Ir catalysts in ring opening of MCP.
Effect of potassium addition on surface properties was evaluated. They found out that
potassium is suppressing the activity and greatly enhances the selectivity to ring opening
(RO) products on γ-alumina 123.
McVicker et al. proposed a dicarbene mechanism for iridium in which cyclopentyl
rings are assumed to bond perpendicularly to the iridium surface111. Ring-opening rates
over iridium are directly proportional to the number of unsubstituted, unencumbered CH2–
CH2 bonds and markedly decreased with increasing ring substitution. Hydrogenolysis
product distributions for feed composition of H2/MCP = 5 at 275 °C on 0.9% Ir/Al2O3 were
<1% for n-C6, 70 for 2-MP, and 29% for 3-MP with the conversion of 52%.
Djeddi et al. compared the selectivity for ring opening and cracking products among
different Pt and Ir mono and bimetallic catalysts. They find out that the most active catalyst
in the conversion of MCP was Ir/-Al2O3 with the highest cracking whilst other catalysts
were inactive under the same conditions. From literatures 122,124 it is known that Ir has high
Page 76
63
reactivity for naphthene conversion with high selectivity to ring opening. Interestingly,
comparison of Ir/-Al2O3 and Pt-Ir/-Al2O3 shows that Ir sites in monometallic catalyst were
very active while in bimetallic ones were inactive. In this case, the active sites of the
bimetallic Pt-Ir/-Al2O3 were similar to monometallic Pt/-Al2O3. They proposed that
opening occurs at the secondary–secondary position with dicarbene mechanism as reported
in other works110. This observation was ascribed to the possible formation of entities with
a high number of coordination sites on the catalyst surface.
Despite impressive works on Ir and Ag monometallic catalysts, to the extent of our
knowledge no studies have investigated bimetallic Ag-Ir catalysts for hydrogenation
reactions of olefin or hydrogenolysis/ hydrogenation of naphtenes like methyl
cyclopentane. Howevere, Chimentao et al. 125 studied hydrogenolysis of MCP over Ir-
Au/γ-Al2O3 bimetallic catalysts. They found that the addition of Au improved the
chemisorption and catalytic properties of Ir with products of 2-MP, 3-MP, and n-C6. In
their studies, initial rate of reaction was increased with Au content. We believe that this is
the first work that investigate bimetallic Ag–Ir catalysts for hydrogenation of propylene to
propane and hydrogenolysis of methyl cyclopentane (MCP) to isomerization and cracking
products as a probe reaction.
MATERIALS AND METHODS
5.2.1 Catalyst preparation
SEA method was used to make monometallic Ir/Al2O3 catalyst (1% Ir; dispersion
~ 50% by H2 chemisorption) using Potassium hexachloroiridate (II) (K2IrCl6, Alfa Aesar
99.9%) as anionic precursor and γ-alumina (UOP VGL-25, BET SA- 164 m2/g) as support
Page 77
64
in low pH conditions adjusted by HCl solution. Al2O3 support was calcined at 700°C for 4
hours before metal deposition. Metal concentration was determined by a Perkin-Elmer
2000DV ICP-OES. This base catalyst was then dried at 60 C in a vacuum oven for
overnight and then reduced at 400 C in 100 cm3/min (STP) of flowing H2 for 1 h before
using for next experiment. Electroless deposition of Ag on Ir/Al2O3 was performed using
aqueous solution of Potassium silver cyanide, KAg(CN)2 (Technic, Inc.) as metal
precursor, hydrazine and formaldehyde as reducing agents and NaOH to adjust high pH of
solution. Concentration of initial potassium silver cyanide in ED bath was determined
based on final coverage of Ag on Ir.
Experiments were done at room temperature (RT) with metal salt/reducing agent
molar ratio of 1:5. Stirrer bar was used to mix bath solution to prevent any mass transfer
limitations. NaOH solution carefully was added to keep the PH of bath around 10. To
specify the final concentration of Ag in bath and the deposited amount on Ir in specific
period of times small aliquots around 5 ml was taken from bath and was analyzed by
Perkin-Elmer AA 400. After completion of the Ag deposition, bath solution was filtered
and washed repeatedly with de-ionized water to remove all the remaining ligands from
sample. The filtered sample was dried at room temperature under vacuum overnight.
Therefore, various Ag-Ir bimetallic catalysts with different coverages of Ag were
synthesized.
5.2.2 H2 chemisorption studies
To determine the number of catalytically active sites, automated AutoChem II 2920
from Micromeritics was used. Samples (~ 0.1 g) were reduced in flow of 10%H2/bal. He
Page 78
65
(20 sccm) at 200 C for 2 hrs followed by Ar (20 sccm) at the same temperature for 2 hrs to
remove physisorbed and chemisorbed hydrogen from particles’ surfaces. Same samples
were annealed in situ up to 400, 600, and 800 °C respectively each for 4 hrs. After each
annealing treatment, temperature was cooled down to 40 °C to run the chemisorption.
5.2.3 Temperature programmed desorption (TPD)
ASAP 2920 was used to perform TCD- H2 TPD measurements. To run the
experiment each sample was reduced in situ with the flow of 10%H2/bal. Ar at 200 C for
2 hrs followed by flowing Ar at the same temperature for 2 hrs. After sample was cooled
down to room temperature H2 was flowed over sample to populate hydrogen on the
particles surface. After saturating particles surface with hydrogen temperature ramping
started along with Ar flow. H2 desorption pattern was recorded by increasing temperature.
5.2.4 X-ray diffraction
XRD analysis was performed on a Rigaku Miniflex-II with a high sensitivity silica
strip detector (D/teX Ultra) with Cu Kα radiation (λ = 1.5406 Å), operated at 15 kV and 30
mA. Patterns were recorded in the 20°−80° 2θ range, with a scan rate of 2.0°/min, Ir and
Ag diffractions were fit using Gaussian to achieve FWHM values and particle size were
calculated by Scherrer equation.
5.2.5 Fourier transform infrared spectroscopy (FTIR)
Nicolet Nexus 4700 spectrometer equipped with a mercury–cadmium–telluride B
(MCT-B) detector was used to perform in situ FTIR spectra. At room temperature FTIR
spectra were collected for each sample with 40 mg in single beam absorbance mode with
Page 79
66
a resolution of 4 cm-1. The samples were reduced in 5% H2/bal. He for 1 h at 200 C and
then cooled to room temperature. Background spectra were taken in Ar flow before Co
exposure. Sample was saturated with 1% CO and then was flushed with pure Ar for 10 min
to remove weakly bonded CO species and gas phase CO. Deconvolution of FTIR peaks
were done for all samples based on spectrum of 1% Ir/Al2O3 to obtain peak position, width,
eight, and area of overlapped peaks.
5.2.6 Catalytic evaluation: propylene hydrogenation and MCP hydrogenolysis
The monometallic Ir/Al2O3 and the series of bimetallic Ag–Ir/Al2O3 were evaluated
for hydrogenation of propylene (C3H6) to propane (C3H8). Catalysts were placed in a single
pass, 0.19” ID tubular packed bed reactor (316 stainless steel). Reactor was loaded with
0.006 g of catalyst diluted by 0.054 g of the Al2O3 supported on glass wool in the middle
of the reactor. All samples were treated in situ at 200 °C in 10%H2/bal. He for 2 hrs; then
400 C for 4 hrs and finally cool down to reaction temperature. To monitor the reaction
temperature a thermocouple was inserted into the catalyst bed. All catalysts were reduced
in situ at 200 ◦C in 10% H2/balance He for 2 h and then cooled to 100 ◦C to start the
reaction. All lines between the reactor outlet and the inlet of the GC were held at 120 °C
to prevent any condensation. Prior Using mass flow controllers for adjusting gas flows the
reaction feed stream were determined to be 10% C3H6, 50% H2, balance He at a total flow
rate of 100 SCCM. To maintain differential conversion conditions, it was tried to keep the
conversion low for all set of reactions. An automated, on-line Hewlett-Packard 5890 Series
II gas chromatograph with flame ionization detection was used for analyzing both reaction
feed and products at every 1.0 h over the full length of the run. Due to transient behavior
Page 80
67
for the first several hours on line all the reaction data reported here were based on stable
catalyst performance after 15 to 20 h on line.
The kinetic measurements for methyl cyclopentane hydrogenolysis/ hydrogenation
were studied using the same reactor system. To vaporize MCP from liquid phase, a vapor
liquid equilibrium (VLE) system was used. VLE was encased in a jacketed shell with liquid
inlet and exit ports at the bottom and top of the shell, respectively, which was connected to
an ethylene glycol/H2O recirculation bath to maintain isothermal behavior to give
convenient MCP vapor pressure for reaction. Calibration for feed and all ring opening
products including 2-MP, 3-MP, C1-C4, and n-C6 were done separately.
RESULTS AND DISCUSSION
5.3.1 SEA and ED bath development
Strong Electrostatic Adsorption (SEA) was used to form monometallic 1%Ir/Al2O3
with IrCl62- as anionic Iridium precursor over the calcined alumina supports in the acidic
pH value of 4 102. After reduction treatment, particle size was measured from XRD which
below the limit of detection (<1.5 nm).
Electroless Deposition (ED) was performed according the procedure from earlier
work in our laboratory to synthesize Ag-Ir bimetallic particles from Ir monometallic
particles. KAg(CN)2 was used as the silver precursor since it has a low standard reduction
potential E0 = -0.31 V to provide high stability in the bath. Hydrazine and formaldehyde
were selected as the reducing agents for Ag deposition since they are preferably activated
on Ir surfaces relative to the Ag metal 126.
Page 81
68
5.3.2 Synthesis of Ag–Ir/Al2O3 bimetallic catalysts
Various samples of Ag-Ir catalysts with different Ag coverages as shell on Ir core
metals were synthesized by ED. A summary of samples with wt% of Ag, targeted coverage,
and experimental coverages are shown in Table 5.1. Two series of samples were prepared;
one for propylene hydrogenation analysis and another for hydrogenolysis of MC. Atomic
absorption spectroscopy (AA) was used to determine Ag wt% deposited on Ir.
Experimental coverages of Ag were obtained from H2 chemisorption. Hydrogen
chemisorption quantitatively determine the exposed Ir surface sites. Since Ag does not
chemisorb H2 at 40 °C Ag deposition on Ir should lead to a decrease in H2 uptake.
Theoretical coverages assume a 1:1 shell atom to core metal active site and only catalytic
deposition. Discrepancy between the theoretical and experimental coverages of Ag is due
to electroless deposition of Ag metal on previously deposited Ag metal. Deviation of the
experimental ED profile from the theoretical solid line for higher wt % of Ag loadings
indicates that autocatalytic deposition also occurs.
From earlier work 102, the prepared Ag-Ir bimetallic catalysts were annealed at
high temperatures of 400, 600, and 800 °C to determine their stability. The chemisorption
results of the Ag-Ir bimetallic system supported on an δ, θ alumina surface is shown in
Figure 5.1. They showed that 1.0 wt% Ir catalyst was stable up to 400°C annealing
temperatures shown by no change in the H2 uptake from chemisorption between 200 and
400°C. After the temperatures of 600C and 800 °C, the H2 uptake decreased from 12.5 to
1.2, and 1.4 µmol/g catalyst, respectively which is indicative of severe nanoparticle
sintering. This decrease in H2 uptake proves that active sites decreased as annealing
Page 82
69
temperature increased. By adding Ag, the initial H2 uptake of the catalyst was decreased
because Ag is unable to chemisorb H2 at these conditions.
Table 5.1. Bimetallic Ag-Ir Catalysts for C3H6 hydrogenation, and MCP hydrogenolysis
At 400°C, Ag-Ir catalysts actually had a higher H2 uptake than initial prepared. At higher
temperatures of 600, and 800 °C these bimetallic catalysts with only a fraction of Ag added
retained a higher H2 uptake compared to the Ir monometallic catalyst at those same
temperatures. H2 uptakes for the catalysts with higher Ag coverages have reduced after
200°C. The H2 uptake of the Ag-Ir bimetallic catalysts remained higher than the Ir
monometallic catalysts after the elevated annealing temperatures of 600 and 800 °C.
Reaction Shell Ag wt % θtheo. (ML) θexp (ML)
C3H6 hydrogenation
0 0 0
0.14 0.52 0.22
0.24 0.92 0.62
0.47 1.77 0.93
MCP hydrogenolysis
0.03 0.11 n/a
0.09 0.32 n/a
0.12 0.42 0.29
0.3 1.05 0.53
0.39 1.37 0.82
0.49 1.72 0.65
Page 83
70
Figure 5.1. The H2 uptake of the Ag-Ir bimetallic catalysts remained higher than the Ir
monometallic catalysts after the elevated annealing temperatures of 600 and 800°C.
XRD of the monometallic Ir and Ag catalysts showed sintering on alumina support.
Anchoring the Ag as a shell by ED prevented the sintering of Ag compared with the
monometallic Ag catalysts. This increased stability of the Ag agrees with SFE principles.
Moreover, the addition of a Ag shell to the catalysts also prevented Ir sintering. STEM was
used to confirm the bimodal distribution and stabilization of the Ag-Ir nanoparticles.
Severe sintering is prevented by the incorporation of Ag. This enhanced stability and
unusual H2 uptake of the Ag-Ir core shell Particles were investigated using computational
studies by A.C. Reber et al. It was found that Ir atoms in Ag shell bind H2 quite strongly,
but Ag binds H2 too weakly to explain low temperature H2 in TPD.
Another direct way to evaluate the Ag-Ir bimetallic catalysts is to use them in
related reactions. In here, two different hydrogenation reactions were used to evaluate
catalytic properties of the Ir@Ag catalysts, the hydrogenation of propylene (C3H6) and
hydrogenolysis of methyl cyclopentane (MCP). First hydrogenation of C3H6 was
Page 84
71
performed to evaluate the annealing temperature on C3H8 formation. As shown in Figure
5.2, by increasing annealing temperature from 400 to 800 °C, TOF for C3H8 formation was
dropped which is indication of sintering at higher temperatures.
Figure 5.2. Effect of annealing temperature on TOF for C3H8 formation on (a) 1% Ir, (b)
0.14% Ag-1% Ir, (c) 0.24% Ag-1% Ir, and (d) 0.47% Ag-1% Ir.
Close look at the hydrogenation of C3H6 shown in Figure 5.2 shows very high initial
rates indicative of the large reservoir of hydrogen from Ag-Ir. However, after consumption
of hydrogen from these sites, specific activities returned to that of monometallic Ir with
TOF = 15 sec-1 indicating that only Ir sites were operative at steady state conditions. These
high Initial TOF's cannot be from exothermic reaction because the reaction bed was very
dilute and Ea values are typically only 5 - 6 kcal/mole. Most likely the reason is large
Page 85
72
reservoir of adsorbed H on Ag-Ir sites. It appears that sites are not re-populated during
reaction.
Figure 5.3. Comparison of initial TOF's for Ir and Ag-Ir catalysts.
Figure 5.3 shows TOF for all samples for 1% Ir monometallic and Ag-Ir bimetallic in one
plot. It is obvious that at steady state all of the bimetallic activities approach to that of 1%
Ir. To evaluate the source of these high initial activities and to see if restructuring of Ir sites
have been occurred H2-TPD was done on samples after reaction, shown in Figure 5.4.
If we look at the plots, we can see that there is not much difference between the
TPD before reaction and the TPD after reaction. Therefore, it doesn’t appear that
restructuring that restructutring of the bimetallic surface has occurred rather it continues to
look like those particular sites that give rise to low temperature desorbed H2 while initially
Page 86
73
active cannot repopulate. This is because heat of adsorption of C3H6 is about twice high as
that of H2. Thus, in a competitive adsorption environment H2 cannot be put on those sites.
Figure 5.4. H2-TPD for before and after reaction of (a,b) 1% Ir, (c,d) 0.14%Ag, (e,f)
0.24% Ag, and (g,h) 0.47% Ag.
Page 87
74
In another rigorous reaction, Hydrogenolysis/hydrogenation of MCP was also used
to determine the effects of Ag on selectivity to different reaction products, specifically, the
hydrogenolysis of MCP to C1-C4 paraffins and isomerization to 2- methyl pentane (2-MP),
3- methyl pentane (3-MP) and n-hexane (n-C6). As shown in Figure 5.5. at Ag coverages,
higher than 0.53, selectivity to the isomerization products decrease while cracking to C1-
C4 hydrocarbons increases.
Figure 5.5. Effect of Ag coverage on selectivity of MCP isomerization at 10% C3H6, 50%
H2, bal He at 100 SCCM flow, 6mg cat diluted to 60 mg with δ,θ-Al2O3, Temp = 100 °C
and P = 1 atm.
Table 5.2 shows that by increasing Ag coverage, TOF is increasing from 0.16 for
1% Ir to 0.39 for θAg=0.82 with exception at Ag coverage of 0.65 with TOF of 0.18 sec-1.
However, the rate of reaction is rising by increasing the Ag coverages which is
accompanied by decrease of conversion.
Monometallic Ir/Al2O3, Ag/Al2O3 and their bimetallic catalysts annealed at 400 and
200 °C were studied by adsorption of CO at room temperature as shown in Figure 5.6. For
Page 88
75
both Ir/Al2O3 and Ag–Ir/Al2O3 catalysts, CO stretching bands were observed in 1950–2150
cm-1 region, whereas no characteristic ʋCO vibrations were observed in the spectra of the
Ag/Al2O3 catalyst, in agreement with observations of 127. For the Ir/Al2O3 sample annealed
at 400 °C, the region between 1800 and 2200 cm-1 contains several overlapping features,
which can be deconvoluted into five peaks centered at 1830, 1993, 2036 and 2065 and
2080 cm-1.
Table 5.2. Selectivity to isomerization products of MCP, TOF (s-1) based on MCP reacted,
rate (µmol/g cat. Min), and Conversion (%) at reaction conditions of 300 °C and 1 atm, tot.
flow of 50 sccm.
pretreatment at 400 °C in Ar before reaction at 300 °C
wt% Ag θAg 2-mp 3-mp n-hexane C1 - C4 TOF
(sec-1) Rate
(µmol/g cat-min) %
Conv
0 0 25 17 24 34 0.16 243 24
0.03 0.11 26 17 21 36 0.22 287 27
0.30 0.53 38 22 13 27 0.25 187 18
0.49 0.65 23 13 4 60 0.18 102 10
0.39 0.82 12 7 3 79 0.39 118 11
These peaks are attributed to linearly adsorbed CO species on fully reduced Ir sites (2036,
2065 cm-1) or antisymmetric (1993 cm-1) or symmetric (2080 cm-1) or bridge (1830 cm-1)
vibrations of adsorbed dicarbonyl species on Ir, respectively. The assignment of these
peaks in this spectral region is based on our previous published work 126 and the available
literature 128. In the case of bimetallic surfaces, the intensity of FTIR spectra decreases with
increasing Ag content, indicating lower CO uptake due to electroless deposition of Ag on
Ir. The results suggest that Ag electroless deposition on Ir is not particularly favored on
any of the various Ir surface planes or other sites that are exposed, which is in agreement
with the recent literature 39,129.
Page 89
76
Figure 5.6. Transmission FTIR spectra of CO adsorption on Ir/Al2O3, Ag/Al2O3 and Ag–
Ir/Al2O3 bimetallic catalysts. Arrows highlight peak intensity losses as Ag wt.% increases.
Monometallic Ir/Al2O3, and bimetallic catalysts annealed at 200 °C, shown in Figure
5.6 (b), shows much lower CO intensity than that of 400 C. For the Ir/Al2O3 sample
annealed at 200 °C, the region between 1800 and 2200 cm-1 contains several overlapping
features, which can be deconvoluted into four peaks centered at 1993, 2036 and 2065 and
2130 cm-1. These peaks are attributed to linearly adsorbed CO species on fully reduced Ir
sites (2036, 2065 cm-1) or antisymmetric (1993 cm-1) or oxide form of Ir (2130 cm-1)
species on Ir, respectively. By increasing Ag coverage, the intensity has not been changed
but there is a shift toward higher wavelength. Comparison FTIR data for two temperatures
shows by increasing annealing temperature to 400 °C, CO intensity 10 times has been
decreased. This is not consistent with CO and H2 chemisorption results. The explanation
Page 90
77
for this can be that FTIR is not accurate in quantitively evaluation while it can give
information about the site species for samples.
CONCLUSION
Restructuring of the bimetallic surface has not occurred according to H2-TPD results and
those particular sites that give rise to low temperature desorbed H2 while initially were
active cannot repopulate. This is because heat of adsorption of C3H6 is about twice high
as that of H2. Thus, in a competitive adsorption environment H2 cannot be put on those
sites.
Page 91
78
REFERENCES
1. Roque-Malherbe, R. Handbook of Surfaces and Interfaces of Materials: zeolites.
Handb. Surfaces Interfaces Mater. 2, 495–522 (2001).
2. Niemantsverdriet, J. W. Spectroscopy in Catalysis: An Introduction: Third Edition.
Spectroscopy in Catalysis: An Introduction: Third Edition (2007).
doi:10.1002/9783527611348
3. Liu, Q., Joshi, U. a, Uber, K. & Regalbuto, J. R. The control of Pt and Ru
nanoparticle size on high surface area supports. Phys Chem Chem Phys 16, 26431–
26435 (2014).
4. Van Dillen, A. J., Terörde, R. J. A. M., Lensveld, D. J., Geus, J. W. & De Jong, K.
P. Synthesis of supported catalysts by impregnation and drying using aqueous
chelated metal complexes. in Journal of Catalysis 216, 257–264 (2003).
5. Geus, J. W. Production and Thermal Pretreatment of Supported Catalysts. Stud.
Surf. Sci. Catal. 16, 1–33 (1983).
6. De Jong, K. P. Synthesis of supported catalysts. Curr. Opin. Solid State Mater. Sci.
4, 55–62 (1999).
7. Regalbuto, J. Catalyst Preparation : Science and Engineering. Catalyst
Preparation: Science and Engineering (2006).
8. Chan, K. Y., Ding, J., Ren, J. W., Cheng, S. A. & Tsang, K. Y. Supported mixed
metal nanoparticles as electrocatalysts in low temperature fuel cells. J. Mater.
Chem. 14, 505–516 (2004).
9. Nguyen, D. L. et al. Deposition–precipitation versus anionic-exchange Au/Al2O3
catalysts: A comparative investigation towards the selective reduction of NOx.
Catal. Commun. 26, 225–230 (2012).
10. Zanella, R., Louis, C., Giorgio, S. & Touroude, R. Crotonaldehyde hydrogenation
by gold supported on TiO2: Structure sensitivity and mechanism. J. Catal. 223,
328–339 (2004).
11. Burattin, P., Che, M. & Louis, C. Characterization of the Ni(II) Phase Formed on
Silica Upon Deposition−Precipitation. J. Phys. Chem. B 101, 7060–7074 (1997).
12. Foster, A. J., Do, P. T. M. & Lobo, R. F. The synergy of the support acid function
and the metal function in the catalytic hydrodeoxygenation of m-cresol. in Topics
in Catalysis 55, 118–128 (2012).
13. Diao, W., Tengco, J. M. M., Regalbuto, J. R. & Monnier, J. R. Preparation and
Page 92
79
Characterization of Pt-Ru Bimetallic Catalysts Synthesized by Electroless
Deposition Methods. ACS Catal. 5, 5123–5134 (2015).
14. Hong, X., Sun, Y., Zhu, T. & Liu, Z. Pt-Au/CeO 2 catalysts for the simultaneous
removal. Catal. Sci. Technol (2015). doi:10.1039/C5CY01744K
15. Sunagawa, Y., Yamamoto, K., Takahashi, H. & Muramatsu, A. Liquid-phase
reductive deposition as a novel nanoparticle synthesis method and its application
to supported noble metal catalyst preparation. Catal. Today 132, 81–87 (2008).
16. Faraji, S., Yardim, M. F., Can, D. S. & Sarac, A. S. Characterization of
polyacrylonitrile, poly(acrylonitrile‐co‐vinyl acetate), and poly(acrylonitrile‐co‐
itaconic acid) based activated carbon nanofibers. J. Appl. Polym. Sci. 134, (2017).
17. Ebrahimian, A., Monazzam, P. & Fakhari Kisomi, B. Co/TiO2 nanoparticles:
Preparation, characterization and its application for photocatalytic degradation of
methylene blue. Desalination and Wtare Treatment 63, (2017).
18. Shakouri, A., Zeinali Heris, S., Gholamreza Etemad, S. & Mahmoud Mousavi, S.
Photocatalytic activity performance of novel cross-linked PEBAX copolymer
nanocomposite on azo dye degradation. Journal of Molecular Liquids 216, (2016).
19. Agnihotri, S., Mukherji, S. & Mukherji, S. Size-controlled silver nanoparticles
synthesized over the range 5–100 nm using the same protocol and their
antibacterial efficacy. RSC Adv. 4, 3974–3983 (2014).
20. Liu, H., Yan, Y. & Jin, G. Design and experimental test of diffractive
superresolution elements. Appl. Opt. 45, 95–9 (2006).
21. Brunelle, J. P. Preparation of catalysts by metallic complex adsorption on mineral
oxides. Pure Appl. Chem. 50, 1211–1229 (1978).
22. Zhang, L. et al. Stabilization of Palladium Nanoparticles on Nanodiamond-
Graphene Core-Shell Supports for CO Oxidation. Angew. Chemie - Int. Ed. 54,
15823–15826 (2015).
23. Jiao, L. & Regalbuto, J. R. The synthesis of highly dispersed noble and base
metals on silica via strong electrostatic adsorption: II. Mesoporous silica SBA-15.
J. Catal. 260, 342–350 (2008).
24. Lambert, S. et al. Synthesis of very highly dispersed platinum catalysts supported
on carbon xerogels by the strong electrostatic adsorption method. J. Catal. 261,
23–33 (2009).
25. Liu, J. et al. Selective adsorption of manganese onto rhodium for optimized
Mn/Rh/SiO 2 alcohol synthesis catalysts. ChemCatChem 5, 3665–3672 (2013).
26. Faraji, S., Sadri, B., Vajdi Hokmabad, B., Jadidoleslam, N. & Esmaeilzadeh, E.
Experimental study on the role of electrical conductivity in pulsating modes of
electrospraying. Experimental Thermal and Fluid Science 81, (2016).
27. Cao, S., Monnier, J. R., Williams, C. T., Diao, W. & Regalbuto, J. R. Rational
Page 93
80
nanoparticle synthesis to determine the effects of size, support, and K dopant on
Ru activity for levulinic acid hydrogenation to γ-valerolactone. J. Catal. 326, 69–
81 (2015).
28. Regalbuto, J. R. Electrostatic Adsorption. in Synthesis of Solid Catalysts 33–58
(2009). doi:10.1002/9783527626854.ch3
29. Zhu, X., Cho, H. R., Pasupong, M. & Regalbuto, J. R. Charge-enhanced dry
impregnation: A simple way to improve the preparation of supported metal
catalysts. ACS Catal. 3, 625–630 (2013).
30. Vajdi Hokmabad, B., Faraji, S., Ghaznavi Dizajyekan, T., Sadri, B. &
Esmaeilzadeh, E. Electric field-assisted manipulation of liquid jet and emanated
droplets. Int. J. Multiph. Flow 65, 127–137 (2014).
31. Konstantin, K. et al. Catalytic N−H Bond Activation and Breaking by a Well‐
Defined CoII1O4 Site of a Heterogeneous Catalyst. ChemCatChem 10, 736–742
(2017).
32. Liu, Q. et al. A pinch of salt to control supported Pt nanoparticle size. Catal.
Today 280, 246–252 (2017).
33. Park, J. & Regalbuto, J. R. A simple, accurate determination of oxide pzc and the
strong buffering effect of oxide surfaces at incipient wetness. J. Colloid Interface
Sci. 175, 239–252 (1995).
34. Ebrahimian Pirbazari, A., Fakhari Kisom, B. & Ghamangiz Khararoodi, M.
Anionic surfactant-modified rice straw for removal of methylene blue from
aqueous solution. Desalin. Water Treat. 57, 18202–18216 (2016).
35. Samad, J. E., Hoenig, S. & Regalbuto, J. R. Synthesis of Platinum Catalysts over
Thick Slurries of Oxide Supports by Strong Electrostatic Adsorption.
ChemCatChem 7, 3460–3463 (2015).
36. Munnik, P., De Jongh, P. E. & De Jong, K. P. Recent Developments in the
Synthesis of Supported Catalysts. Chemical Reviews 115, 6687–6718 (2015).
37. Cho, H. R. & Regalbuto, J. R. The rational synthesis of Pt-Pd bimetallic catalysts
by electrostatic adsorption. Catal. Today 246, 143–153 (2015).
38. Rebelli, J., Detwiler, M., Ma, S., Williams, C. T. & Monnier, J. R. Synthesis and
characterization of Au-Pd/SiO2 bimetallic catalysts prepared by electroless
deposition. J. Catal. 270, 224–233 (2010).
39. Schaal, M. T. et al. Hydrogenation of 3,4-epoxy-1-butene over Cu-Pd/SiO2
catalysts prepared by electroless deposition. Catal. Today 123, 142–150 (2007).
40. SCHAAL, M., PICKERELL, A., WILLIAMS, C. & MONNIER, J.
Characterization and evaluation of Ag–Pt/SiO2 catalysts prepared by electroless
deposition. J. Catal. 254, 131–143 (2008).
41. Beard, K. D. et al. Preparation and structural analysis of carbon-supported co
Page 94
81
core/pt shell electrocatalysts using electroless deposition methods. ACS Nano 3,
2841–2853 (2009).
42. Zhang, Y., Diao, W., Williams, C. T. & Monnier, J. R. Selective hydrogenation of
acetylene in excess ethylene using Ag- and Au-Pd/SiO2 bimetallic catalysts
prepared by electroless deposition. Appl. Catal. A Gen. 469, 419–426 (2014).
43. Zhang, Y., Diao, W., Monnier, J. R. & Williams, C. T. Pd–Ag/SiO 2 bimetallic
catalysts prepared by galvanic displacement for selective hydrogenation of
acetylene in excess ethylene. Catal. Sci. Technol. 5, 4123–4132 (2015).
44. Demicheli, M. C., Hoang, L. C., Menezo, J. C., Barbier, J. & Pinabiaucarlier, M.
Influence of Metal-Particle Size and Effect of Gold Addition on the Activity and
Selectivity of Pt/Al2O3 Catalysts in the Reduction of Nitric-Oxide by Methane.
Appl. Catal. A-General 97, L11–L17 (1993).
45. Abolfazl, S., Hadi, A., Mohammad, H. & Saeed, Z. H. Effect of TiO2 nanoparticle
on rheological behavior of poly(vinyl alcohol) solution. J. Vinyl Addit. Technol.
23, 234–240 (2017).
46. Saeed, M., Abolfazl, S., Mohammad, H., Gholamreza, E. S. & Zeinali, H. S.
Rheological behavior of starch–poly(vinyl alcohol)–TiO2 nanofluids and their
main and interactive effects. J. Appl. Polym. Sci. 133, (2016).
47. Klaigaew, K. et al. Effect of preparation methods on activation of cobalt catalyst
supported on silica fiber for Fischer-Tropsch synthesis. Chem. Eng. J. 278, 166–
173 (2015).
48. Zhang, L. & Xia, Y. Scaling up the production of colloidal nanocrystals: Should
we increase or decrease the reaction volume? Adv. Mater. 26, 2600–2606 (2014).
49. Cao, C. et al. Highly dispersed Pt/C catalysts prepared by the Charge Enhanced
Dry Impregnation method. Appl. Catal. B Environ. 150–151, 101–106 (2014).
50. Bezemer, G. L. et al. Cobalt particle size effects in the Fischer-Tropsch reaction
studied with carbon nanofiber supported catalysts. J. Am. Chem. Soc. 128, 3956–
3964 (2006).
51. Karim, A. M. et al. Correlating particle size and shape of supported Ru/??-Al 2O3
catalysts with NH3 decomposition activity. J. Am. Chem. Soc. 131, 12230–12239
(2009).
52. Bauer, M. et al. Structure–Activity Studies on Highly Active Palladium
Hydrogenation Catalysts by X-ray Absorption Spectroscopy. J. Phys. Chem. C
116, 22375–22385 (2012).
53. Santhosh Kumar, M., Chen, D., Walmsley, J. C. & Holmen, A. Dehydrogenation
of propane over Pt-SBA-15: Effect of Pt particle size. Catal. Commun. 9, 747–750
(2008).
54. Dimitratos, N. et al. Effect of particle size on monometallic and bimetallic
(Au,Pd)/C on the liquid phase oxidation of glycerol. Catal. Letters 108, 147–153
Page 95
82
(2006).
55. Mehrabadi, B. A. T., Eskandari, S., Khan, U., White, R. D. & Regalbuto, J. R. A
Review of Preparation Methods for Supported Metal Catalysts. in Advances in
Catalysis 61, 1–35 (2017).
56. Hao, X., Quach, L., Korah, J., Spieker, W. A. & Regalbuto, J. R. The control of
platinum impregnation by PZC alteration of oxides and carbon. J. Mol. Catal. A
Chem. 219, 97–107 (2004).
57. Banerjee, R., Liu, Q., Tengco, J. M. M. & Regalbuto, J. R. Detection of Ambient
Oxidation of Ultrasmall Supported Platinum Nanoparticles with Benchtop Powder
X-Ray Diffraction. Catal. Letters 147, 1754–1764 (2017).
58. Xin, H., Guo, K., Li, D., Yang, H. & Hu, C. Production of high-grade diesel from
palmitic acid over activated carbon-supported nickel phosphide catalysts. Appl.
Catal. B Environ. 187, 375–385 (2016).
59. Wu, S. K., Lai, P. C. & Lin, Y. C. Atmospheric hydrodeoxygenation of guaiacol
over nickel phosphide catalysts: Effect of phosphorus composition. Catal. Letters
144, 878–889 (2014).
60. Lee, Y. K. & Oyama, S. T. Bifunctional nature of a SiO2-supported Ni2P catalyst
for hydrotreating: EXAFS and FTIR studies. J. Catal. 239, 376–389 (2006).
61. Cecilia, J. A., Infantes-Molina, A., Rodríguez-Castellón, E., Jiménez-López, A. &
Oyama, S. T. Oxygen-removal of dibenzofuran as a model compound in biomass
derived bio-oil on nickel phosphide catalysts: Role of phosphorus. Appl. Catal. B
Environ. 136–137, 140–149 (2013).
62. Basolo, F. Substitution reactions of square planar complexes. Adv. Chem. Ser. Am.
Chem. Soc. Washington, D.C 49, 81–89 (1965).
63. Zhong, C. J. & Regalbuto, J. R. Comprehensive Inorganic Chemistry II.
Comprehensive Inorganic Chemistry II (2013). doi:10.1016/B978-0-08-097774-
4.00711-7
64. Schwarz, J. & Contescu, C. Methods for preparation of catalytic materials. Chem.
Rev. 95, 477–510 (1995).
65. Spieker, W. A. & Regalbuto, J. R. A fundamental model of platinum impregnation
onto alumina. Chem. Eng. Sci. 56, 3491–3504 (2001).
66. Schreier, M. & Regalbuto, J. R. A fundamental study of Pt tetraammine
impregnation of silica: 1. The electrostatic nature of platinum adsorption. J. Catal.
225, 190–202 (2004).
67. Munoz-Paez, A. & Koningsberger, D. C. Decomposition of the precursor
[Pt(NH3)4](OH)2, genesis and structure of the metal-support interface of alumina
supported platinum particles. A structural study using TPR, MS, and XAFS
spectroscopy. J. Phys. Chem. 99, 4193–4204 (1995).
Page 96
83
68. Ali, S. H. & Goodwin, J. G. SSITKA investigation of palladium precursor and
support effects on CO hydrogenation over supported Pd catalysts. J. Catal. 176, 3–
13 (1998).
69. Barrio, V. L. et al. Modification of the Pd/SiO2-Al2O3catalyst’s thioresistance by
the addition of a second metal (Pt, Ru, and Ni). Catal. Commun. 5, 173–178
(2004).
70. Pinna, F. et al. Consecutive hydrogenation of benzaldehyde over Pd catalysts -
Influence of supports and sulfur poisoning. Appl. Catal. A Gen. 219, 195–200
(2001).
71. Naito, S., Iwahashi, M., Kawakami, I. & Miyao, T. Marked particle size and
support effect of Pd catalysts upon the direct decomposition of nitric oxide. in
Catalysis Today 73, 355–361 (2002).
72. Nohair, B. et al. Palladium supported catalysts for the selective hydrogenation of
sunflower oil. J. Mol. Catal. A Chem. 229, 117–126 (2005).
73. Panpranot, J., Pattamakomsan, K., Goodwin, J. G. & Praserthdam, P. A
comparative study of Pd/SiO2and Pd/MCM-41 catalysts in liquid-phase
hydrogenation. Catal. Commun. 5, 583–590 (2004).
74. Aramendía, M. A., Borau, V., Jiménez, C., Marinas, J. M. & Moreno, A.
Comparative measurements of the dispersion of Pd catalyst on SiO2-ALPO4
support using TEM and H2 chemisorption. Colloids Surfaces A Physicochem. Eng.
Asp. 106, 161–165 (1996).
75. Del Angel, G. & Benitez, J. L. Ammonia and sulfur poisoning effects on
hydrogenation of phenylacetylene over Pd supported catalysts. J. Mol. Catal. 94,
409–416 (1994).
76. Viniegra, M., Córdoba, G. & Gómez, R. Gas phase hydrogenation of o-xylene
over palladium catalysts. J. Mol. Catal. 58, 107–114 (1990).
77. Matveev, V. V. et al. Cobalt nanoparticles with preferential hcp structure: A
confirmation by X-ray diffraction and NMR. Chem. Phys. Lett. 422, 402–405
(2006).
78. Salman, S. A., Usami, T., Kuroda, K. & Okido, M. Synthesis and characterization
of cobalt nanoparticles using hydrazine and citric acid. J. Nanotechnol. 2014,
(2014).
79. Hosein, H.-A., Strongin, D. R., Allen, M. & Douglas, T. Iron and cobalt oxide and
metallic nanoparticles prepared from ferritin. Langmuir 20, 10283–10287 (2004).
80. Storsæter, S., Tøtdal, B., Walmsley, J. C., Tanem, B. S. & Holmen, A.
Characterization of alumina-, silica-, and titania-supported cobalt Fischer-Tropsch
catalysts. J. Catal. 236, 139–152 (2005).
81. Okabe, K., Li, X., Wei, M. & Arakawa, H. Fischer-Tropsch synthesis over Co-
SiO2 catalysts prepared by the sol-gel method. Catal. Today 89, 431–438 (2004).
Page 97
84
82. Iglesia, E. Bimetallic Synergy in Cobalt Ruthenium Fischer-Tropsch Synthesis
Catalysts. J. Catal. 143, 345–368 (1993).
83. Matsuzaki, T., Takeuchi, K., Hanaoka, T., Arakawa, H. & Sugi, Y. Hydrogenation
of carbon monoxide over highly dispersed cobalt catalysts derived from cobalt(II)
acetate. Catal. Today 28, 251–259 (1996).
84. Girardon, J. S. et al. Cobalt dispersion, reducibility, and surface sites in promoted
silica-supported Fischer-Tropsch catalysts. J. Catal. 248, 143–157 (2007).
85. Ho, S. W. & Su, Y. S. Effects of Ethanol Impregnation on the Catalytic Properties
of Silica-Supported Cobalt Catalysts. J. Chinese Chem. Soc. 44, 591–596 (1997).
86. Thaib, A., Martin, G. A., Pinheiro, P., Schouler, M. C. & Gadelle, P. Formation of
carbon nanotubes from the carbon monoxide disproportionation reaction over
Co/Al<sub>2</sub>O<sub>3</sub> and
Co/SiO<sub>2</sub> catalysts. Catal. Letters 63, 135–141 (1999).
87. Lapidus, A. et al. Hydrocarbon synthesis from carbon monoxide and hydrogen on
impregnated cobalt catalysts Part I. Physico-chemical properties of 10%
cobalt/alumina and 10% cobalt/silica. Appl. Catal. 73, 65–83 (1991).
88. Takeuchi, K. et al. Vapor phase hydroformylation of ethene over Co/SiO2
promoted by noble metals: dynamic in situ diffuse reflectance FT-IR study of
surface species. Catal. Today 20, 423–436 (1994).
89. Bian, G. Z., Fujishita, N., Mochizuki, T., Ning, W. S. & Yamada, M.
Investigations on the structural changes of two Co/SiO2 catalysts by performing
Fischer-Tropsch synthesis. Appl. Catal. A Gen. 252, 251–260 (2003).
90. Gandia, L. M., Diaz, A. & Montes, M. Selectivity in the high-temperature
hydrogenation of acetone with silica-supported nickel and cobalt catalysts. Journal
of Catalysis 157, 461–471 (1995).
91. Sun, S., Tsubaki, N. & Fujimoto, K. The reaction performances and
characterization of Fischer-Tropsch synthesis Co/SiO2catalysts prepared from
mixed cobalt salts. Appl. Catal. A Gen. 202, 121–131 (2000).
92. Crisafulli, C., Scirè, S., Minicò, S. & Solarino, L. Ni – Ru bimetallic catalysts for
the CO 2 reforming of methane. Appl. Catal. 225, 1–9 (2002).
93. Li, X. K., Ji, W. J., Zhao, J., Wang, S. J. & Au, C. T. Ammonia decomposition
over Ru and Ni catalysts supported on fumed SiO 2, MCM-41, and SBA-15. J.
Catal. 236, 181–189 (2005).
94. Hoang-Van, C., Kachaya, Y., Teichner, S. J., Arnaud, Y. & Dalmon, J. A.
Characterization of nickel catalysts.dta by chemisorption techniques, x-ray
diffraction and magnetic measurements. Effects of support, precursor and
hydrogen pretreatment. Appl. Catal. 46, 281–296 (1989).
95. Swaan, H. M., Kroll, V. C. H., Martin, G. A. & Mirodatos, C. Deactivation of
supported nickel catalysts during the reforming of methane by carbon dioxide.
Page 98
85
Catal. Today 21, 571–578 (1994).
96. Kim, P. et al. Synthesis and characterization of mesoporous alumina as a catalyst
support for hydrodechlorination of 1,2-dichloropropane: Effect of catalyst
preparation method. Catal. Letters 89, 185–192 (2003).
97. Zhang, Y. & Smith, K. J. Carbon formation thresholds and catalyst deactivation
during CH4 decomposition on supported Co and Ni catalysts. Catal. Letters 95, 7–
12 (2004).
98. Van De Loosdrecht, J., Van Der Kraan, A. M., Van Dillen, A. J. & Geus, J. W.
Metal-support interaction: Titania-supported and silica-supported nickel catalysts.
J. Catal. 170, 217–226 (1997).
99. Ermakova, M. A., Ermakov, D. Y., Kuvshinov, G. G. & Plyasova, L. M. New
nickel catalysts for the formation of filamentous carbon in the reaction of methane
decomposition. J. Catal. 187, 77–84 (1999).
100. Kumbhar, P. S. Nickel supported on titania-silica. Preparation, characterisation and
activity for liquid phase hydrogenation of acetophenone. Appl. Catal. A, Gen. 96,
241–252 (1993).
101. Santhanam, N., Conforti, T. A., Spieker, W. & Regalbuto, J. R. Nature of metal
catalyst precursors adsorbed onto oxide supports. Catal. Today 21, 141–156
(1994).
102. Andrew Wong, John Tengco, Sonia Eskandari, John Regalbuto, J. M. Stabilization
of catalytic surfaces using bimetallic core-shell structure.
103. Cunha, D. S. & Cruz, G. M. Hydrogenation of benzene and toluene over Ir
particles supported on γ-Al2O3. Appl. Catal. A Gen. 236, 55–66 (2002).
104. Marzialetti, T., Oportus, M., Ruiz, D., Fierro, J. L. G. & Reyes, P. Enantioselective
hydrogenation of 1-phenyl-1,2-propanedione, ethyl pyruvate and acetophenone on
Ir/SiO2catalysts. Effect of iridium loading. Catal. Today 133–135, 711–719
(2008).
105. Cadu, A. & Andersson, P. G. Iridium catalysis: application of asymmetric
reductive hydrogenation. Dalt. Trans. 42, 14345 (2013).
106. Xu, Z., Mcnamara, N. D., Neumann, G. T., Schneider, W. F. & Hicks, J. C.
Catalytic hydrogenation of CO2 to formic acid with silica-tethered iridium
catalysts. ChemCatChem 5, 1769–1771 (2013).
107. Foger, K. & Anderson, J. R. Hydrocarbon reactions on supported iridium catalysts.
J. Catal. 59, 325–339 (1979).
108. Foger, K. & Anderson, J. R. Skeletal reactions of hydrocarbons over supported
iridium-gold catalysts. J. Catal. 64, 448–463 (1980).
109. Foger, K. Reactions of n-butane and neopentane on titania-supported iridium
catalysts. J. Catal. 78, 406–418 (1982).
Page 99
86
110. van Senden, J. G., van Broekhoven, E. H., Wreesman, C. T. J. & Ponec, V.
Selectivity of iridium catalysts in reactions of C6hydrocarbons: The role of surface
carbonaceous layers and metal particle size. J. Catal. 87, 468–477 (1984).
111. McVicker, G. B. et al. Selective ring opening of naphthenic molecules. J. Catal.
210, 137–148 (2002).
112. Lee, G. & Plummer, E. W. Interaction of hydrogen with the Ag(111) surface.
Phys. Rev. B 51, 7250–7261 (1995).
113. Montoya, A., Schlunke, A. & Haynes, B. S. Reaction of hydrogen with Ag(111):
Binding states, minimum energy paths, and kinetics. J. Phys. Chem. B 110, 17145–
17154 (2006).
114. Mohammad, A. B., Hwa Lim, K., Yudanov, I. V, Neyman, K. M. & Rösch, N. A
computational study of H2 dissociation on silver surfaces: the effect of oxygen in
the added row structure of Ag110. Phys. Chem. Chem. Phys. 9, 1247–1254 (2007).
115. Klacar, S. & Grönbeck, H. H2 dissociation over Ag/Al2O3: the first step in
hydrogen assisted selective catalytic reduction of NOx. Catal. Sci. Technol. 183–
190 (2012). doi:10.1039/c2cy20343j
116. Bond, G. C. Metal-catalysed reactions of hydrocarbons. Focus on Catalysts 2006,
(2006).
117. Ortiz-Soto, L. B., Monnier, J. R. & Amiridis, M. D. Structure-sensitivity of
propylene hydrogenation over cluster-derived bimetallic Pt-Au catalysts. Catal.
Letters 107, 13–17 (2006).
118. Argo, A. M. et al. Catalysis by oxide-supported clusters of iridium and rhodium:
Hydrogenation of ethene, propene, and toluene. J. Phys. Chem. B 110, 1775–1786
(2006).
119. Panjabi, G., Argo, A. M. & Gates, B. C. Supported iridium cluster catalysts for
propene hydrogenation: Identification by X-ray absorption spectra measured
during catalysis. Chem. - A Eur. J. 5, 2417–2423 (1999).
120. G. C. Bond, J. J. Phillipson, P. B. W. and J. M. W. Hydrogenation of olefins. Part
1.—Hydrogenation of ethylene, propylene and the n-butenes over alumina-
supported platinum and iridium. R. Scociety Chem. 60, 1847–1864 (1964).
121. Sylvain Hantzer; Michele S. Touvelle, both of Baton ROPge, L. J.-C. S.
SELECTIVE OPENING OF FIVE AND SIX MEMBERED RINGS. (1998).
122. Gault, F. G. Mechanisms of Skeletal Isomerization of Hydrocarbons on Metals.
Adv. Catal. 30, 1–95 (1981).
123. Nageswara Rao, R. et al. Selective ring opening of methylcyclopentane and
methylcyclohexane over iridium bifunctional catalysts supported on surface
modified γ-Al2O3, SiO2and ultra stable y zeolites. Catal. Letters 141, 1047–1055
(2011).
Page 100
87
124. Maire, G., Plouidy, G., Prudhomme, J. C. & Gault, F. G. The mechanisms of
hydrogenolysis and isomerization of hydrocarbons on metals. I. Hydrogenolysis of
cyclic hydrocarbons. J. Catal. 4, 556–569 (1965).
125. Chimentão, R. J., Valença, G. P., Medina, F. & Pérez-Ramírez, J. Hydrogenolysis
of methylcyclopentane over the bimetallic Ir-Au/γ-Al2O3catalysts. Appl. Surf. Sci.
253, 5888–5893 (2007).
126. Song, Y.-J., Monnier, J. R., Fanson, P. T. & Williams, C. T. Bimetallic Ag–
Ir/Al2O3 catalysts prepared by electroless deposition: Characterization and kinetic
evaluation. J. Catal. 315, 59–66 (2014).
127. Rodriguez, J. A., Truong, C. M. & Goodman, D. W. FT-IRAS studies of CO
adsorbed on Ag/Pt(111): anomalous behavior of vibrational cross-sections. Surf.
Sci. 271, (1992).
128. LahmerLynds. Infrared spectra of carbon monoxide chemisorbed on iridium and
ruthenium. Spectrochim. Acta 20, 1369–1372 (1964).
129. Rebelli, J., Rodriguez, A. A., Ma, S., Williams, C. T. & Monnier, J. R. Preparation
and characterization of silica-supported, group IB-Pd bimetallic catalysts prepared
by electroless deposition methods. Catal. Today 160, 170–178 (2011).